4.1. Competitiveness Analysis Using Data Envelopment Analysis (DEA) Method
This study measures the relative efficiency of various business actors in the Indonesian fashion sector using data envelopment analysis (DEA). DEA is a fractional programming model that can handle many inputs and outputs without clearly defining the relationship between them or deciding the importance of each variable beforehand [
44,
75,
76,
77]. The DEA sets the input and output levels for the evaluated units and calculates a scalar efficiency measure. The model used is CCR (Charnes, Cooper, Rhodes), assuming constant returns to scale and input orientation [
78]. This model assesses how DMUs (decision making units) can minimize inputs while maintaining a fixed output. Including capital, number of employees, monthly production, and operational duration, whereas the outputs are sales and profit. Based on the data analyzed using the Data Envelopment Analysis (DEA) method, 23 decision-making units (DMUs) were evaluated based on various performance indicators such as sales, profit, operational duration, number of employees, capital, production, price, exports, imports, and debt [
79]. DEA was used to assess how each business unit (DMU) in the Muslim fashion industry utilized inputs to generate outputs. The DEA results were used to understand the efficiency level of each DMU, determine benchmarks, and identify improvement strategies for efficient DMUs.
Appendix A presents detailed data for the 23 fashion industries.
The data for the 23 industries were processed using the RStudio software (R.4.5.1). The inputs and outputs were determined using RStudio. From the DEA results, the efficiency of the Muslim fashion industry was analyzed based on inputs and outputs.
Input: Input orientation is the number of employees, capital, production per month, price, exports, imports, and debt.
Output: The output orientation used is sales and profit.
Table 3 presents the Data Envelopment Analysis (DEA) for 23 decision-making units (DMUs) within the Muslim fashion industry in Jakarta [
74]. This study utilized two models, constant returns to scale (CRS) and variable returns to scale (VRS) [
75], which assess total technical efficiency and pure technical efficiency, respectively, while ignoring the scale of operations.
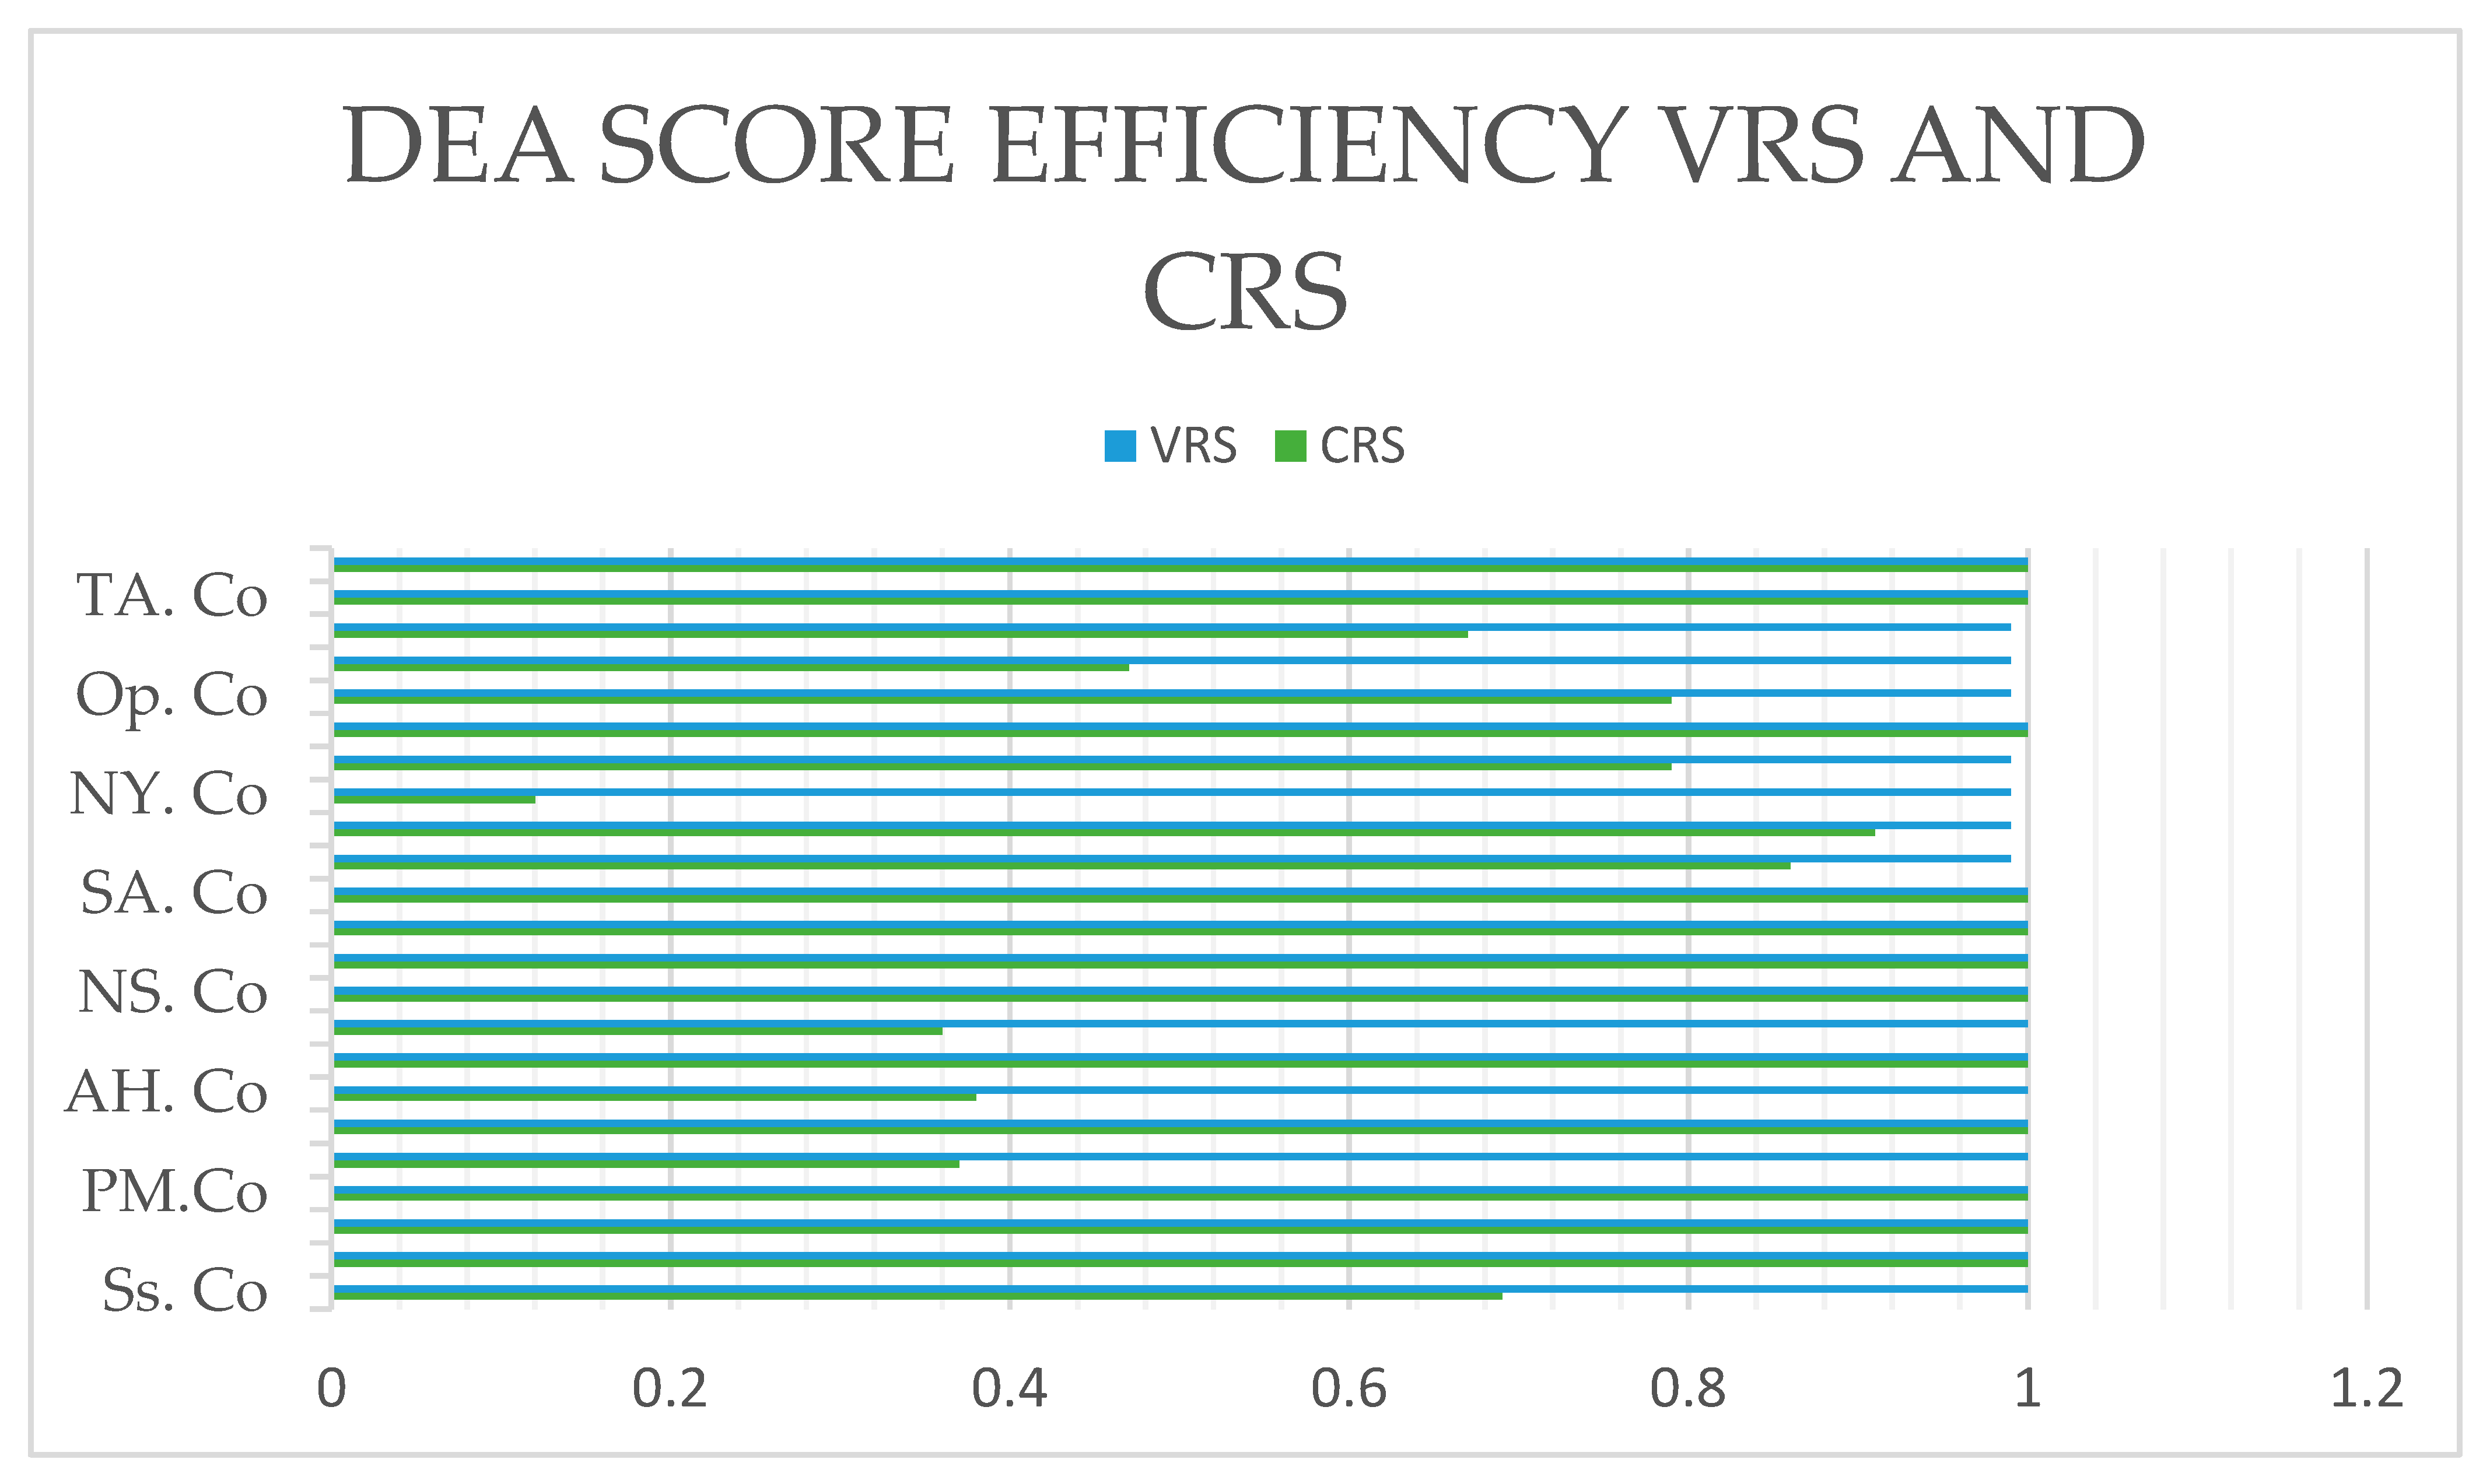
The data indicate that 13 DMUs (56.5%) attained peak efficiency (score = 1) in the VRS model, whereas only 10 DMUs (43.5%) were efficient in the CRS model. This suggests that certain industries possess significant technical efficiency; however, their operational scales have not yet reached optimal levels. The score disparity between CRS and VRS offers a valuable understanding of the inefficiency arising from company size rather than ineffective resource use.
The industries that achieved optimal efficiency in both models (CRS = 1 and VRS = 1) were LA. Co, JT. Co, PM. Co, LS. Co, NN. Co, FS. Co, and NS. Co. These DMUs act as internal standards for other industries because they can optimize resources such as capital, labor, and production capacity to enhance output in sales and profits.
Conversely, DMUs, such as NY. Co (CRS = 0.12; VRS = 0.99) indicate high technical efficiency. However, they are limited by their small operational scale, which prevents them from achieving overall efficiency. However, industries such as FS. Co (CRS = 0.36; VRS = 1) show efficiency in their technical framework but need to increase their operational size to produce a suitable output.
This finding highlights the importance of business growth strategies based on market expansion and improved production capacities. This CRS–VRS analysis also acts as a basis for classifying industries using efficiency enhancement approaches, either via internal reorganization or optimization of the operational scale.
The results of the calculation of the competitiveness of the Muslim fashion industry using Data Envelopment Analysis and processed by the RStudio analysis application are shown (
Table 4).
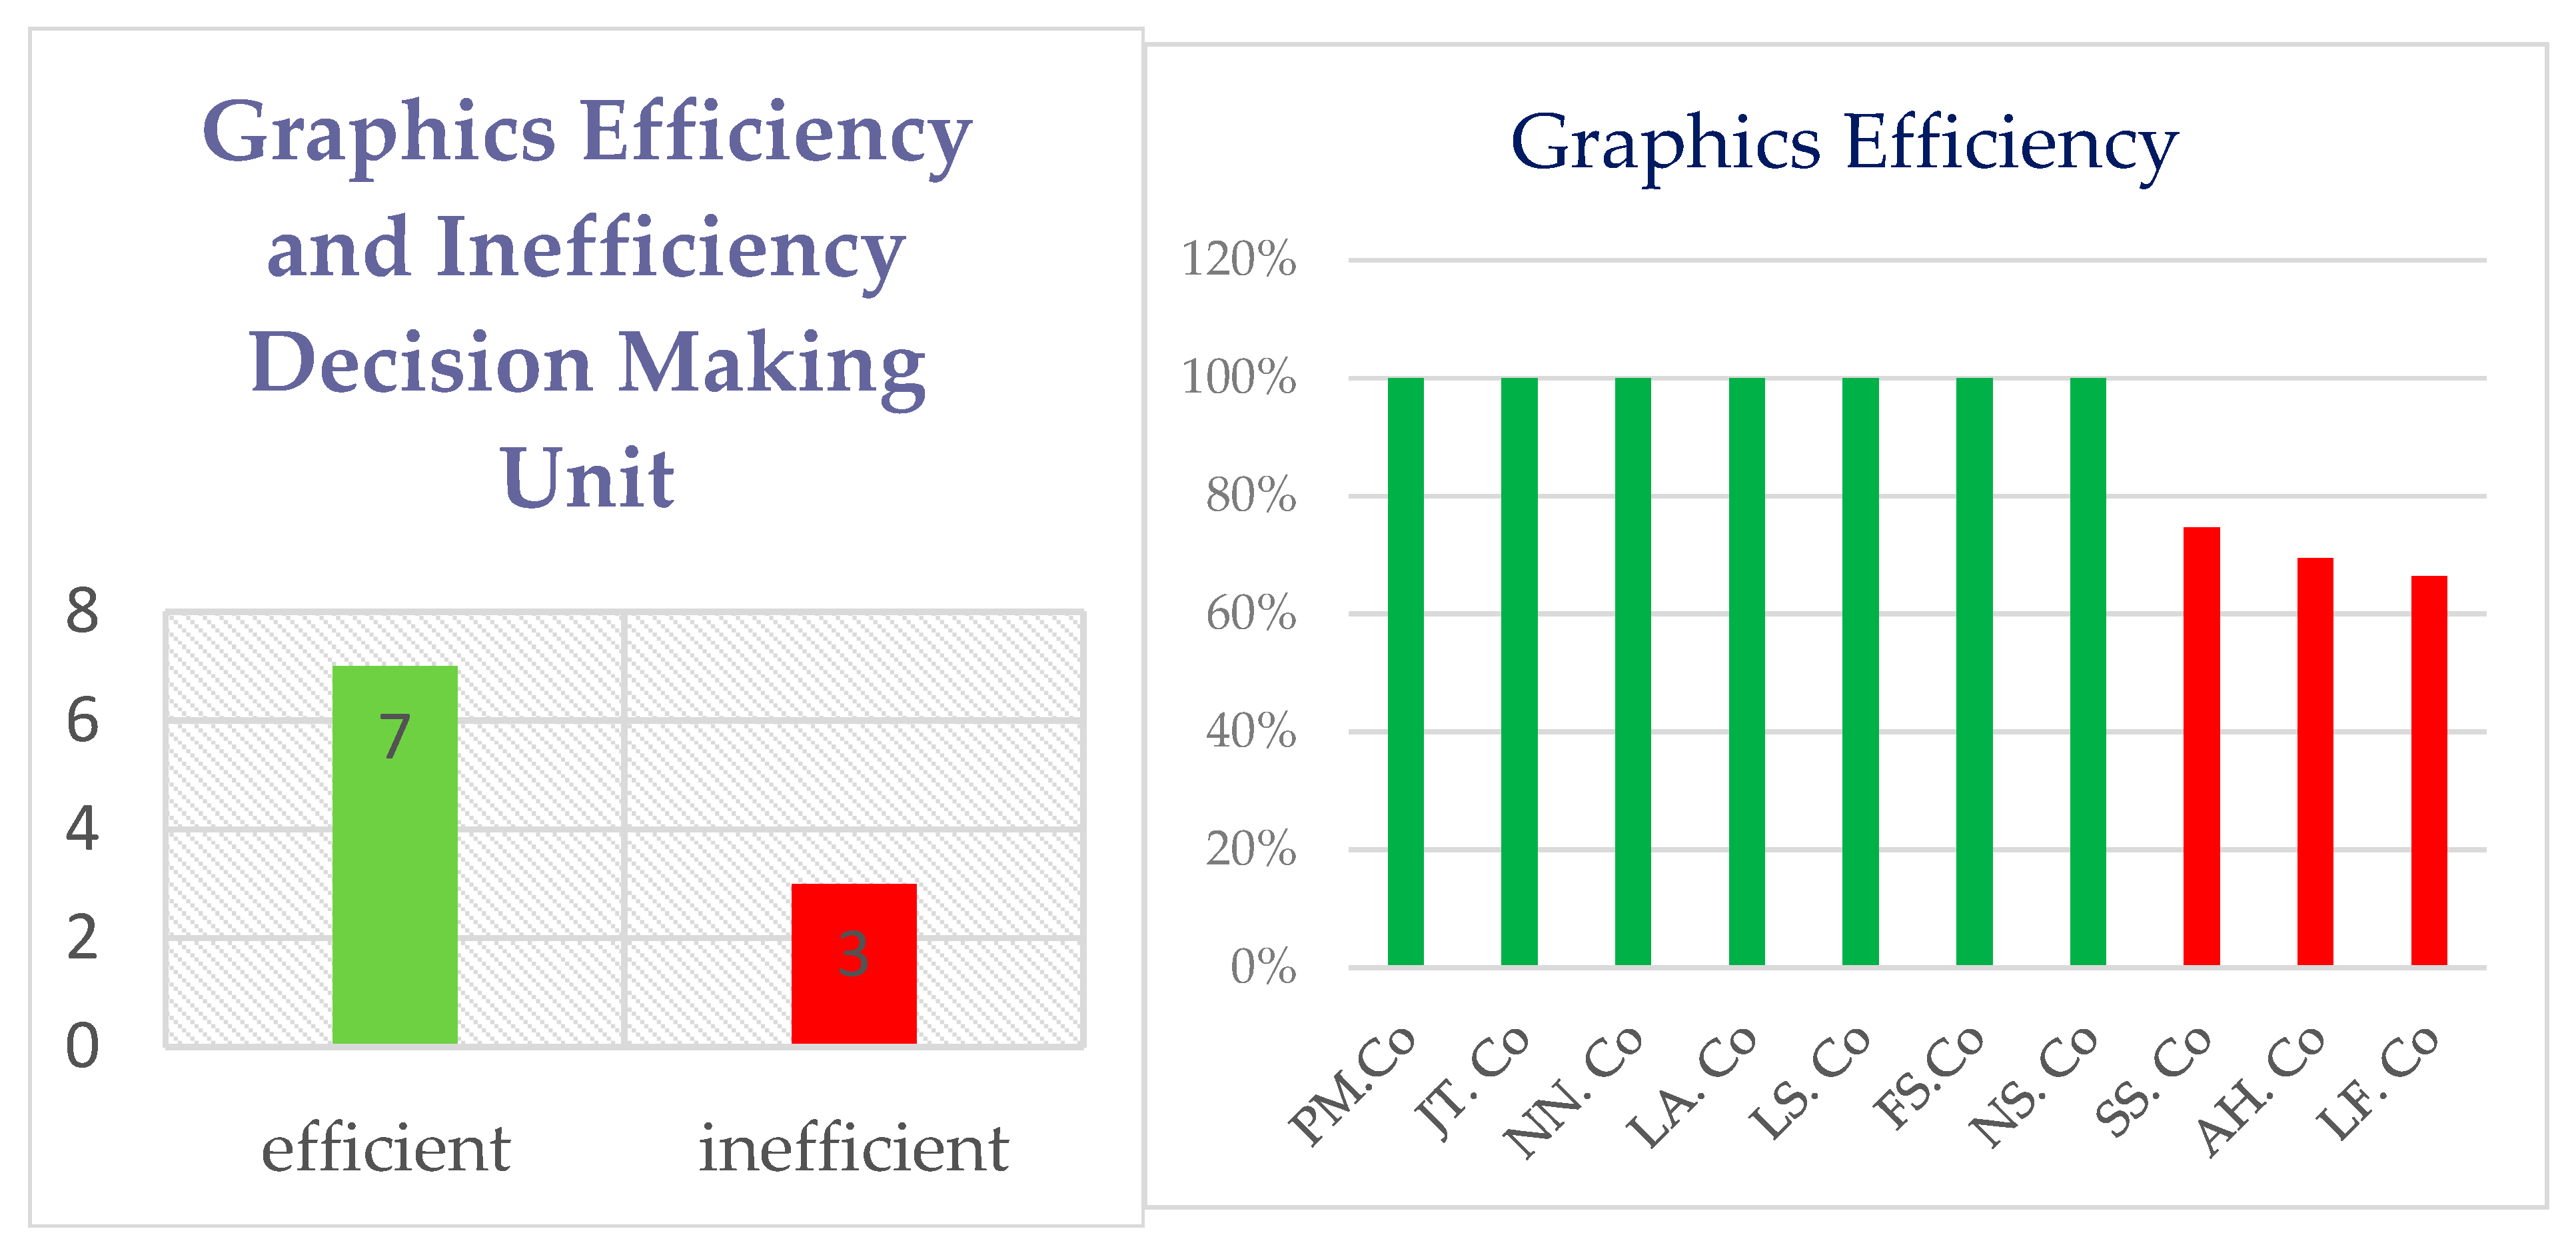
Data analysis using DEA shows that the 23 Muslim fashion industries have seven efficient DMUs with an efficiency score of =1 (100%), indicating that they can optimally manage inputs to produce outputs. The most efficient DMUs were LA. Co (100%), PM. Co (100%), JT. Co (100%), LS. Co (100%), NN. Co, FS. Co, and NS. Co. Three industries still have the potential to increase efficiency: SA. Co (74.65%), LF. Co (66.38%), and AH. Co (69.45%) (
Table 4).
Based on
Figure 3, the processing results in RStudio and efficiency scores were obtained from 21 fashion units analyzed, ranging from 0.66 to 1.00. Seven DMUs showed perfect efficiency (score = 1), indicating they optimally managed their resources. Meanwhile, the rest showed relative inefficiency and required strategic improvement. Of the ten Muslim fashion industries, seven achieved perfect efficiency, and three still have the potential to increase efficiency.
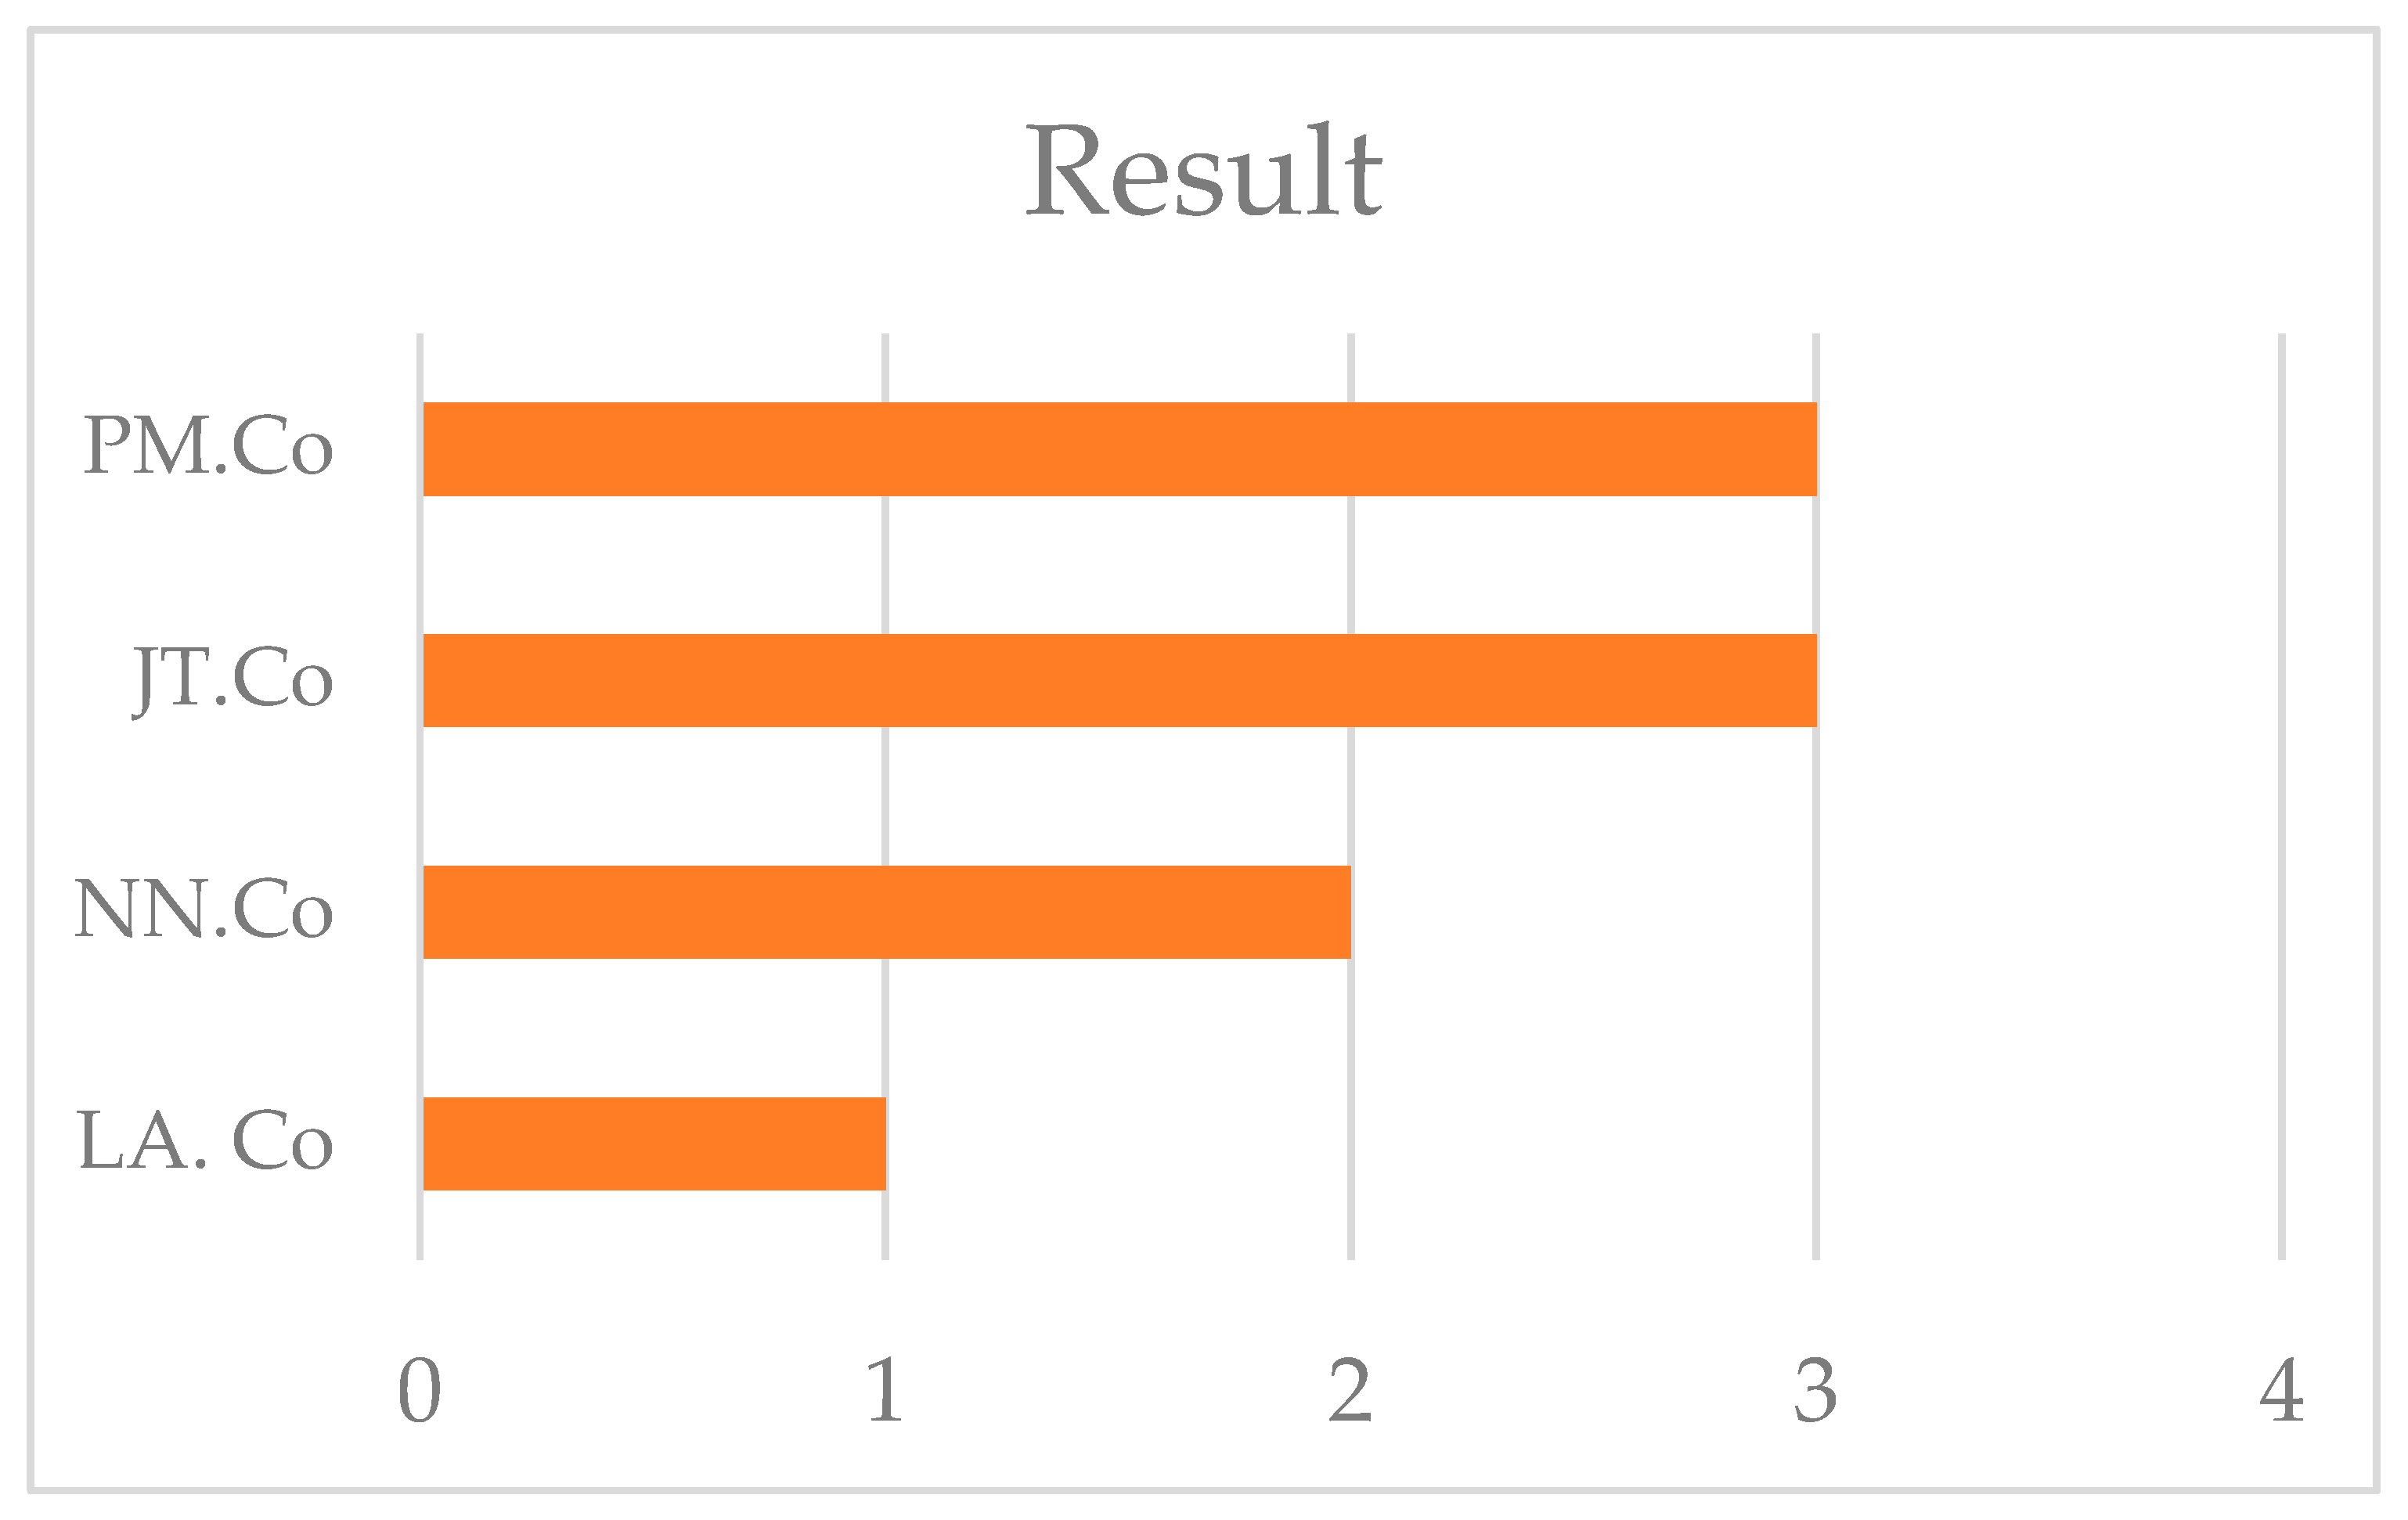
Based on
Figure 4, the top-performing industries are PM. Co and JT. Co, which are the two most efficient industries (the longest bars in the graph), followed by NN. Co and LA. Co. This indicates that they utilized their resources well to produce an optimal output.
Based on
Figure 5, in the context of technical efficiency, DMUs such as PM exist: Co, LA.Co, and JT.Co as frontiers mark an essential benchmark for other DMUs. DMUs with perfect efficiency can optimize resources and have effective production and distribution structures. The CRS model efficiency graph for DMUS showed that one-third of the units operated below the adequate standard of 0.7 to 0.9. The remaining units were evenly distributed below at the 0.7 level. This indicates an issue in resource management among the units with different industrial production standards. DEA provides insights into the relative effectiveness of each DMU, identifying low-operating units that may benefit from efficient standards. The DEA model quantitatively measures efficiency and evaluates collective learning in the fashion industry. By examining the efficient practices of frontier DMUs, other sectors can modify their input combinations, such as workers and capital size, to generate optimal output. This principle aligns with the results of DEA research in the automotive sector in the DEA 1 journal, where efficient DMUs serve as a strategic benchmark for other dealers.
The DEA efficiency score table shows that DMUs such as LF. Co and SA. Co and CL. Co levels remained sub-optimal. This can be observed in an unbalanced input structure relative to the output produced, such as high capital but low profits. Using the input orientation in the DEA model, the evaluation focused on cutting unproductive inputs while maintaining the output results. This is a valuable opportunity for the fashion industry to improve its performance by reconsidering the use of resources. For example, decision-making units with many staff members but low productivity can consider training employees or changing their production processes. Efficiency is not merely about cost savings, but about generating the same or greater value through more innovative and measurable methods. The efficiency bar chart highlights the differences between the DMUs, clearly visualizing each business’s relative position.
The distribution of the VRS model efficiency scores provides additional information that most DMUs have potential efficiency if their operational scales are optimal. The VRS model allows a more flexible understanding of scale efficiency, which is relevant in dynamic creative industries like fashion. Some DMUs that appear inefficient in the CRS model show better scores in the VRS model, indicating that suboptimal operational scale is the primary source of inefficiency. For example, a business unit with locally distinctive creative products, but small-scale production, may experience technical inefficiency in the CRS model but be efficient in the VRS model. This provides a basis for arguing that developing production capacity and market access is key to improving efficiency. According to the logic of systems thinking, efficiency results from the interaction between internal structure and external pressures. Therefore, policies for developing fashion SMEs should focus on accelerating the scale and improving cost structure efficiency.
The DEA findings reveal three distinct groups among the 23 Muslim fashion industry participants [
80]:
High Efficiency (100%): This group comprises seven industries that optimize resources and maximize outputs. These industries exhibit efficient capital management, digital marketing strategies, and strong supply chain collaborations. Examples: PM. Co, JT. Co, LA. Co, NN. Co, FS. Co, NS. Co, and LS. Co. Key Factors for Efficiency: Digital transformation and e-commerce utilization, strong supplier relationships and cost control, strategic branding, and effective marketing campaigns.
Moderate Efficiency (50–80%): This group includes three industries with room for improvement, showing potential in specific areas. Examples include SA. Co, LF. Co, and AH. Co. Areas for improvement include capital distribution and resource utilization, extending market reach through digital channels, supply chain adaptability, and cost-cutting measures.
Low Efficiency (<50%): The remaining 13 industries face significant operational efficiency challenges, supply chain optimization, and strategic differentiation. The following challenges were identified from the interviews: lack of financial management and investment in technology, high dependency on imported raw materials, limited market differentiation, and weak brand positioning.
For inefficient industries to improve their competitiveness, several steps can be taken:
Resource Optimization: This is performed by adjusting the number of workers according to the required production capacity and reducing unnecessary items in the supply and distribution chain.
Cost and Capital Efficiency: This is completed by managing capital more effectively by utilizing technological developments for production automation and improving the efficiency of raw material use.
Marketing Strategy Improvement: This is completed by providing a competitive pricing strategy that considers consumers’ purchasing power and uses digital platforms to expand the market at home and abroad.
Collaboration in Supply Chain: Collaboration with raw material suppliers and distributors to improve logistics efficiency [
81].
Utilizing a decision support system (DSS) for data-driven supply chain decision making [
82].
Product Diversification and Exports: Industry players can boost exports to increase market share. They can also innovate products to keep up with global fashion trends and to remain competitive.
DEA is useful for assessing an industry’s performance by using data with multiple inputs and outputs. As most DMUs have more control over inputs, such as production capacity, human resources, and capital, than outputs, the latter being primarily controlled by the market, input-oriented models are appropriate for the fashion sector. Relative efficiency ratio-based measurements provide a fair platform to compare participants operating in the same industry. Additionally, combining the CRS and VRS models offers a deeper evaluation of the performance. The CRS model examines the overall technical efficiency.
By contrast, the VRS model focuses on purity and ignores the operational scale. This mix is crucial in fields driven by innovation, such as fashion. This method fits well with the DEA in the fashion industry, which also considers the capacity and market.
Reach differences. The results of the DEA indicate that some industries have reached optimal efficiency, whereas others still have room for improvement. This combination is vital in sectors that emphasize innovation, such as fashion. With appropriate strategies such as using resources wisely, reducing costs, improving marketing, and working together in the supply chain, these industries can become more competitive and boost their profits. Research in the fashion industry has often linked efficiency with supply chain management factors and design innovation [
12].
4.2. Competitiveness Analysis Using Porter
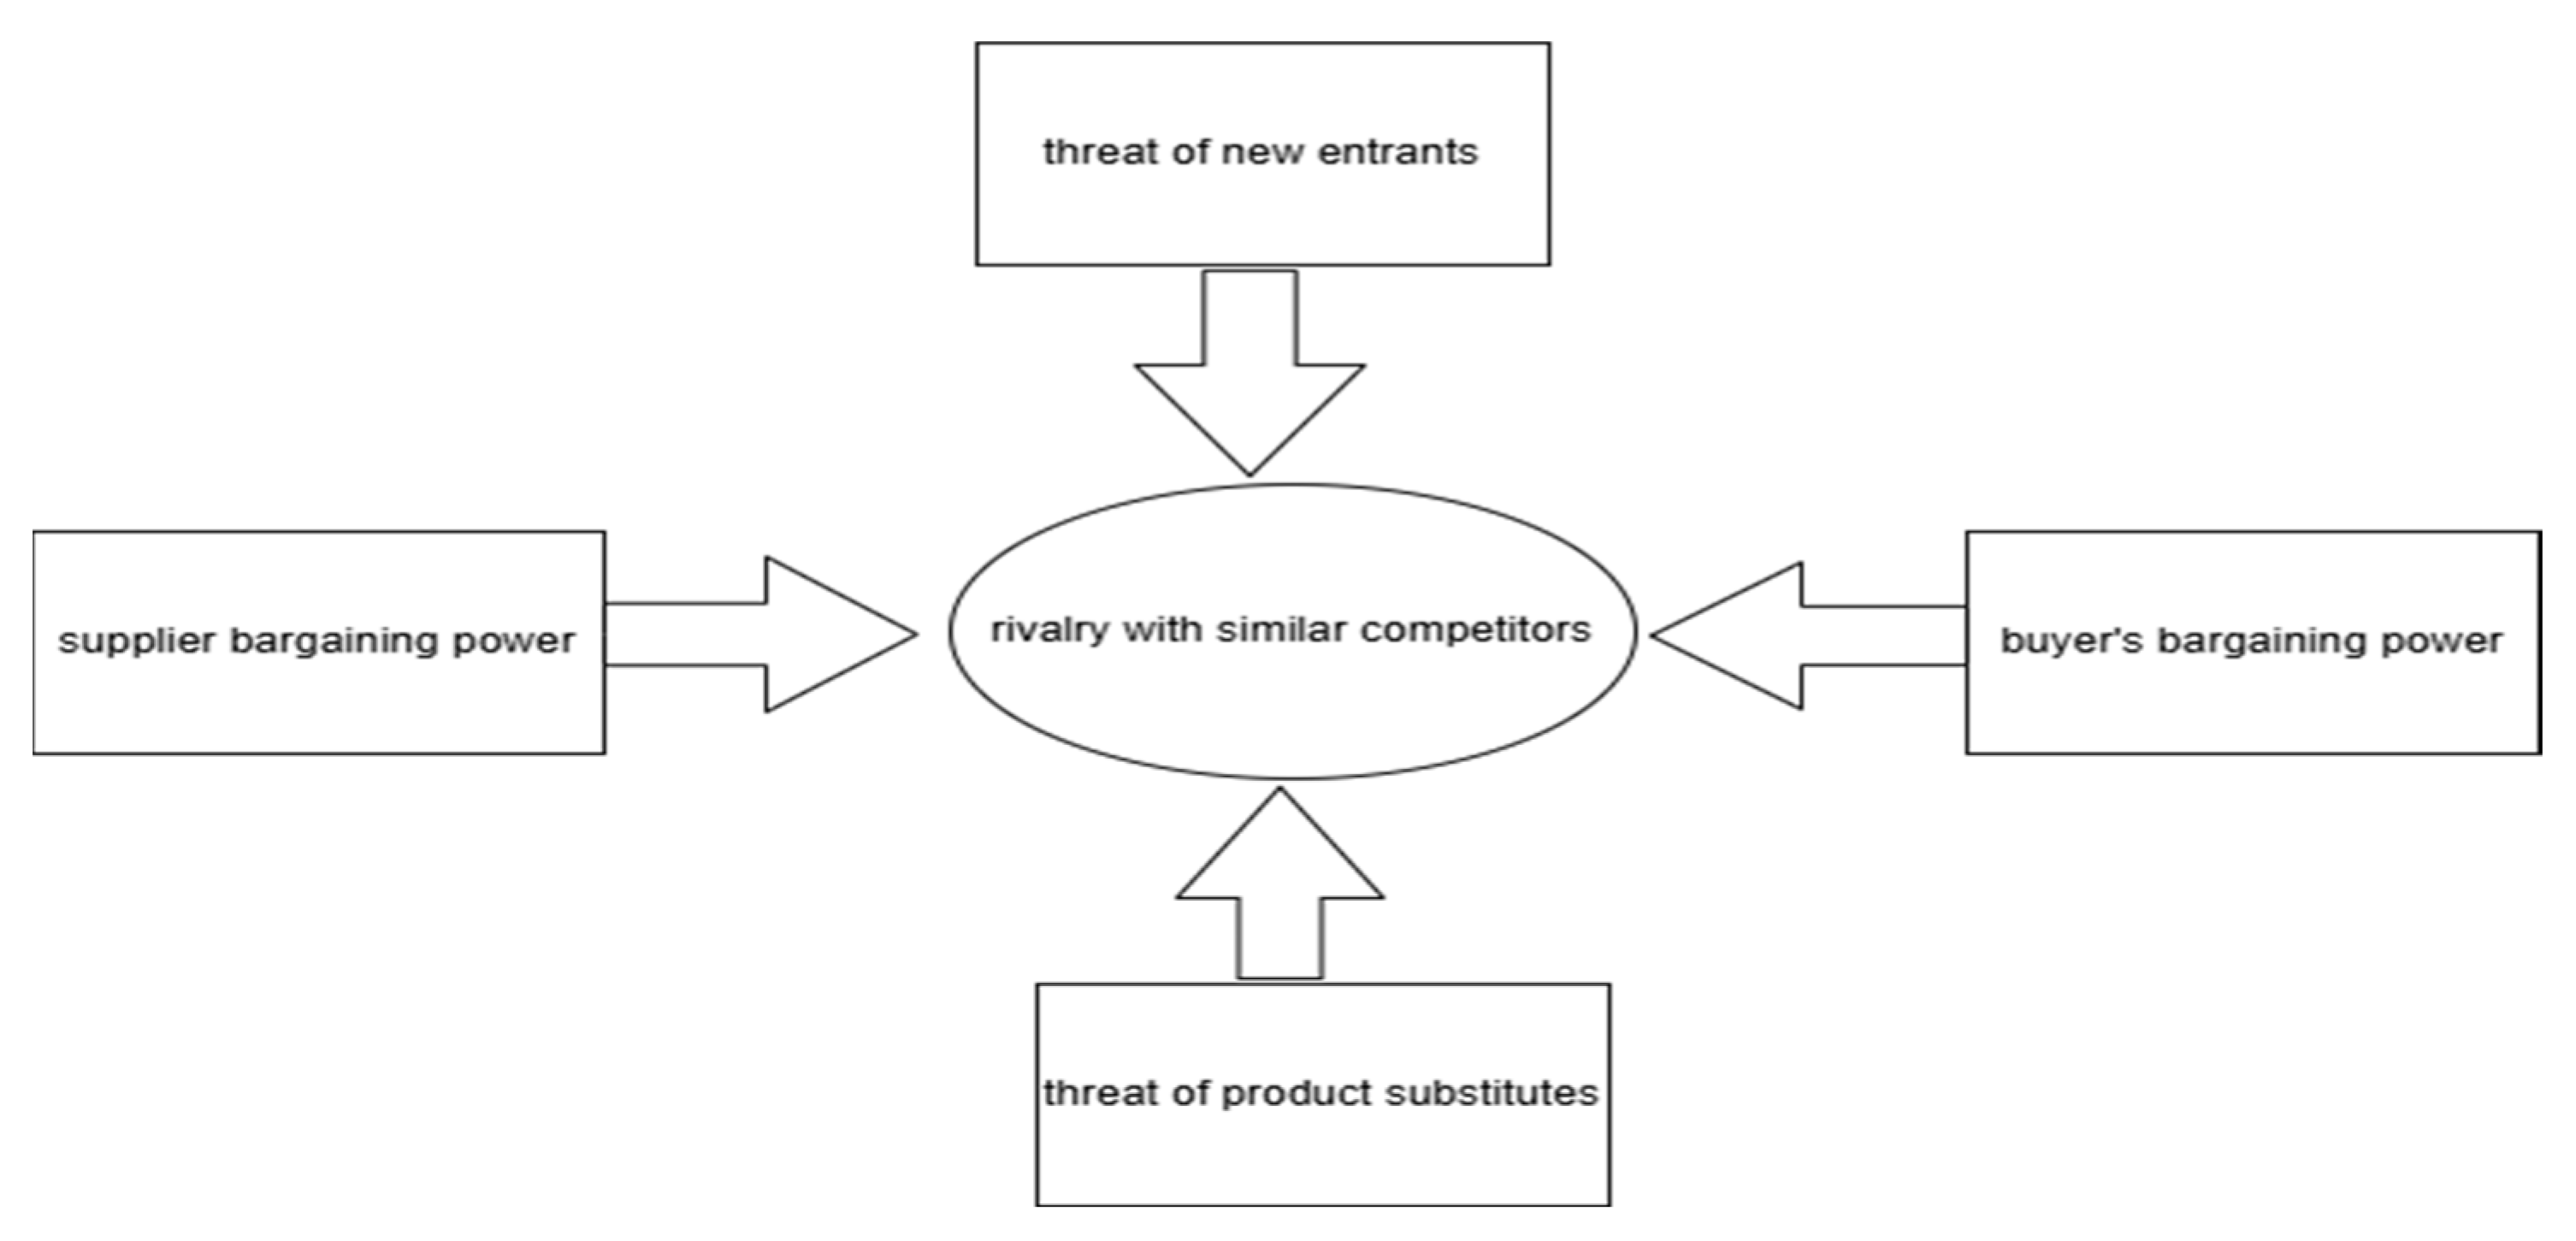
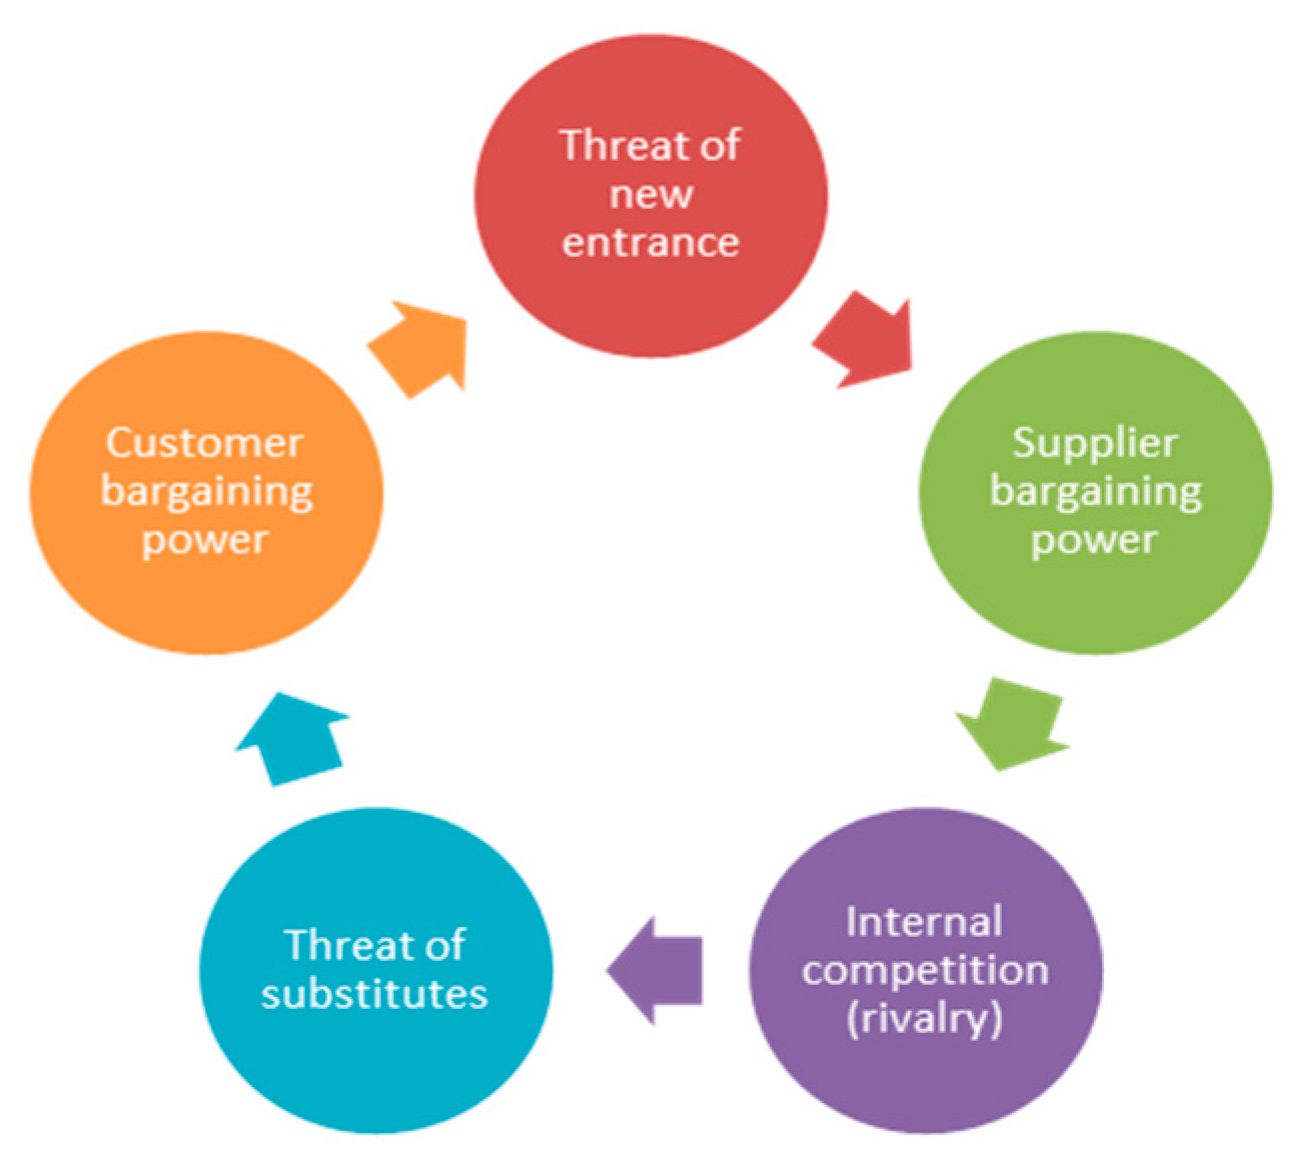
Industries can use Porter’s Five-Forces Model (
Figure 6), a business analysis tool, to analyze an industry’s competitive environment [
83]. This model was based on five forces. These forces are the main factors that determine the strengths and weaknesses of the industry and influence profit potential.
Porter’s Five Forces Model assesses competitive pressures from the outside. This model includes five key aspects: (1) threat of new entrants, (2) threat of substitute goods, (3) suppliers’ bargaining power, (4) buyers’ bargaining power, and (5) competition intensity within the industry. Every dimension was assigned a score between 1 and 5, where 1 indicated minimal pressure and 5 denoted very high pressure. This evaluation was not based on DEA outcomes to prevent bias or circular reasoning. Instead, the scores were established using semi-structured interviews with five experts (the Muslim fashion industry association, enterprises, government, and academic institutions).
Delphi questionnaires were created based on the qualitative insights obtained, and the same experts participated in the two-round Delphi process [
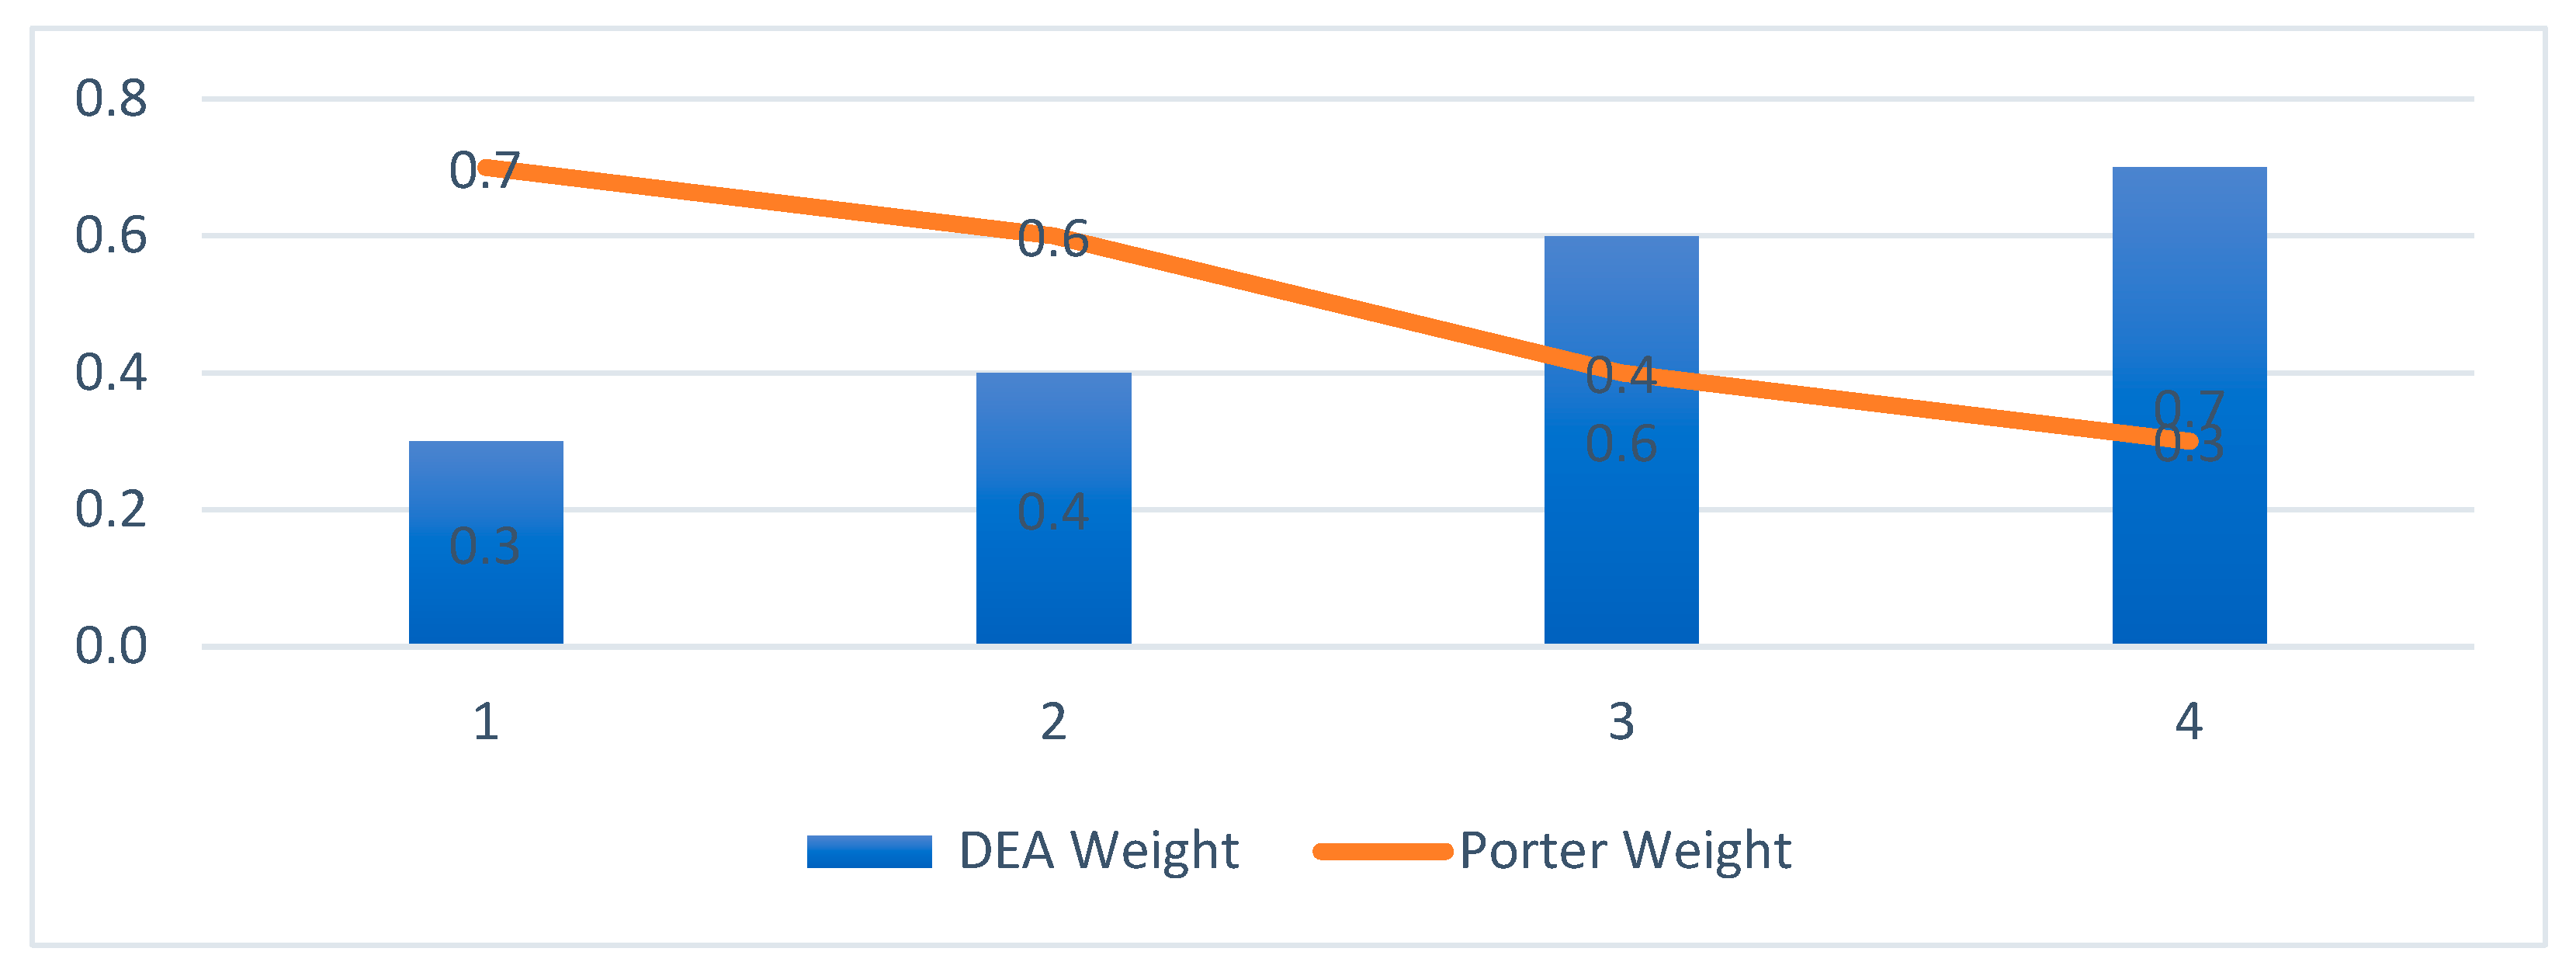
59]. Each expert assigned each force for each company (DMU) a numerical score ranging from 1 to 5 in the first round. The experts were allowed to update their scores in the second round after receiving feedback on group averages and standard deviations. Porter’s scores were determined through a Delphi study involving five expert panels selected using the following criteria: (a) ≥10 years of experience in the industry, (b) leadership in Muslim fashion associations, (c) government policy involvement, and (d) academic expertise in SCM, textiles, and fashion. Convergence criteria (standard deviation < 0.7 across responses) were used to assess the consensus. The final WECS formula was then subjected to sensitivity analysis to test various weighting scenarios for α (DEA) and β (Porter). As the results were more stable and interpretable across industries, the combination of α = 0.6 and β = 0.4 was chosen. They are combined methodologically in the next stage (
Section 4.3), employing the WECS method, thus eliminating the bias caused by the interdependence of variables.
The analytical procedure used a score range of 1–5, with extremely low to very high scores. Scoring was performed using a data-driven evaluation method that combined interviews with industry experts, market data, and the quantitative DEA results.
- 1.
Industry Rivalry
Rivalry is fierce, and there are many rival industries, particularly those that have been in business for a long time. Some consumers patronize companies in this sector because of their brand loyalty. An analysis of competition with similar competitors is presented in
Table 5.
Table 5 shows that competition in the Muslim fashion industry in Indonesia is intense. The average score is 3.53 across five key indicators. This suggests that industries must keep improving their operations to stay relevant. Integrated supply chain strategies and effective digital marketing are essential for this effort [
86]. Efficient cost structures are necessary for leading industries like JT. Co and LS. Co.
The DEA results and internal competition scores link show highly efficient industries such as PM. Co and JT. Co. also managed cost structures and used technology well. Conversely, industries, such as SA. Co, LF. Co, and AH. Co, which exhibit low efficiency, are often burdened by high-cost structures and cannot adapt to digitalization.
- 2.
Threat of New Entrants
The risk for new competitors entering the market is low and requires little attention. As new players enter the market, the Muslim fashion sector has become more competitive. However, the challenges and barriers faced by newcomers in the Muslim fashion sector, which competitors must consider, threaten this industry. An analysis of the threats posed by the new entrants is presented in
Table 6.
Table 6 displays an average rating of 4.00, indicating that the threat from new entrants is perceived as low. The market segment is beautiful for new players. However, the company has problems such as high capital requirements, strong customer loyalty, and product differentiation, among the main characteristics of well-established competitors that make it challenging to obtain a competitive edge or survive.
This presents a tactical opportunity for existing industries to strengthen their market influence by promoting innovation and collaboration between upstream and downstream partners. Suggested strategies include leveraging local resources to lower production expenses and broadening distribution channels to increase reach.
- 3.
Threat of Substitute Products
Existing industry must take into account the threat of alternative products.
Muslim fashion industry. They must be able to do the following:
- (1)
Design Innovation: Continuously improve innovation in design to create unique, fashionable, trend-following products.
- (2)
Premium Quality: Focus on the quality of materials and stitching to add value to the product.
- (3)
Strong Branding: Build a strong brand.
- (4)
Personal Branding: Engage influencers or create engaging content.
- (5)
E-commerce: Leverage e-commerce platforms to reach a broader market.
- (6)
Collaboration: Collaborate with other designers, influencers, or brands to create unique products that appeal to consumers [
81].
- (7)
Competitive Pricing: Offer competitive pricing without sacrificing quality
In
Table 7, the danger from substitute products is clear, with an average score of 3.8, suggesting that the company encounters considerable competition from its rival products. In the business world, factors such as design creativity, product quality, teamwork methods, and engagement in online commerce are crucial for maintaining a competitive edge. Industries that produce products with unique features and compelling branding stories are less susceptible to replacement threats. Ref. [
87] shared this opinion. According to these studies, brand loyalty is created by emotional relationships with customers. Green design using non-renewable materials is well-founded, as is a company’s brand image.
- 4.
Bargaining Power of Suppliers
Supplier Power: In this situation, salient considerations are product quality and the cost of extending the product.
Table 8: Supplier bargaining power analysis is given in the table below.
Many Alternatives: The more product options there are, the more power buyers have. Consumers can choose another brand if they are unhappy with the product or its prices.
Easily Accessible Information: Information on products, prices, and consumer reviews can be found online. This allows consumers to compare products before deciding to buy them.
Price Sensitivity: What is the purchasing company’s sensitivity to fluctuations in input.
Table 8 shows the average rating of 3.73. This indicates that suppliers have strong bargaining power, particularly regarding the quality and price of the raw materials. The industry’s reliance on imported raw materials is a significant weakness. This calls for strategic actions such as replacing imports or developing local supply chains. Possible strategies include building lasting partnerships with local suppliers, using technology to improve supply chain efficiency, and expanding the sources of raw materials to reduce dependence on a single supplier. This will stabilize production costs and boost competitiveness through improved logistics efficiency.
- 5.
Bargaining Power of Buyers
Every customer selects the goods and services that offer the highest quality at a reasonable cost. Customers will be happy and continue choosing the product if the business can satisfy them by providing reasonably priced, high-quality goods. Consumers of Muslim fashion brands are typically loyal to them. However, given the competition in this market, it may be worthwhile to provide a low price for an additional business.
Table 9 presents the analysis of buyer bargaining power.
- (1)
Numerous Options: The consumers’ bargaining power increases with the number of options. Customers who are happy with the quality or pricing may quickly move to a different brand.
- (2)
Easily Accessible Information: Information about products, prices, and consumers.
- (3)
Reviews are available online. This allows consumers to compare products before deciding to buy them.
- (4)
Price Sensitivity: Muslim fashion consumers are generally price sensitive, especially for necessities.
- (5)
Sustainability: “Everything we do, from the production of our clothes to the efforts we undertake to safeguard the environment, is woven with sustainability.” The concept of “sustainability” to the company’s “long history of caring” for the environment (we ensure compliance with water quality standards and maintain a restricted substances list for all contracted manufacturing facilities), apparel workers (through the company’s code of conduct related to labor contracting), and women (by introducing the first blue jeans for women) [
88,
89].
Based on the information in
Table 9, an average score of 3.67 indicates that buyers possess high bargaining power. Players in an industry are compelled to innovate and ensure consistent product quality through the availability of differentiated alternatives, access to information, and price sensitivity.
Correspondingly, the industry should focus on digital marketing concepts, enhancing sustainability themes, and improving the customer experience. Using sustainability principles, such as eco-friendly products and ethical business practices, is increasingly essential for differentiating the market and establishing consumer loyalty amid global competition.
DEA and Porter’s elements offer the opportunity to build a better model for assessing competitiveness. This model includes the technical and structural demands of the industry. This is imperative for a rapid universe of Muslim fashion. It provides cost effectiveness, poor world market trends, fashion, and the Internet revolution. The integration framework of the DEA-Porter model is discussed in the next section. The framework also defines an individual business entity’s competitive stance. It also guides the formulation of precise and sustainable strategies to boost competitiveness.
