Abstract
Background: Rural fires, worsened by climate factors such as drought, biomass buildup, and ignition sources, threaten sustainability. Recovering residual biomass (RB) presents a promising way to lower fire risk by reducing fuel loads and generating renewable energy; however, logistical costs in the RB supply chain—due to poor stakeholder coordination—limit its feasibility. App-based models can help solve these issues by improving information sharing, but their economic viability remains largely unexplored. This study suggests that such models work well when large amounts of biomass are involved and moisture content is low. Still, they might need external incentives for widespread use and fire risk reduction. Methods: The study modeled recovery scenarios by comparing costs (harvesting, retrieval, transport, and pre-processing) with biomass market value, using expert inputs and sensitivity analysis on variables like fuel prices and wages. Results: The economic feasibility is possible for large volumes (e.g., 10-ton loads) with low moisture (<30%), allowing transportation distances up to 459 km; however, small-scale or high-moisture situations often are not viable without support. Conclusions: App-based models need external support, like subsidies, to overcome owner and RB challenges, ensuring effective fire mitigation and sustainability benefits.
1. Introduction
Fire occurrence is a phenomenon that can threaten sustainable development, particularly in forestry ecosystems [1,2], posing significant sustainability concerns. In economic terms, fire suppression accounts for around 10% of fire episode costs, with the remaining 90% comprising indirect costs (e.g., evacuations, population losses, health concerns) [3]. In the environmental domain, fires are responsible for gas emissions, decreasing air quality [4], water quality [5], or soil erosion [6]. Regarding the social pillar, lives lost [7], homes lost, or physical/psychological health harms [8] may be noted.
Wildfire occurrences impact many countries, including Australia, the United States [9], Canada [10], Spain, and Portugal [11]. Regarding the last government, it has suffered severe consequences from these fires; for example, in 2017, more than 0.5 million hectares were burned [5], over 120 people lost their lives [12], and costs reached 1.7 billion euros [12]. In 2022, a new fire season caused 110,097 hectares to burn across 10,390 fires. During this season, 28% of rural fires were caused by arson, and 19% resulted from burning agroforestry leftovers [13]. Although many fires are linked to criminal acts, a large portion originate from neglectful burning of agroforestry leftovers [14,15]. Three conditions are necessary for fire spread: ignition sources, favorable climate, and fuel buildup [11]. Climate change, primarily driven by CO2 emissions, has increased the vulnerability of regions to fires [7], highlighting the need for updated fire management policies [16]. Land abandonment [17], often caused by rural exodus among young people and aging populations, has led to higher fuel loads.
In this landscape, aiming to mitigate the conditions leading to the proliferation of wildfires, a solution emerges: recovering agroforestry leftovers (residual biomass). This approach will reduce fuel buildup, decrease the need for burning, and contribute to an increase in renewable energy, thereby lowering CO2 emissions [18,19]. Some authors suggest that exploiting residual biomass can help meet carbon emission targets [20]. Despite seeming promising, recovering residual biomass (leftovers) faces significant challenges due to logistical costs associated with its supply chain, known as the Residual Biomass Supply Chain (RBSC) [21]. Issues such as seasonality [22], lack of information and coordination among stakeholders [23], and decentralized decision-making at each stage [24] are common challenges in RBSC.
Additionally, biomass characteristics like high inert or moisture content complicate processing; however, converting it into pellets or briquettes can lower logistical costs [25,26], highlighting the complexity of decision-making processes. Despite these challenges, residual biomass from agroforestry remains very promising. In agriculture, Florindo et al. [27] studied vineyard pruning recovery, showing its high potential. In Portugal, this is especially important, as vineyards cover a large area [28]. In forestry, Malico and Gonçalves [29] noted that eucalyptus leftovers, such as tops, branches, or stumps, could be utilized for energy. Biomass energy conversion involves two main processes: biochemical/biological and thermochemical [24], both of which are promising options for producing heat and electricity [30]. Across Europe, the European Union has expressed concerns about energy independence [31]. Countries such as Romania, Poland, Hungary, and the Czech Republic utilize biomass energy, demonstrating that Central Europe can produce pre-treated biomass or biofuels at competitive prices [32]. An example of biomass recovery is Czechia, where biomass is one of the top renewable energy sources [33], used to generate energy locally and for export to Europe [34]. In Slovakia, residual biomass energy makes up 10% of the country’s total energy consumption [31].
The economic viability of residual biomass recovery has already been examined in the literature. For example, Carmo-Calado et al. [35] evaluated the feasibility of recovering almond shells and husks through gasification, concluding that it is viable. However, the costs of logistical operations, such as transportation, were not assessed. Regarding logistical approaches, some studies design the supply chain and analyze its economic behavior, concluding that transportation costs are the most significant factor [36]. The viability of recovering residual biomass via traditional burning is well established in the literature [37]. In Portugal, the economic feasibility of using lignocellulosic residual biomass from corn stover and eucalyptus has been studied [38].
Existing solutions for tackling these challenges include optimizing the RBSC through mathematical programming models aimed at reducing costs and increasing efficiency [39,40,41], as well as digital platforms that utilize advanced tools for better supply chain management [42]. Additionally, conceptual app-based models have been proposed to enhance stakeholder connections and information sharing [43,44]. However, these studies have significant limitations: many fail to account for comprehensive logistical costs, such as transportation and processing in real-world scenarios [35,36]; they often concentrate on specific biomass types or regions without addressing broader stakeholder coordination issues [37,38]; and there is a lack of detailed economic viability evaluations for app-based models, especially in contexts like Portugal where private forest ownership and economic incentives play a major role [45]. This research addresses these gaps by simulating multiple RB recovery scenarios based on literature, websites, and expert insights, comparing recovery costs with biomass valorization to assess economic impacts. Using this approach, we evaluate whether app-based models are financially viable on their own or need external incentives to operate effectively, thereby supporting RB recovery, fire risk reduction, and sustainable energy use.
2. Materials and Methods
2.1. RBSC Framework and App-Based Models
Regarding the RBSC functioning, various approaches are discussed in the literature; some works focus on biomass production, while others view it as residual biomass recovery products that reach end consumers. In this study, residual biomass recovery involves three main stages: harvesting/collecting, transporting, and final consumer delivery [23]. During the harvesting/collecting stage, three steps are identified: cutting, separation, and loading. Between the second and third steps, temporary storage may occur [43]. The final consumer can be anyone who receives biomass, such as the pellet industry or a biorefinery. In the biomass flow, some intermediate storage may also take place [23]. This stage can occur multiple times in a loop. A summary of the RBSC model is shown in Figure 1.
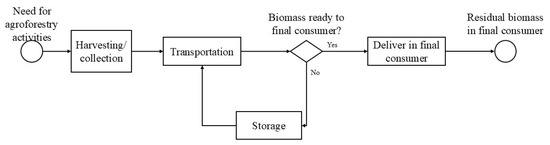
Figure 1.
Model of RBSC.
Regarding the actors in the chain, three profiles can be identified: producer/landowner, who refers to individuals who have agroforestry leftovers (residual biomass). The second actor in RBSC is the logger, responsible for wood cutting, which in this work will be called a service provider, and may handle not only cutting but also transportation. To complete the chain, the last actor, the final consumer, receives the residual biomass (leftovers) [46].
As mentioned earlier, there are clear shortcomings in the exchange of information among stakeholders in the RBSC. To address this, application-based models, such as a web application, are designed to bridge this gap by linking the various stakeholders. The main purpose of this application is to enable producers and landowners to communicate their service needs—such as biomass collection or land clearing—so that intermediaries can see and respond to these needs. Therefore, these models create a marketplace of opportunities where some individuals require services and others offer them. Since these services must be paid for and producers or owners are primarily motivated by economic factors, this study will assess whether recovering residual biomass is financially viable enough to cover the recovery costs.
2.2. Methodological Approach: Values and Assumptions
To determine if app-based models are economically feasible, this study develops different recovery scenarios to evaluate their viability. Nunes et al. [47] identified three activities needed by forestry operators to recover biomass: cutting, retrieval, and transportation with loading/unloading operations. However, in the case of residual biomass, all three tasks may not be necessary. Therefore, we simulated three scenarios that could occur during the recovery of these resources and will evaluate the economic feasibility of each. The first scenario involves leftovers that only require transportation. The second involves biomass that has already been collected but is not at the roadside, requiring retrieval before transportation. These two scenarios cover all leftovers resulting from agroforestry activities, such as vineyard pruning or Eucalyptus abate. In these cases, cutting costs are considered €0 because the activities that generated this biomass would occur regardless of recovery. The third scenario includes leftovers that need cutting, retrieval, and transportation, such as forestry fuel loads that are not utilized and pose increased fire risk. Below, in Figure 2, are the three alternative paths for residual biomass recovery.
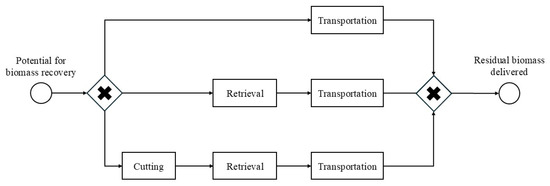
Figure 2.
Summary of the three alternative paths for residual biomass recovery.
Regarding cost quantification, this topic remains relatively underexplored in the literature. Nunes et al. [47] provide a table with costs for these three operations; however, the values were estimated in 2021, which may differ from current costs. Raimondi et al. [48] found that harvesting costs, including roadside disposal, amount to €40 per ton, with transportation over a 50 km distance costing €10.4 per ton. Angnes et al. [49] examined the feasibility of recovering eucalyptus stumps, outlining a four-stage process that includes stump removal, bucket handling, processing (chipping), and transportation. Due to the specific nature of these tasks and the differences in activities involved in this study, only the processing activity values will be considered. The fuel and time consumption for the processing operations are shown in Table 1.

Table 1.
Processing recovery costs, fuel consumption, and time by individual operation, adapted from [49].
The pre-processing cost of $6.13 per ton is calculated as follows: fuel consumption cost (4 L/ton × $1.44/L = $5.76/ton) + labor cost (0.05 h/ton × $5/h = $0.25/ton) + a conservative estimate for equipment depreciation (~$0.12/ton, based on typical chipping machinery depreciation rates of $1–3 per ton in biomass processing depots, adjusted for small-scale operations). Energy consumption mainly reflects the fuel cost (diesel for machinery), while depreciation covers the capital costs of equipment like chippers (annualized over usage, e.g., machine cost $10,000–$50,000 depreciated over 5–10 years at 100–500 tons/year throughput). This total excludes site-specific variations, which are addressed in the sensitivity analysis.
To establish the cost table, the Portuguese Forestry Grant’s national website was consulted. Information on forestry workers’ operations for eucalyptus exploitation (available at: https://www.bolsaflorestal.com/custos-de-exploracao-para-o-eucalipto/ accessed on 21 March 2025) was found. These data represent current (as of 2025) market costs for eucalyptus activities in Portugal, providing up-to-date figures specific to this study. In comparison, Nunes et al. [47] reported 2021 estimates, which may be outdated due to inflation and market shifts (e.g., their cutting costs were similar but without recent updates). Raimondi et al. [48] provided harvesting costs of 40 €/ton (roadside disposal) and transportation costs of 10.4 €/ton for 50 km, aligning broadly with our adapted values but derived from a different regional context (Spain). We prioritized Portuguese-specific data for relevance while using midpoint values to account for variability. Various operations across three categories—cutting, retrieval, and transportation—are shown here.
Additionally, minimum and maximum costs, based on operational conditions, are provided. These operational costs relate to the exploitation of the species mentioned, and some adaptations and assumptions were necessary. For cutting operations, only manual cutting was considered, and for retrieval, only tractor with trailer and crane were used. The summary of costs for these operations is shown in Table 2 below.
Table 2.
Costs of some tasks carried out in maritime pine and eucalyptus exploitation.
Since the values are provided in both €/m3 and €/ton, it was necessary to convert one of these units to enable easier calculations across different scenarios. To perform this conversion, an assumption was made that eucalyptus density is 720 kg/m3. As a result, the values listed in Table 3 were calculated. Additionally, due to the land’s characteristics, the values may vary; therefore, for this study, the midpoint between the maximum and minimum values was used.
Table 3.
Costs assumed for the residual biomass recovery tasks.
Regarding transportation, these costs are detailed on the Portuguese Forestry Grant website for a 25-ton truck. However, since the model will mainly serve small producers, using a 25-ton truck would be inefficient. Therefore, a 10-ton truck, capable of traveling at an average speed of 50 km/h and consuming 20 L per 100 km, was chosen. This figure is based on typical consumption for medium-duty diesel trucks (7.5–12 tons) in European rural conditions, where averages range from 21.6 to 31.1 L/100 km for similar rigid trucks, but are lower (15–25 L/100 km) for lighter loads and slower speeds. Rural roads in forestry areas, such as hills and poor conditions, can increase consumption by 10–20%, but 20 L/100 km is a conservative estimate for Portuguese contexts at 50 km/h. Since transportation and processing costs are calculated based on time and fuel consumption, it was necessary to set the price per liter of diesel at 1.44 €/L (information available at: https://precoscombustiveis.dgeg.gov.pt/ accessed on 21 March 2025) and the human costs at 870 € (minimum wage), which equals about 5 €/h (considering 21 workdays and 8 h per day). This base rate reflects general labor costs, but skill premiums for mechanical operators (e.g., tractor or crane handlers) are typically higher, averaging 9–13 €/h in Portuguese forestry based on market data. To account for this, a sensitivity analysis (Section 3.4) tests higher monthly wages of 1000 € and 1500 €, roughly equivalent to 5.75 €/h and 8.62 €/h, to cover potential premiums while maintaining a conservative approach.
To evaluate the feasibility of the model, it is important to understand the value of biomass. To create this biomass valorization table, an industry expert from a Portuguese biomass power plant, with over 15 years of experience in bioenergy valuation and supply chain management, was interviewed in a structured format. The values provided were verified by cross-checking existing literature and market data, including ranges from techno-economic models and specific studies. These comparisons confirm that the selected values accurately represent pre-treated residual biomass in the Portuguese context, particularly for moisture-dependent pricing in energy applications. The information is presented in Table 4. Values are provided only for pre-treated biomass, depending on its moisture content.
Table 4.
Pre-treated residual biomass recovery valorization per moisture content.
At the assumptions level, it may be possible to state:
- Loading and unloading operations are proportional to biomass amounts.
- All the biomass recovered will have to bear the costs of pre-treatment.
- All maximum distances for economic feasibility are calculated based on return trips.
- Any truck transports biomass from different moisture categories on the same trip.
- Producers will cover the service costs if biomass valorization is less than the cost of obtaining biomass.
- Any price change will be due to excess demand or supply.
3. Results
Regardless of the Figure 2 recovery path case, the total costs incurred during recovery processes are expressed by the following formula:
TotalrecoveryCost = CostCollection + CostRetrieval + CostTransportation,
3.1. Scenario 1: Only Transportation Required
Starting with Scenario 1, where only transportation is needed, CostCollection and CostRetrieval are both zero. However, since biomass selling prices are based on pre-treated biomass, it’s important to allocate a portion of biomass valorization for these operations. In this scenario, processing 1 ton of biomass costs €6.13. In addition to processing costs, loading and unloading operations are required, costing €3.85 per ton. Therefore, the remaining biomass valorization value can be used for transportation or potentially for additional earnings for farmers. Transportation costs are calculated using the formula shown below. Note that distances are doubled to account for the return trip.
Costtransportation = (distance (km) × 2/velocity (kh−1)) × Costworker (€h−1) +
distance (km) × 2 × Consumption(l km−1) × Fuel price (€L−1)
distance (km) × 2 × Consumption(l km−1) × Fuel price (€L−1)
Figure 3 illustrates the transportation cost as a function of distance for the three biomass valorization scenarios. Note that in this scenario, only 1 ton of biomass is loaded in a truck with a capacity of 10 tons. This scenario was evaluated since in most app-based models, user biomasses are small.
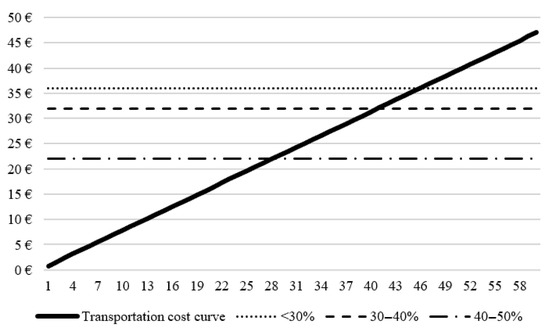
Figure 3.
Transportation costs curve for a 10-ton truck loaded with 1 ton as a distance function (considering return trips and processing operations).
In Figure 3, it is evident that for biomass with higher moisture content levels, the distance of 28 km is the limit to avoid costs for app-model users. If the moisture content drops to a percentage between 30 and 40%, then the model’s viability supports a distance of 40 km, and for lower moisture percentages (<30%), this value increases to 45 km. In this scenario, it can be said that a landowner who wants to make the most of his leftovers can do so relatively easily because the distances that ensure economic viability are quite significant. At this point, it should also be noted that the longer the owners allow the biomass to dry, the more they can potentially earn, despite the logistical costs that this drying process might involve.
In the first transportation scenario, only 1 ton was carried by the truck, so the same distances are calculated as if the truck were fully loaded with 10 tons, where transportation costs are distributed over that amount. In this scenario, biomass valorization is 10 times higher, but processing costs are also 10 times greater. Figure 4 shows the transportation costs curve for a 10-ton truck loaded with 1 ton as a function of distance.
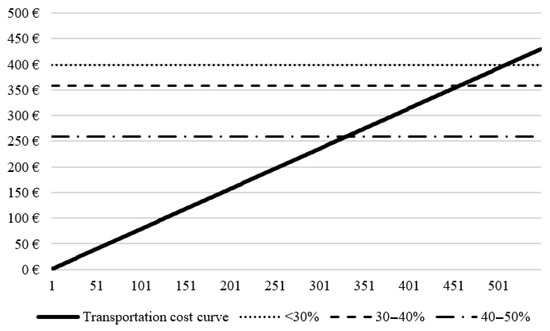
Figure 4.
Transportation costs curve for a 10-ton truck loaded with 10 tons as a distance function (considering return trips and processing operations).
In Figure 4, it is evident that the distance for economic viability increases significantly as more biomass tons are aggregated (281 km for biomass with higher moisture content, 408 km for biomass with moisture content between 30–40%, and 459 km for biomass with lower moisture content), which is explained by the dilution of transportation costs. However, this scenario is unlikely to occur frequently, since these app models are more suitable for small producers.
3.2. Scenario 2: Retrieval and Transportation Required
The second scenario (scenario 2) will assess economic viability for cases where retrieval and transport are considered. Currently, with 9.69 €/ton for CRetrieval, the remaining biomass valorization value must cover processing operations (6.13 €/ton), unloading operations (3.85 €/ton), and transportation costs (CTransportation). Figure 5 shows the transportation cost curve for a 10-ton truck loaded with 1 ton of biomass undergoing retrieval and processing.
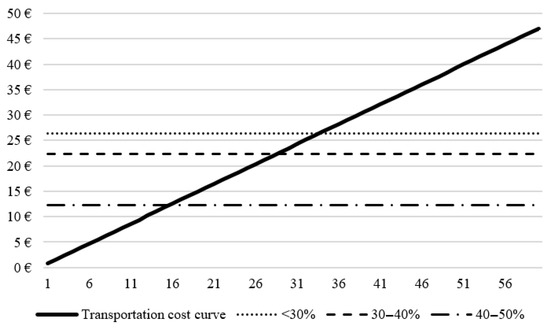
Figure 5.
Transportation costs curve for a 10-ton truck loaded with 10 tons as a distance function (considering return trips and processing and retrieval operations).
In this scenario, the economic feasibility decreases; however, since retrieval costs are not high, the distance values are relatively large, being 15 km, 28 km, and 33 km for the 40–50% moisture content, 30–40% moisture content, and <30% moisture content, respectively. In this regard, it is possible to state that feasibility can be achieved when considering the two operations (retrieval and processing), but with greater difficulty. It is also important to highlight the drying impact on biomass valorization. Using an analogous reasoning for a full load truck, it is possible to obtain the graph shown below, Figure 6.
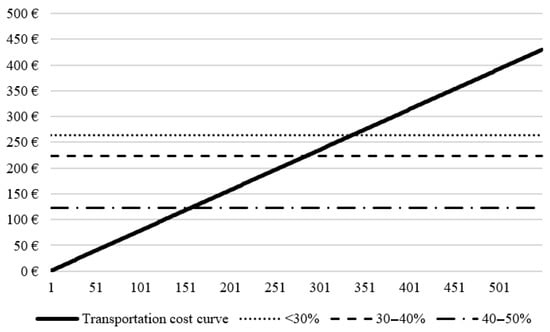
Figure 6.
Transportation costs curve for a 10-ton truck loaded with 10 tons as a distance function (considering return trips and processing and retrieval operations).
As verified in Section 3.1, distances increase significantly when 10 tons are carried by truck. The maximum distance for a truck loaded with 10 tons of biomass from the 40–50% moisture content category is 157 km, for the 30–40% moisture content it is 285 km, and for less than 30% moisture content, it is 336 km.
3.3. Scenario 3: Cutting, Retrieval and Transportation Required
In Scenario 3, cutting, retrieval, processing, and loading/unloading operations must be included, representing a cost of $25.57 per ton. Similarly to previous scenarios, it is apparent that the maximum distance for a 1-ton load in a 10-ton truck is shown in Figure 7.
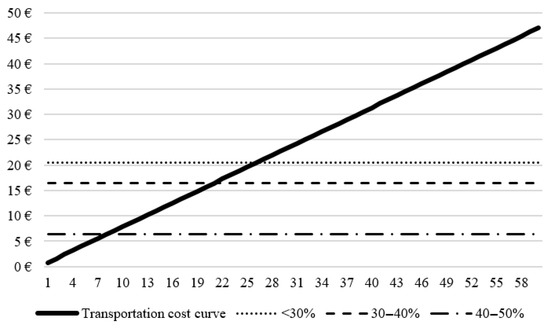
Figure 7.
Transportation costs curve for a 10-ton truck loaded with 1 ton as a distance function (considering return trips and processing, retrieval, and cutting operations).
In Figure 7, it is clear that different distances affect viability: high moisture content occurs at distances less than 8 km, intermediate moisture levels are seen at 20 km, and the lowest moisture content is at 26 km. It is important to note that biomass has high moisture content immediately after cutting operations. This should be considered when evaluating the feasibility of the lowest humidity level. However, these moisture levels generally decrease over time. Therefore, to maintain the desired moisture content, biomass owners should schedule cutting or cutting and retrieval operations to happen together, and then plan for transportation after a few months. The app-based models, thanks to their flexibility, can support this approach.
Representing the opposite scenario, where the truck is loaded to its maximum capacity, the system’s behavior is shown in Figure 8 below.
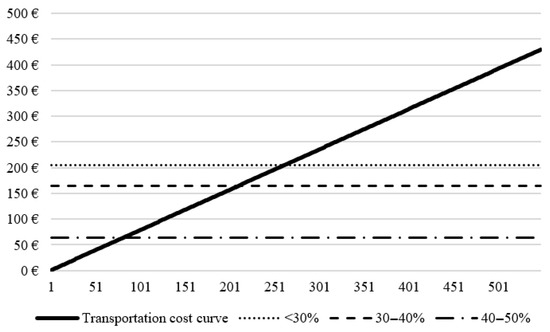
Figure 8.
Transportation costs curve for a 10-ton truck loaded with 10 tons as a distance function (considering return trips, processing, retrieval, and cutting operations).
Distances increase significantly: 79 km for the high moisture content category, 206 km for the intermediate moisture content, and 257 km for the low moisture content category, as confirmed in the two previous scenarios.
3.4. Sensitive Analysis
As is possible to identify in the methodology section, many assumptions were made to formulate the results section. To mitigate the bias inherent in this approach, a sensitivity analysis will be conducted. Before starting to evaluate the impact of variations in variables on results, the first part assessed here is the logistical variations, that is, to determine the effects of various loading operations. In the entire results section, all leftover tons recovered assume a collection point; however, this model aims to reach small producers or landowners who generally have little residual biomass. In this sense, 2, 5, and 10 loading operations were considered to reach 1 ton of leftovers, considering transportation in a 10-ton truck; the results are presented in Table 5. It is essential to state that processing operations are always considered to comply with biomass valorization conditions. The sensitivity analysis will be carried out following ceteris paribus principles.
Table 5.
Maximum distance allowing for attaining economic feasibility at recovery of 1 ton of leftovers, considering different numbers of loading operations and different numbers of stages.
Analyzing Table 6, it is clear that for 2-loading operations, feasibility is likely when three or fewer processes are needed to recover biomass. In the scenario with 5-loading operations, viability is also possible, except in cases with high moisture content where cutting, retrieval, and transportation are required. When 10 loading operations are needed to recover biomass, feasibility drops, with the only scenario ensuring economic viability being biomass recovered through a single process—transportation. Regarding the fuel cost sensitivity analysis, assuming all other conditions remain constant, and focusing only on optimal conditions, two values—1.8 €/L and 2 €—will be examined. Any value below 1.5 €/L will be considered since fuel prices tend to rise. Note that fuel prices impact not only transportation and processing tasks. Although retrieval and cutting operations may involve machines where price is relevant, this will be neglected, assuming the optimal scenario. Table 6 summarizes the fuel price sensitivity analysis.
Table 6.
Maximum distance for achieving economic feasibility in recovering 1 ton of leftovers, considering varying fuel prices and different numbers of stages.
In Table 6, it is clear that an increase in fuel price does not affect the model’s viability; in other words, the model remains viable even with rising fuel prices.
The other variable considered in this model for transportation costs, processing, and stump extraction work is human labor. In the model, human labor was evaluated at a minimum wage of $870/month, but higher wages could also be considered to test the model’s sensitivity. Salaries of $1000/month and $1500/month were included for this purpose. The results of this salary sensitivity analysis are shown in Table 7.
Table 7.
Maximum distance allowing for economic feasibility when recovering 1 ton of leftovers, considering different wages for human labor and varying number of stages.
This sensitivity analysis shows that human labor cost is not a variable that affects the feasibility of recovery processes. It also indicates that the results are similar to those obtained in the scenarios section.
4. Discussion
Rural fires are a problem that has impacted several countries, threatening sustainability. Promoting the recovery of residual biomass seems very promising for reducing fire risk; however, drawbacks make this recovery unfeasible. App-based models facilitate connections between stakeholders, increase transparency and confidence in information, promote fairer service requests, and maximize the availability of residual biomass in the right location. This last point can be particularly valuable if it can generate additional returns [43,44]. Since landowners are mainly motivated by economic gains [45], the benefits of app-based models can only be realized if they are financially viable. If the system isn’t economically sustainable, landowners will have to pay for services, which may lead to the continued use of traditional practices (biomass being burned).
The results of this study show a strong potential for achieving financial viability with this app model. A key finding indicates that when biomass quantities are high, financial feasibility becomes easier, which might be challenging since these models mainly aim to serve small leftover producers. Another important result is that the number of tasks needed to recover a ton of biomass affects the final costs and thus the economic viability. Experts highlight that mowing and recovery are significant cost factors, and it’s worth noting that these costs can be higher, potentially decreasing the model’s feasibility when these activities are involved. It’s also important to recognize that biomass amounts of less than 1 ton have not been considered, even though this can happen with small producers. As shown in the sensitivity analysis, increasing loading and unloading operations can greatly reduce the model’s viability. Therefore, if the biomass quantities are too small, the model will require external support to operate. Another point is that the cost of the chipping machine was not included, which can be as high as 250 € [50]; if this cost were considered, most scenarios would become unfeasible. However, for large properties, this expense might be justified, as biomass transport is more efficient with chipped biomass [51].
Regarding biomass recovery in steep slope areas, which are common in Portuguese forestry landscapes, standard retrieval methods like tractors with trailers and cranes (assumed at $9.69/ton in this study) may not be practical due to safety and accessibility concerns. Instead, cable yarding systems or full-suspension carriages are recommended for extraction on slopes over 30–40% incline, as they allow whole-tree or residue bundling without ground disturbance, reducing erosion risks and fire hazards [39,42]. However, these methods significantly increase costs: in European contexts, including Portugal, retrieval and transportation on steep terrain can raise baseline costs by 20–50% (e.g., $12–15/ton for cable systems versus $7–12/ton for moderate slopes) due to specialized equipment, slower operations, and poor road networks [36,37]. This increase in expenses could threaten the model’s economic viability in such areas, especially for small producers, highlighting the need for app-based models to include terrain-specific planning and potential subsidies to offset these logistical challenges.
Additionally, the impact of reducing moisture through natural drying, such as several months of sun exposure, must consider hidden costs not included in initial scenarios. While passive sun drying is inexpensive and can increase valorization from 32 €/ton (>40% moisture) to 46 €/ton (<30%), it also involves indirect expenses: site occupation (~2–5 €/ton/month for storage in rural areas), minimal labor for monitoring and turning (~1–2 €/ton total), and dry matter losses (5–15% over 3–6 months due to degradation, resulting in a 2–7 €/ton value loss based on average valorization). The time value of money further elevates this cost, as delayed recovery ties up capital and increases fire risk during storage. These factors could reduce net viability by 10–20% in scenarios that depend on drying (e.g., Scenario 3 with high initial moisture), highlighting the need for incentives to cover these hidden costs and encourage timely, low-moisture recovery through flexible application options.
It is important to note that only Portugal faces a wildfire season at the end of 2024, which will lead to a decrease in biomass prices and could challenge the model’s viability. Increasing the willingness of people to sell residual biomass will also boost supply, resulting in lower prices. Additionally, the industry agrees to pay more for biomass under certain conditions. As explained in the introduction, moisture content or inert quantities influence biomass conversion performance. App-based models can attract attention here because they offer the ability to request independent services. This allows landowners to request services across different time horizons, enabling biomass with lower moisture content due to drying processes. It is important to note that the calculations were based on the maximum distance the biomass can travel while allowing the producer to cover service costs and still make a profit. Therefore, in some cases where distances are long, viability is possible, unlike in others. It is also important to recognize that owners’ willingness to sell biomass varies, with some accepting the offer and others seeking a better return [52].
Regarding residual biomass valorization, the literature is inconsistent; different values are cited. In this work, the values used are from a biomass power plant studied. The range for residual biomass valorization is broad [53]. For instance, residual biomass from olives can range from 10 to 150 €/ton [54]. Other sources indicate that recovery costs for one ton of shredded residual biomass can be at least 150 USD [55], and chipped residual biomass may cost 100 CAD per oven-dry metric ton [56]. Additionally, some studies consider 55 € as the price for one ton of chipped biomass [39]. These examples demonstrate that valorization prices are variable, making it challenging to estimate any economic viability model. The economic feasibility of the models will only be achievable once prices are established. In this context, the proposed app-based model offers an additional contribution by potentially increasing the availability of information and enabling more informed decisions regarding biomass prices. Therefore, the use of the app-based model and the viability analysis should occur concurrently, utilizing the app’s data within economic viability models like the one presented here.
The results indicate some probability of resorting to an external “hand” to ensure the model functions. The lack of economic viability might lead to the adoption of old behaviors, such as residuals burning, which may have little impact on the app- based model’ s goals. Political power plays a significant role since producers’ willingness to provide biomass is influenced by incentives [57]. This government support may incur additional costs now, as they often need to pay landowners for biomass delivery; however, it helps reduce fires and, consequently, fire- related costs. For instance, in 2017, Portugal spent 1. 1.7 billion euros on fires [12], and this amount could be lowered with prevention measures like funding residual biomass recovery. Portugal, with about 8 million tons of residual biomass- 2 million tons from forests [58]- has developed a national plan to promote biorefineries, highlighting the importance political power places on these issues. Besides reducing fire risks, these measures support renewable energy initiatives, which lower gas emissions and aid decarbonization efforts. The push for renewable energy guidelines is not limited to Europe but includes countries like Japan [55]. Canada also has areas with potential for residual biomass exploitation [56]. These examples underscore the vital role that app- based models can play, emphasizing the significance of studies like this one. Politically, exploiting these resources could enhance energy independence, especially for countries lacking fossil fuels. Utilizing residual biomass, such as limbs or tops [59], becomes even more attractive when considering the reduction of non-residual biomass pressure [60]. Together with environmental benefits related to fire risk reduction and renewable energy transition, this model could provide societal and ecological advantages. Additionally, biomass energy remains an attractive resource due to its high versatility- producing biofuels or heat [61]- and its widespread availability across regions. Being transportable, though only over relatively short distances, allows other areas to access this renewable energy source.
On the other hand, sources like solar and wind power can only be utilized in locations where these resources are available. Intermittency is another issue with these two energy sources, which makes biomass energy more appealing. In rural areas, where biomass is commonly found, there is also a trend of young people leaving, making the use of these resources—whether through cultivation or recovery of agroforestry waste—a potential way to create jobs and promote rural development. Regarding this, biomass energy from agroforestry waste provides an additional benefit in the renewable energy sector by offering a solution to the problem of rural fires.
5. Conclusions
The search for solutions to reduce fire risk and related sustainability threats is urgent. Recovery of RB addresses key fire causes by lowering fuel loads and ignition sources while promoting renewable energy. Although promising, high logistical costs in the RB supply chain hinder implementation, creating opportunities for app-based models to connect stakeholders efficiently. This study evaluates the economic viability of such models to determine whether they can operate independently or require external incentives. Results indicate that economic feasibility is achievable under certain conditions, such as large biomass quantities (e.g., 10-ton truck loads) and low moisture content (<30%), with transportation distances up to 459 km in transportation-only scenarios, 336 km when retrieval is included, and 257 km for full operations (cutting, retrieval, and transportation). However, for smaller producers (e.g., 1-ton loads) or less ideal scenarios (high moisture >40% or multiple operations, with distances as short as 8 km), incentives are necessary to encourage participation, prevent biomass burning, and support sustainability. Political support is essential in providing these incentives, such as subsidies or policies for biomass recovery, to promote widespread adoption of the model and help reduce fire risk while advancing decarbonization goals. The study presents a set of cost estimates for RB recovery operations—a gap in the current literature—and an expert-developed biomass valorization matrix based on moisture content, aiding future research. Limitations include reliance on limited literature data and omission of factors like terrain slope or area, which could be integrated into a mathematical model. Future work could develop a tool that incorporates land parameters to evaluate feasibility and assist policymakers in promoting app-based models. While focused on Portugal, this approach can be adapted elsewhere with appropriate adjustments.
Author Contributions
Conceptualization, T.B., L.J.R.N. and L.T.; methodology, L.J.R.N. and L.T.; validation, T.B., L.J.R.N. and L.T.; formal analysis, T.B., L.J.R.N. and L.T.; investigation, T.B., L.J.R.N. and L.T.; resources, L.J.R.N. and L.T.; data curation, T.B., L.J.R.N. and L.T.; writing—original draft preparation, T.B., L.J.R.N. and L.T.; writing—review and editing, T.B., L.J.R.N. and L.T.; visualization, T.B., L.J.R.N. and L.T.; supervision, L.J.R.N. and L.T.; project administration, L.J.R.N. and L.T. All authors have read and agreed to the published version of the manuscript.
Funding
This research was funded by the FCT—Fundação para a Ciência e Tecnologia/MCTES, through national funds and, when applicable, co-financed by the FEDER, under the new partnership agreement PT2020, grant number PCIF/GVB/0083/2019.
Data Availability Statement
Data are available upon request to corresponding authors.
Acknowledgments
The participation of the author Tiago Bastos in this work was financed by the Foundation for Science and Technology through financial support via funds from national budget and community budget through the FSE. The author Leonor Teixeira was supported by Institute of Electronics and Informatics Engineering of Aveiro (IEETA) supported by Portuguese funds through the FCT—Fundação para a Ciência e a Tecnologia, in the context of the project UIDB/00127/2020. The author Leonel J.R. Nunes’ participation in this work was partially financed by national funds through FCT—Fundação para a Ciência e a Tecnologia, I.P., within the scope of project UIDP/05975/2020 of the Research Unit on Materials, Energy, and Environment for Sustainability (PROMETHEUS), project UIDB/04058/2020 and UIDP/04058/2020 of the Research Unit on Governance, Competitiveness, and Public Policies (GOVCOPP).
Conflicts of Interest
The authors declare no conflict of interest.
Abbreviations
The following abbreviations are used in this manuscript:
| RB | Residual Biomass |
| RBSC | Residual Biomass Supply Chain |
References
- Xepapadeas, P.; Douvis, K.; Kapsomenakis, I.; Xepapadeas, A.; Zerefos, C. Assessing the link between wildfires, vulnerability, and climate change: Insights from the regions of Greece. Sustainability 2024, 16, 4822. [Google Scholar] [CrossRef]
- Sandim, A.; Silva, M.E.; Fernandes, P.; Fonseca, T. Enhancing Sustainability and Yield in Maritime Pine Forests: Evaluating Silvicultural Models for Natural Regeneration. Land 2024, 13, 170. [Google Scholar] [CrossRef]
- Crist, M.R.; Belger, R.; Davies, K.W.; Davis, D.M.; Meldrum, J.R.; Shinneman, D.J.; Remington, T.E.; Welty, J.; Mayer, K.E. Trends, impacts, and cost of catastrophic and frequent wildfires in the sagebrush biome. Rangel. Ecol. Manag. 2023, 89, 3–19. [Google Scholar] [CrossRef]
- Grant, E.; Runkle, J.D. Long-term health effects of wildfire exposure: A scoping review. J. Clim. Chang. Health 2022, 6, 100110. [Google Scholar] [CrossRef]
- Nitzsche, N.; Nunes, J.P.; Parente, J. Assessing post-fire water quality changes in reservoirs: Insights from a large dataset in Portugal. Sci. Total Environ. 2024, 912, 169463. [Google Scholar] [CrossRef] [PubMed]
- Girona-García, A.; Cretella, C.; Fernández, C.; Robichaud, P.R.; Vieira, D.; Keizer, J.J. How much does it cost to mitigate soil erosion after wildfires? J. Environ. Manag. 2023, 334, 117478. [Google Scholar] [CrossRef] [PubMed]
- Kalogiannidis, S.; Kalfas, D.; Zagkas, T.; Chatzitheodoridis, F. Assessing the Effect of Community Preparedness on Property Damage Costs during Wildfires: A Case Study of Greece. Fire 2024, 7, 279. [Google Scholar] [CrossRef]
- Kalogiannidis, S.; Chatzitheodoridis, F.; Kalfas, D.; Patitsa, C.; Papagrigoriou, A. Socio-psychological, economic and environmental effects of forest fires. Fire 2023, 6, 280. [Google Scholar] [CrossRef]
- Santín, C.; Moustakas, A.; Doerr, S.H. Searching the flames: Trends in global and regional public interest in wildfires. Environ. Sci. Policy 2023, 146, 151–161. [Google Scholar] [CrossRef]
- Pelletier, F.; Cardille, J.A.; Wulder, M.A.; White, J.C.; Hermosilla, T. Revisiting the 2023 wildfire season in Canada. Sci. Remote Sens. 2024, 10, 100145. [Google Scholar] [CrossRef]
- Quishpe-Vásquez, C.; Oliva, P.; López-Barrera, E.A.; Casallas, A. Wildfires impact on PM2.5 concentration in galicia Spain. J. Environ. Manag. 2024, 367, 122093. [Google Scholar] [CrossRef]
- Oliveira, A.S.; Silva, J.S.; Guiomar, N.; Fernandes, P.; Nereu, M.; Gaspar, J.; Lopes, R.F.; Rodrigues, J.P.C. The effect of broadleaf forests in wildfire mitigation in the WUI–A simulation study. Int. J. Disaster Risk Reduct. 2023, 93, 103788. [Google Scholar] [CrossRef]
- Ambiente, A.P.d. Riscos Ambientais—Incêndios Rurais; Agência Portuguesa do Ambiente: Lisboa, Portugal, 2024. [Google Scholar]
- Nunes, L.J.; Raposo, M.A.; Pinto Gomes, C.J. A historical perspective of landscape and human population dynamics in Guimarães (Northern Portugal): Possible implications of rural fire risk in a changing environment. Fire 2021, 4, 49. [Google Scholar] [CrossRef]
- de Oliveira, E.; Lobo-do-Vale, R.; Colaço, M.C. Incident analysis of traditional burns in Portugal. Int. J. Disaster Risk Reduct. 2023, 95, 103852. [Google Scholar] [CrossRef]
- Pandey, P.; Huidobro, G.; Lopes, L.F.; Ganteaume, A.; Ascoli, D.; Colaco, C.; Xanthopoulos, G.; Giannaros, T.M.; Gazzard, R.; Boustras, G. A global outlook on increasing wildfire risk: Current policy situation and future pathways. Trees For. People 2023, 14, 100431. [Google Scholar] [CrossRef]
- Sil, Â.; Azevedo, J.C.; Fernandes, P.M.; Honrado, J.P. Will fire-smart landscape management buffer the effects of climate and land-use changes on fire regimes? Ecol. Process. 2024, 13, 57. [Google Scholar] [CrossRef]
- Sandim, A.; Araújo, D.; Fonseca, T.; Silva, M.E. Influence of Forest Management on the Sustainability of Community Areas in Northern Inland Portugal: A Simulated Case Study Assessment. Sustainability 2024, 16, 8006. [Google Scholar] [CrossRef]
- Nunes, L.J.; Raposo, M.A.; Meireles, C.I.; Gomes, C.J.P.; Ribeiro, N.M.A. Energy recovery of shrub species as a path to reduce the risk of occurrence of rural fires: A case study in serra da estrela natural park (Portugal). Fire 2021, 4, 33. [Google Scholar] [CrossRef]
- Favero, A.; Daigneault, A.; Sohngen, B.; Baker, J. A system-wide assessment of forest biomass production, markets, and carbon. GCB Bioenergy 2023, 15, 154–165. [Google Scholar] [CrossRef]
- Casau, M.; Dias, M.F.; Teixeira, L.; Matias, J.C.; Nunes, L.J. Reducing rural fire risk through the development of a sustainable supply chain model for residual agroforestry biomass supported in a web platform: A case study in Portugal Central Region with the Project BioAgroFloRes. Fire 2022, 5, 61. [Google Scholar] [CrossRef]
- Alves, A.S.; Nunes, L.J.; Matias, J.C.; Espadinha-Cruz, P.; Godina, R. An integrated PROMETHEE II-Roadmap model: Application to the recovery of residual agroforestry biomass in Portugal. J. Clean. Prod. 2024, 445, 141307. [Google Scholar] [CrossRef]
- Nunes, L.J.; Casau, M.; Dias, M.F.; Matias, J.; Teixeira, L.C. Agroforest woody residual biomass-to-energy supply chain analysis: Feasible and sustainable renewable resource exploitation for an alternative to fossil fuels. Results Eng. 2023, 17, 101010. [Google Scholar] [CrossRef]
- Guzmán-Bello, H.; López-Díaz, I.; Aybar-Mejía, M.; de Frias, J.A. A review of trends in the energy use of biomass: The case of the dominican republic. Sustainability 2022, 14, 3868. [Google Scholar] [CrossRef]
- Palma, A.; Gallucci, F.; Papandrea, S.; Carnevale, M.; Paris, E.; Vincenti, B.; Salerno, M.; Di Stefano, V.; Proto, A.R. Experimental Study of the Combustion of and Emissions from Olive and Citrus Pellets in a Small Boiler. Fire 2023, 6, 288. [Google Scholar] [CrossRef]
- Alves, D.N.; Míguez Tabarés, J.L.; Rivo-Lopez, E.; Saavedra, A.; Fariña, M.E.; Alonso, J.M.; Nunes, L.J. Residual forest biomass and energy assessment: A case study analysis in the region of Alto Minho (North Portugal) for the creation of BLCs and 2GBLCs. Int. J. Sustain. Energy 2022, 41, 85–102. [Google Scholar] [CrossRef]
- Florindo, T.; Ferraz, A.I.; Rodrigues, A.C.; Nunes, L.J. Residual biomass recovery in the wine sector: Creation of value chains for vine pruning. Agriculture 2022, 12, 670. [Google Scholar] [CrossRef]
- Nunes, L.J.; Loureiro, L.M.; Sá, L.C.; Matias, J.C.; Ferraz, A.I.; Rodrigues, A.C. Energy recovery of agricultural residues: Incorporation of vine pruning in the production of biomass pellets with enplus® certification. Recycling 2021, 6, 28. [Google Scholar] [CrossRef]
- Malico, I.; Gonçalves, A.C. Eucalyptus globulus coppices in portugal: Influence of site and percentage of residues collected for energy. Sustainability 2021, 13, 5775. [Google Scholar] [CrossRef]
- Villarino, Y.T.; Rial, L.P.; Rodríguez-Abalde, Á. Assessment of a residual biomass micro-combined heat and power system based on an organic Rankine Cycle coupled to a boiler. J. Environ. Manag. 2022, 301, 113832. [Google Scholar] [CrossRef]
- Hauptvogl, M.; Feher, A.; Prcik, M.; Kosecova, N.; Kovacik, M. Bioenergy potential of agricultural phytomass production in Slovakia. Ecocycles 2022, 8, 16–26. [Google Scholar] [CrossRef]
- Van Dam, J.; Faaij, A.; Lewandowski, I.; Van Zeebroeck, B. Options of biofuel trade from Central and Eastern to Western European countries. Biomass Bioenergy 2009, 33, 728–744. [Google Scholar] [CrossRef]
- Vávrová, K.; Knápek, J.; Weger, J.; Outrata, D.; Králík, T. Complex aspects of climate change impacts on the cultivation of perennial energy crops in the Czech Republic. Energy Convers. Manag. X 2023, 20, 100465. [Google Scholar] [CrossRef]
- Lewandowski, I.; Weger, J.; Van Hooijdonk, A.; Havlickova, K.; Van Dam, J.; Faaij, A. The potential biomass for energy production in the Czech Republic. Biomass Bioenergy 2006, 30, 405–421. [Google Scholar] [CrossRef]
- Carmo-Calado, L.; Hermoso-Orzáez, M.J.; La Cal-Herrera, J.; Brito, P.; Terrados-Cepeda, J. Techno-Economic Evaluation of Downdraft Fixed Bed Gasification of Almond Shell and Husk as a Process Step in Energy Production for Decentralized Solutions Applied in Biorefinery Systems. Agronomy 2023, 13, 2278. [Google Scholar] [CrossRef]
- Pulido-Ocegueda, J.C.; Santibanez-Aguilar, J.E.; Ponce-Ortega, J.M. Strategic Planning of Biorefineries for the Use of Residual Biomass for the Benefit of Regions with Low Human Development Index. Waste Biomass Valorization 2023, 14, 2825–2841. [Google Scholar] [CrossRef]
- La Scalia, G.; Adelfio, L.; La Fata, C.M.; Micale, R. Economic and environmental assessment of biomass power plants in southern Italy. Sustainability 2022, 14, 9676. [Google Scholar] [CrossRef]
- Correia, B.; Matos, H.A.; Lopes, T.F.; Marques, S.; Gírio, F. Sustainability assessment of 2g bioethanol production from residual lignocellulosic biomass. Processes 2024, 12, 987. [Google Scholar] [CrossRef]
- Basile, F.; Pilotti, L.; Ugolini, M.; Lozza, G.; Manzolini, G. Supply chain optimization and GHG emissions in biofuel production from forestry residues in Sweden. Renew. Energy 2022, 196, 405–421. [Google Scholar] [CrossRef]
- Moretti, L.; Milani, M.; Lozza, G.G.; Manzolini, G. A detailed MILP formulation for the optimal design of advanced biofuel supply chains. Renew. Energy 2021, 171, 159–175. [Google Scholar] [CrossRef]
- Bastos, T.; Teixeira, L.; Nunes, L.J. Fire Risk Reduction and Recover Energy Potential: A Disruptive Theoretical Optimization Model to the Residual Biomass Supply Chain. Fire 2024, 7, 263. [Google Scholar] [CrossRef]
- Bastos, T.; Teixeira, L.C.; Nunes, L.J. Forest 4.0: Technologies and digitalization to create the residual biomass supply chain of the future. J. Clean. Prod. 2024, 467, 143041. [Google Scholar] [CrossRef]
- Bastos, T.; Teixeira, L.C.; Matias, J.C.; Nunes, L.J. Agroforestry biomass recovery supply chain management: A more efficient information flow model based on a web platform. Logistics 2023, 7, 56. [Google Scholar] [CrossRef]
- Bastos, T.; Teixeira, L.C.; Matias, J.; Nunes, L.J. Optimizing the agroforestry residual biomass supply chain: A disruptive tool for mitigating logistic costs and enhancing forest management. Results Eng. 2023, 20, 101500. [Google Scholar] [CrossRef]
- Girona-García, A.; Vieira, D.C.; Silva, J.; Fernández, C.; Robichaud, P.R.; Keizer, J.J. Effectiveness of post-fire soil erosion mitigation treatments: A systematic review and meta-analysis. Earth-Sci. Rev. 2021, 217, 103611. [Google Scholar] [CrossRef]
- Rijal, P.; Bras, P.; Garrido, S.; Matias, J.; Pimentel, C.; Carvalho, H. Residual forestry biomass supply chain: A mapping approach. Int. J. Ind. Eng. Manag. 2023, 14, 244–256. [Google Scholar] [CrossRef]
- Nunes, L.J.; Meireles, C.I.; Gomes, C.J.P.; Ribeiro, N.M.A. Acacia dealbata Link. aboveground biomass assessment: Sustainability of control and eradication actions to reduce rural fires risk. Fire 2022, 5, 7. [Google Scholar] [CrossRef]
- Raimondi, G.; Greco, G.; Ongis, M.; D’Antuono, G.; Lanni, D.; Spazzafumo, G. Techno-economical assessment for combined production of hydrogen, heat, and power from residual lignocellulosic agricultural biomass in huesca province (Spain). Energies 2024, 17, 813. [Google Scholar] [CrossRef]
- Angnes, G.; de Almeida, B.O.; Milan, M.; Romanelli, T.L. Energy and economic performances of stump and roots removal of eucalyptus for bioenergy. Biomass Bioenergy 2021, 153, 106229. [Google Scholar] [CrossRef]
- Gomes, R.L.P.S. The Role of Flexibility in Forest-to-Bioenergy Supply Chain Risk Management. Doctoral Dissertation, Universidade do Porto, Porto, Portugal, 2024. [Google Scholar]
- Piqueiro, H.; Gomes, R.; Santos, R.; de Sousa, J.P. Managing disruptions in a biomass supply chain: A decision support system based on simulation/optimisation. Sustainability 2023, 15, 7650. [Google Scholar] [CrossRef]
- Gérard, M.; Jayet, P.-A. European farmers’ response to crop residue prices and implications for bioenergy policies. Energy Policy 2023, 177, 113561. [Google Scholar] [CrossRef]
- Torres-Morales, E.; Khatiwada, D.; Xylia, M.; Johnson, F.X. Investigating biochar as a net-negative emissions strategy in Colombia: Potentials, costs, and barriers. Curr. Res. Environ. Sustain. 2023, 6, 100229. [Google Scholar] [CrossRef]
- Lampropoulos, A.; Varvoutis, G.; Mandela, E.; Konsolakis, M.; Marnellos, G.E.; Ipsakis, D.; Athanasiou, C. Techno-economic assessment of an autothermal poly-generation process involving pyrolysis, gasification and SOFC for olive kernel valorization. Int. J. Hydrogen Energy 2023, 48, 39463–39483. [Google Scholar] [CrossRef]
- Qian, T.; Ooba, M.; Fujii, M.; Matsui, T.; Haga, C.; Namba, A.; Nakamura, S. Estimation of forest residual biomass for bioelectricity utilization towards carbon neutrality based on Sentinel-2A multi-temporal images: A case study of Aizu Region of Fukushima, Japan. Remote Sens. 2024, 16, 706. [Google Scholar] [CrossRef]
- Rivest, D.; Antar, E.; Robert, É. Techno-economic assessment of a biomass gasification-based polygeneration system for greenhouses. Sustain. Energy Technol. Assess. 2023, 60, 103535. [Google Scholar] [CrossRef]
- Nunes, L.J. Exploring the present and future of biomass recovery units: Technological innovation, policy incentives and economic challenges. Biofuels 2024, 15, 375–387. [Google Scholar] [CrossRef]
- Cunha, J.; Marques, A. Análise dos principais fluxos de abastecimento de biomassa florestal em portugal. Silva Lusit. 2021, 29, 7–37. [Google Scholar] [CrossRef]
- Pierobon, F.; Sifford, C.; Velappan, H.; Ganguly, I. Air quality impact of slash pile burns: Simulated geo-spatial impact assessment for Washington State. Sci. Total Environ. 2022, 818, 151699. [Google Scholar] [CrossRef] [PubMed]
- Di Fraia, S.; Fabozzi, S.; Macaluso, A.; Vanoli, L. Energy potential of residual biomass from agro-industry in a Mediterranean region of southern Italy (Campania). J. Clean. Prod. 2020, 277, 124085. [Google Scholar] [CrossRef]
- Mizsey, P.; Racz, L. Cleaner production alternatives: Biomass utilisation options. J. Clean. Prod. 2010, 18, 767–770. [Google Scholar] [CrossRef]
Disclaimer/Publisher’s Note: The statements, opinions and data contained in all publications are solely those of the individual author(s) and contributor(s) and not of MDPI and/or the editor(s). MDPI and/or the editor(s) disclaim responsibility for any injury to people or property resulting from any ideas, methods, instructions or products referred to in the content. |
© 2025 by the authors. Licensee MDPI, Basel, Switzerland. This article is an open access article distributed under the terms and conditions of the Creative Commons Attribution (CC BY) license (https://creativecommons.org/licenses/by/4.0/).