Article

Designing Competitive Nanostore Networks for Enhanced Food Accessibility: Insights from a Competitive Facility Location Model

by
Agatha Clarice da Silva-Ovando
1,2,*,
Daniela Granados-Rivera
3,
Gonzalo Mejía
1,
Christopher Mejía-Argueta
4 and
Edgar Gutiérrez-Franco
4
1
Grupo de Investigación en Sistemas Logísticos, Universidad de la Sabana, Chía 250001, Colombia
2
Centro de Operaciones Logísticas, Universidad Privada Boliviana, Cochabamba 0301, Bolivia
3
Department of Industrial and Systems Engineering, Auburn University, Auburn, AL 36832, USA
4
Emerging Market Economies Logistics Laboratory, MIT Center for Transportation and Logistics, Massachusetts Institute of Technology, Cambridge, MA 02142, USA
*
Author to whom correspondence should be addressed.
Logistics 2025, 9(3), 118; https://doi.org/10.3390/logistics9030118
Submission received: 25 May 2025 / Revised: 6 August 2025 / Accepted: 11 August 2025 / Published: 19 August 2025
(This article belongs to the Section Last Mile, E-Commerce and Sales Logistics)

Abstract

Background: Access to healthy food in emerging-economy cities is challenged by last-mile constraints and poor infrastructure. Aligned with the UN SDGs on Zero Hunger and Sustainable Cities, this study examines how a strategically located nanostores network can help close these gaps while fostering local resilience. Focusing on Colombia’s Sabana Centro region, we designed a nanostore network that maximizes spatial coverage, proximity, and affordability. Methods: A competitive facility-location model combined with a discrete choice model captures consumer heterogeneity in price and location preferences. Results: Results show that locating nanostores in peripheral rather than central areas improves equity: the proposed network meets about 65,400 kg of weekly demand—51% fruit, 36% vegetables, 13% tubers—representing 16% of total regional demand and reaching underserved municipalities. This is notable given that existing nanostores already satisfy roughly 37% of household needs. Conclusions: By linking consumer behavior with sustainable spatial planning, the research offers both theoretical insight and practical tools for equitable distribution. Future work should evaluate supportive policies and supply chain innovations to secure nanostores’ long-term viability and community impact.

1. Introduction

Location is a critical factor of a retailer’s success, affecting accessibility, visibility, customer convenience, and the overall shopping experience [1]. Retail spaces, whether large retailers or smaller neighborhood stores, contribute to defining the physical and social structure of communities, making their location a key consideration in urban planning, transportation infrastructure, and sustainable development strategies [2]. Their strategic positioning of retailers influences consumer behavior, encouraging social interaction and commercial activity.
In the food supply chain, retailers’ locations are critical, as their role is in ensuring the accessibility to nutritious food and in influencing consumer food consumption habits [3,4]. In emerging market economies, the food environment consists of various retail formats, including supermarkets, wholesalers, farmers′ markets, and nanostores, among others [5].
Among the diverse range of retail formats, nanostores (also known as mom-and-pop stores, corner shops, neighborhood markets, and tiendas) stand out as a unique and highly significant category. These small, usually family-owned retailers represent the traditional retail channel, offering a selected range of products such as snacks, fruits, vegetables, meat products, dairy products, beverages, and household essentials. Often embedded directly within local neighborhoods, nanostores typically occupy a fraction of the space of larger retailers yet offer a highly personalized experience that supplies the immediate needs of their surrounding community [6,7]. This local integration enables nanostores to maintain a high degree of proximity to their customer base, fostering close relationships, trust, and cultural affinity [8]. Their small and tailored inventories contrast with the often impersonal and massive approach of larger retailers. These traits of closeness and community connection can make them appealing venues for selling products that are not common in less-served regions, such as fresh and nutritious food.
While large retail chains dominate the supply chain in urban areas of developed countries [6], nanostores are the preferred channel in developing countries, as these offer advantages such as geographical proximity (i.e., convenience), affordable presentations, and supply reliability (i.e., selective assortment), reaching out households that may not have easy access to larger retail channels, given their limited daily budget [9,10]. Their strategic placement within communities influences urban mobility patterns, economic accessibility, and overall community resilience. Proper positioned nanostores can reduce the need for long-distance travel, promoting sustainable and accessible neighborhoods, boosting local economies by creating jobs and serving as economic anchors in their communities, which have intensified since the COVID-19 pandemic [11,12].
However, nanostores still face many challenges to survive in a competitive market. These small retailers tend to appear and disappear depending on socioeconomic features, population density, and competition with retailers and e-tailers in the neighborhood [6,12]. Their limited economies of scale, scarce space, and budget lead to higher unitary prices compared to modern retail channels like supermarkets, e-tailers, and chain convenience stores [13,14]. Improving the logistics capabilities of nanostores is critical, including product handling, supply strategies, last-mile delivery, in-store management practices, behavioral operations to address risk aversion in shopkeepers, and a structured, granular understanding of demand, ensuring a diverse and intelligent product assortment [7,15]. In this direction, a well-structured retail network can play a decisive role in promoting economic and social sustainability by facilitating access to healthy food.
However, many nanostore owners struggle to achieve economic viability and remain competitive against larger retail channels. The high costs associated with sourcing, storing, and managing fresh food pose significant challenges for small retailers, especially those unable to leverage economies of scale in their operations. Successful examples of small, organized retail networks, such as Oxxo in Mexico, demonstrate the potential for effectively addressing consumer needs and connecting supply chain stakeholders [16]. Building on lessons learned from these retailers, this study proposes the establishment of a nanostore network focused on providing fresh fruits and vegetables in a developing region, aiming to increase accessibility and affordability through economies of scale. If economically sustainable, this network can create small-to-small local business ecosystems to improve socioeconomic conditions across municipalities.
This study examines competition between the proposed nanostore network and other retail channels, such as chain supermarkets, hard discounters (retailers focused on low prices through minimal overhead and limited product variety), existing nanostores, and fruvers (specialized fruit and vegetable retailers in Colombia). Using a competitive facility location problem (CFLP), we incorporate constraints such as retailer pricing and distance. Data from the Sabana Centro region in Colombia will be used to address the following research questions: What is the most adequate configuration of a nanostore network that maximizes its financial sustainability while aligning with consumer preferences?
This study makes two contributions to the literature. Firstly, from a theoretical standpoint, our competitive facility location approach differs (and builds upon) the existing body of traditional formulations [16,17,18] in that it models distance constraints between nanostores in the network and multiple competitors, which have a crucial impact on the results. From a practical perspective, we provide valuable insights into the role of nanostores and their participation in retail environments, an unexplored area of study in the scientific community.
The remainder of the paper is organized as follows: In the next section, we present a brief literature review. Section 3 describes our methodological approach, including the mathematical model and the proposed linearization technique. Section 4 provides details of the case study conducted in the Sabana Centro Region of Bogotá, Colombia, along with information about the collected data. In Section 5, we present the numerical results, offering managerial insights. Finally, Section 6 discusses and concludes the paper, suggesting avenues for future research.

2. Literature Review

2.1. Proximity Factors and the Role of Nanostores

Numerous articles have researched the complex relationship between food accessibility and nutritional outcomes, particularly concerning geographical proximity. Significant contributions in this area include works by [14,19,20,21]. These studies underscore a discernible correlation between proximity to retail outlets, mainly supermarkets, and consumer preferences for fresh food. Evidence from these studies consistently reveals that populations residing further away from urban centers encounter significant barriers to accessing larger retailers offering diverse and nutritious food options [19,22,23]. These large retailers are usually located in central, densely populated regions [24]. Consequently, marginalized communities face challenges securing access to nutritious food, intensified by inflated prices in their local markets [25,26].
Limited options often drive residents to patronize smaller local shops, such as nanostores, where prices tend to be higher due to their lack of scale economies but affordable in terms of the product presentations/configurations [23,27]. In general, these prices are around 3.5% higher than those observed in more affluent areas or large retail channels with better food supplies [28]. As a result, residents of these communities frequently resort to purchasing higher energy, fat, and sugar-laden foods, which are typically more affordable than fresh, nutritious alternatives like fruits and vegetables [7,29]. This dietary pattern often results in suboptimal nutrient intake compared to their counterparts in higher-income communities, who can afford fresher products and have immediate access to them at grocery stores and large retailers.
The competition faced by nanostores, particularly against larger supermarkets, chain stores, and even other nanostores, hinges significantly on their ability to effectively manage their product range and pricing strategies [27]. While previous literature has focused on logistical and operational aspects of nanostore supply chains, relatively few studies have explored how nanostores’ strategic decisions, such as location, directly affect their competitiveness and financial viability [30,31].

2.2. Building the Bridge: The Competitive Facility Location Model

Facility location (FL) in the retail sector has emerged as a strategic field of study. Decisions related to the location of facilities are one of the first and important strategic decisions for any business [32]. The facility location models aim to optimize distribution networks, demand coverage, and utilities while addressing specific challenges such as transportation costs, inventory management, demand uncertainty, and market competitiveness.
Generally, this model assumes an environment without competitors, which is not applicable in retail settings [33], where customers make choices. In the case of a retailer′s location, competition exists between the potential new retailers and the existing ones in the same format and others of a different format [34]. This is denoted as the competitive facility location problem (CFLP). In such scenarios, the problem focuses on locating new retailers by the facility, considering various internal and external variables influencing consumer choice [34]. Other factors related to the retailer and individual purchaser characteristics also play a significant role in decision-making [33].
The CFLPs assume that customers perceive a “utility” from each facility, whether existing or potential, and choose the one that provides the highest utility [34]. However, it remains unclear which factors to consider in the competitive facility location (CFL) models (e.g., price, distance, size, assortment, and transportation cost) and how they impact the model formulation [35]. Distance between the retail store and the household is generally acknowledged as a factor significantly influencing demand levels in these models [36,37]. Quality, price, or store layout factors may determine retailer attractiveness and prevalence in the retail landscape. Furthermore, services can be included and adjusted in the attractiveness model [38].
The traditional CFL approaches often ignore critical real-world constraints; in response, recent advances have incorporated more sophisticated formulations that integrate economic, geographic, and behavioral data [16,18,39]. One extensively studied model involves opening a new facility to maximize market share [40]. Drezner [38] and Ashtiani [33] have a complete literature review of the evolution of this competitive location model.
From the spatial perspective, alternative approaches have examined the role of geography in retail competition. Authors such as Ahn et al. [41] and Byrne et al. [42] employed Voronoi diagrams in CFLP studies to understand the effect of geographical clusters on competitive performance and model optimization. In the competitive context, the cannibalization among retailers is explored by Berkan et al. [43]. Plastria [44] has further researched strategies to avoid such cannibalization.
In retail, Drezner has vastly studied the competitive facility location problem, contributing foundational work to the field [16,18,38]. Other authors explored the CFLP in retail, considering environmental conditions, such as market reaction [45] and demand dynamics [46,47]. Other approaches focus on the decision of multiple facility locations, expanding the decision complexity of the optimization models [16,18,39,48,49]. Méndez-Vogel et al. [50] further advanced these models by integrating nested logit rules to better capture the heterogeneity in customer decision-making processes.
Specifically in food retail, CFL models have been applied, contemplating different retail formats, considering their size, assortment, and structure. Table 1 presents a summary of the main contributions found in fresh food retail.
The reviewed studies face different scopes to optimize facility location in competitive contexts within the food sector. As with other typical CFL models, distance, coverage, and cost remain significant when deciding where to locate a facility for food distribution, as studied by Palomino et al. [32]. In addition, authors have explored the integration of technology to improve the strategic evaluation of CFL models, considering economic, environmental, and design factors [45,59]. Other studies further added to their perspective the potential cannibalization among stores from a network [45,55].
Among the studies found, case studies applied in larger supermarket chains focused on the location strategies on proximity to customers and competition minimization [51]. In contrast, other proposals explore how urban areas have been increasingly requiring small-format stores (such as nanostores), which are usually located within walking distance [43]. Mejía et al. [36] and Na et al. [58] further researched the CFLP for fresh food with alternative channels of farmer and street markets.
Modern CFL applications in food retail have increasingly integrated other supply chain elements, developing hybrid models which seek to optimize not only retail locations, but also minimize inventory and distribution costs. For example, Manatkar et al. [60] explore how inventory–location models combine inventory policies with spatial decisions to reduce total process costs and improve the service levels. Further, emerging formats such as Online-to-Offline (O2O) experience stores further expand this scope, combining retail and fulfillment functions to optimize cost and customer satisfaction [52].
Despite these advancements, food retail has received relatively limited attention within CFLP research, specifically regarding market competition when locating facilities. Although this research area has gained attention in the past decade, only a small number of studies in emerging market economies address the intersection of micro-retailing, food security, and CFLP.

2.3. Research Gaps

Based on the literature review, limited research has been conducted on applying the competitive facility location model specifically to fresh food retailers. Only a few studies, such as the work by Mejía et al. [36], have explored this area in developing countries, where other challenges can be accentuated, such as the limited mobility methods and geographical barriers to access food. The approaches found did not exclusively contemplate the type of retailers considered relevant for this study—nanostores—nor considered multi-product applications. Furthermore, the existing literature on nanostores predominantly focuses on their operational aspects, neglecting the competitive market dynamics and customer choice for perishable items, which we model using discrete choice models embedded in the CFLP. The topic of designing a network of nanostores has not been studied to the best of our knowledge. Therefore, this study aims to address these identified gaps by adopting a comprehensive approach through a facility location study for a network of nanostores that would generate economies of scale and reduce the operational costs and risks for these retailers, crucial in improving accessibility, availability, and affordability for vulnerable communities.
An effectively designed nanostore network for fresh fruits and vegetables has the potential to address two key Sustainable Development Goals (SDGs): zero hunger and decent work and economic growth. Achieving the latter goal requires guaranteeing the network’s sustainability, fostering productive local ecosystems, and supporting small-to-small business interactions that enhance socioeconomic conditions within each municipality. In this context, this case study examines the behavior and effectiveness of the proposed model, using data from the Sabana Centro region in Colombia as a basis for analysis and evaluation.

3. Materials and Methods

The proposed methodology consists of three main stages: (1) data collection and performing spatial analysis, (2) fitting a multi-logit regression model, and (3) formulating and solving a mixed integer non-linear program (MINLP) of a CFLP with parameters found in stages 1 and 2.
Firstly, we conducted a structured survey to gather relevant information on household demand patterns for diverse items of the basic food basket. Additionally, a geographical analysis is conducted to collect geolocation data of the retailers present in the region. This initial stage aims to comprehensively structure and analyze the demand patterns and understand geographical aspects relevant to the research.
In the second stage, we adjusted a discrete choice, multi-logit model to assess the households’ utilities associated with different retail channels. This model enables the identification of factors influencing consumer preferences and their relative importance per retail channel and store selection. The model calibration results will be inputs to the mathematical model described below.
Lastly, an optimization model is developed to solve a competitive facility location Problem case. This mathematical model integrates the gathered data on household demand, geographical information, and results from the logit model. The competitive facility location approach aids in identifying the optimal locations for new retail facilities to maximize market share.
Figure 1 illustrates the methodological framework employed in this study, depicting the sequential flow of the three stages and their interconnections.
Further details of the methodological stages are provided in the following subsections.

3.1. Discrete Choice Model

Discrete choice models are extensively used to describe how decision-makers select among mutually exclusive alternatives. Each decision maker (j) perceives a utility U j i to each alternative i , composed of an observed and an unobserved component as expressed in Equation (1) [61]:
U j i = V j i + ε j i
where V j i is the observed utility of agent j of alternative i , which is usually fitted with preselected covariates and parameters. ε j i is the random value not observed.
The value of V j i is typically defined as a weighted sum of K attributes, presented in Equation (2).
V j i   = k K β k X j i k
X j i k represents the value that the decision maker j assigns to the attribute k of the alternative i and β k is the weight of the attribute k.
Accordingly, the decision maker j will choose an alternative i only if
U j i U j i   i i
If ε j i follows an extreme value distribution, the model simplifies to a multinomial logit model [61]. The parameters β k are calculated using the classical maximum likelihood estimation [61,62]. The probability of the decision maker j to select any alternative i is explained in Equation (4):
P r j i =   e x p ( β T   X j i ) i = 1 I e x p ( β T X j i )
where β T is the vector of weights and X j i denotes the vector of attribute values given by decision maker j regarding alternative i . Several commercial software applications are available to compute such models. In this paper, we used Biogeme 3.2.11 [63], given its extensive use in the literature.

3.2. Optimization Model for the Location of Nanostores

To establish the location of the new nanostores, we formulate a mixed integer non-linear programming (MINLP) model. Both the model and its linearization are presented in the following subsections.

3.2.1. Coverage

The model considers a minimum distance restriction among new and existing nanostores to avoid “cannibalization” among them. Geographical analysis and the calculation of distances were crucial to define the retailer’s coverage level over the households. The coverage factor for each household and retailer was calculated based on the location of the household and its distance to the retailers. Therefore, for each retailer and household located on the map, the coverage factor a j i declines by M a x j i γ j r M a x j i d m i n , where M a x j i refers to the maximum distance between household j and potential new nanostore i , γ j r is the distance between retailer r and household j and d m i n refers to the Minimum distance required between two potential new nanostores to be opened. This coverage factor a j i is based on [39], as presented in Section 3.2.4 below.

3.2.2. Description of the Competitive Facility Location Problem for Nanostores

The proposed formulation establishes a set of household clusters j J , which have a fixed and inelastic average daily demand δ j p (i.e., the demand is not sensitive to its price). The households can satisfy their demand using four retail channels r R = { I N F E S O } : new nanostores  i I , current and active nanostores N , fruvers F , large supermarket chains E , small organized retailers (e.g., hard discounters, convenience stores) S , and other channels O (e.g., butchery, producers, peddlers, self-supply).

3.2.3. Models’ Assumptions

For this study, several assumptions were considered to reduce the complexity of the model:
  • the distances considered for the model were Euclidean;
  • the weekly demand was constructed on the households’ declared demand in the survey;
  • the demand was constant, and the initial preferred retailer considered was the one stated in the initial survey;
  • the household will always select one retail alternative to purchase;
  • the households’ data were extrapolated to the number of existing households in their blocks.
  • all nanostores are homogeneous;
  • nanostores owners have a fixed operation cost to maintain their inventories. We considered that nanostores would offer other products than fruits and vegetables. From information gathered with nanostore owners, we defined that fresh food should cover at most USD 100 of the total operational costs.

3.2.4. Mathematical Formulation

The model’s time horizon is one week, considering that a traditional household will make purchases at least once per week. Thus, all the parameters, such as demand and cost, are weekly. The costs and selling prices are defined in US dollars, and distances are defined in meters. Table 2 presents the model’s objective function and constraints. The formulation of the competitive facility location model adapted for this study is as follows:
  • Sets
  • P = set of products indexed in p;
  • J = set of households indexed in j ;
  • N = set of existing nanostores indexed in n ;
  • I = set of potential new nanostores indexed in i ;
  • F = set of fruvers indexed in f ;
  • E = set of large supermarket chains indexed in e ;
  • S = set of small supermarkets indexed in s ;
  • O = set of other channels indexed in o ;
  • H = set of potential new nanostores alias indexed in i ;
  • r R { N E S F O I } = Retailers.
  • Parameters
  • d i h = distance between potential new nanostore  i and potential new nanostore h ;
  • d m i n = minimum distance required between two potential new nanostores to be opened;
  • M a x j i = maximum distance between household j and potential new nanostore i ;
  • γ j r = distance between household j and retailer r ;
  • δ j p = weekly demand of fresh food in household j for product p ;
  • a j i =   1   i f   γ j r     Max ji   M a x ji - γ j r M a x ji - d min     i f   Max ji   <   γ j r     d min 0   i f   γ j r   >   d min ;
  • V j i p = observed utility of household j when selecting retailer i for product p, where V j r p = β 0 ( p ) + β d i s t a n c e ( p ) γ j i + β p r i c e   ( p )   p i p ;
  • β p r i c e   ( p ) = weight of price of retailer r for product p;
  • β d i s t a n c e   ( p ) = weight of distance from household j to chosen retailer r for product p;
  • β 0 ( p ) = regression coefficient (i.e., intercept) for each retailer r for product p;
  • φ j i = linearization parameter of the constant, where φ j i = e V i j r R / I e V r j ;
  • p r p = price in USD per kg of product p in retailer r ;
  • c r p = unit cost in USD per kg of product p in retailer r ;
  • f i   = weekly operation fixed costs in USD of nanostore i .
  • Variables
  • x i = 1   i f   t h e   n a n o s t o r e   i   i s   o p e n 0   o t h e r w i s e ;
  • y j r p : probability of household j of choosing retailer r to purchase product p;
  • y ¯ j p : linearized cumulative probability per household j to purchase product p;
  • q i p = demand captured by nanostore i per product p.
The model maximizes the utility obtained by the potential new nanostores in the retail landscape, as presented in the objective function Equation (5) in Table 2. The first constraint (6) corresponds to the total demand of each product category per household that is captured by nanostore i . Constraint (7) computes the probability of households selecting a given nanostore to get their products from using the logit model presented in Section 2.
Constraint (8) limits the minimum distance between two potential new nanostores to be opened to avoid the cannibalization effect. Last, constraints (9) and (10) correspond to the domain of the variables. Constraint (7) is non-linear; therefore, we adapted the linearization algorithm proposed by [64].

4. The Sabana Centro Case Study

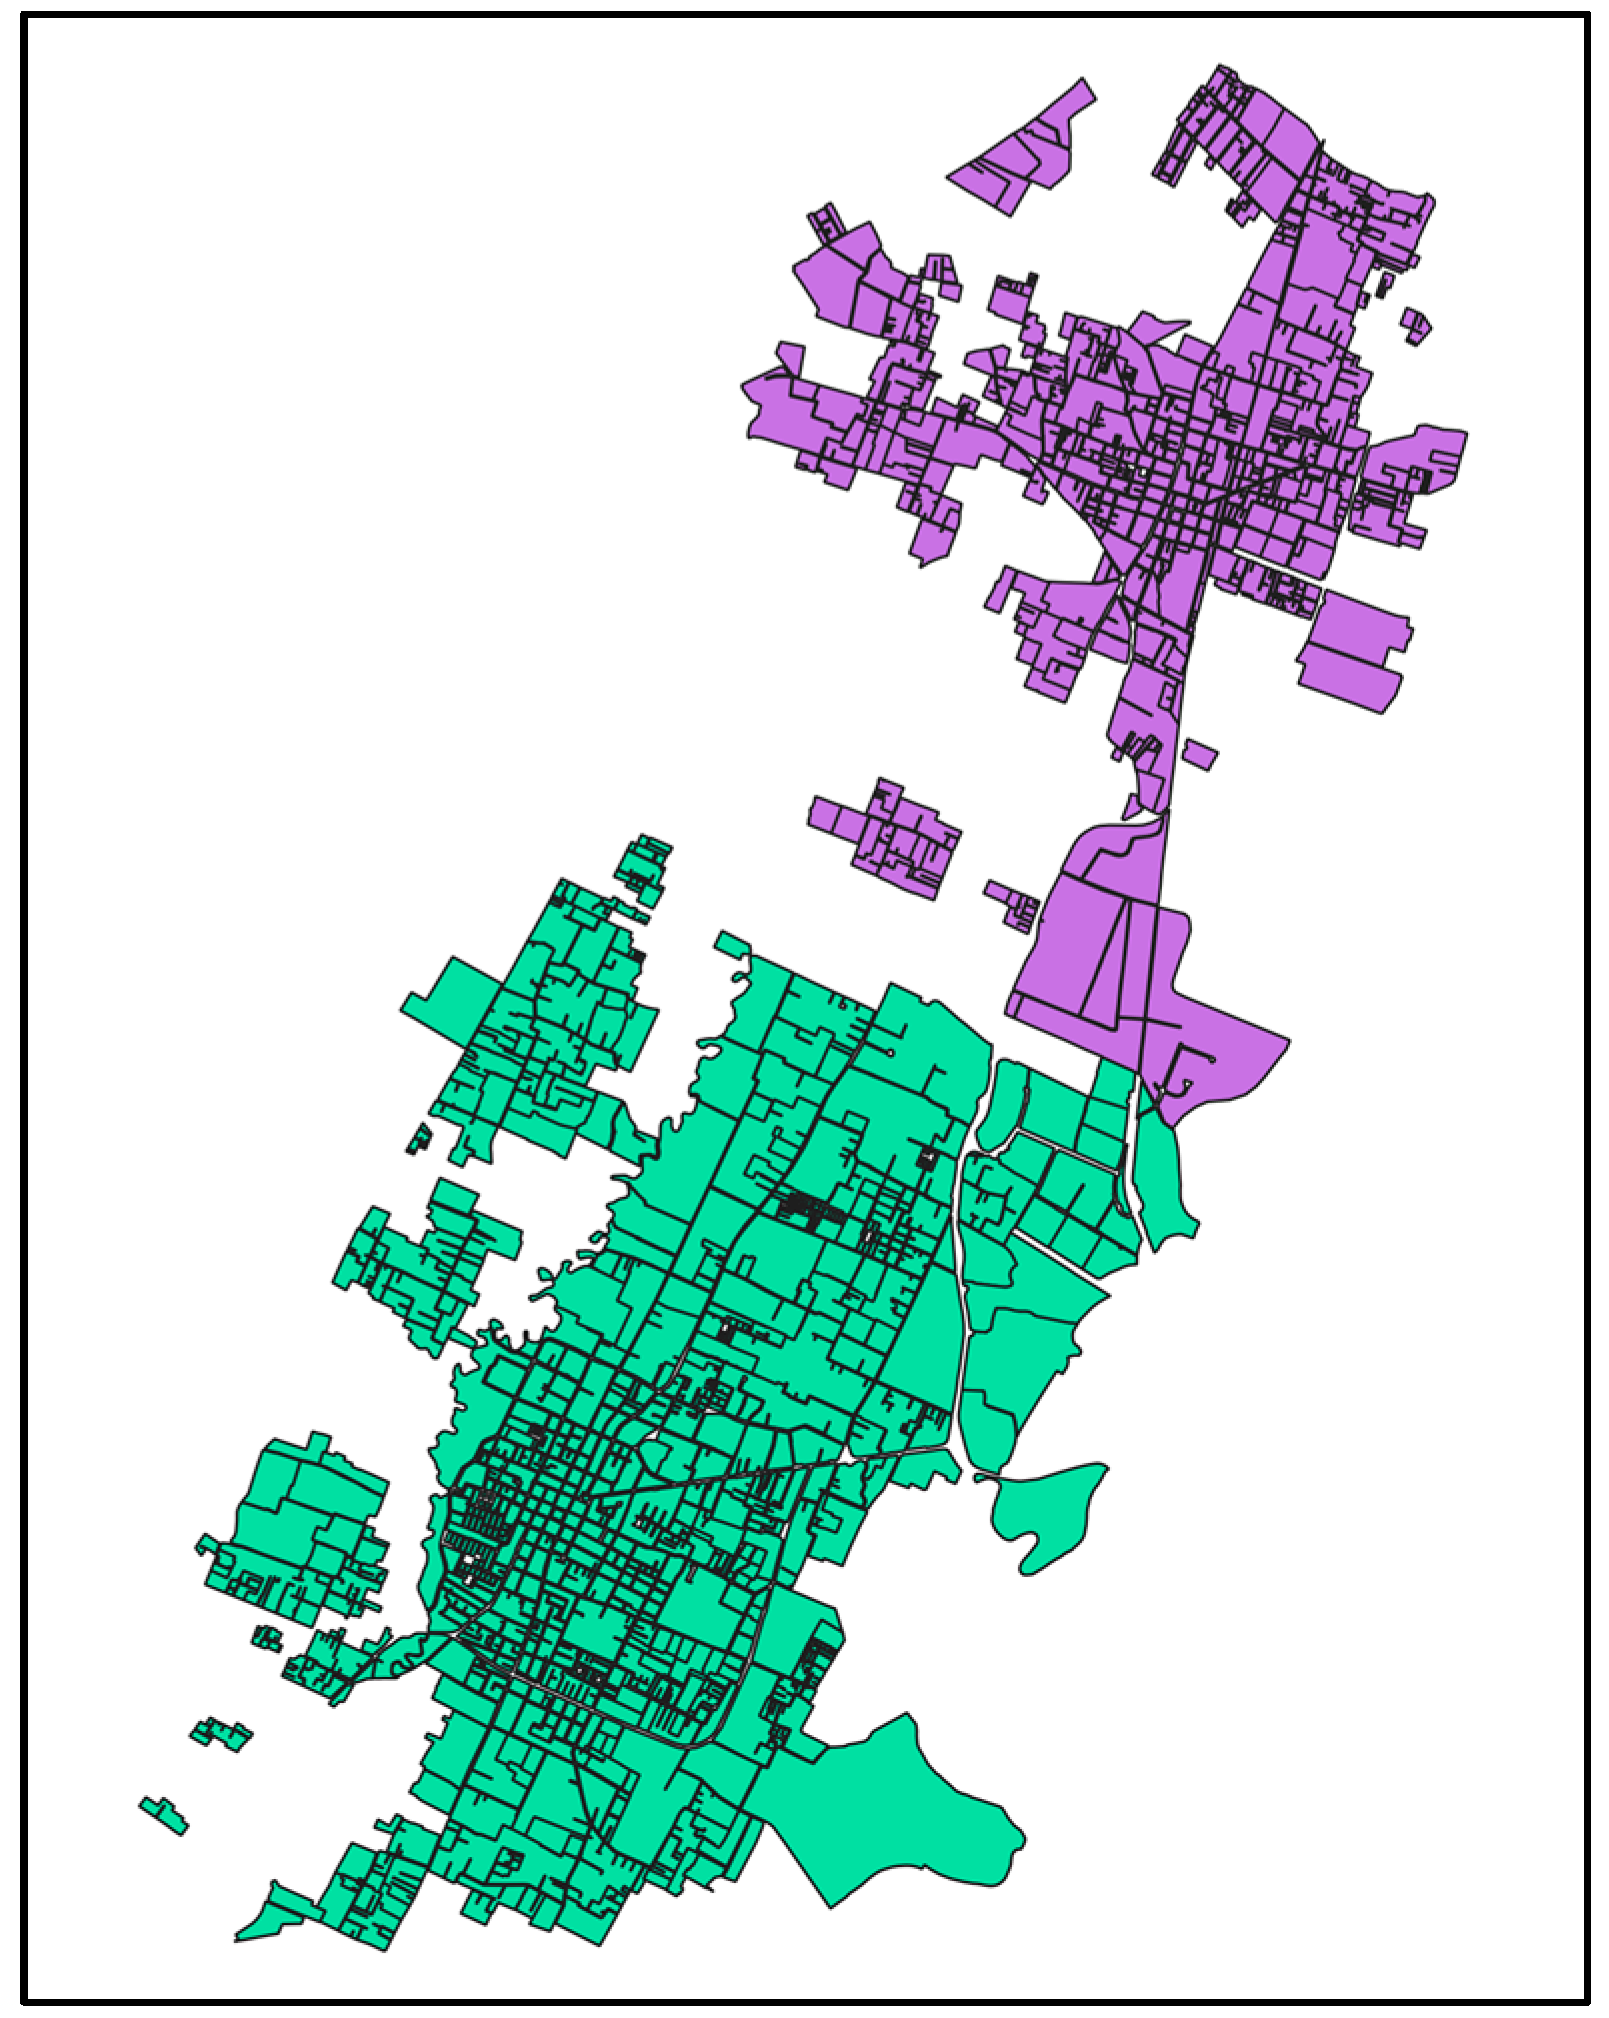
This study focuses on the Sabana Centro region in Colombia, encompassing ten municipalities, with Chía and Cajicá being the most prominent towns. These municipalities have populations of 141,308 and 87,866 inhabitants, respectively, with a population density resembling that of the capital city, Bogotá [65]. Their predominant socioeconomic levels are middle-low and middle classes. The retail landscape in the region primarily consists of nanostores, although other retail channels also exist. A region map was generated using QGIS 13.16.3 software, utilizing data from the National Administrative Department of Statistics, presented in Figure 2 [65]. Chía is displayed in magenta, and Cajicá is shown in blue.
The selection of the Sabana Centro region for this study was based on the availability of data and the vast presence of nanostores and other retail formats [24]. Nanostores hold approximately 57% of the market share in the region [66] and directly compete with supermarkets and fruvers. In more peripheral areas, nanostores may be the only food source available [24]. Regionally, around 40% of these retailers offer fresh products, such as fruits and vegetables. However, the most attractive products for nanostores are not produce items but dairy products, with almost 44% of the total sales volume, followed by canned goods and pastry, with 19% and 15.6%, respectively [66].

4.1. Data Collection and Model Calibration

This study’s data collection and model calibration were conducted through two stages: (1) primary data collection with surveys and (2) primary data collection with georeferenced tools.

Primary Data Collected from Surveys

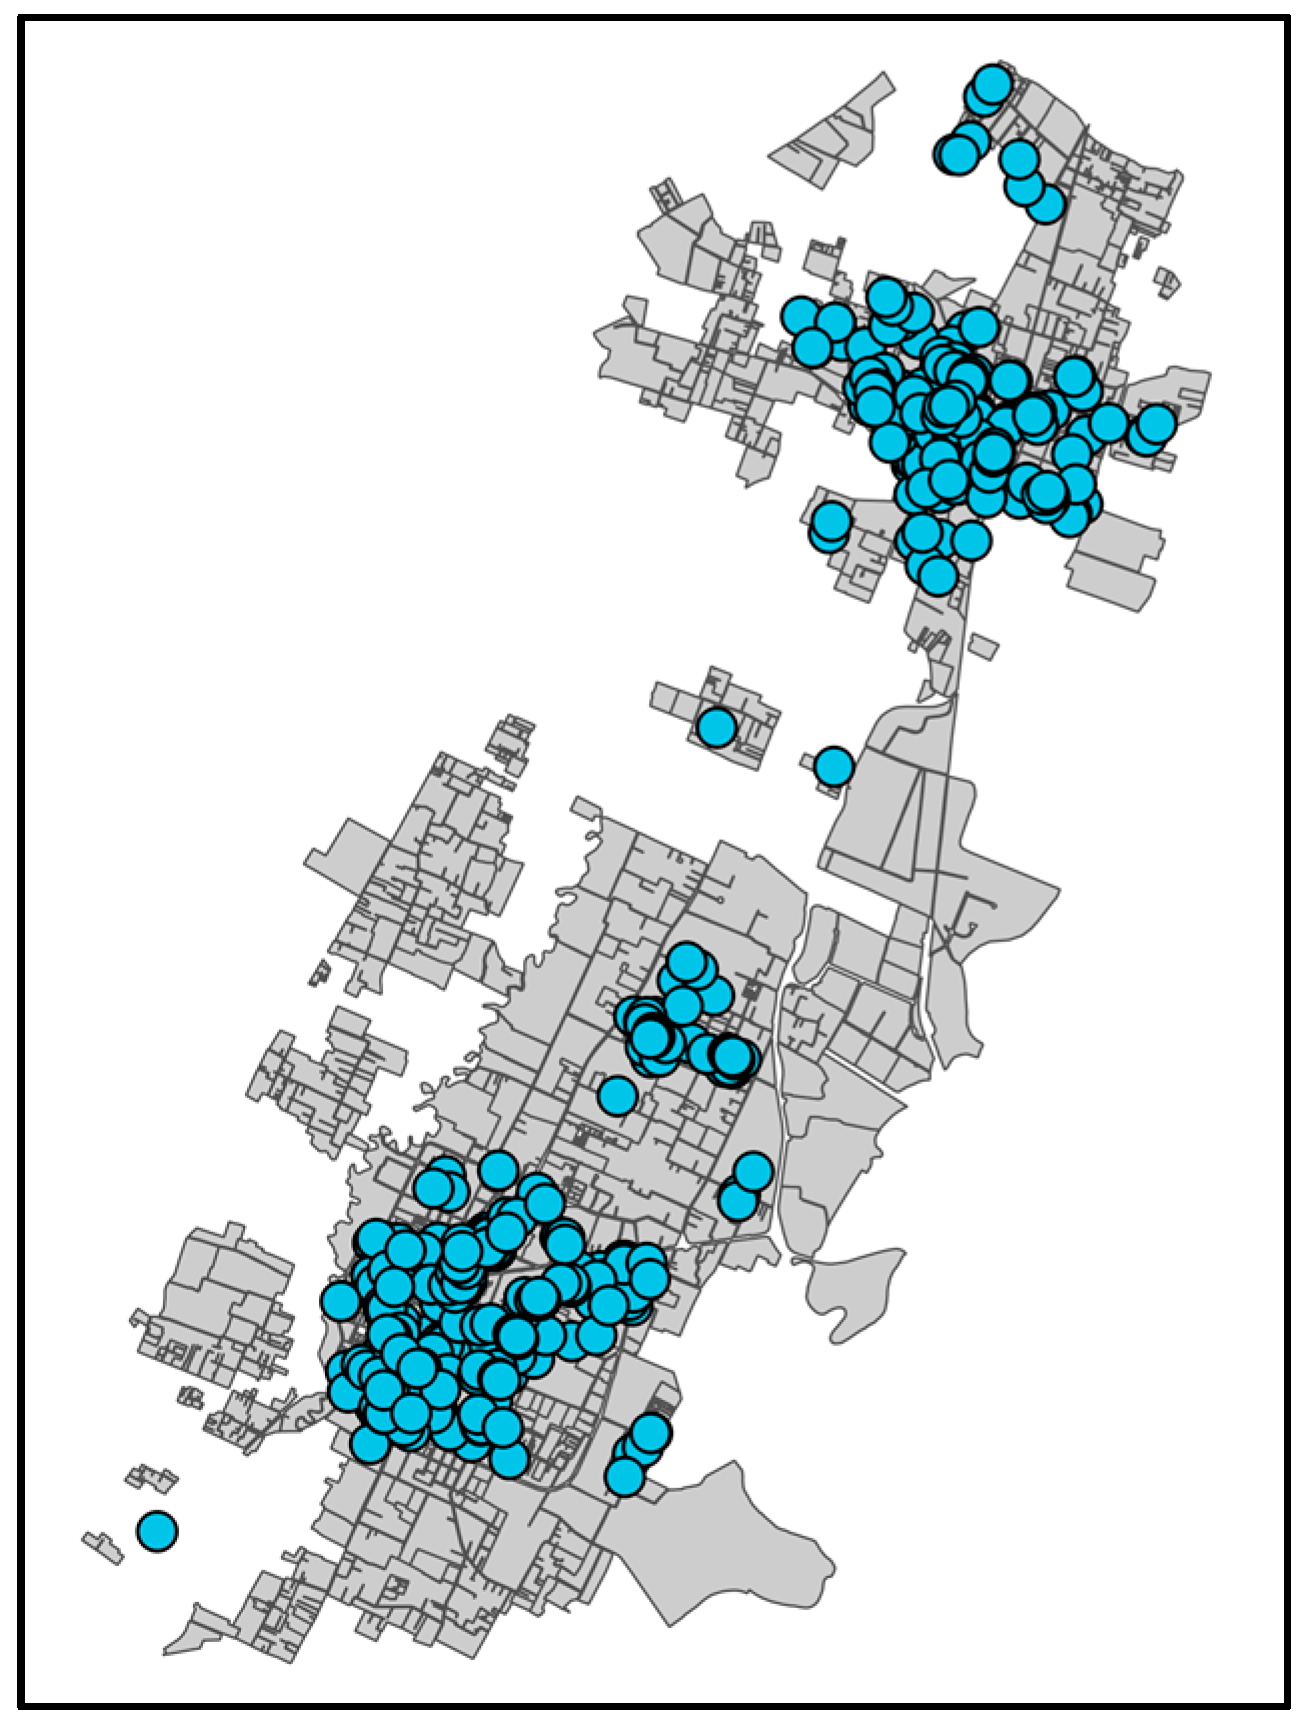
A regional survey was conducted in 2020, targeting 537 households in Chía (288) and Cajicá (249) in collaboration with the Universidad de la Sabana_1 and the central territorial associative scheme for administrative and special planning (RAP-E, see https://regioncentralrape.gov.co/ (accessed on 24 October 2023)). The descriptive analysis of the surveys’ results was explored by [24]. Figure 3 presents the location of the surveyed households (blue dots) in the region.
The survey consisted of five sections: (i) Administrative data (i.e., surveyor and data collection information); (ii) household identification (i.e., number of household members, their profile and number of days eating at home); (iii) consumption pattern of 64 food types under the RAP-E classification (i.e., shopping frequency and quantity for each product and the selected food retail channel); (iv) consumption habits and household income (i.e., increase or decrease in the purchase, organic food preferences, and percentage of household income expend in food purchase); (v) surveyor observations. The sample selection followed a probabilistic multistage conglomerate approach, with a standard error of 12.3% and a 90% confidence level.
Fruits, tubers, and vegetables represent the largest portion of the categories present in the households (in kg). Bananas, avocado, papaya, and mango (chosen around 75% each) were the households’ most representative fruit choices. Tubers, potatoes, and plantains are approximately 90% of the household’s preferences. Finally, among vegetables, tomatoes are highly popular (92%), followed by carrots, green beans, and onions, with around 85% present in households each.
Among all social strata, the selected retailer preference is similar. Nanostores are the most frequently visited retailer (37%). Fruvers appear next (21%), followed by market plazas, large supermarkets, and small supermarkets (around 10% each). Moreover, all other retail channels have minimal participation in responses, between 5% and nearly 0%. The average weekly demand per household and food type was calculated using the survey data. Based on the surveys, we computed the weekly demand in three aggregated food categories for each household—fruits, vegetables, and tubers.

4.2. Primary Data Collected with Georeferenced Tools

In addition to the surveys, georeferenced tools were utilized to map the selected area using data from the National Administrative Statistics Department of Colombia (DANE) and the QGIS™ 3.6.16 software.
Considering that the survey was conducted based on a stratified sample of the region, the selected households’ locations represent the regional demand in Sabana Centro. Thus, we used the data to extrapolate the potential demand using the geolocation of the surveyed households. The data obtained from DANE helped identify the population density and the area of the blocks where the households were located. Considering an average of four inhabitants per household (taken from DANE for the region under study), we extrapolated the demand for potential households per block. We called the extrapolated household demand a “demand cluster”, and this demand value was assigned to the household surveyed and used as a reference. Equation (11) provides the calculation made for the demand extrapolation.
d e m a n d   i n   k g h o u s e h o l d w e e k × #   i n h a b m 2 × 1   h o u s e h o l d 4   i n h a b × b l o c k   a r e a   i n   m 2 = k g / w e e k
The equation calculates demand by first taking the weekly household demand in kilograms and multiplying it by the population density of the block, expressed in inhabitants per square kilometer. This value is then multiplied by the average household size in the region (four inhabitants per household) and, finally, by the total area of the block in which the household is located.
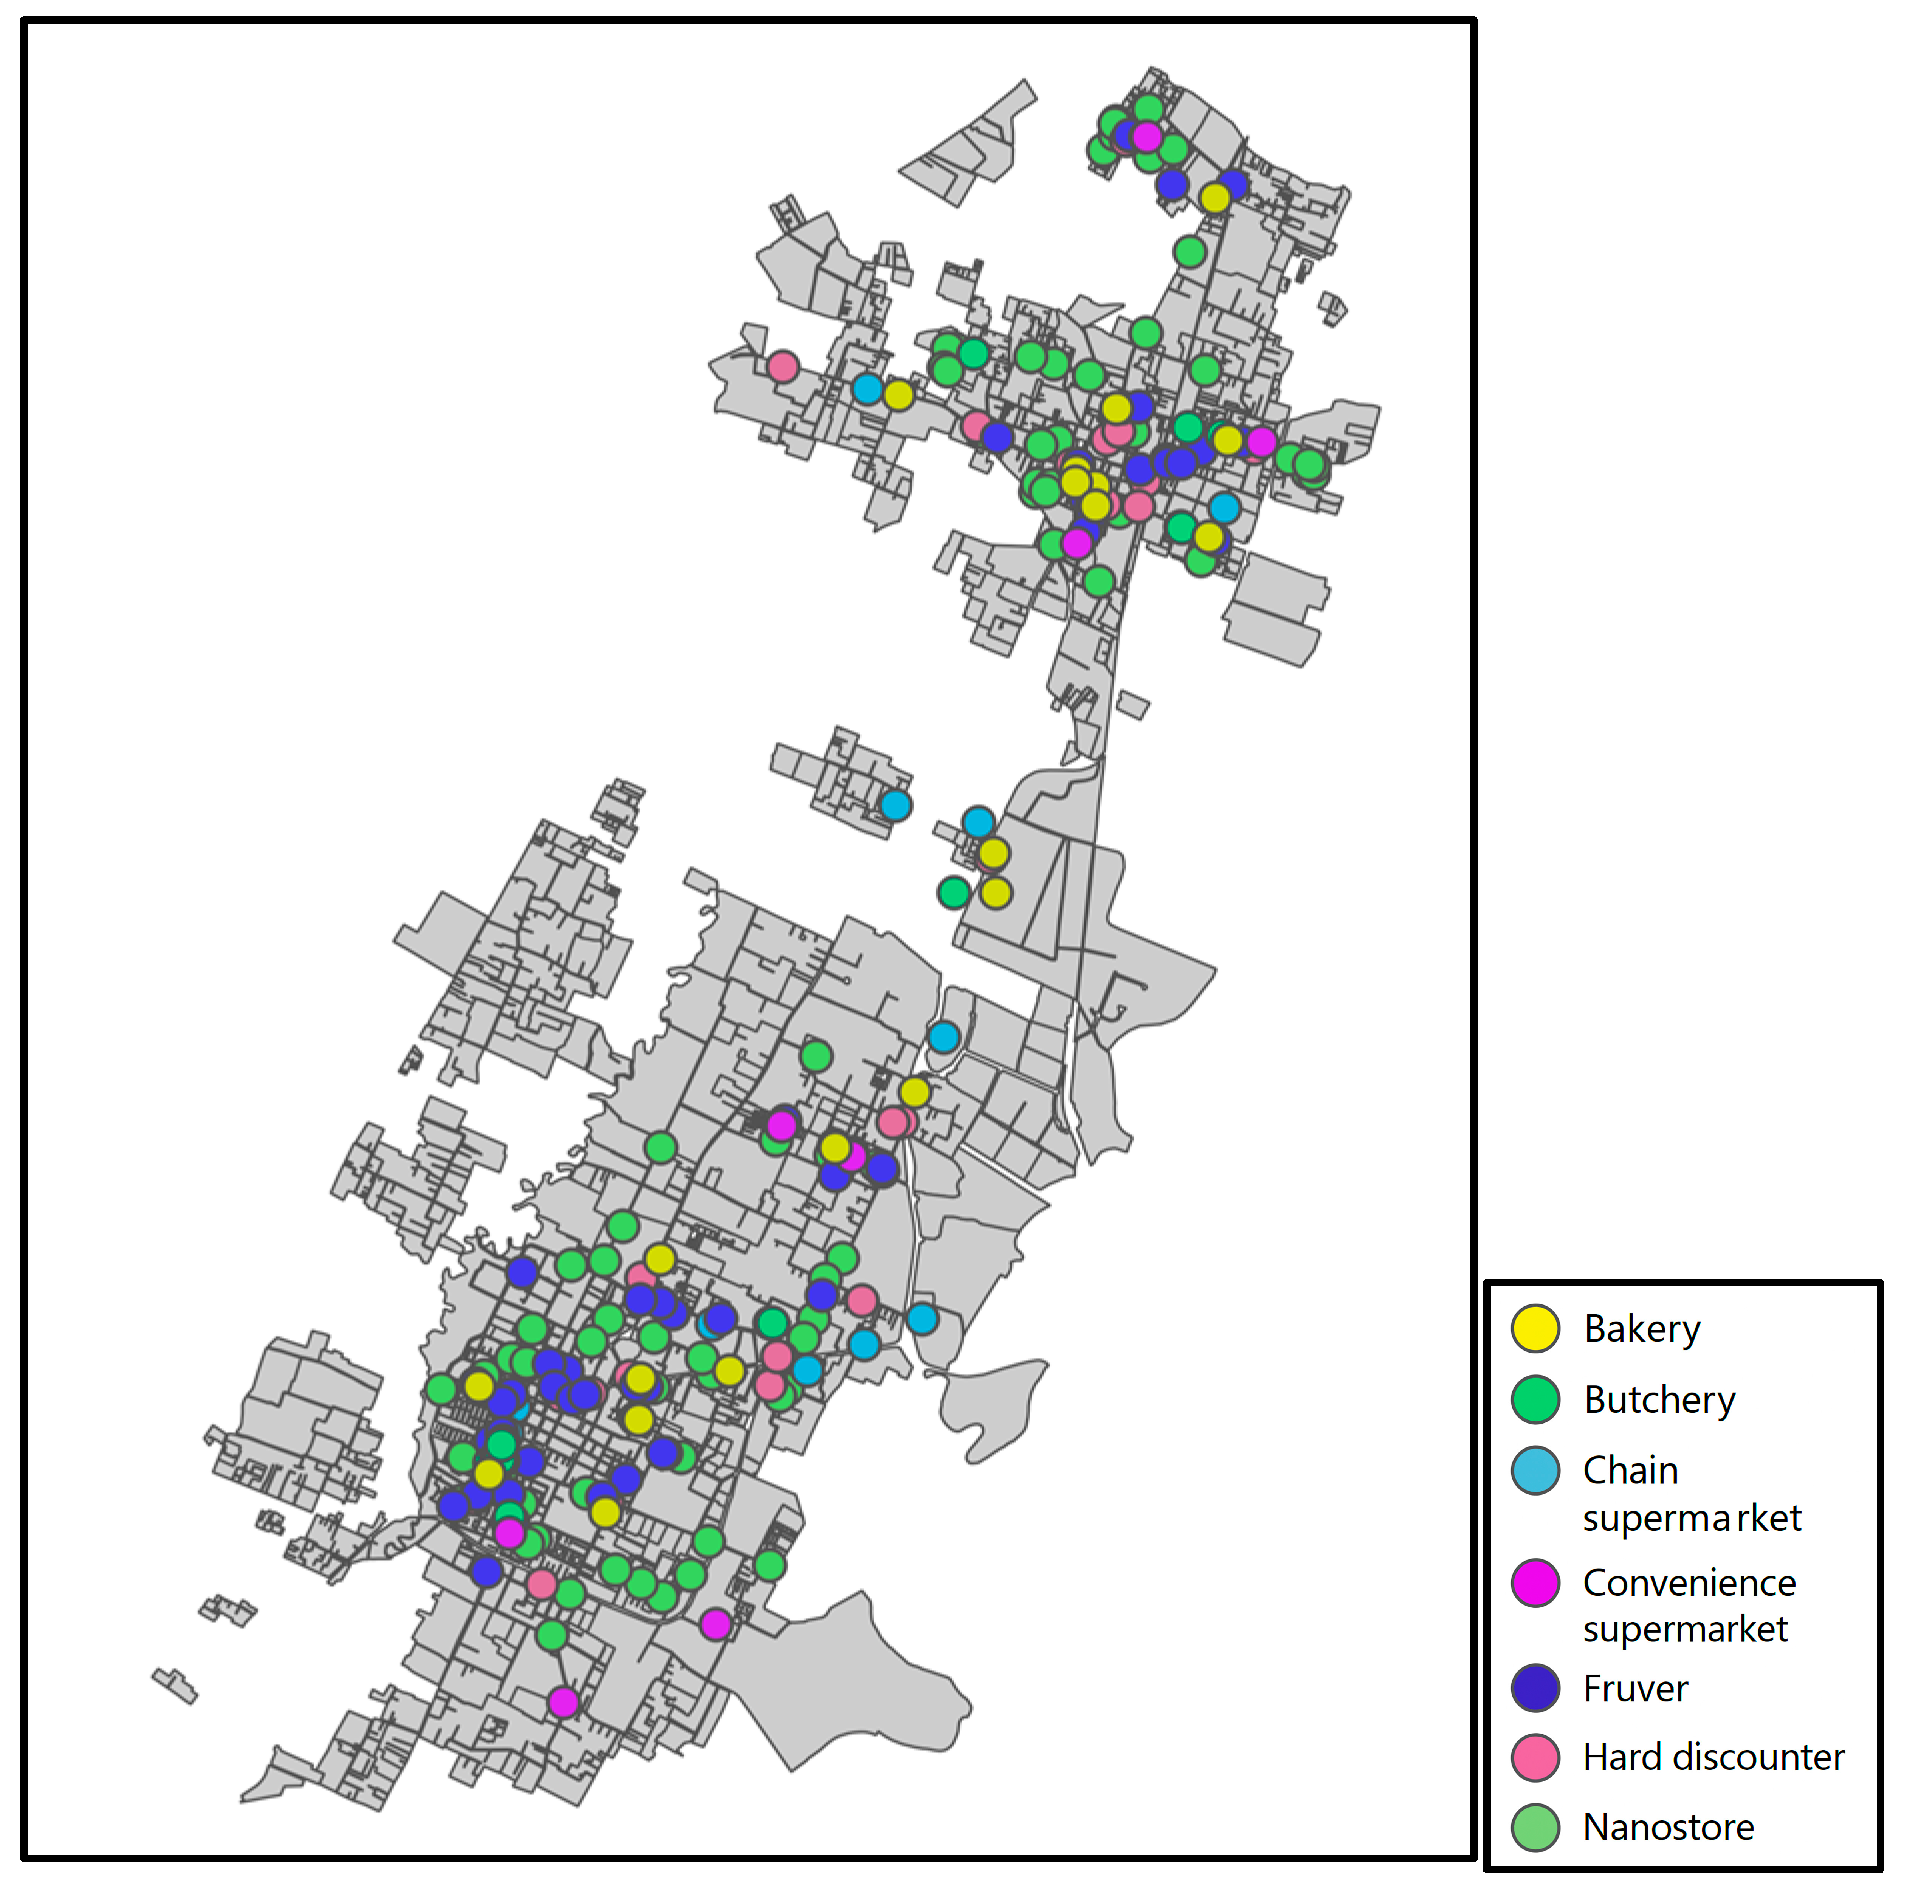
Retailers, including 81 nanostores, 60 fruvers, 17 butcher’s shops (i.e., specialty retailers), eight convenience/grocery stores, nine hard-discounters, and 13 chain supermarkets, were identified and mapped in the region (see Figure 4). Potential locations for the proposed nanostore network were also added to the map.
A distance matrix was generated from the distances between each retailer and the identified demand points from household locations in the region. The resulting matrix indicates that the average distance between households and retailers is 4203 m, with a standard deviation of 2980 m. The shortest observed distance corresponds to an existing nanostore located just 1.36 m from a surveyed household. Among the minimum distances recorded for each type of retailer, convenience markets exhibit the highest minimum distance, at 37 m. In contrast, the closest chain supermarket is situated only 21 m from one of the households in the sample.
Finally, the selling prices are used as an average of the price per kg of each food category per retail channel in the region-defined parameters. This information was primarily collected by reviewing the prices of representatives of each category of retailer in the region. We found that the classification “others” presented high-price variability, and their demand was significantly smaller; thus, we defined that in the model, their selling prices would be, on average, similar to the fruvers. We standardized the selling prices and distances for the utility function.
The average cost per kg of products was defined as 50% of the selling price, as stated in unstructured interviews with retail owners. Similarly, the retail owners expressed that, on average, the fixed cost to maintain the stores per week is around USD 100, which was considered for the model. This cost contemplates the costs related to stocking fresh food in their establishments.
Table 3 summarizes the parameters used for the proposed case study.
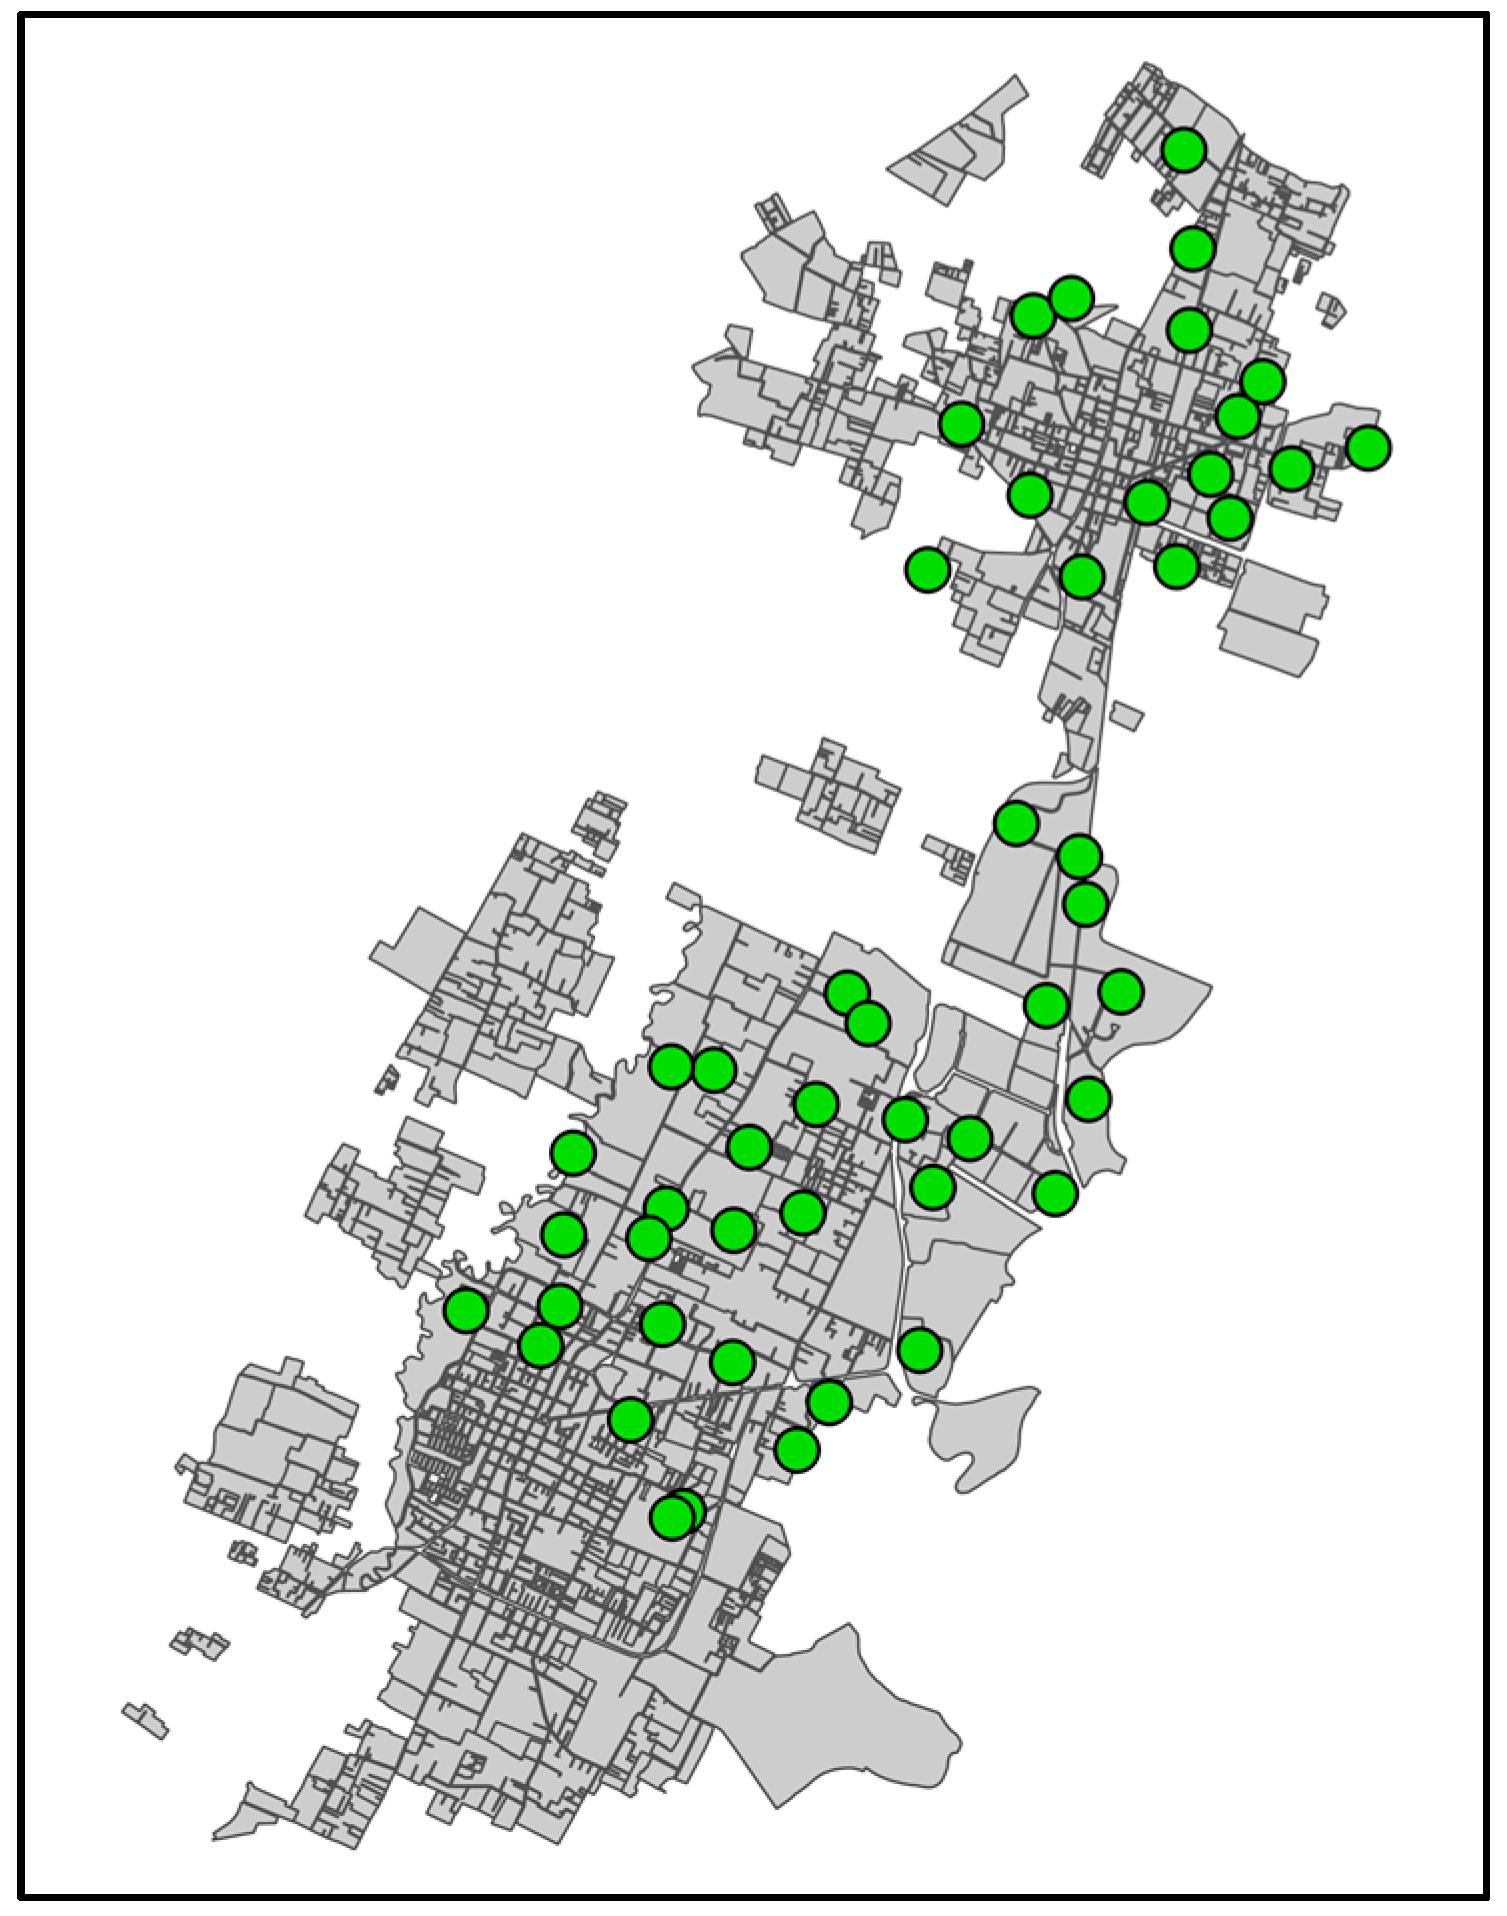
We identified 50 prospective nanostores for establishment (See Figure 5). Employing GIS tools, we segmented the region into 10 areas of comparable size and generated potential locations within each segment. Subsequently, all identified locations underwent thorough evaluation against the actual region, ensuring the viability and feasibility of each selected site.
The results for the multinomial logit per product category and retail channel are presented in the next section, along with insights into the formulation of competitive facility locations.

5. Results

5.1. Logit Model

Two variables were considered to estimate the observed choice utilities V j i , distance in meters to the retailer per product category, and average price in USD per kg of fresh food in each retailer. The regression was conducted for each retail channel, resulting in the coefficient values presented in Table 4.
In the regression results, all of the regression models fit consistently and robustly across all three categories, presenting a stable Rho-square of ≈0.355. The likelihood ratio tests against the null models show that all three regression models significantly improve model fit, confirming that the included variables meaningfully explain household preferences (LR ≈ 575.93, p < 0.05). Across all the models, the alternative specific constants for hard discounters, convenience stores, and nanostores are statistically significant (p < 0.05), which reveals a stable and strong baseline for these retail formats regardless of the type of product. Only the distance to hard discounters presents a significant positive effect in all models (p < 0.05), while the distance to fruvers shows a marginally significant effect, suggesting that spatial proximity matters selectively. The model incorporates other mixed retailers as a reference group for comparison with the primary retailers analyzed. This reference group, categorized as “others,” was assigned a β value of 0, meaning that the β coefficients for nanostores, Fruvers, and various types of supermarkets were determined relative to this “others” group.
For fruits and tubers sold in nanostores, there is a significant utility value for β (with a p-value of 0.1). Distance was not significant for any product category; only the intercept was important to explain the preference for nanostores. All intercepts were significant, particularly for fruits in the same retail channel.
It was surprising to observe that fruvers only show significant factors in vegetables and not in fruits and tubers. For vegetables, the utility showed significance in fruvers with a p-value of 0.1. Furthermore, it is interesting to observe that the results for large supermarkets were not significant in any product category. This may have been driven by the small number of households surveyed that chose this as their main retail channel. Finally, we found that in hard discounters and convenience markets, both price and distance are significant. Interestingly, the intercept for both cases shows a negative relation when the product type is fruits, and a strong positive relation with vegetables and tubers.

5.2. Competitive Facility Location

The results obtained after running the mathematical model in CPLEX Studio 20.1.10 are presented in Table 5. The computer used holds the Windows 11 Home Edition operating system, with an Intel(R) Core(TM) i5 processor, CPU @ 2.50 GHz, 2496 MHz, 4 cores, 8 logical processors. The model is programmed to stop once the optimality gap is <0.01.
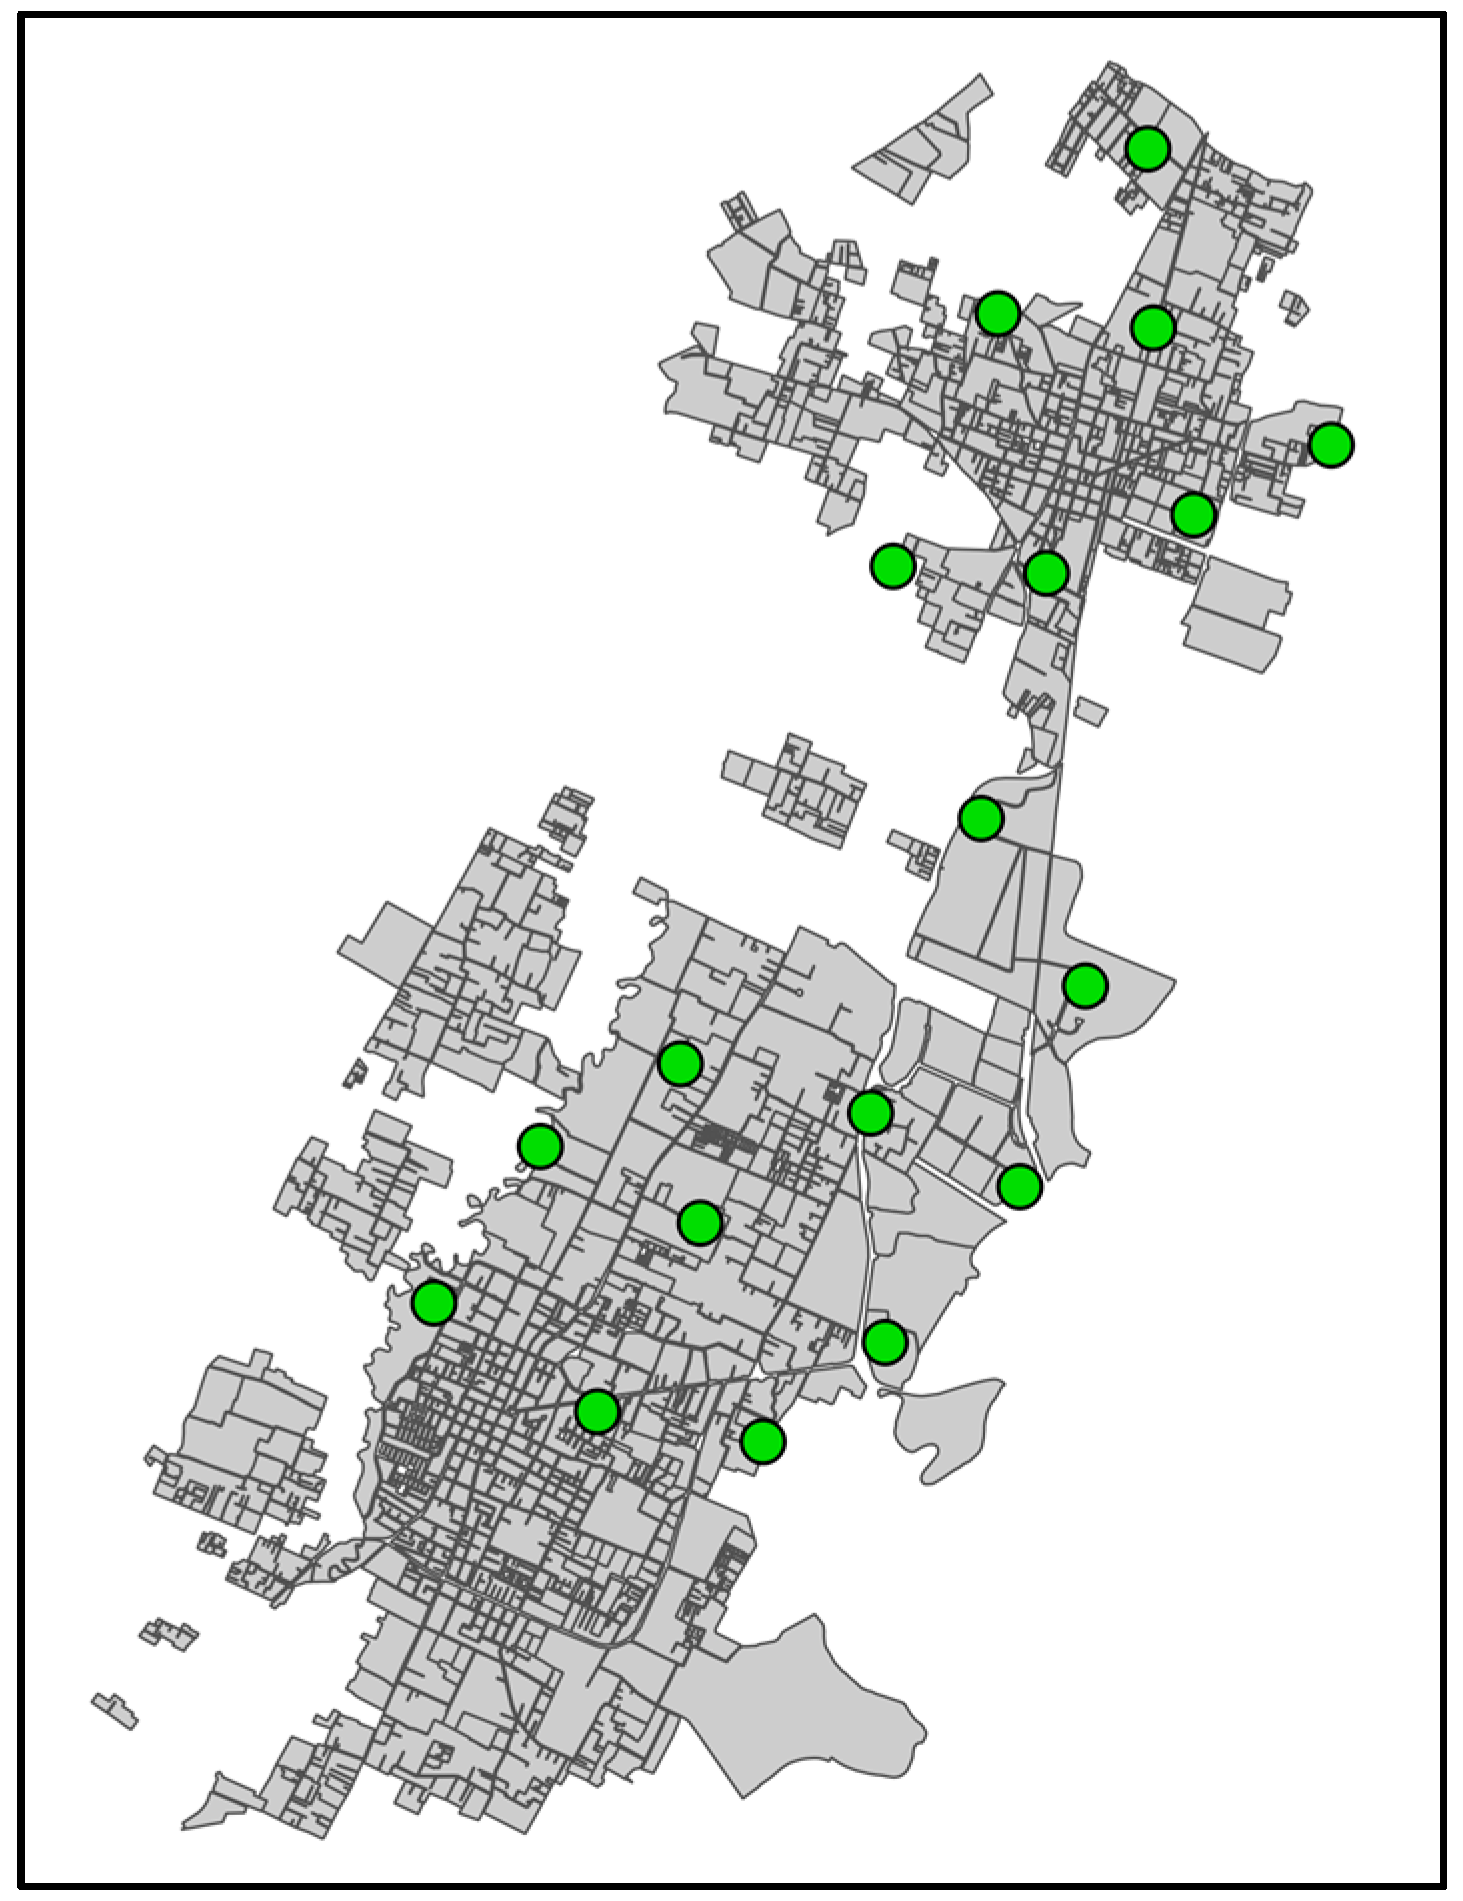
The nanostores to be opened are shown in green in Figure 6. Among all nanostores selected, the total captured weekly demand is 65,401 kg, where around 51% corresponds to fruit sales, about 36% to vegetables, and 13% to tubers. The captured demand represents roughly 16% of the region’s total demand for all three food categories. It can be noticed that the nanostores open covered the municipalities of the Sabana Centro region quite well, covering peripheral regions and avoiding well-served urban centers.

Sensitivity Analysis

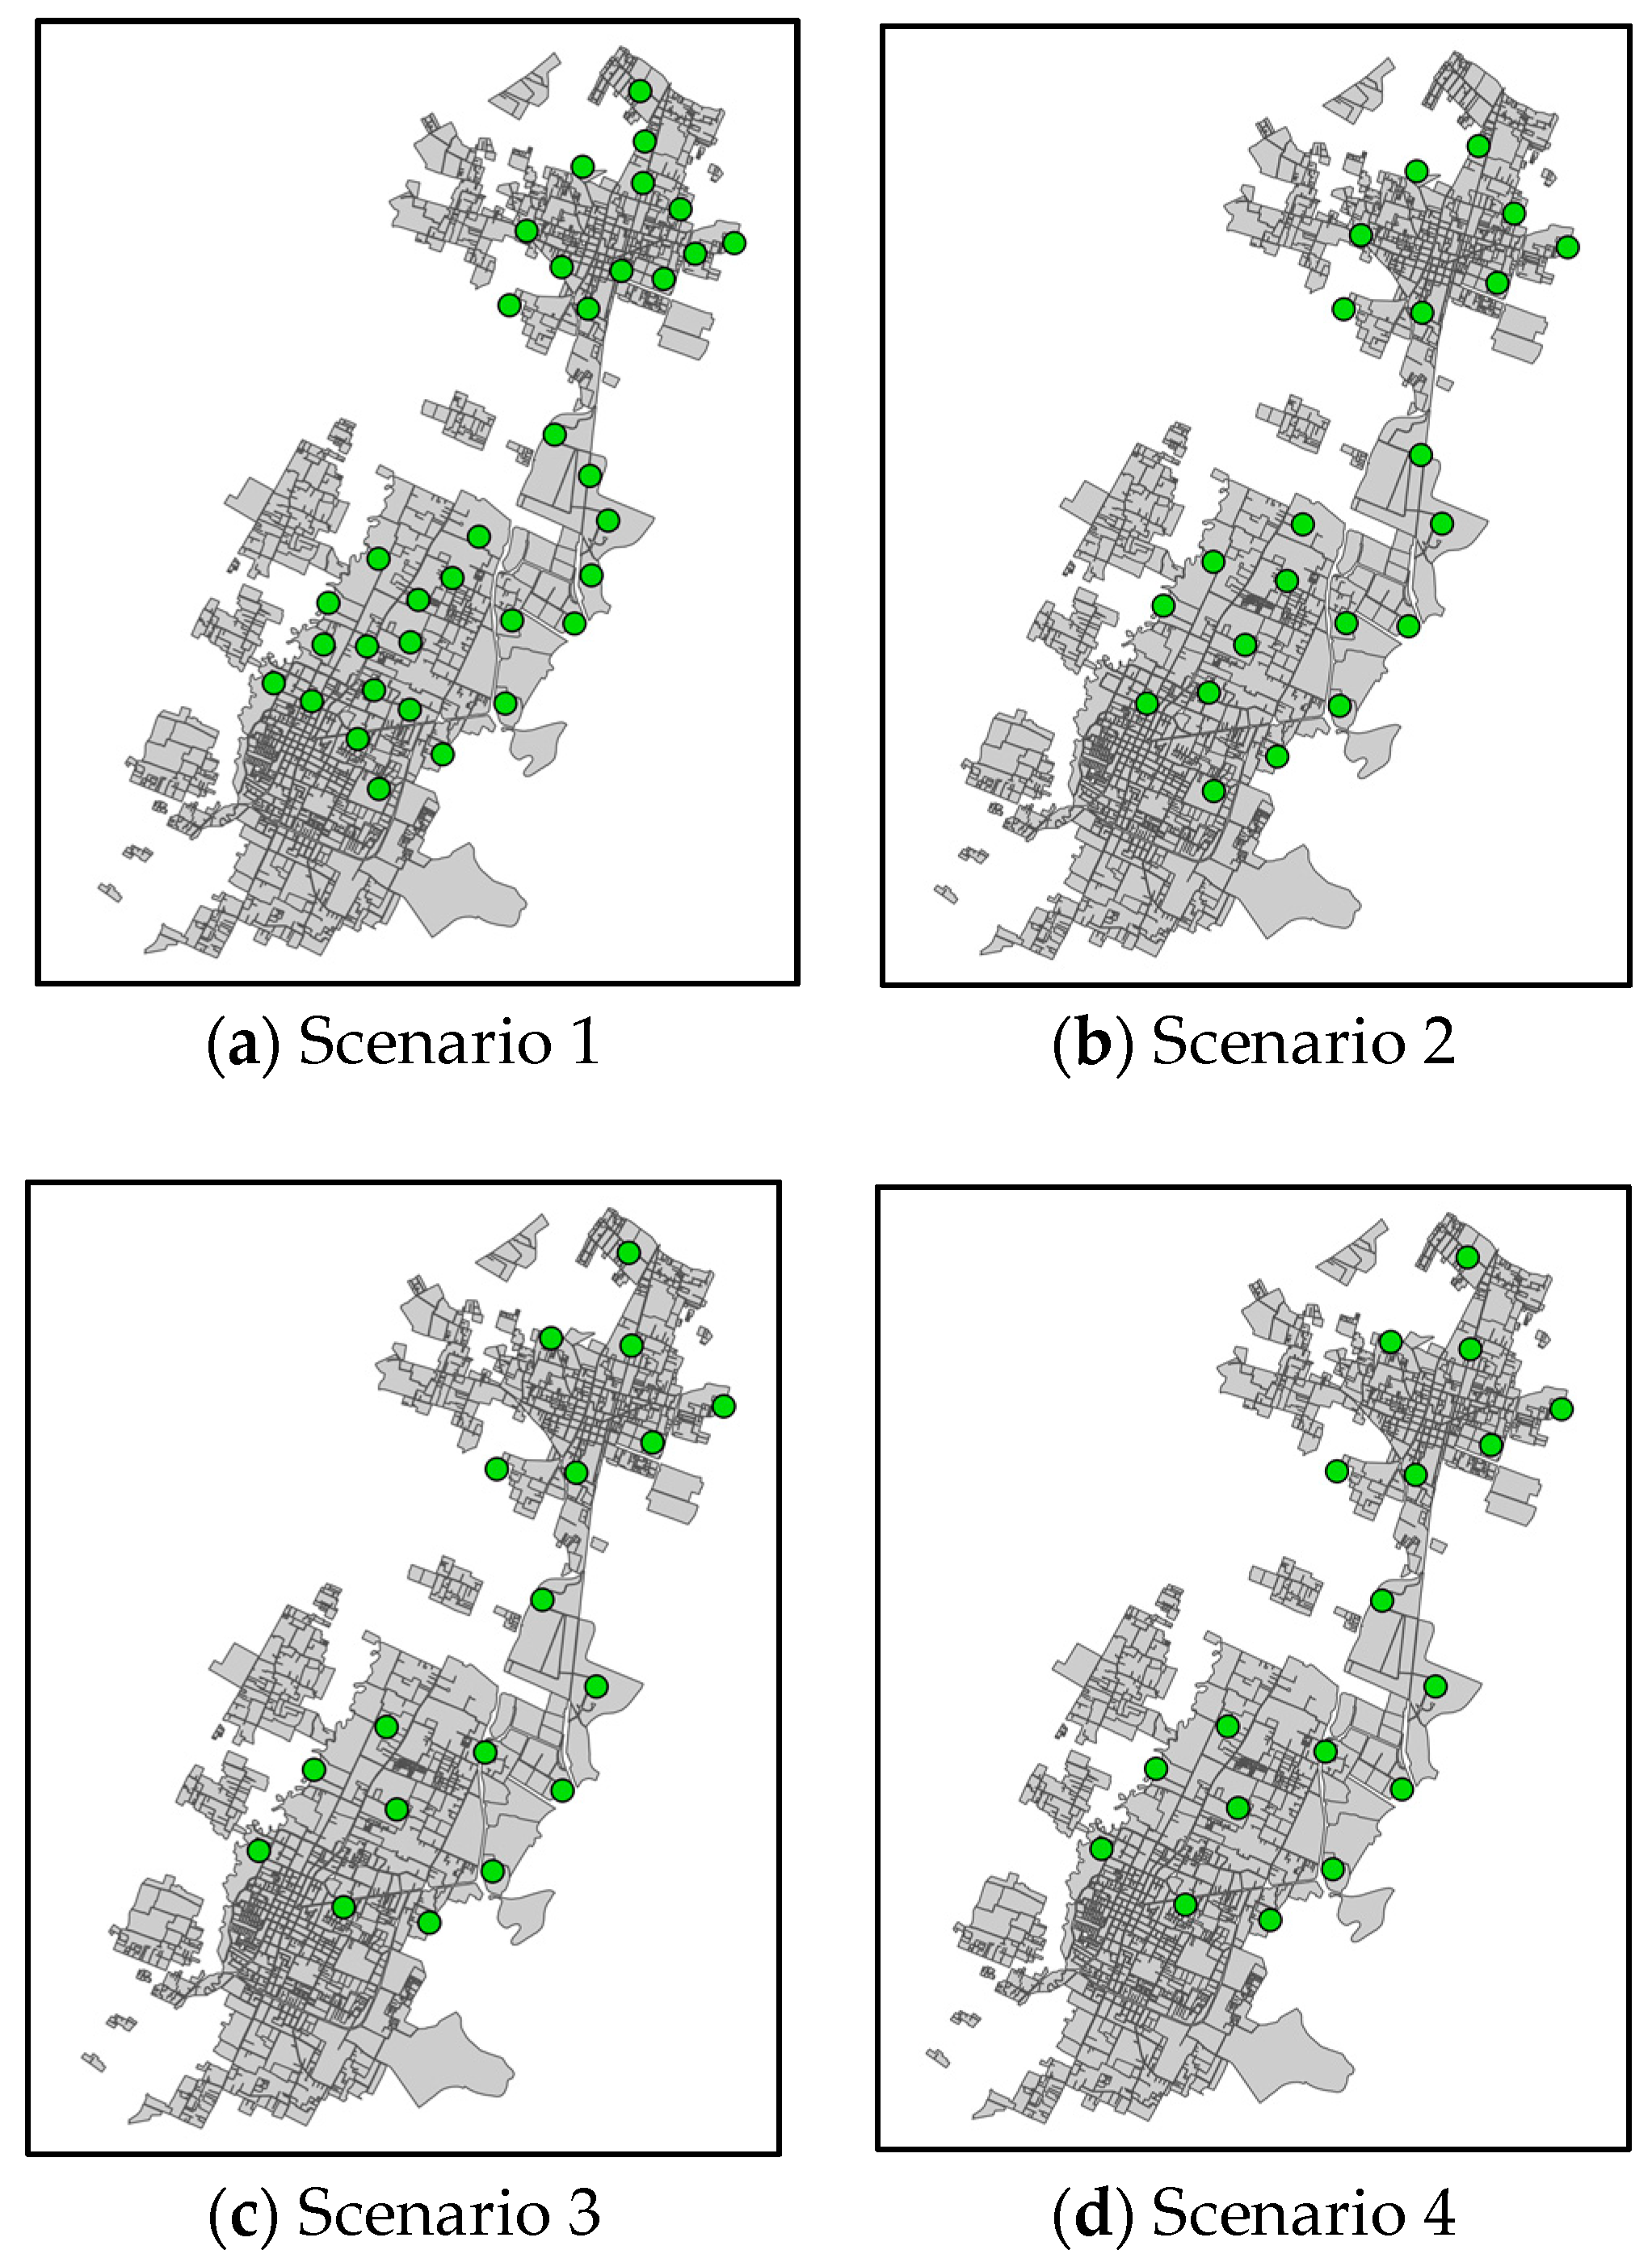
Four additional scenarios were generated for this analysis, as presented in Table 6 with their corresponding results. Two variation types were defined: The variation of the minimal distance among retailers to open, from 1000 m to 750 and 500 m; these distances were defined based on the fact that households are willing to walk or drive these distances to shop for their groceries. Additionally, we defined two demand variations with an increase and a decrease of 25% around the demand found in the data collection. This variation might be explained due to seasonality [67], consumer preferences, among others. However, this variation might still allow households to consume the minimum quantity of fruits, vegetables, and tubers recommended by FAO.
The demand captured per product category is presented in Figure 7 as the average percentage of demand captured per product.
Throughout all scenarios, fruits were the products with the most demand captured per nanostore, representing a steady rate of at least 12% of the total demand among the product categories, even with a 25% demand decrease. This may be explained by the fact that fruits are the most common item among nanostores and other retail channels. The declared demand in the region is higher than the demand for the other food groups. The share of vegetables and tubers did not vary significantly among the scenarios either.
Across the four additional scenarios, 10 nanostores remained open in all cases. Five nanostores opened in 80% of the scenarios, and three in 60%. Twenty-two other nanostores were selected between 20 to 40% of the scenarios. Finally, 10 nanostores were never selected. It was noticed that nanostores that are more frequently open were located in the urban extensions bordering the heavily dense downtown regions of both municipalities. This phenomenon can be attributed to the significant presence of large retailers in downtown areas, as well as the predominance of exclusively large chain supermarkets in the bridge region connecting the municipalities of Chía and Cajicá. Interestingly, Scenarios 3 and 4 selected the same nanostores to open; however, the demand captured for scenario 4 (+25% in demand) is almost two times the demand captured in scenario 3 (−25% in demand). Figure 8 displays the nanostores selected for inclusion in the proposed network under each modeled scenario. To provide further insight into selection patterns, Figure 9 presents a heatmap highlighting the areas where nanostores are most frequently activated across scenarios, revealing spatial trends in optimal location decisions. Figure 9 further reveals that nanostores are more frequently selected when located on the outskirts of the study areas, suggesting a tendency to avoid zones with high retail density and competition.
Finally, we found that, on average, the nanostores network could generate at least USD 20,000 per week. With the most pessimistic scenario, the group of nanostores would generate around USD 15,000/week. This shows that, strategically located, these network configurations gain an interesting market share.

6. Discussion

This study presents the everyday impact of nanostores, which are deeply rooted in the communities they serve. In regions like Sabana Centro, where larger supermarkets may be physically inaccessible, nanostores remain an essential pillar to help access to fresh food. Our results show how critical the presence of the new nanostores’ network was for fresh food purchases, which accounted for around 12 to 20% of the demand captured across all scenarios, providing insights into nanostores’ competitiveness in saturated and underserved markets. In food supply chains, small retailers play a strategic role, as they are usually established in different regions, disregarding the population density in their surroundings. Although nanostores typically offer a restricted food supply to households, they still have a high market share in several areas of developing countries, as reflected in our case study presented. These findings are consistent with research on food deserts and last-mile constraints in emerging markets, where proximity and familiarity with retailers are often more important than price or product variety [4].
Similar to the insights of Kin et al. [15] and Das [68], our results emphasize the importance of designing last-mile food distribution models that prioritize local accessibility by clustering nanostores, especially in low-density regions. Unlike traditional supply chain designs, nanostore networks must be optimized for consumer proximity, low-volume deliveries, and variable inventory replenishment cycles, suggesting the need for hybrid models that combine decentralized microhubs with centralized sourcing strategies.

6.1. Rethinking Efficiency and Scale in Retail Network Design

The most significant challenge for nanostore owners lies in achieving efficient supply and economies of scale to offer competitive prices and guarantee sustainability. A networked structure with centralized purchase processes could improve efficiency and product assortment in underserved regions. The efficiency in the purchase process would occur on two levels, following strategies of established corner store networks such as Oxxo [69]. First, nanostores would achieve economies of scale by grouping their demands and increasing their negotiation power with suppliers. Second, the supply process itself could be improved, generating an internal distribution process to all nanostores involved in the network.
Understanding consumer behavior is critical in this context. Households appear to prioritize proximity to price when choosing where to buy fresh food. Given the perishability, frequency, and small-quantity nature of fresh food purchases, this behavior is expected. Similar to findings from Mogil et al. [4] and Ghosh-Dastidar et al. [23], we observe that the store proximity often outweighs price sensitivity, especially in areas with limited transport access. In line with food desert dynamics, mobility constraints, and trust in informal retailers shape consumer habits.
Notably, the presence of large supermarkets had little influence across product categories. Usually, these retailers are often assumed to be central in food access strategies; however, their role appears limited in this case. This may reflect other issues such as retail accessibility, frequency of shopping habits among lower-income households, or even the trust and familiarity of the community with local nanostore owners. These observations resemble patterns found in other studies of food deserts, where factors such as physical proximity, transportation accessibility, and consumption habits play stronger roles than price alone [14,23].
Furthermore, the low explanatory power of price for nanostores could reflect the prevalence of non-monetary drivers of consumer choice, such as cultural familiarity, social ties, or credit availability, which are not captured in the model. This highlights the importance of incorporating qualitative variables in future discrete choice models, including freshness perception, seller reputation, or informal credit availability.

6.2. Methodological Contributions and Future Research

By integrating the logit model into the facility location problem formulation, we identified the key factors that are relevant for households in the Sabana Centro region. Similar inputs from other regions may provide different perspectives from which to study further. One of the key opportunities for the future is data collection. This study was restricted to information gathered pre-pandemic, which presented a behavior that could have changed over the years. However, the proposed methodology might still help decide how to create food access models for the neighborhoods of any region.
One limitation worth highlighting for future research is the assumption of fixed household demand, which simplifies behavioral dynamics that are likely sensitive to seasonality, income shocks, and price fluctuations. Future extensions of the model could incorporate demand elasticity functions or simulations, for example. Furthermore, while our model focuses exclusively on perishable product categories, a broader analysis could integrate non-perishable or convenience products, which often co-influence store choice. Incorporating factors such as the availability of payment methods, informal supplier networks, and trust in supply chains would enhance the behavioral realism of the model.
The facility location model presented the nanostore location as relevant to ensure better coverage and increase market share. Stores in peripheral regions bordering downtown areas are strategic for these establishments, given that they can cover unsatisfied demand for fruits, vegetables, and tubers that other retailers are not serving. Optimality is reached at a low computational cost using a state-of-the-art linearization of the mixed integer non-linear programming formulation. Scenarios revealed that while the product mix remained relatively stable under variations in demand and distances between nanostores, the specific open store locations shifted in response to unmet local demand.
Given the characteristics and flexibility of the mathematical modeling used in this research, we consider our methodological framework transferable to other emerging market regions, provided that household-level consumption data and georeferenced retail mapping are available, as we did here. In cities with higher mobility or motorization rates, distance decay functions might require recalibration to include additional factors such as travel time or transportation cost [69]. Furthermore, this approach could be extended to analyze combined retail offerings (e.g., fresh food + hygiene products) or adapted to mobile or temporary retail formats. Case studies from Mexico (e.g., Oxxo) or Southeast Asia (e.g., Sari-Sari stores in the Philippines) demonstrate the relevance of hybrid micro-retailer models that achieve competitive performance through spatial optimization and gradual digitalization.
Our findings were consistent with other approaches, where distance played a significant role in modeling customer choice in retail environments [38]. We corroborated that when placing a smaller or less competitive facility, the ideal location is to be closer to the underserved consumers than a larger and more attractive facility. The proximity may capture customers who are initially drawn to the larger retailers but choose to stop at the nanostore instead of commuting the extra distance. Further, we confirmed the findings of [36], where the authors concluded that strategically located retailers can improve accessibility, availability, and affordability of fresh food for vulnerable households.

7. Conclusions

In conclusion, nanostores are a highly competitive actor in the retail landscape to meet household immediate and essential food choices. The model confirms that nanostores strategically located in less densely populated areas have greater competitiveness compared to those situated in central, commercially saturated zones. This spatial configuration enables nanostores to effectively meet the underserved demand in those regions, particularly for fresh food, while also generating utility and economic viability through localized sales.
The model shows the genuine impact that nanostores can generate by improving access to fresh food while remaining economically viable, if their location and scale are well-designed and scaled appropriately. In the baseline scenario, for example, a network of 18 stores met 16% of the region’s demand and brought in close to USD 22,000 per week in profit for the nanostores’ network. When tested, a configuration with shorter distances between stores (500 m) the revenues increased significantly. The network captured 27% of the demand, and profits climbed to about USD 36,000. However, the model suggested the opening of 35 stores instead of 18, which would involve a larger effort in terms of logistics and coordination. On the other hand, the pessimistic scenario with 25% less demand showed a profit decrease to around USD 15,000, even though the number of stores remained as the baseline scenario. That gap between scenarios notes that demand stability and thoughtful spatial design are crucial when seeking a sustainable solution.
Still, it is encouraging to find that nanostores, when supported and well-organized, have the potential to fill a gap that larger chains often leave behind. As case studies show, a structured store network may provide several benefits to reinforce the nanostores’ capabilities to serve those regions. The economies of scale generated in the stores’ supply would allow them to serve their communities better and more efficiently. As for future research, two relevant factors must be studied. First, having a distribution channel in place may not guarantee improved consumption outcomes. Therefore, it is crucial not only to examine potential changes in consumption habits within the targeted regions but also to understand the motivating factors that encourage the community to make healthier food purchasing decisions. Moreover, addressing the significant fragmentation within the supply chain serving nanostores presents a considerable challenge. Thus, conducting detailed cost analysis, considering the nanostores’ capacity, and optimizing logistics operations are essential steps in evaluating the feasibility of the proposed structure.
This study presents its limitations, which require careful consideration. First, it was assumed that there is a fixed and inelastic household demand, which oversimplifies the real-world dynamics that are often sensitive to price fluctuations, seasonal availability, and even specific household budgeting strategies. While this assumption allowed for a more tractable model in the study, it likely overlooks how consumer behavior can be adapted over time. Second, the scope of the analysis was restricted to three fresh food categories, excluding non-perishable goods, prepared foods, or bundled purchases that frequently influence retail choice.
Additionally, while the model captures two key determinant variables (distance and price), it does not account for several other factors that can influence consumer decisions when purchasing fresh food. For example, the product variety, the freshness, the service quality, and the access to payment options are all attributes that can shape the perceived value of a retailer. Future research would benefit from expanding the data collected to reflect these qualitative and behavioral dimensions.
Finally, while this model is particularly suited to fresh produce, it could be extended to non-perishable items or perishable goods with longer shelf lives. A more comprehensive study incorporating a mixed household purchase could offer new insights into how the entire product combination influences households’ retail choices.

Managerial and Policy Implications

We focused on analyzing the case of fresh food and vegetables due to the inherent risks of assortment to nanostores. The study revealed that identifying optimal locations for nanostores with fresh food assortments in the region highlights the need to empower small retailers to serve vulnerable areas more effectively. These insights aim to inspire strategies for nanostores to operate sustainably while better addressing their community needs. For instance, the organization with the public and private sectors to address public policies, targeted training, and other collaborative actions could support nanostores in organizing strategically in clusters, enhancing cash flow, supply management, and operational planning. This proposal draws inspiration from organized micro-retailers like Oxxo; however, similar frameworks among independent nanostores could also produce significant improvements in efficiency and service.
Following the findings of this study, the next stages should involve exploring and designing solutions to facilitate the supply process for nanostores. First, the next studies must explore the implementation of public policies in this food environment to address infrastructural and societal issues. Second, it is important to develop mechanisms that enable nanostores in peripheral and vulnerable regions to easily access fresh and quality food supplies. For instance, municipal governments could incentivize public-private partnerships to support their logistics infrastructure and provide technical assistance for network management and inventory optimization for these small retailers. Additionally, studies directed to design specific strategies to address shelf lifetime and assortment lead times are necessary. On the managerial side, the study shows the importance of data-driven location planning and suggests that nanostores organized into semi-formal networks could emulate the operational success of chains like Oxxo without losing their community-oriented nature.

Author Contributions

Conceptualization, A.C.d.S.-O., D.G.-R., G.M., and C.M.-A.; methodology, A.C.d.S.-O., D.G.-R., G.M., and C.M.-A.; software, A.C.d.S.-O. and D.G.-R.; validation, A.C.d.S.-O., D.G.-R., and G.M.; formal analysis, A.C.d.S.-O., D.G.-R., G.M., and C.M.-A.; investigation, A.C.d.S.-O., D.G.-R., G.M., and C.M.-A.; resources, A.C.d.S.-O., G.M., and C.M.-A. data curation, A.C.d.S.-O. and D.G.-R. writing—original draft preparation, A.C.d.S.-O. and D.G.-R.; writing—review and editing, A.C.d.S.-O., D.G.-R., G.M., C.M.-A., and E.G.-F.; visualization, A.C.d.S.-O. and D.G.-R.; supervision, G.M. and C.M.-A.; project administration, A.C.d.S.-O. and G.M. funding acquisition, A.C.d.S.-O. All authors have read and agreed to the published version of the manuscript.

Funding

This research was funded by Instituto Colombiano de Crédito Educativo y Estudios Técnicos en el Exterior Mariano Ospina Pérez (ICETEX) grant number ING-218-2018. And The APC was funded by the authors.

Institutional Review Board Statement

Ethical review and approval were waived for this study; this type of study is considered “research without risk” due to REASON regulations in Colombia and found Resolution 8430 of 1993, Article 11(a).

Informed Consent Statement

Informed consent was obtained from all subjects involved in the study.

Data Availability Statement

The results of the survey conducted in partnership with RAP-E Región Central are available in the following report: https://regioncentralrape.gov.co/wp-content/uploads/2024/11/Numero1_compressed.pdf (accessed on 24 May 2025).

Acknowledgments

We want to thank the representatives of RAP-E Central Region for their collaboration in the data collection used in this study. Also, we thank the Instituto Colombiano de Crédito Educativo y Estudios Técnicos en el Exterior Mariano Ospina Pérez” (ICETEX) for providing a full scholarship to develop this study. Finally, we would like to thank the Universidad de la Sabana, the Universidad Privada Boliviana, and the Massachusetts Institute of Technology for their support during the development of this study.

Conflicts of Interest

The authors declare no conflict of interest.

References

  1. Migdadi, Y.K.A.A.; Abdel-Rahman, E.H.A. The impact of grocery retail superstores location on the customer’s perceived quality of servicescape in Jordan. Qual. Manag. J. 2020, 27, 120–132. [Google Scholar] [CrossRef]
  2. Ozuduru, B.H.; Guldmann, J.-M. Retail Location and Urban Resilience: Towards a New Framework for Retail Policy. Surv. Perspect. Integr. Environ. Soc. 2013, 6, 1–13. [Google Scholar]
  3. Tuomala, V.; Grant, D.B. Exploring supply chain issues affecting food access and security among urban poor in South Africa. Int. J. Logist. Manag. 2022, 33, 27–48. [Google Scholar] [CrossRef]
  4. Mogil, S.; Hill, E.; Quinlan, J. Characterization of the shopping preferences and needs of low-income consumers living in food deserts. Br. Food J. 2022, 124, 3468–3479. [Google Scholar] [CrossRef]
  5. Boulaksil, Y.; Fransoo, J.C.; Blanco, E.E.; Koubida, S. Understanding the fragmented demand for transportation–Small traditional retailers in emerging markets. Transp. Res. Part A Policy Pract. 2019, 130, 65–81. [Google Scholar] [CrossRef]
  6. Fransoo, J.C.; Blanco, E.; Mejía-Argueta, C. Reaching 50 Million Nanostores: Retail Distribution in Emerging Megacities; CreateSpace: Scotts Valley, CA, USA, 2017. [Google Scholar]
  7. Mejía-Argueta, C.; Benitez-Perez, V.; Salinas-Benitez, S.; Brives, O.; Fransoo, J.C.; Salinas-Navarro, D.; Rangel, G. Nanostores, a Force to Reckon with to Fight Malnutrition. LinkedIn. Available online: https://www.linkedin.com/pulse/nanostores-force-reckon-fight-malnutrition-escf-professors/ (accessed on 17 September 2022).
  8. Salinas-Navarro, D.E.; Vilalta-Perdomo, E.; Michel-Villarreal, R. Empowering Nanostores for Competitiveness and Sustainable Neighbourhoods in Emergent Countries: A GenAI Strategy Ideation Process. Sustainability 2024, 16, 11244. [Google Scholar] [CrossRef]
  9. Paswan, A.; de los Dolores Santarriaga Pineda, M.; Ramirez, F.C.S. Small versus large retail stores in an emerging market—Mexico. J. Bus. Res. 2010, 63, 667–672. [Google Scholar] [CrossRef]
  10. Blanchard, T.C.; Lyson, T.A. Retail Concentration, Food Deserts, and Food Disadvantaged Communities in Rural America. In Remaking the North American Food System: Strategies for Sustainability; Hinrichs, C.C., Lyson, T.A., Eds.; University of Nebraska Press: Lincoln, NE, USA, 2008; pp. 201–215. [Google Scholar]
  11. Jiménez, F.A. La Pandemia Impulsó a las Tiendas de Barrio, El Colombiano. Available online: https://www.elcolombiano.com/negocios/economia/tiendas-de-barrio-en-colombia-favorecidas-por-la-pandemia-DD14601112 (accessed on 18 August 2022).
  12. Rangel-Espinosa, M.F.; Hernández-Arreola, J.R.; Pale-Jiménez, E.; Salinas-Navarro, D.E.; Argueta, C.M. Increasing Competitiveness of Nanostore Business Models for Different Socioeconomic Levels. In Supply Chain Management and Logistics in Emerging Markets; Emerald Publishing: Leeds, UK, 2020; pp. 273–298. [Google Scholar] [CrossRef]
  13. Cannuscio, C.C.; Tappe, K.; Hillier, A.; Buttenheim, A.; Karpyn, A.; Glanz, K. Urban food environments and residents’ shopping behaviors. Am. J. Prev. Med. 2013, 45, 606–614. [Google Scholar] [CrossRef] [PubMed]
  14. Smith, D.M.; Cummins, S.; Taylor, M.; Dawson, J.; Marshall, D.; Sparks, L.; Anderson, A.S. Neighbourhood food environment and area deprivation: Spatial accessibility to grocery stores selling fresh fruit and vegetables in urban and rural settings. Int. J. Epidemiol. 2010, 39, 277–284. [Google Scholar] [CrossRef]
  15. Kin, B.; Ambra, T.; Verlinde, S.; Macharis, C. Tackling Fragmented Last Mile Deliveries to Nanostores by Utilizing Spare Transportation Capacity—A Simulation Study. Sustainability 2018, 10, 653. [Google Scholar] [CrossRef]
  16. Drezner, T.; Drezner, Z.; Suzuki, A. A cover based competitive facility location model with continuous demand. Nav. Res. Logist. 2019, 66, 565–581. [Google Scholar] [CrossRef]
  17. Drezner, T.; Drezner, Z.; Salhi, S. Solving the multiple competitive facilities location problem. Eur. J. Oper. Res. 2002, 142, 138–151. [Google Scholar] [CrossRef]
  18. Drezner, T.; Drezner, Z.; Kalczynski, P. Gradual cover competitive facility location. OR Spectr. 2020, 42, 333–354. [Google Scholar] [CrossRef]
  19. Santorelli, M.L.; Okeke, J.O. Evaluating Community Measures of Healthy Food Access. J. Community Health 2017, 42, 991–997. [Google Scholar] [CrossRef]
  20. Shier, V.; Miller, S.; Datar, A. Heterogeneity in grocery shopping patterns among low-income minority women in public housing. BMC Public Health 2022, 22, 1612. [Google Scholar] [CrossRef]
  21. Wainer, A.; Robinson, L.; Argueta, C.M.; Cash, S.B.; Satin-Hernandez, E.; Chomitz, V.R. At the nexus of grocery access and transportation: Assessing barriers and preferences for alternative approaches to enhancing food access. J. Transp. Health 2023, 33, 101712. [Google Scholar] [CrossRef]
  22. Kim, D.; Lee, C.K.; Seo, D.Y. Food deserts in Korea? A GIS analysis of food consumption patterns at sub-district level in Seoul using the KNHANES 2008–2012 data. Nutr. Res. Pr. 2016, 10, 530–536. [Google Scholar] [CrossRef]
  23. Ghosh-Dastidar, B.; Cohen, D.; Hunter, G.; Zenk, S.N.; Huang, C.; Dubowitz, T. Distance to store, food prices, and obesity in urban food deserts. Am. J. Prev. Med. 2014, 47, 587–595. [Google Scholar] [CrossRef]
  24. da Silva-Ovando, A.C.; Granados-Rivera, D.; Mejía, G.; Mejía-Argueta, C.; Jarrín, J. Spatial Analysis of Fresh Food Retailers in Sabana Centro, Colombia. In Engineering Analytics; CRC Press: Boca Raton, FL, USA, 2021; pp. 235–253. [Google Scholar] [CrossRef]
  25. Davis, K.F.; Downs, S.; Gephart, J.A. Towards food supply chain resilience to environmental shocks. Nat. Food 2021, 2, 54–65. [Google Scholar] [CrossRef]
  26. FAO; IFAD; UNICEF; WFP; WHO. The State of Food Security and Nutrition in the World 2022; FAO: Rome, Italy, 2022. [Google Scholar] [CrossRef]
  27. Escamilla, R.; Fransoo, J.C.; Tang, C.S. Improving Agility, Adaptability, Alignment, Accessibility, and Affordability in Nanostore Supply Chains. Prod. Oper. Manag. 2021, 30, 676–688. [Google Scholar] [CrossRef]
  28. Fan, L.; Baylis, K.; Gundersen, C.; Ploeg, M.V. Does a nutritious diet cost more in food deserts? Agric. Econ. 2018, 49, 587–597. [Google Scholar] [CrossRef]
  29. Levi, R.; Paulson, E.; Perakis, G. Fresh Fruit and Vegetable Consumption: The Impact of Access and Value; MIT Sloan Research Paper No. 5389-18; MIT Sloan: Cambridge, MA, USA, 2020. [Google Scholar] [CrossRef]
  30. Villa, S.; Escamilla, R.; Fransoo, J.C. Supplying Cash-Constrained Retailers: Understanding Shopkeeper Behavior at the Bottom of the Pyramid. Manuf. Serv. Oper. Manag. 2024, 26, 2030–2049. [Google Scholar] [CrossRef]
  31. Ge, J.; Honhon, D.; Fransoo, J.C.; Zhao, L. Supplying to Mom and Pop: Traditional Retail Channel Selection in Megacities. Manuf. Serv. Oper. Manag. 2020, 23, 19–35. [Google Scholar] [CrossRef]
  32. Palomino, K.; Garcia, D.; Berdugo, C. A MILP facility location model with distance value adjustments for demand fulfillment using Google Maps. J. Eng. Res. 2022, 10, 270–291. [Google Scholar] [CrossRef]
  33. Ashtiani, M.G. Competitive location: A state-of-art review. Int. J. Ind. Eng. Comput. 2016, 7, 1–18. [Google Scholar] [CrossRef]
  34. Eiselt, H.A.; Marianov, V.; Drezner, T. Competitive Location Models. In Location Science; Springer International Publishing: Cham, Switzerland, 2015; pp. 365–398. [Google Scholar] [CrossRef]
  35. Drezner, T.; Drezner, Z.; Zerom, D. An extension of the gravity model. J. Oper. Res. Soc. 2022, 73, 2732–2740. [Google Scholar] [CrossRef]
  36. Mejía, G.; Aránguiz, R.; Espejo-Díaz, J.A.; Granados-Rivera, D.; Mejía-Argueta, C. Can street markets be a sustainable strategy to mitigate food insecurity in emerging countries? Insights from a competitive facility location model. Socio-Econ. Plan. Sci. 2023, 86, 101456. [Google Scholar] [CrossRef]
  37. Tong, D.; Ren, F.; Mack, J. Locating farmers’ markets with an incorporation of spatio-temporal variation. Socio-Econ. Plan. Sci. 2012, 46, 149–156. [Google Scholar] [CrossRef]
  38. Drezner, T. A review of competitive facility location in the plane. Logist. Res. 2014, 7, 1–12. [Google Scholar] [CrossRef]
  39. Küçükaydın, H.; Aras, N. Gradual covering location problem with multi-type facilities considering customer preferences. Comput. Ind. Eng. 2020, 147, 106577. [Google Scholar] [CrossRef]
  40. Ahmadi, Z.; Ghezavati, V. Developing a new model for a competitive facility location problem considering sustainability using Markov chains. J. Clean. Prod. 2020, 273, 122971. [Google Scholar] [CrossRef]
  41. Ahn, H.K.; Cheng, S.W.; Cheong, O.; Golin, M.; Van Oostrum, R. Competitive facility location: The Voronoi game. Theor. Comput. Sci. 2004, 310, 457–467. [Google Scholar] [CrossRef]
  42. Byrne, T.; Fekete, S.P.; Kalcsics, J.; Kleist, L. Competitive location problems: Balanced facility location and the One-Round Manhattan Voronoi Game. Ann. Oper. Res. 2023, 321, 79–101. [Google Scholar] [CrossRef]
  43. Höke, B.; Zerri Turgay, Z.; Ünsalan, C.; Küçükaydin, H. Determining and evaluating new store locations using remote sensing andmachine learning. Turk. J. Electr. Eng. Comput. Sci. 2021, 29, 1509–1523. [Google Scholar] [CrossRef]
  44. Plastria, F. Static competitive facility location: An overview of optimization approaches. Eur. J. Oper. Res. 2001, 129, 461–470. [Google Scholar] [CrossRef]
  45. Fernández, J.; Redondo, J.L.; Ortigosa, P.M.; Tóth, B.G. Huff-like stackelberg location problems on the plane. In Springer Optimization and Its Applications; Springer: Berlin/Heidelberg, Germany, 2017; Volume 118, pp. 129–169. [Google Scholar] [CrossRef]
  46. Saidani, N.; Chu, F.; Chen, H. Competitive facility location and design with reactions of competitors already in the market. Eur. J. Oper. Res. 2012, 219, 9–17. [Google Scholar] [CrossRef]
  47. Pahlavani, A.; Saidi-Mehrabad, M. A competitive facility location model with elastic demand and patronising behaviour sensitive to location, price and waiting time. Int. J. Logist. Syst. Manag. 2011, 10, 293–312. [Google Scholar] [CrossRef]
  48. Aboolian, R.; Berman, O.; Krass, D. Competitive facility location and design problem. Eur. J. Oper. Res. 2007, 182, 40–62. [Google Scholar] [CrossRef]
  49. Shan, W.; Yan, Q.; Chen, C.; Zhang, M.; Yao, B.; Fu, X. Optimization of competitive facility location for chain stores. Ann. Oper. Res. 2019, 273, 187–205. [Google Scholar] [CrossRef]
  50. Méndez-Vogel, G.; Marianov, V.; Fernández, P.; Pelegrín, B.; Lüer-Villagra, A. Sequential customers’ decisions in facility location with comparison-shopping. Comput. Oper. Res. 2024, 161, 106448. [Google Scholar] [CrossRef]
  51. Roudsari, A.H.; Wong, K.Y. A bi-objective stochastic single facility location model for a supermarket. Int. J. Serv. Oper. Manag. 2014, 17, 257–279. [Google Scholar] [CrossRef]
  52. Wang, X.; He, H.; Zhang, Z.; Zhao, M. Bi-level optimization model of O2O fresh product experience store location considering service quality. Procedia. Comput. Sci. 2019, 159, 1767–1776. [Google Scholar] [CrossRef]
  53. Satani, N.; Uchida, A.; Deguchi, A.; Ohgai, A.; Sato, S.; Hagishima, S. Commercial facility location model using multiple regression analysis. Comput. Environ. Urban. Syst. 1998, 22, 219–240. [Google Scholar] [CrossRef]
  54. Widaningrum, D.L. GIS and SVM approach for convenience store location analysis. In ICMLC ’17: Proceedings of the 9th International Conference on Machine Learning and Computing; ACM International Conference Proceeding Series; Association for Computing Machinery: New York, NY, USA, 2017; Volume Part F1283, pp. 112–116. [Google Scholar] [CrossRef]
  55. Kalczynski, P.; Drezner, Z.; O’Kelly, M. Multi-facility location models incorporating multipurpose shopping trips. OR Spectr. 2025, 47, 455–475. [Google Scholar] [CrossRef]
  56. Krizek, K.J.; Johnson, P.J. Proximity to trails and retail: Effects on urban cycling and walking. J. Am. Plan. Assoc. 2006, 72, 33–42. [Google Scholar] [CrossRef]
  57. Oded, B.; Celik, P. Sequential facility location with distance dependent demand. J. Oper. Manag. 1982, 2, 261–268. [Google Scholar] [CrossRef]
  58. Na, H.; Kim, S.; Langellier, B.A.; Son, Y.-J. Famers Markets Location-Allocation Framework for Public Health Enhancement. In Proceedings of the IIE Annual Conference and Expo 2015, Nashiville, TN, USA, 30 May–2 June 2015; pp. 1205–1214. Available online: https://experts.arizona.edu/en/publications/famers-markets-location-allocation-framework-for-public-health-en (accessed on 24 May 2025).
  59. Arentze, T.A.; Borgers, A.W.J.; Timmermans, H.J.P. The integration of expert knowledge in decision support systems for facility location planning. Comput. Env. Urban. Syst. 1995, 19, 227–247. [Google Scholar] [CrossRef]
  60. Manatkar, R.P.; Karthik, K.; Kumar, S.K.; Tiwari, M.K. An integrated inventory optimization model for facility location-allocation problem. Int. J. Prod. Res. 2016, 54, 3640–3658. [Google Scholar] [CrossRef]
  61. Train, K.E. Discrete Choice Methods with Simulation; Cambridge University Press: Cambridge, UK, 2001. [Google Scholar] [CrossRef]
  62. Ben-Akiva, M.; Lerman, S. Discrete Choice Analysis: Theory and Application to Travel Demand; The MIT Press: Cambridge, UK, 1985; Available online: https://mitpress.ublish.com/book/discrete-choice-analysis-theory-and-application-to-travel-demand?purchase (accessed on 18 September 2022).
  63. Bierlaire, M. A Short Introduction to Biogeme; Technical Report TRANSP-OR 230620; EPFL: Lausanne, Switzerland, 2023; Available online: https://biogeme.epfl.ch/ (accessed on 24 May 2025).
  64. Haase, K.; Müller, S. A comparison of linear reformulations for multinomial logit choice probabilities in facility location models. Eur. J. Oper. Res. 2014, 232, 689–691. [Google Scholar] [CrossRef]
  65. DANE, Geoportal DANE, Geoportal DANE. Available online: https://geoportal.dane.gov.co/servicios/descarga-y-metadatos/datos-geoestadisticos/?cod=111 (accessed on 5 July 2023).
  66. Ardila Medina, W.A. Categorías y Surtidos Que Caracterizan a Las Tiendas de Barrio de la Localidad de Barrios Unidos de Bogotá, Bogotá. 2016. Available online: https://libros.ucentral.edu.co/index.php/editorialuc/catalog/book/384 (accessed on 17 September 2022).
  67. Hall, J.N.; Moore, S.; Harper, S.B.; Lynch, J.W. Global variability in fruit and vegetable consumption. Am. J. Prev. Med. 2009, 36, 402–409.e5. [Google Scholar] [CrossRef]
  68. Das, S. Delivering Locally Sourced Nutritious Food to Indian Households; Massachusetts Institute of Technology: Cambridge, MA, USA, 2021; Available online: https://dspace.mit.edu/bitstream/handle/1721.1/139392/das-sanchdas-meng-scm-2021-thesis.pdf?sequence=1 (accessed on 4 July 2023).
  69. Matos-Cámara, R.F.; Ochoa-Hernández, M.L.; Huerta-Zavala, P.A. Social Marketing Actions in Small-Format Convenience Stores: The Case of Oxxo in Mexico. In Applying Quality of Life Research; Springer: Cham, Switzerland, 2022; pp. 393–403. [Google Scholar] [CrossRef]
Figure 1. Methodological framework (a) Data collection and accessibility analyses; (b) Data and food purchase analyses; (c) Prescriptive model, calibration, and sensitivity analysis.
Logistics 09 00118 g001
Figure 2. Map of Chía (in green) and Cajicá (in purple) (Scale 1:71,241).
Logistics 09 00118 g002
Figure 3. Surveyed households’ location in blue (Scale 1:70,017).
Logistics 09 00118 g003
Figure 4. Retailers’ location (Scale 1:70,017).
Logistics 09 00118 g004
Figure 5. Potential locations for nanostores in Sabana Centro (Scale 1:6664).
Logistics 09 00118 g005
Figure 6. New nanostores to open in green (Scale 1:71,241).
Logistics 09 00118 g006
Figure 7. Demand captured per product type (in kg).
Logistics 09 00118 g007
Figure 8. Stores open through scenarios in green (Scale 1:71,241).
Logistics 09 00118 g008
Figure 9. Heatmap of stores open through scenarios. (Scale 1:71,241).
Logistics 09 00118 g009
Table 1. Main contributions on application of CFL models in food retailing.
ReferenceType of RetailType of ProductsRegionApproach
Palomino et al. [32]Chain StoreProducts in the food categoryColombiaOptimization of food distribution networks to improve cost efficiency, reduce travel distances, and ensure store demand fulfillment.
Roudsari and Wong [51]Supermarket chainEssential goodsIranIdentification of an optimal supermarket location based on customer proximity and minimal surrounding competition.
Wang et al. [52]O2O Fresh Produce Experience StoreFresh produceUnspecified (conceptual model)Modeling optimal siting for fresh produce stores with integrated retail and delivery functions.
Fernandez [45]SupermarketsGeneral products in supermarketsSpain (“pseudo-real” application)Analysis of store placement strategies to maximize profit under competitive pressure and potential cannibalization.
Satani et al. [53]Convenience storesConvenience goods (including food)JapanEstimation of retail employment and floor area using Huff model parameters for food store trade areas.
Höke et al. [43]Food stores, supermarkets, boutique storesFood ProductsTurkey Site selection for food retailers using remote sensing and AI to enhance revenue prediction.
Widaningrum [54]Convenience StoresConvenience productsIndonesiaSpatial analysis of convenience store placement, emphasizing public facility access and urban form.
Kalczynski et al. [55]Multiple facilities of a chain, grocery storesMiscellaneous productsUnspecified (conceptual model)Location optimization based on multipurpose shopping behavior, improving accuracy and limiting cannibalization.
Kizek and Johnson [56]Neighborhood retail establishmentsFood and beveragesUSAAssessment of proximity effects on active travel near food retailers, informing location guidelines.
Oded and Celik [57]Fast food stores, grocery stores, convenience storesFast food services, groceries, convenience productsUnspecified (conceptual model)Evaluation of new facility impact on network demand, with emphasis on distance-sensitive markets.
Mejía et al. [36]Mobile marketsFresh foodChileEvaluation of the impact of adding new street markets to satisfy the demand of end consumers.
Na et al. [58]Farmer marketsFresh foodUSALocation-allocation framework evaluates how farmers market pricing policies and their interaction with other food retailers to improve food distribution.
Arentze et al. [59]Large-scale retail facilities, retail chains, supply of daily retail goodsDaily retail goodsUnspecified (conceptual model)Integration of expert systems in retail location planning to balance service reach and economic viability.
Table 2. Model’s objective function and constraints.
Model
M a x   z = p i I ( p i p c i p ) q i p i I f i x i (5)
q i p = j J δ j p y j i p i   I , p   P (6)
y j i p = e V j i p   x i   a j i i R e V j i p   x i   a j i + r R / I e V j r p   a j r j J ,   i   I ,   p   P   (7)
d m i n + M a x j i d i h   x i + M a x j i d i h   x h 2 M a x j i d i h i I = 1 , , n 1
h I = 1 + i , , n
j J
(8)
x i { 0,1 } i I (9)
y j i p [ 0 , 1 ] j J ,   i   I ,   p   P   (10)
Table 3. Study Parameters.
ParameterValue
Minimum distance required between two potential new nanostores to be opened1000 m
Maximum distance between household j and potential new nanostore i 12,388 m
Unit cost of fruits for retailer (USD/kg)0.88 USD/kg
Unit cost of vegetables for retailer (USD/kg)0.75 USD/kg
Unit cost of tubers for retailer (USD/kg)0.58 USD/Kg
Unit selling price of fruits (USD/kg)0.98 USD/kg
Unit selling price of vegetables (USD/kg)1.05 USD/kg
Unit selling price of tubers (USD/kg)0.94 USD/Kg
Weekly operation fixed costs of nanostore selected (USD)100 USD
Table 4. Utility estimation for retailers (* p-value < 0.1; ** p-value < 0.05).
Retail ChannelFruitsVegetablesTubers
β 0 β p r i c e β d i s t a n c e β 0 β p r i c e β d i s t a n c e β 0 β p r i c e β d i s t a n c e
Nanostores4.81 **1.17 **−0.074.32 **0.05−0.044.51 **−0.16 *0.02
Fruvers0−0.11−1.680.45 *0.04 *0.110.20.17−0.67
Large supermarkets00.20.310.190.22−0.02−0.360.080.58
Convenience supermarkets−0.63 **1.36 **−0.21 *3.78 **−0.3 **−0.18 *3.99 **−0.05 *−0.26 **
Hard discounters−0.87 **1.36 **0.38 **3.53 **−0.29 **0.39 **3.7 **−0.04 *0.32 **
Table 5. Competitive facility location model results.
DetailValue
Objective function (USD)22,174
Optimality gap0.01
Computational time (h)1.09
New nanostores opened18
Total demand captured (kg/week)65,401
Table 6. Scenario features and main results.
Scenario1234
Minimum distance (m)50075010001000
Demand variation (%)0%0%−25%+25%
Objective function (USD)36,21625,94315,29229,079
Optimality gap0.010.070.010.01
Computational time (h)1.660.550.910.89
New nanostores opened35221818
Total demand captured (Kg/week)110,809
(27% of total demand)
77,186
(19% of total demand)
49,079
(12% of total demand)
81,778
(20% of total demand)
Disclaimer/Publisher’s Note: The statements, opinions and data contained in all publications are solely those of the individual author(s) and contributor(s) and not of MDPI and/or the editor(s). MDPI and/or the editor(s) disclaim responsibility for any injury to people or property resulting from any ideas, methods, instructions or products referred to in the content.