


Supply Chain Sustainability Drivers: Identification and Multi-Criteria Assessment


Abstract
1. Introduction
2. Literature Review
- Factors, drivers, and barriers of supply chain sustainability, as well as indicators of their assessment.
- Models and methods for assessing the performance and sustainability of different types of supply chains.
- Case studies of supply chains of different types and structures.
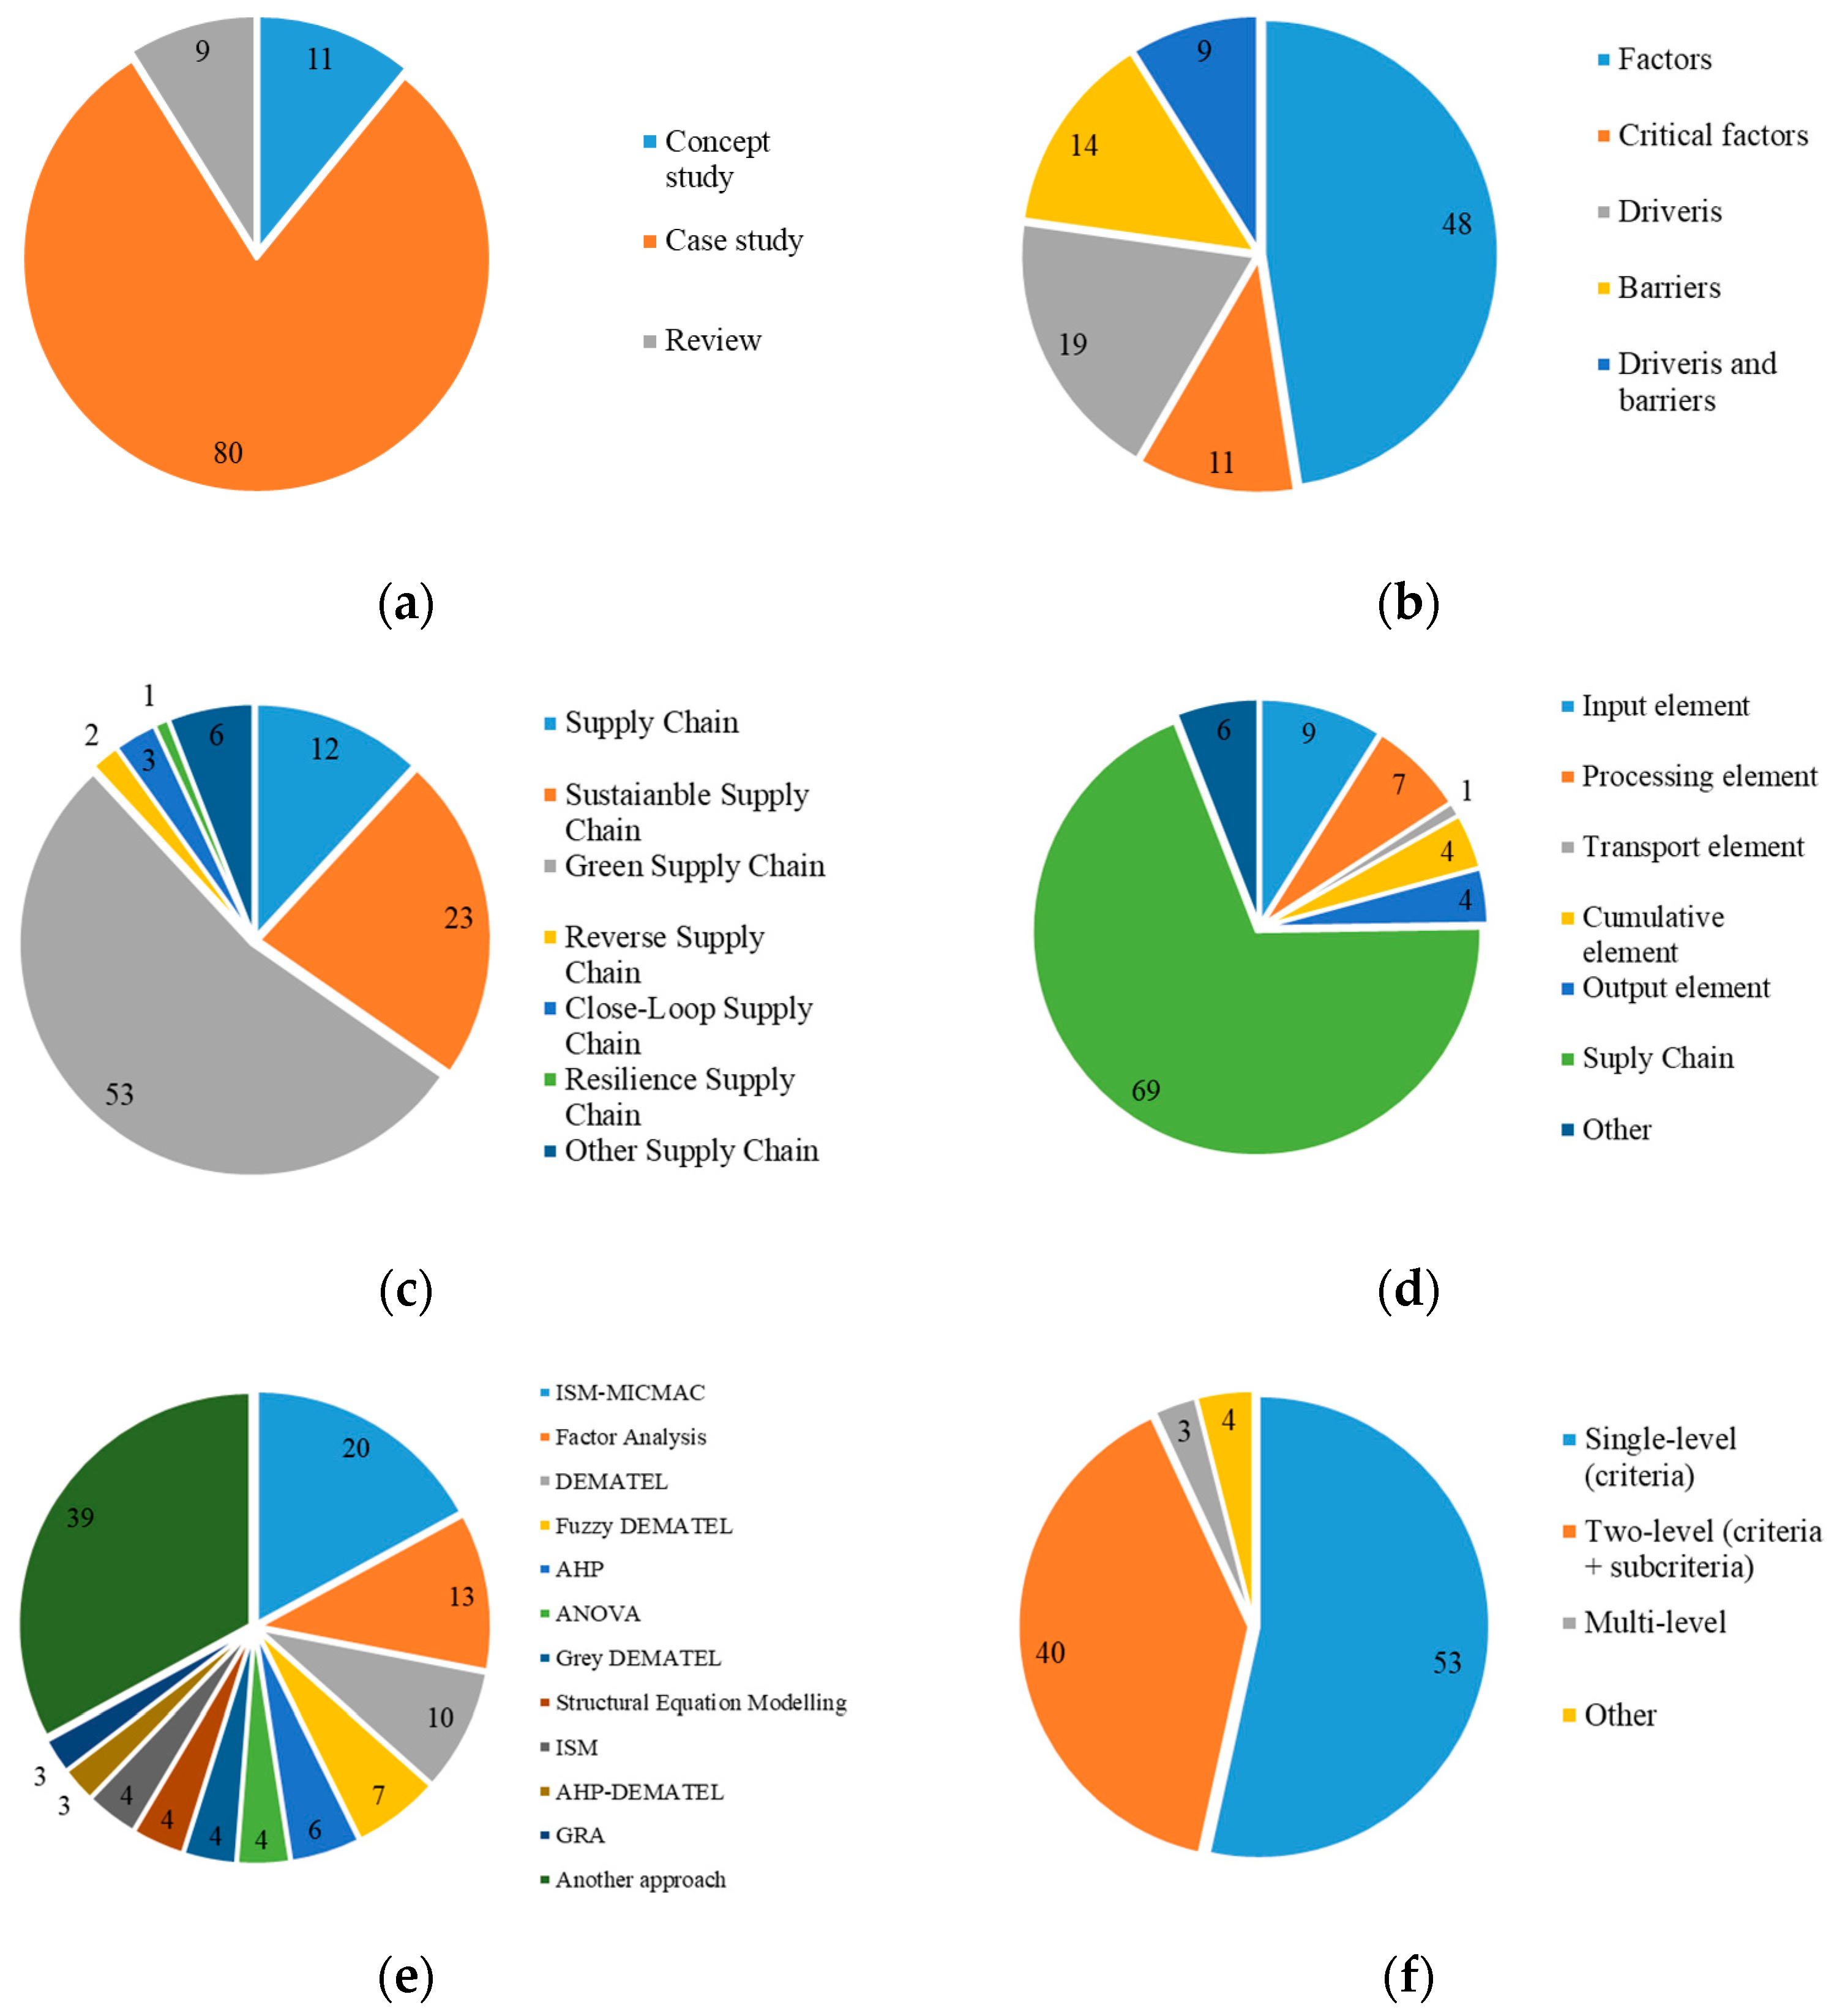
- The generalized results of the analysis are presented in Figure 2.
2.1. Review Papers
2.2. Conceptual Studies
2.3. Case Studies

| № | Supply Chain Type | Object of Assessment | Number of Factors, Drivers, and Barriers | Methods and Models ** | Reference |
|---|---|---|---|---|---|
| 1 | Supply Chain | Other | 7 factors | — | [9] |
| 2 | Green Supply Chain | Supply Chain | 7 factors | DEMATEL | [19] |
| 3 | Green Supply Chain | Other | 13 factors | ISM | [20] |
| 4 | Sustainable Supply Chain | Supply Chain | 7 drivers/40 sub-drivers | SLR | [8] |
| 5 | Green Supply Chain | Supply Chain | 8 factors | ISM-MICMAC | [12] |
| 6 | Green Supply Chain | Other | 8 factors | FQFD | [22] |
| 7 | Sustainable Supply Chain | Supply Chain | 8 factors | SLR/Survey | [23] |
| 8 | Green Supply Chain | Supply Chain | 16 factors | DEMATEL | [4] |
| 9 | Green Supply Chain | Supply Chain | 5 factors/24 sub-factors | AHP-DEMATEL | [47] |
| 10 | Other Supply Chain | Other | 6 factors | ANOVA | [48] |
| 11 | Green Supply Chain | Supply Chain | 11 drivers | ISM-MICMAC | [49] |
| 12 | Green Supply Chain | Supply Chain | 4 critical factors/20 sub-factors | Factor Analysis | [50] |
| 13 | Other Supply Chain | Other | 3 factors/20 sub-factors | ANOVA | [51] |
| 14 | Reverse Supply Chain | Supply Chain | 5 factors/25 sub-factors | AHP-DEMATEL | [30] |
| 15 | Close-Loop Supply Chain | Other | 3 drivers | — | [52] |
| 16 | Supply Chain | Supply Chain | 3 drivers | AHP | [53] |
| 17 | Green Supply Chain | Processing element * | 12 drivers | Fuzzy AHP | [35] |
| 18 | Sustainable Supply Chain | Supply Chain | 13 factors | Hesitant Fuzzy DEMATEL | [54] |
| 19 | Sustainable Supply Chain | Supply Chain | 14 critical factors/62 sub-factors | SLR | [11] |
| 20 | Sustainable Supply Chain | Supply Chain | 4 critical factors/20 sub-factors | Factor Analysis | [55] |
| 21 | Resilience Supply Chain | Supply Chain | 15 factors | Data Analysis | [29] |
| 22 | Sustainable Supply Chain | Supply Chain | 15 factors | SLR | [15] |
| 23 | Supply Chain | Supply Chain | 4 factors/43 sub-factors | SLR | [10] |
| 24 | Supply Chain | Supply Chain | 4 barriers | Cross-case Analysis | [3] |
| 25 | Green Supply Chain | Supply Chain | 5 barriers/22 sub-barriers | AHP | [56] |
| 26 | Reverse Supply Chain | Supply Chain | 7 drivers/37 sub-drivers 7 barriers/36 sub-barriers | SLR | [16] |
| 27 | Green Supply Chain | Supply Chain | 2 drivers/10 sub-drivers 2 barriers/15 sub-barriers | SLR | [17] |
| 28 | Green Supply Chain | Supply Chain | 19 factors | ISM-MICMAC | [57] |
| 29 | Green Supply Chain | Supply Chain | 26 critical factors | ISM-MICMAC | [58] |
| 30 | Sustainable Supply Chain | Supply Chain | 7 critical factors/32 sub-factors | ISM-MICMAC | [59] |
| 31 | Green Supply Chain | Input element * | 7 drivers/26 sub-drivers | Structural Equation Modelling | [31] |
| 32 | Sustainable Supply Chain | Input element * | 7 drivers/17 sub-drivers | Hierarchical Linear Modelling | [32] |
| 33 | Green Supply Chain | Supply Chain | 8 drivers | ISM-MICMAC | [60] |
| 34 | Green Supply Chain | Input element * | 5 factors/15 sub-factors | Fuzzy DEMATEL | [61] |
| 35 | Green Supply Chain | Processing element * | 13 drivers | ISM-MICMAC | [36] |
| 36 | Other Supply Chain | Output element * | 8 barriers | Grey DEMATEL | [43] |
| 37 | Sustainable Supply Chain | Supply Chain | 7 factors | GRA | [62] |
| 38 | Green Supply Chain | Supply Chain | 18 barriers | ISM | [63] |
| 39 | Green Supply Chain | Output element * | 13 factors | DEMATEL | [44] |
| 40 | Green Supply Chain | Supply Chain | 5 factors/28 sub-factors | Factor Analysis | [64] |
| 41 | Green Supply Chain | Supply Chain | 15 barriers | Hierarchical Clustering Analysis | [65] |
| 42 | Green Supply Chain | Supply Chain | 4 critical factors/25 sub-factors | DEMATEL | [66] |
| 43 | Green Supply Chain | Supply Chain | 10 factors | Fuzzy DEMATEL | [67] |
| 44 | Green Supply Chain | Transport element * | 10 factors | Statistical Analysis | [41] |
| 45 | Green Supply Chain | Supply Chain | 5 drivers/18 sub-drivers | ANOVA | [68] |
| 46 | Green Supply Chain | Transport element * | 8 drivers | Structural Equation Modelling | [42] |
| 47 | Green Supply Chain | Supply Chain | 3 drivers | Survey | [69] |
| 48 | Sustainable Supply Chain | Input element * | 17 drivers and 16 barriers | Delphi method | [33] |
| 49 | Supply Chain | Supply Chain | 32 drivers | Structural Equation Modelling | [70] |
| 50 | Green Supply Chain | Supply Chain | 26 barriers | ISM-MICMAC | [71] |
| 51 | Green Supply Chain | Supply Chain | 14 barriers | ISM-MICMAC | [72] |
| 52 | Green Supply Chain | Input element * | 10 barriers | ISM-MICMAC | [45] |
| 53 | Sustainable Supply Chain | Supply Chain | 13 barriers | ISM-MICMAC | [73] |
| 54 | Supply Chain | Processing element * | 10 drivers and 4 barriers | — | [37] |
| 55 | Green Supply Chain | Supply Chain | 7 drivers and 10 barriers | STI | [74] |
| 56 | Sustainable Supply Chain | Supply Chain | 11 drivers | Fuzzy TISM-MICMAC | [75] |
| 57 | Sustainable Supply Chain | Supply Chain | 3 drivers/11 sub-drivers 2 barriers/11 sub-barriers | — | [76] |
| 58 | Green Supply Chain | Supply Chain | 5 barriers/22 sub-barriers | DEMATEL-Fuzzy EDAS-Fuzzy COPRAS | [77] |
| 59 | Supply Chain | Supply Chain | 14 barriers | Fuzzy TISM-MICMAC | [78] |
| 60 | Close-Loop Supply Chain | Supply Chain | 4 drivers/21 sub-drivers | Grey DEMATEL | [27] |
| 61 | Close-Loop Supply Chain | Supply Chain | 6 barriers/35 sub-barriers | Pythagorean Fuzzy AHP-DEMATEL | [28] |
| 62 | Green Supply Chain | Supply Chain | 9 critical factors | Fuzzy DEMATEL | [79] |
| 63 | Green Supply Chain | Output element * | 25 critical factors | Factor Analysis | [46] |
| 64 | Other Supply Chain | Supply Chain | 6 factors | GRA | [80] |
| 65 | Supply Chain | Supply Chain | 6 factors/13 sub-factors | AHP | [81] |
| 66 | Supply Chain | Supply Chain | 2 factors/10 sub-factors | — | [24] |
| 67 | Other Supply Chain | Transport element * | 7 critical factors | — | [21] |
| 68 | Sustainable Supply Chain | Supply Chain | 15 factors | ISM-MICMAC | [18] |
| 69 | Sustainable Supply Chain | Supply Chain | 7 drivers and 6 barriers | AHP-TOPSIS, AHP-COPRAS | [82] |
| 70 | Green Supply Chain | Input element * | 11 factors | SWARA-TOPSIS | [83] |
| 71 | Green Supply Chain | Supply Chain | 3 critical factors/12 sub-factors | DEMATEL | [84] |
| 72 | Green Supply Chain | Supply Chain | 12 factors | ISM-MICMAC | [85] |
| 73 | Green Supply Chain | Input element * | 5 factors/17 sub-factors | ANP-TOPSIS | [86] |
| 74 | Green Supply Chain | Supply Chain | 5 drivers | SEM | [87] |
| 75 | Other Supply Chain | Supply Chain | 3 factors/8 sub-factors | ANP-AHP-BOCR | [25] |
| 76 | Green Supply Chain | Processing element * | 5 factors/21 sub-factors | Confirmatory factor analysis | [88] |
| 77 | Sustainable Supply Chain | Processing element * | 4 factors/14 sub-factors | Factor Analysis | [38] |
| 78 | Supply Chain | Processing element * | 3 barriers/15 sub-barriers | Grey DEMATEL | [39] |
| 79 | Supply Chain | Cumulative element * | 15 factors | ISM-MICMAC | [40] |
| 80 | Other Supply Chain | Transport element * | 8 factors | — | [89] |
| 81 | Green Supply Chain | Supply Chain | 5 drivers/17 sub-drivers | Fuzzy DEMATEL-Fuzzy ANP-Fuzzy TOPSIS | [90] |
| 82 | Green Supply Chain | Supply Chain | 3 barriers/13 sub-barriers | AHP-ELECTRE I | [91] |
| 83 | Sustainable Supply Chain | Input element * | 3 factors/10 sub-factors | DEMATEL | [92] |
| 84 | Green Supply Chain | Input element * | 5 factors/21 sub-factors | AHP | [34] |
| 85 | Green Supply Chain | Input element * | 15 factors | Fuzzy DEMATEL | [26] |
| 86 | Supply Chain | Supply Chain | 10 factors | Grey system theory | [1] |
| 87 | Sustainable Supply Chain | Supply Chain | 22 drivers and 19 barriers | SLR | [5] |
| 88 | Green Supply Chain | Supply Chain | 2 drivers/6 sub-drivers | — | [7] |
| 89 | Green Supply Chain | Supply Chain | 7 factors/47 sub-factors | Factor Analysis | [93] |
| 90 | Green Supply Chain | Supply Chain | 5 drivers and 5 barriers | STI | [94] |
| 91 | Sustainable Supply Chain | Supply Chain | 4 factors/12 sub-factors | Factor Analysis | [95] |
| 92 | Green Supply Chain | Supply Chain | 15 drivers | ISM-MICMAC-DEMATEL | [96] |
| 93 | Green Supply Chain | Supply Chain | 20 drivers and 16 pressures | — | [97] |
| 94 | Green Supply Chain | Supply Chain | 4 factors/12 sub-factors | Statistical Analysis | [98] |
| 95 | Green Supply Chain | Supply Chain | 3 factors/12 sub-factors | Statistical Analysis | [99] |
| 96 | Sustainable Supply Chain | Processing element * | 4 factors/8 sub-factors | SEM-ANN | [100] |
| 97 | Sustainable Supply Chain | Supply Chain | 10 factors | ISM | [101] |
| 98 | Green Supply Chain | Supply Chain | 6 factors/30 sub-factors | Interval Type-2 Fuzzy AHP | [102] |
| 99 | Sustainable Supply Chain | Supply Chain | 11 factors | TISM-MICMAC | [103] |
| 100 | Green Supply Chain | Supply Chain | 22 factors | Duo-theme DEMATEL | [104] |
| 101 | Sustainable Supply Chain | Supply Chain | 20 drivers | FDM-FISM-ANP-TOPSIS | [105] |
3. Methodology for Assessing Sustainable Supply Chain Drivers
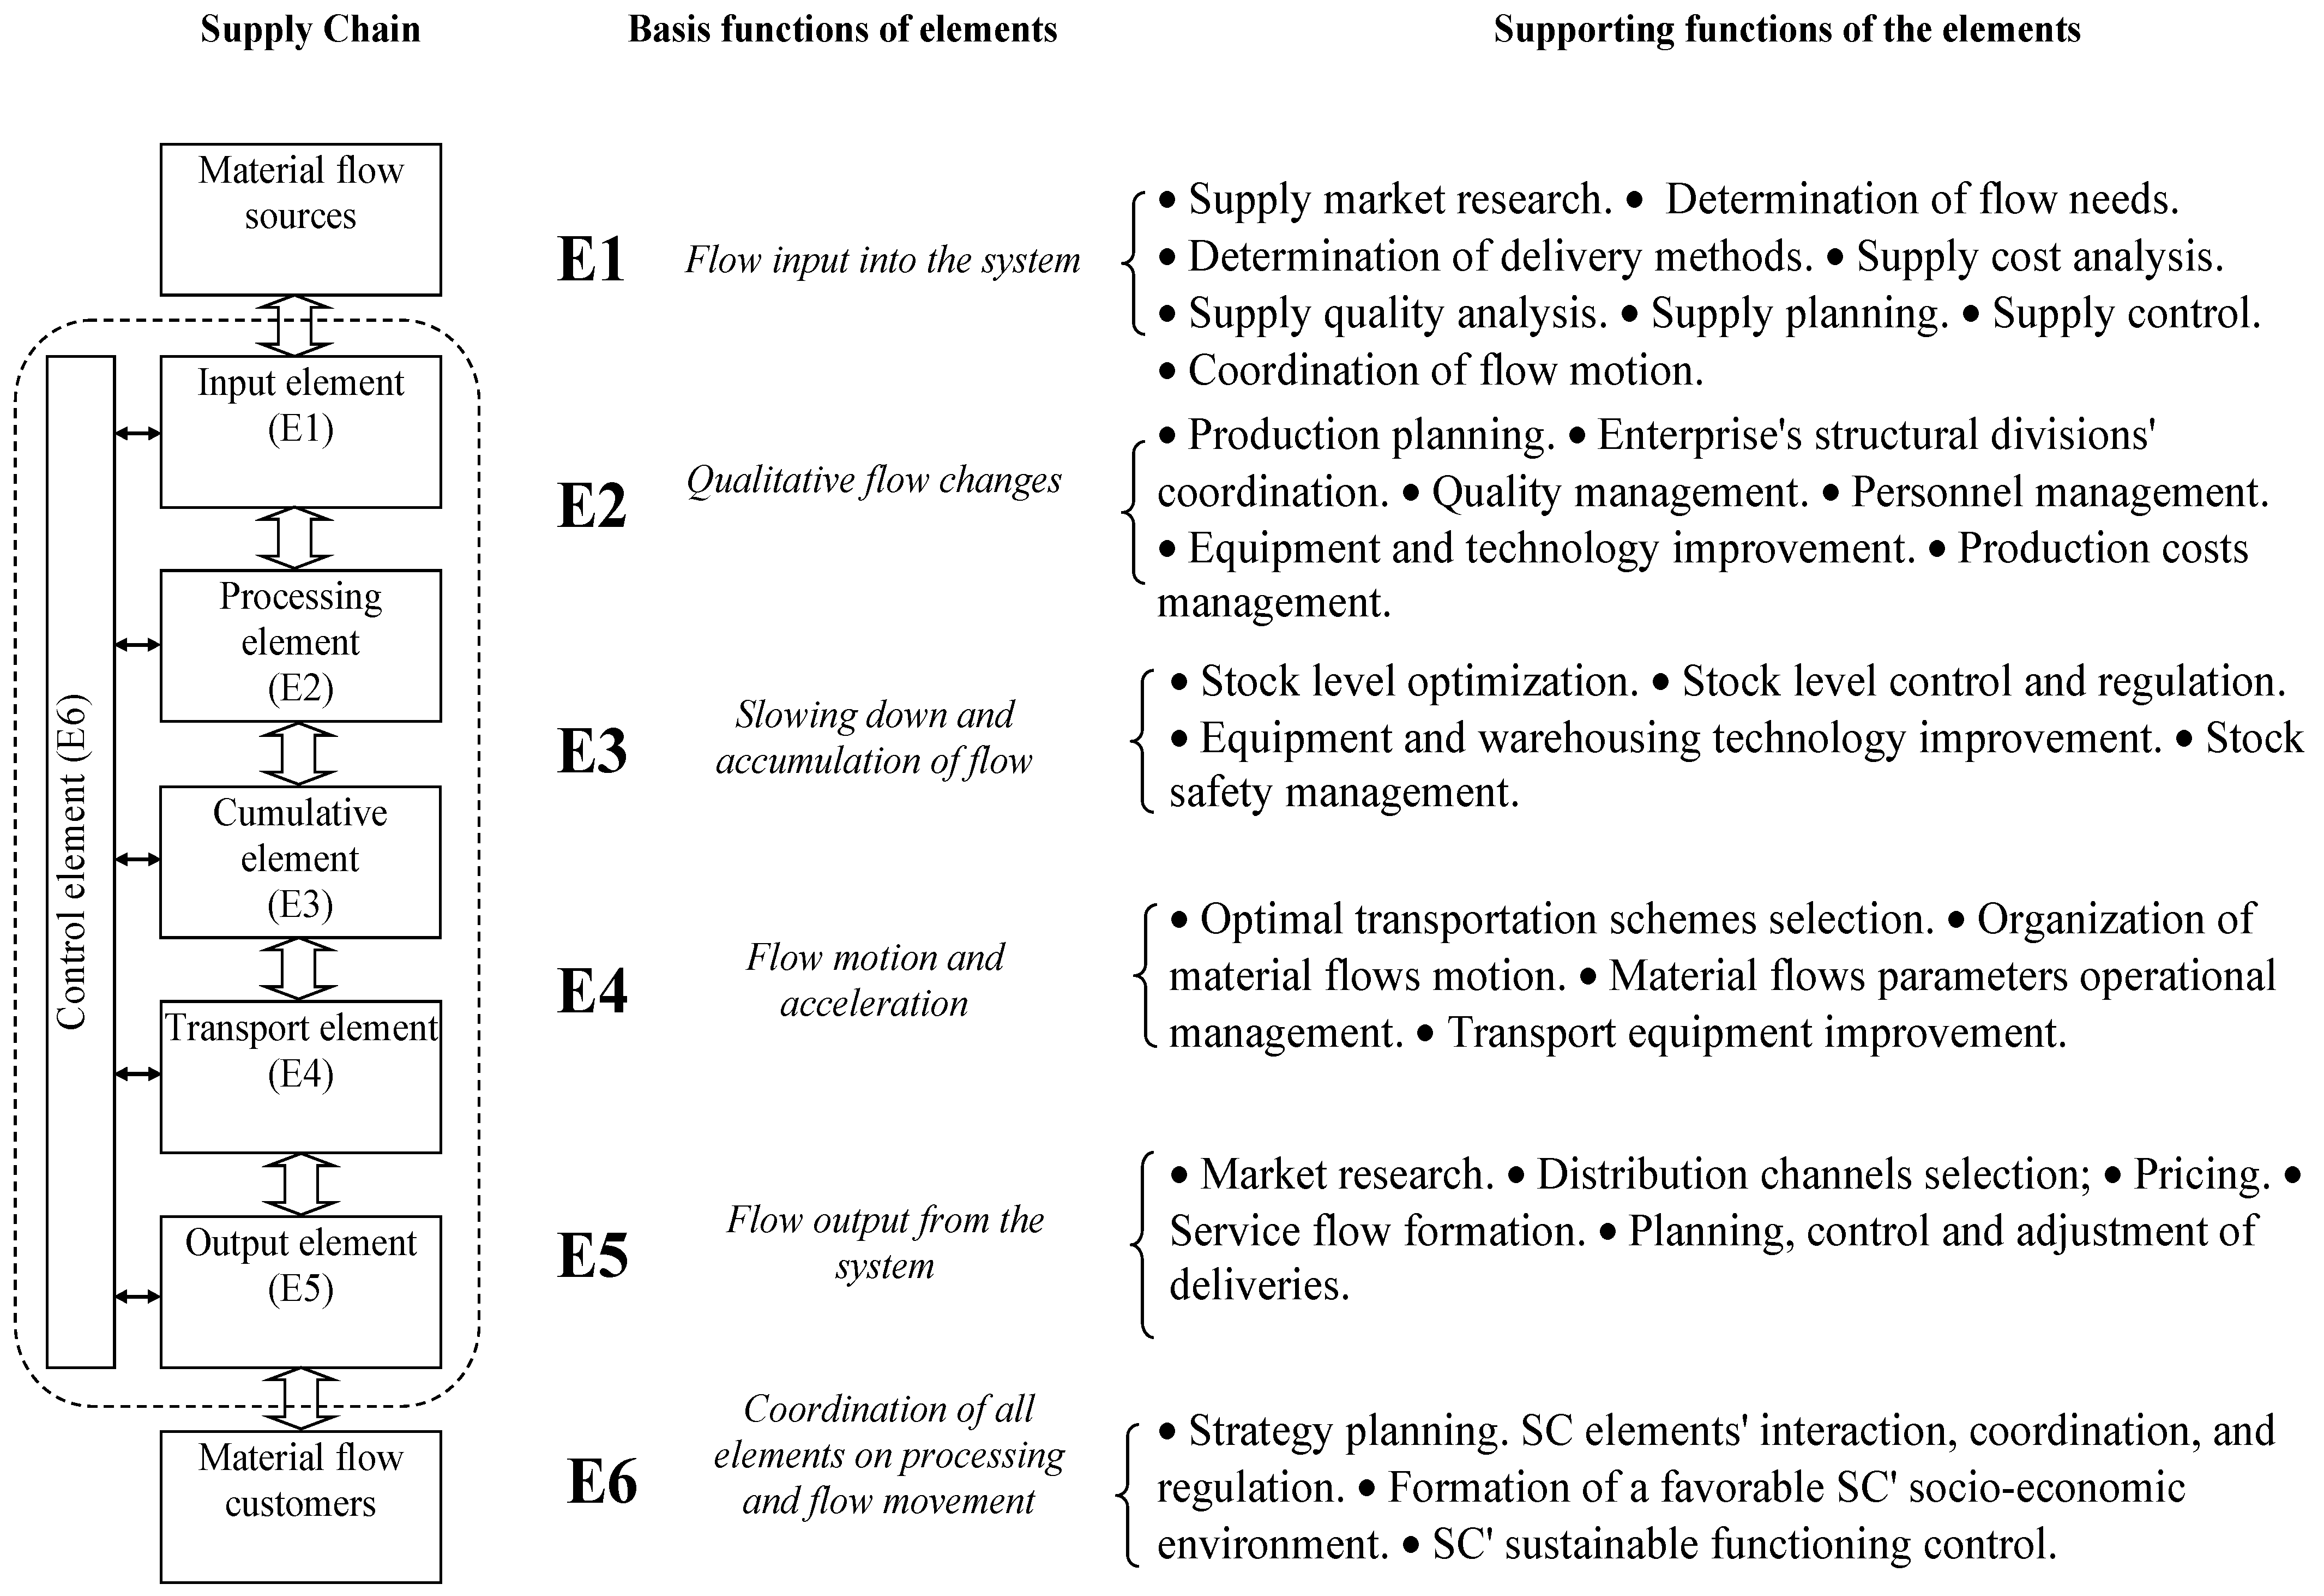
3.1. Sustainable Supply Chain Structure and Functions
- Input element (E1): the entry of material flows into the system, i.e., the purchase of necessary raw materials, supplies, or services.
- Processing element (E2): changes the qualitative properties of material flows and is involved in their transformation from raw materials into finished products.
- Cumulative element (E3): regulation of the speed of material flows as a result of their inhibition, accumulation, and storage.
- Transport element (E4): acceleration and movement of material flows.
- Output element (E5): withdrawal of material flow from the system, marketing, and distribution of finished products and services.
- Control element (E6): provides information and financial connection between other LS elements, controlling their functions and operations and regulating the promotion of information and financial flows in the SC.
3.2. Sustainable Supply Chain Driver System
3.3. Sustainable Supply Chain Drivers’ Assessment Criteria System
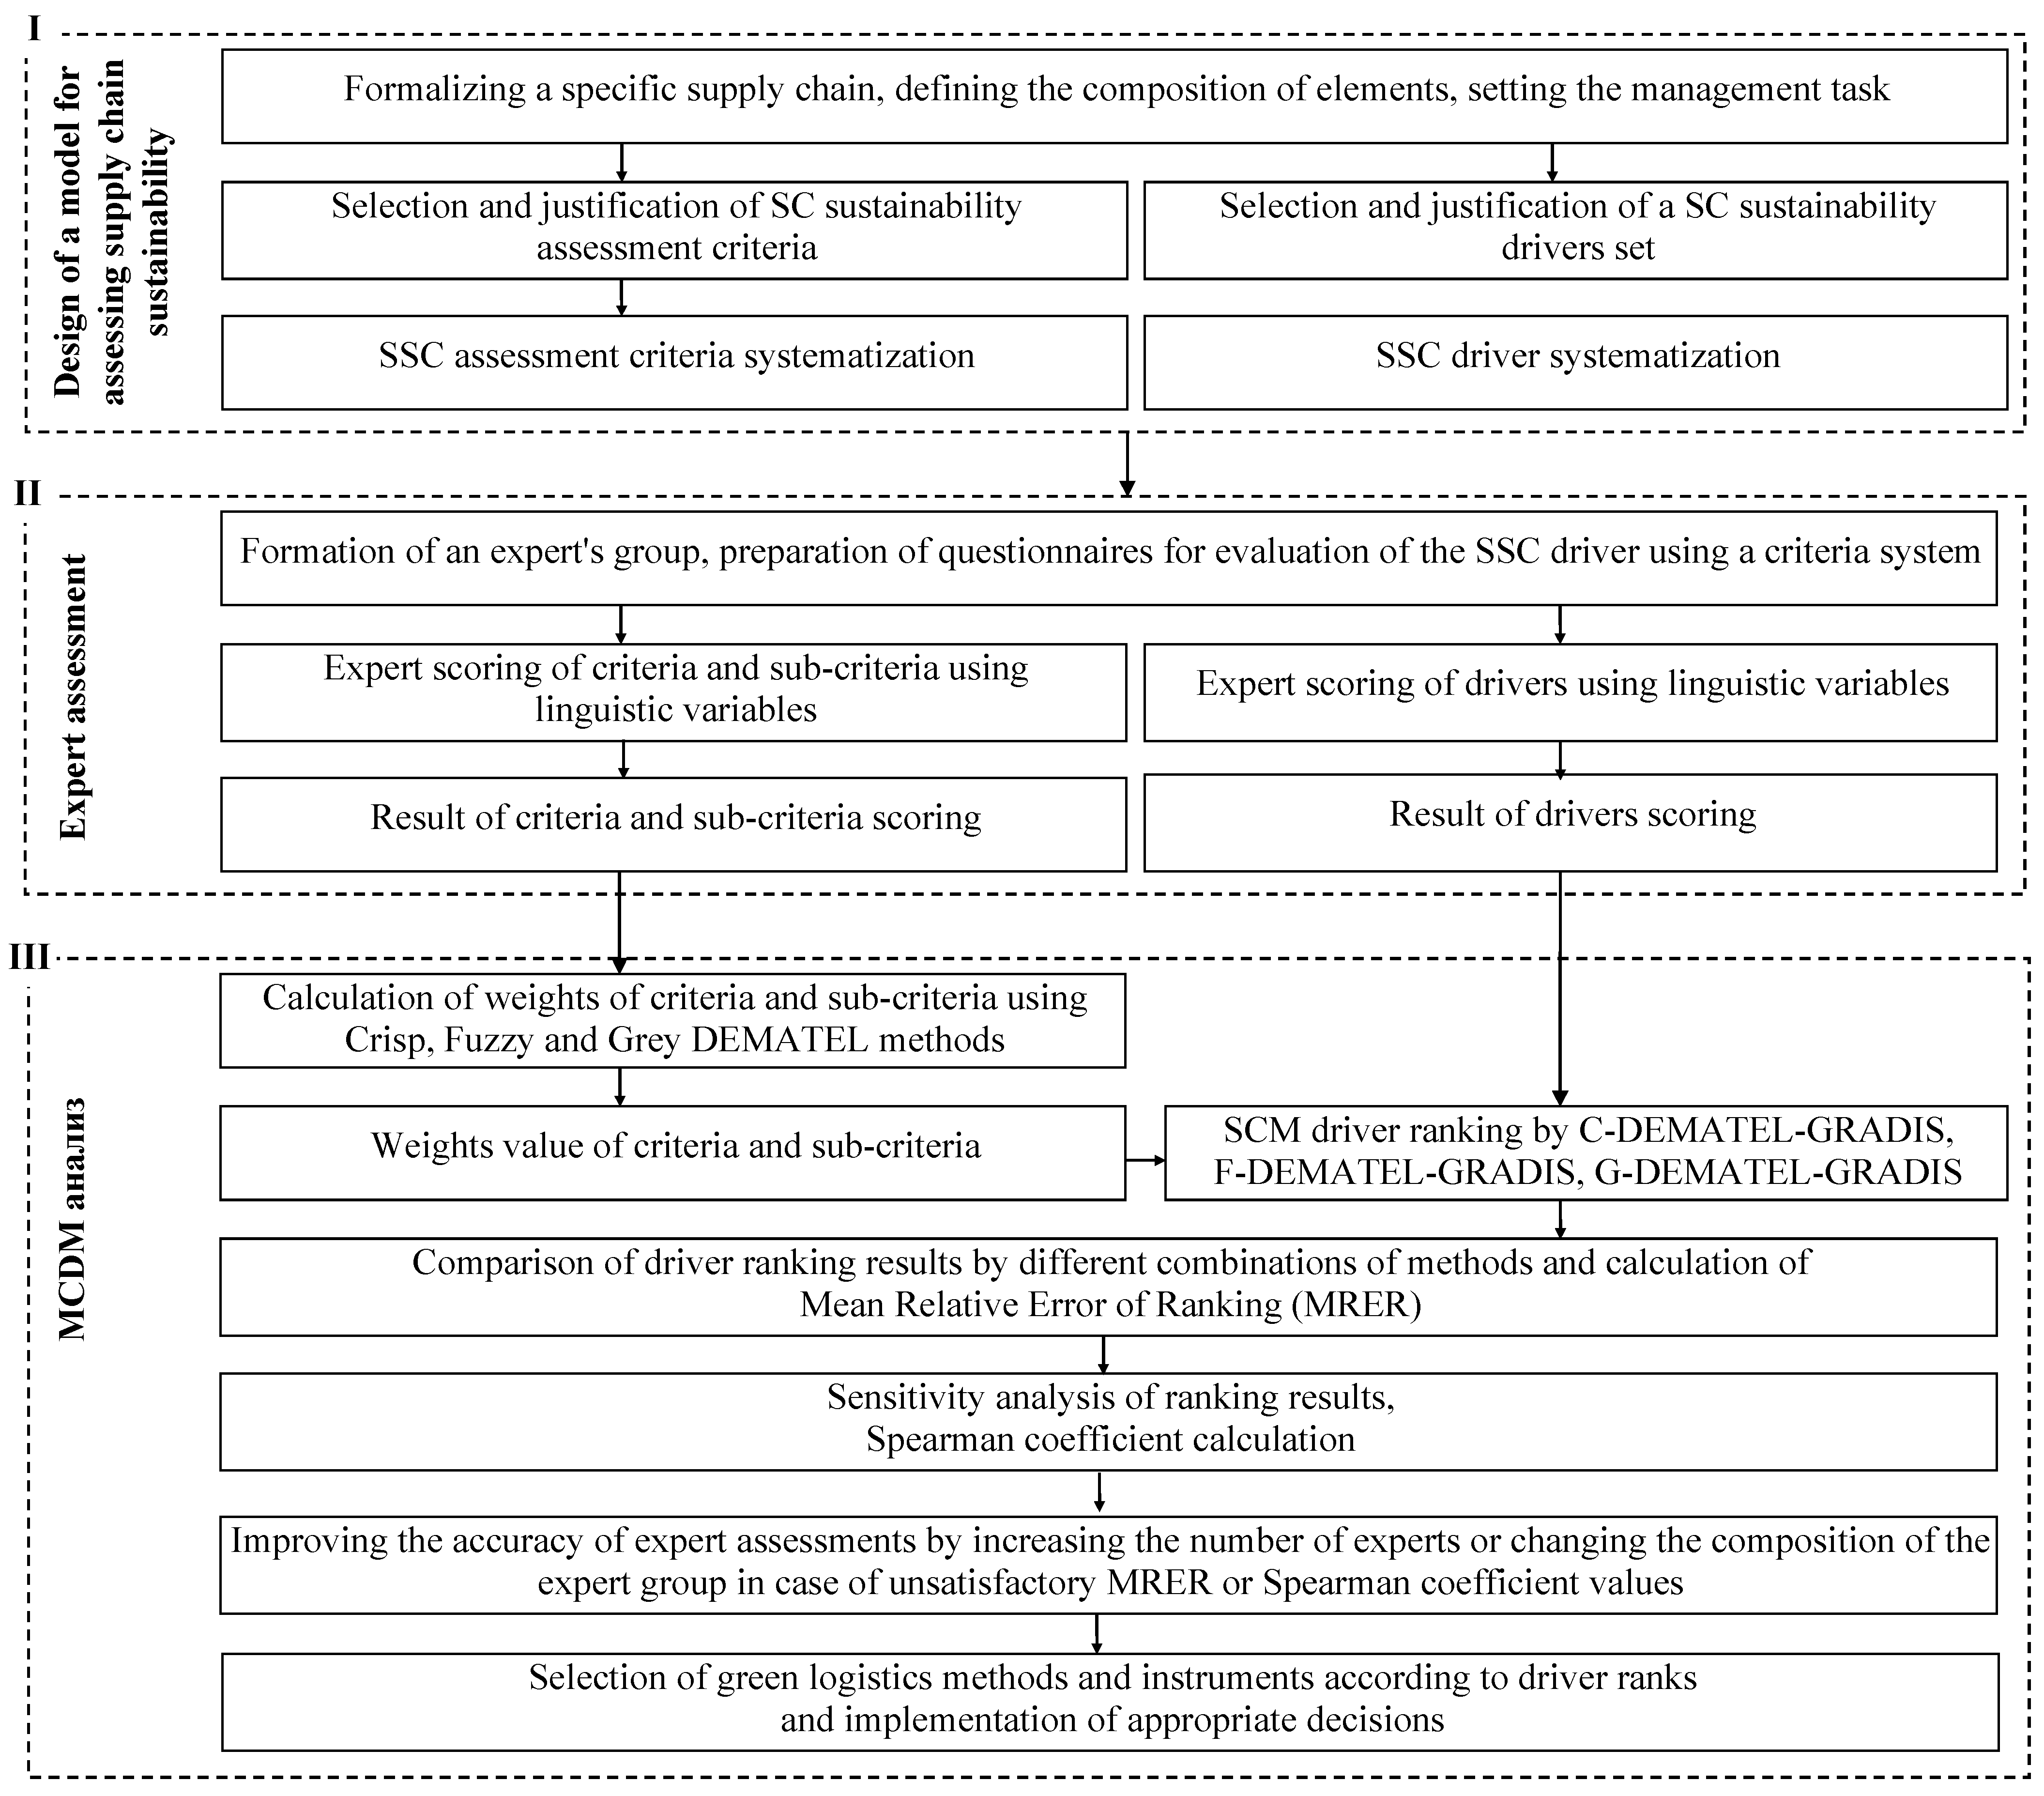
3.4. A Framework for Sustainable Supply Chain Drivers’ Multi-Criteria Assessment
4. Numerical Example
4.1. Input Data
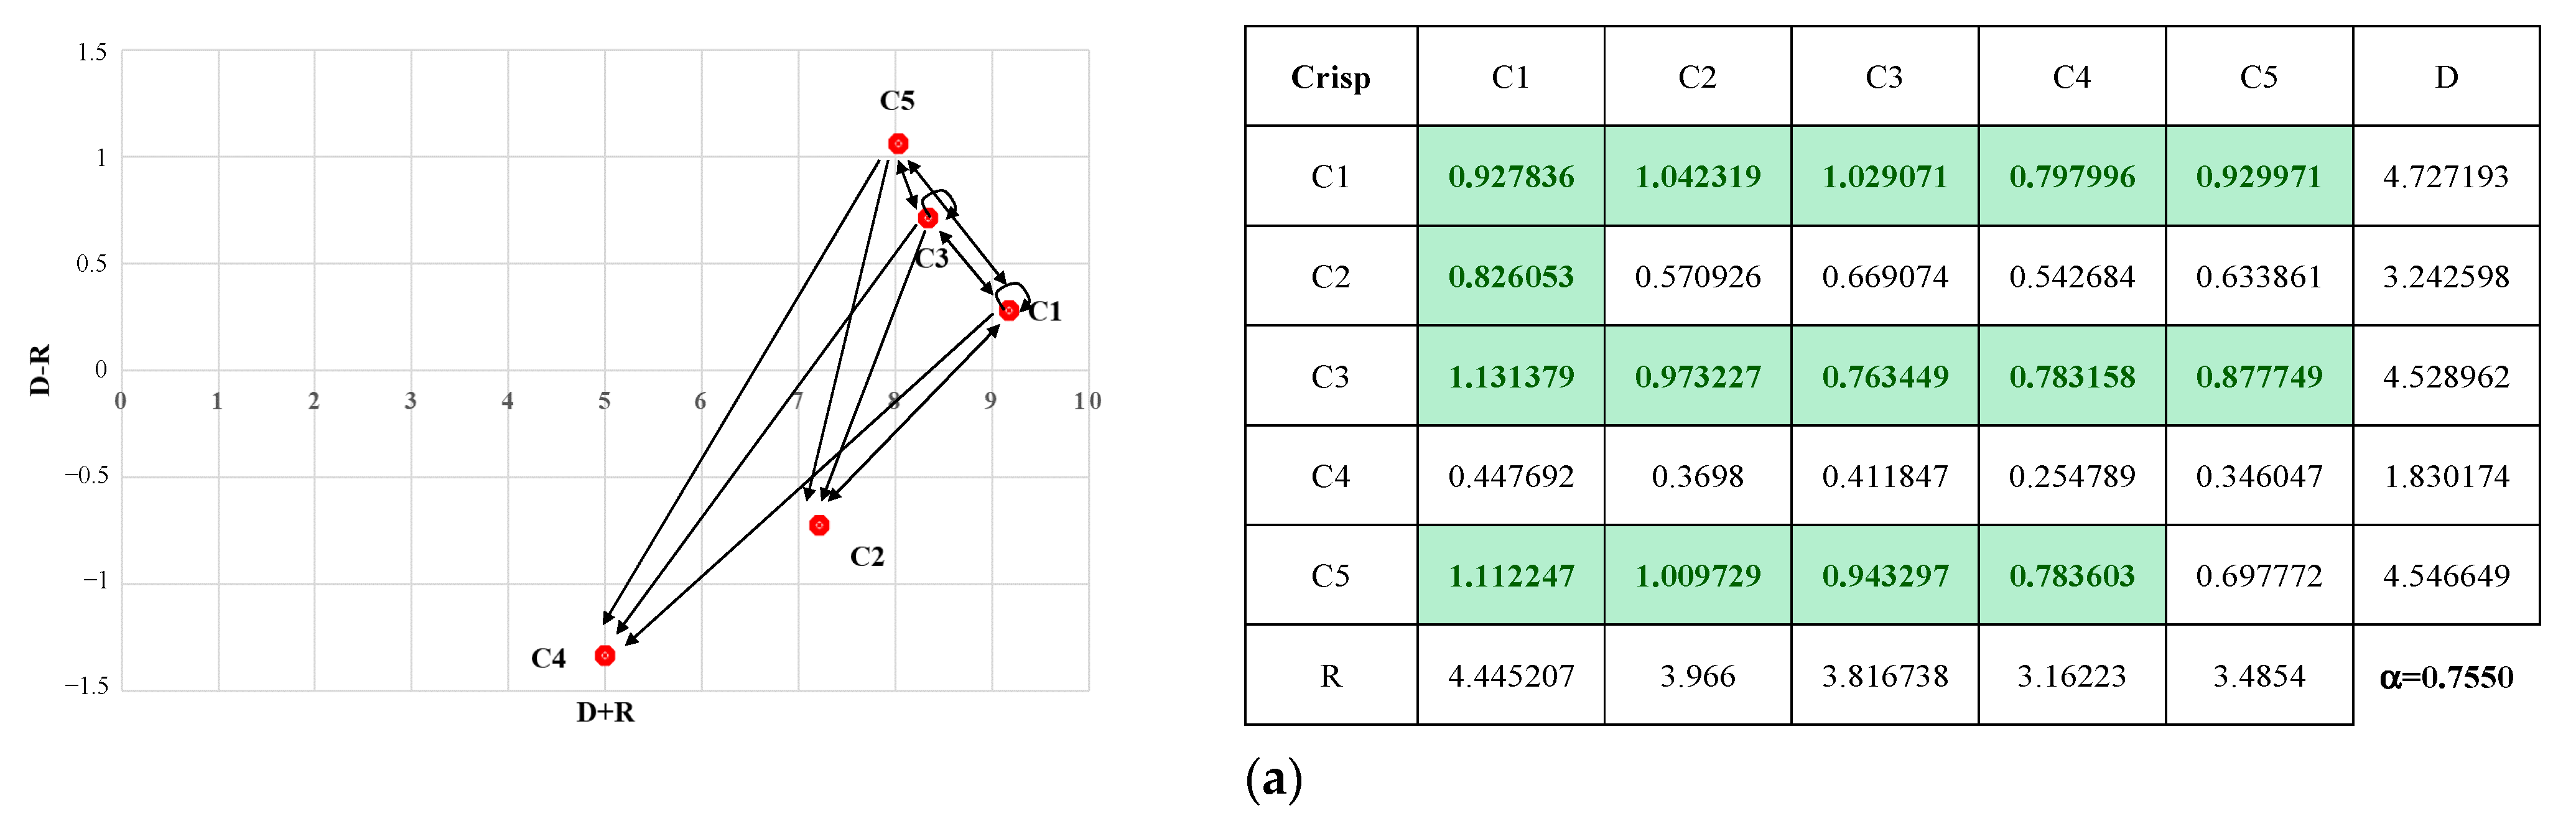
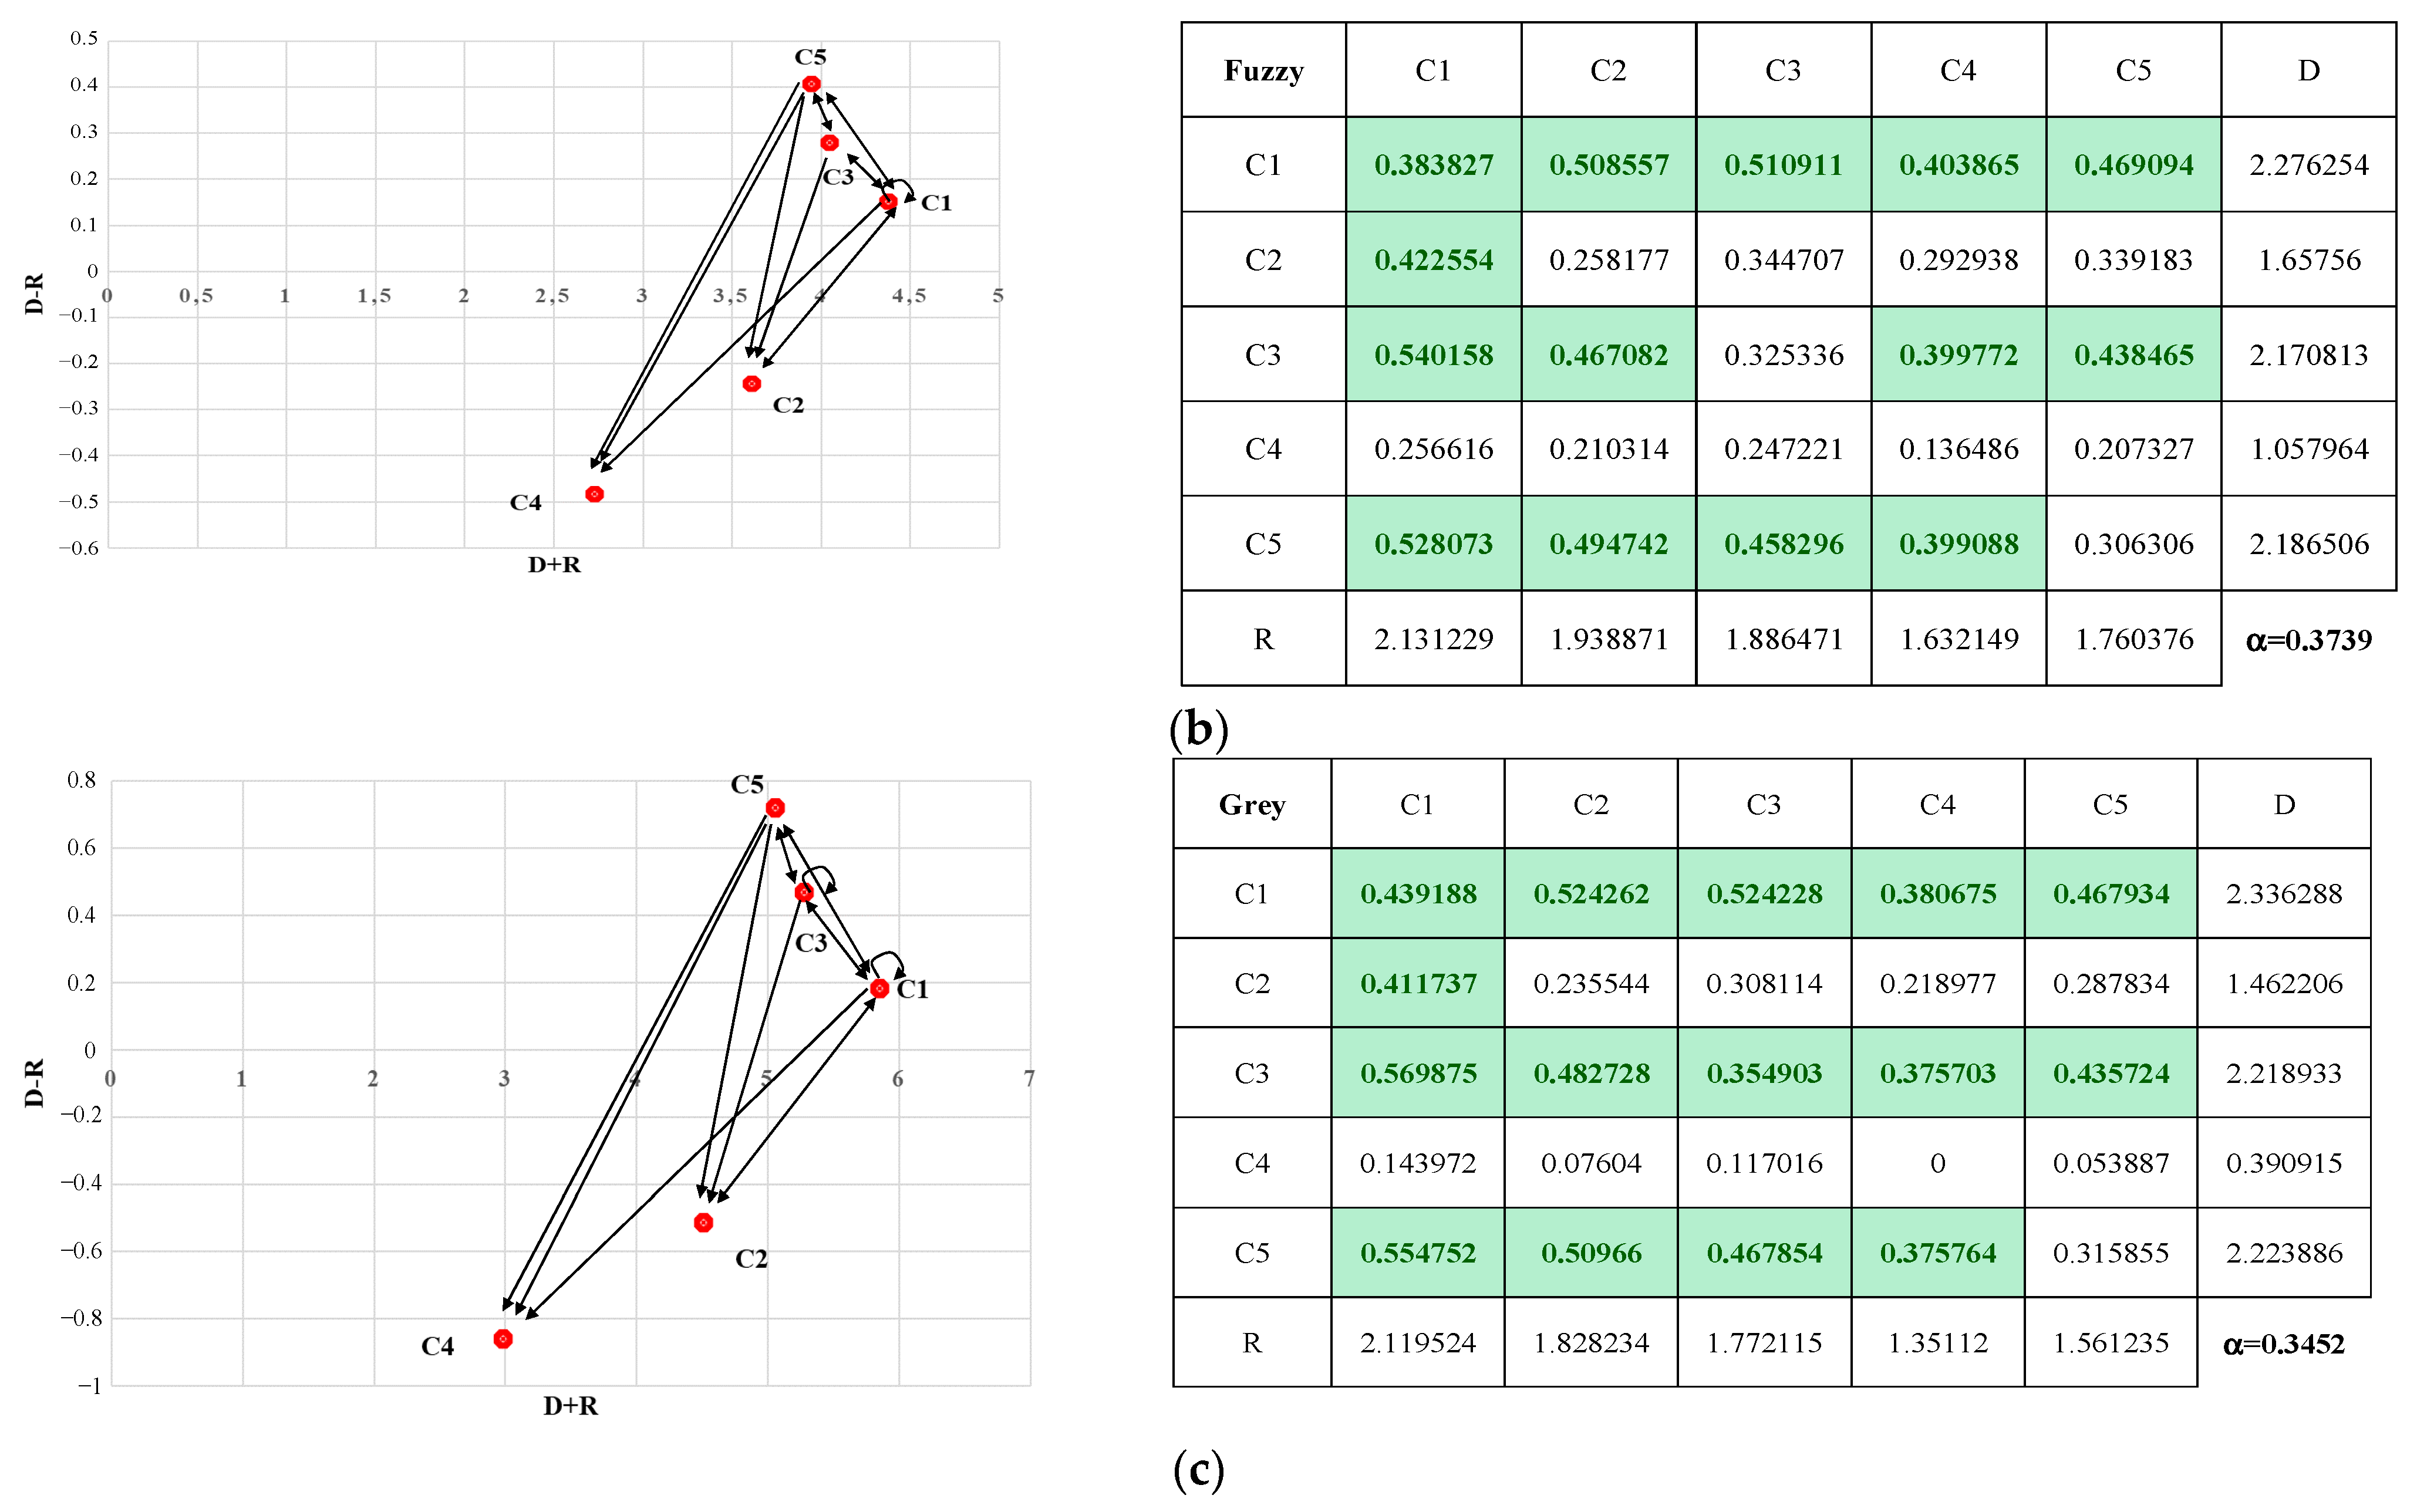
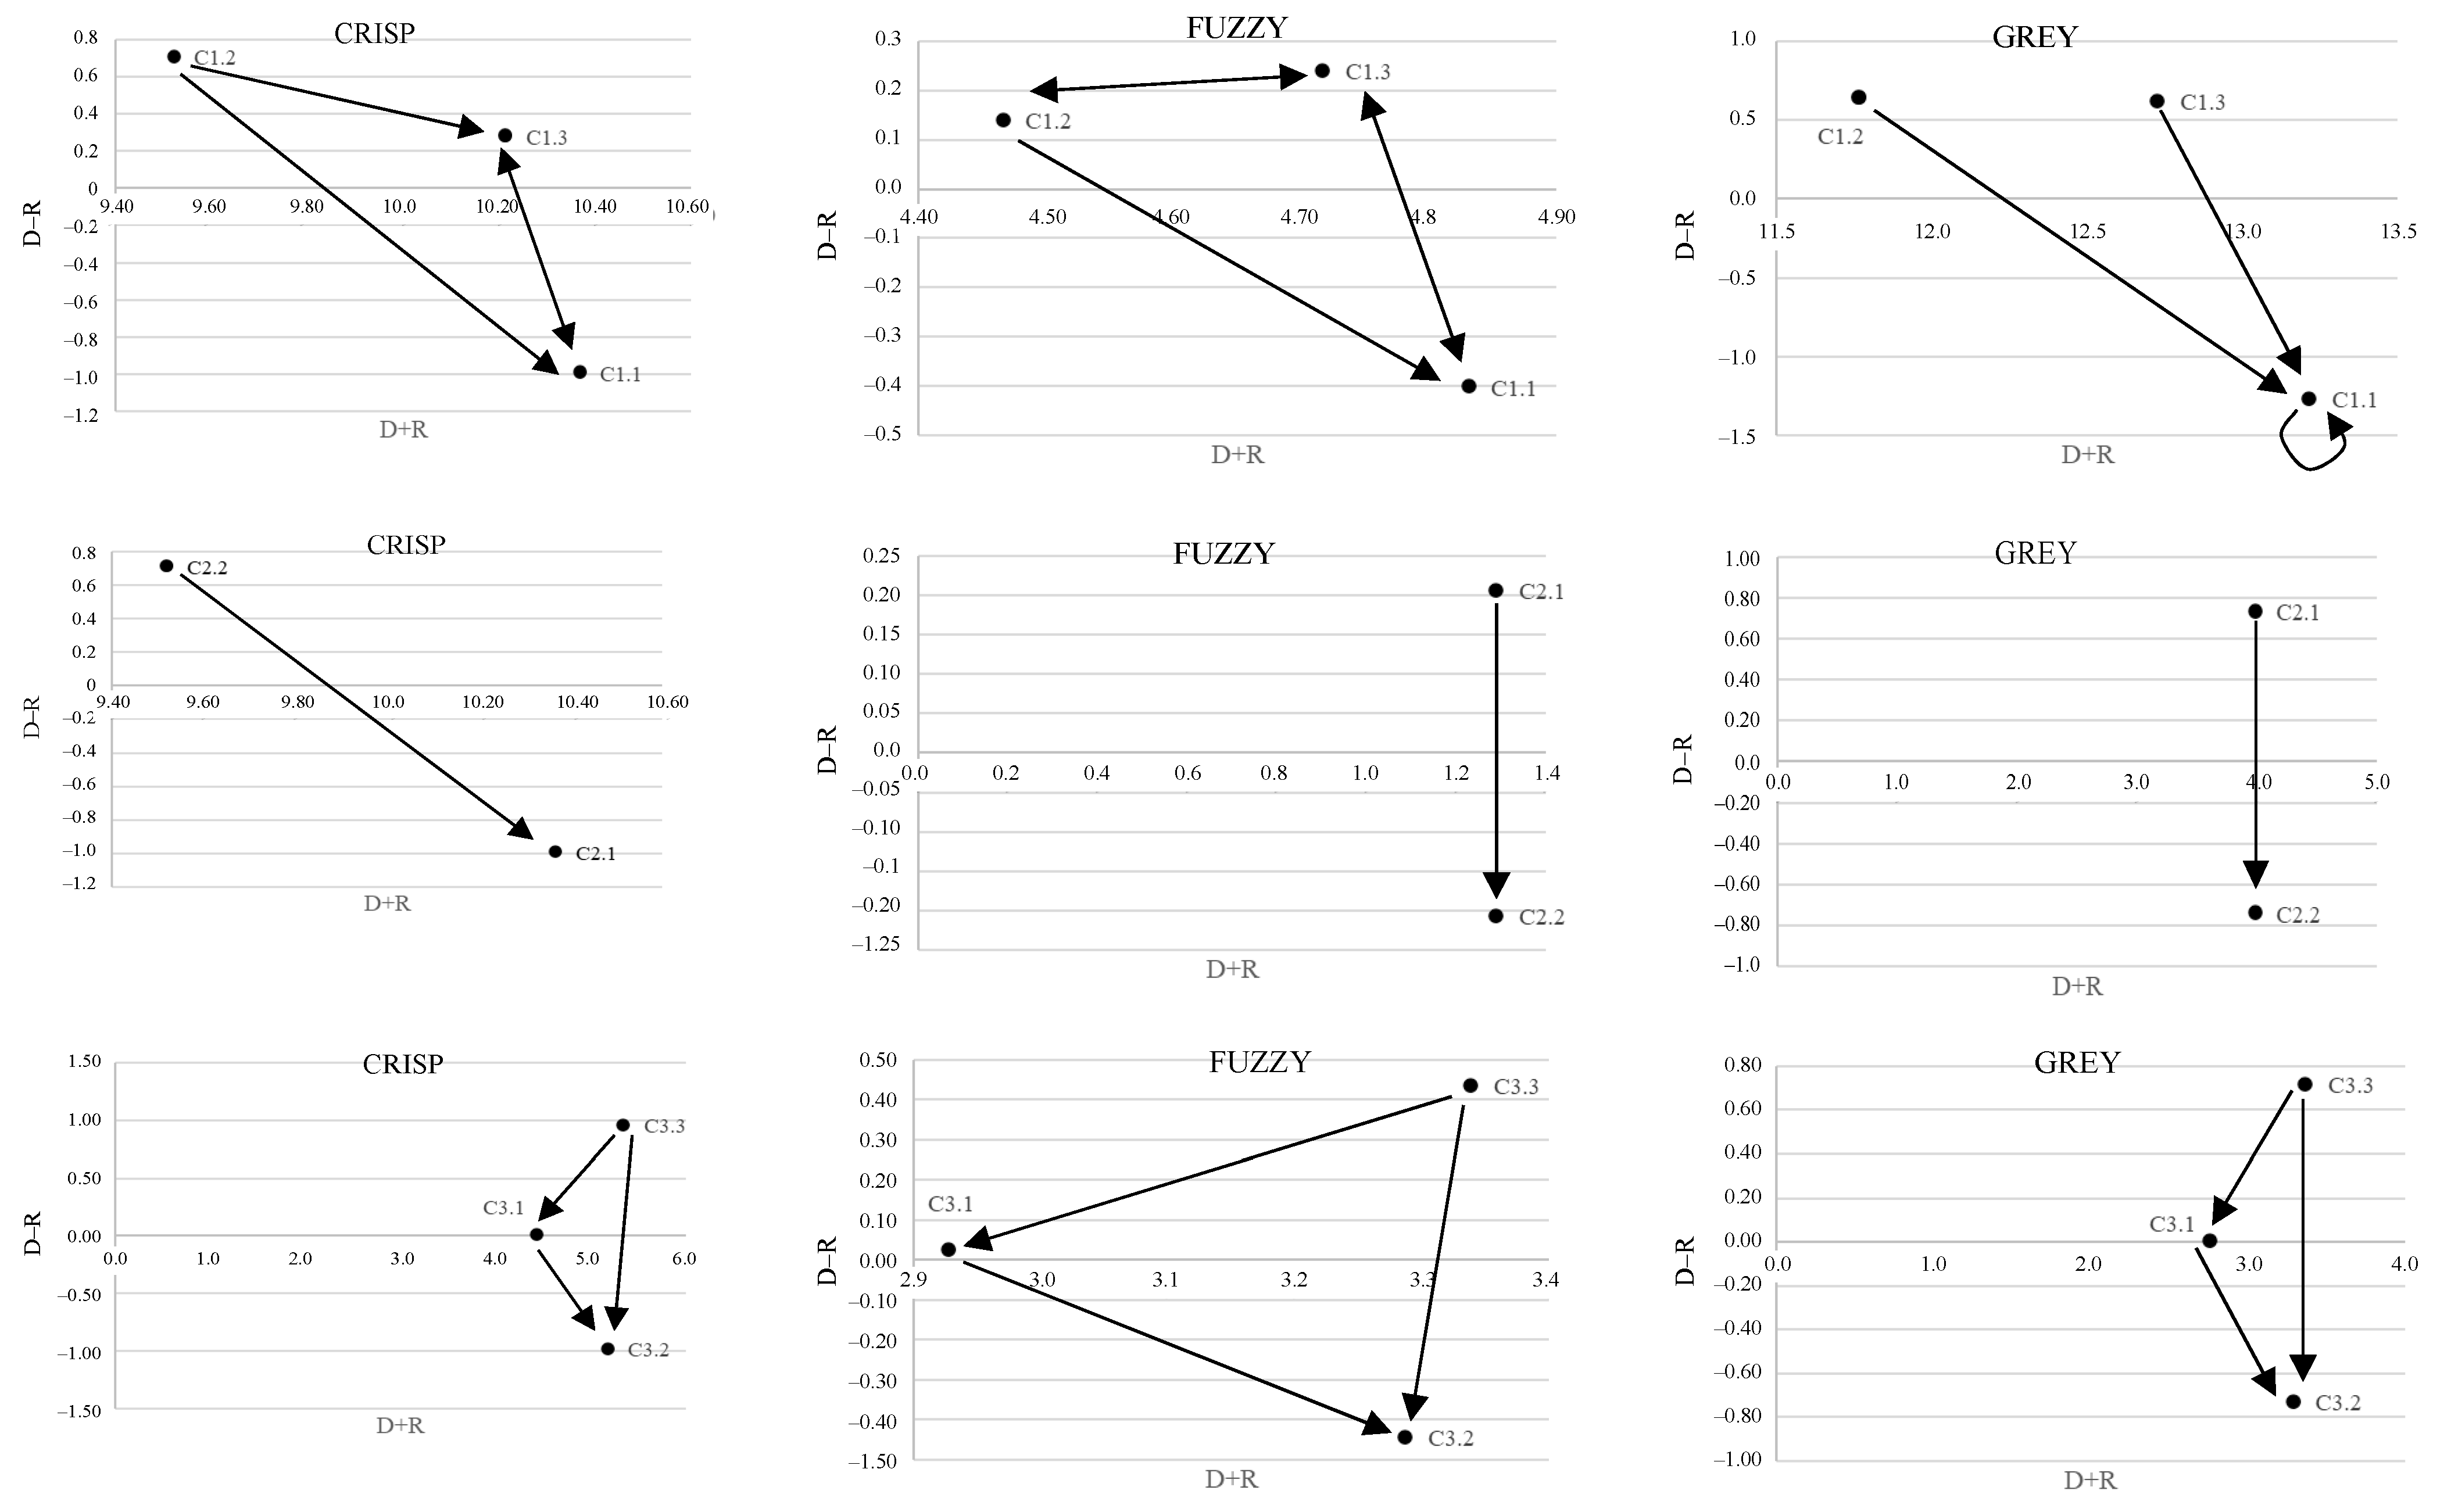
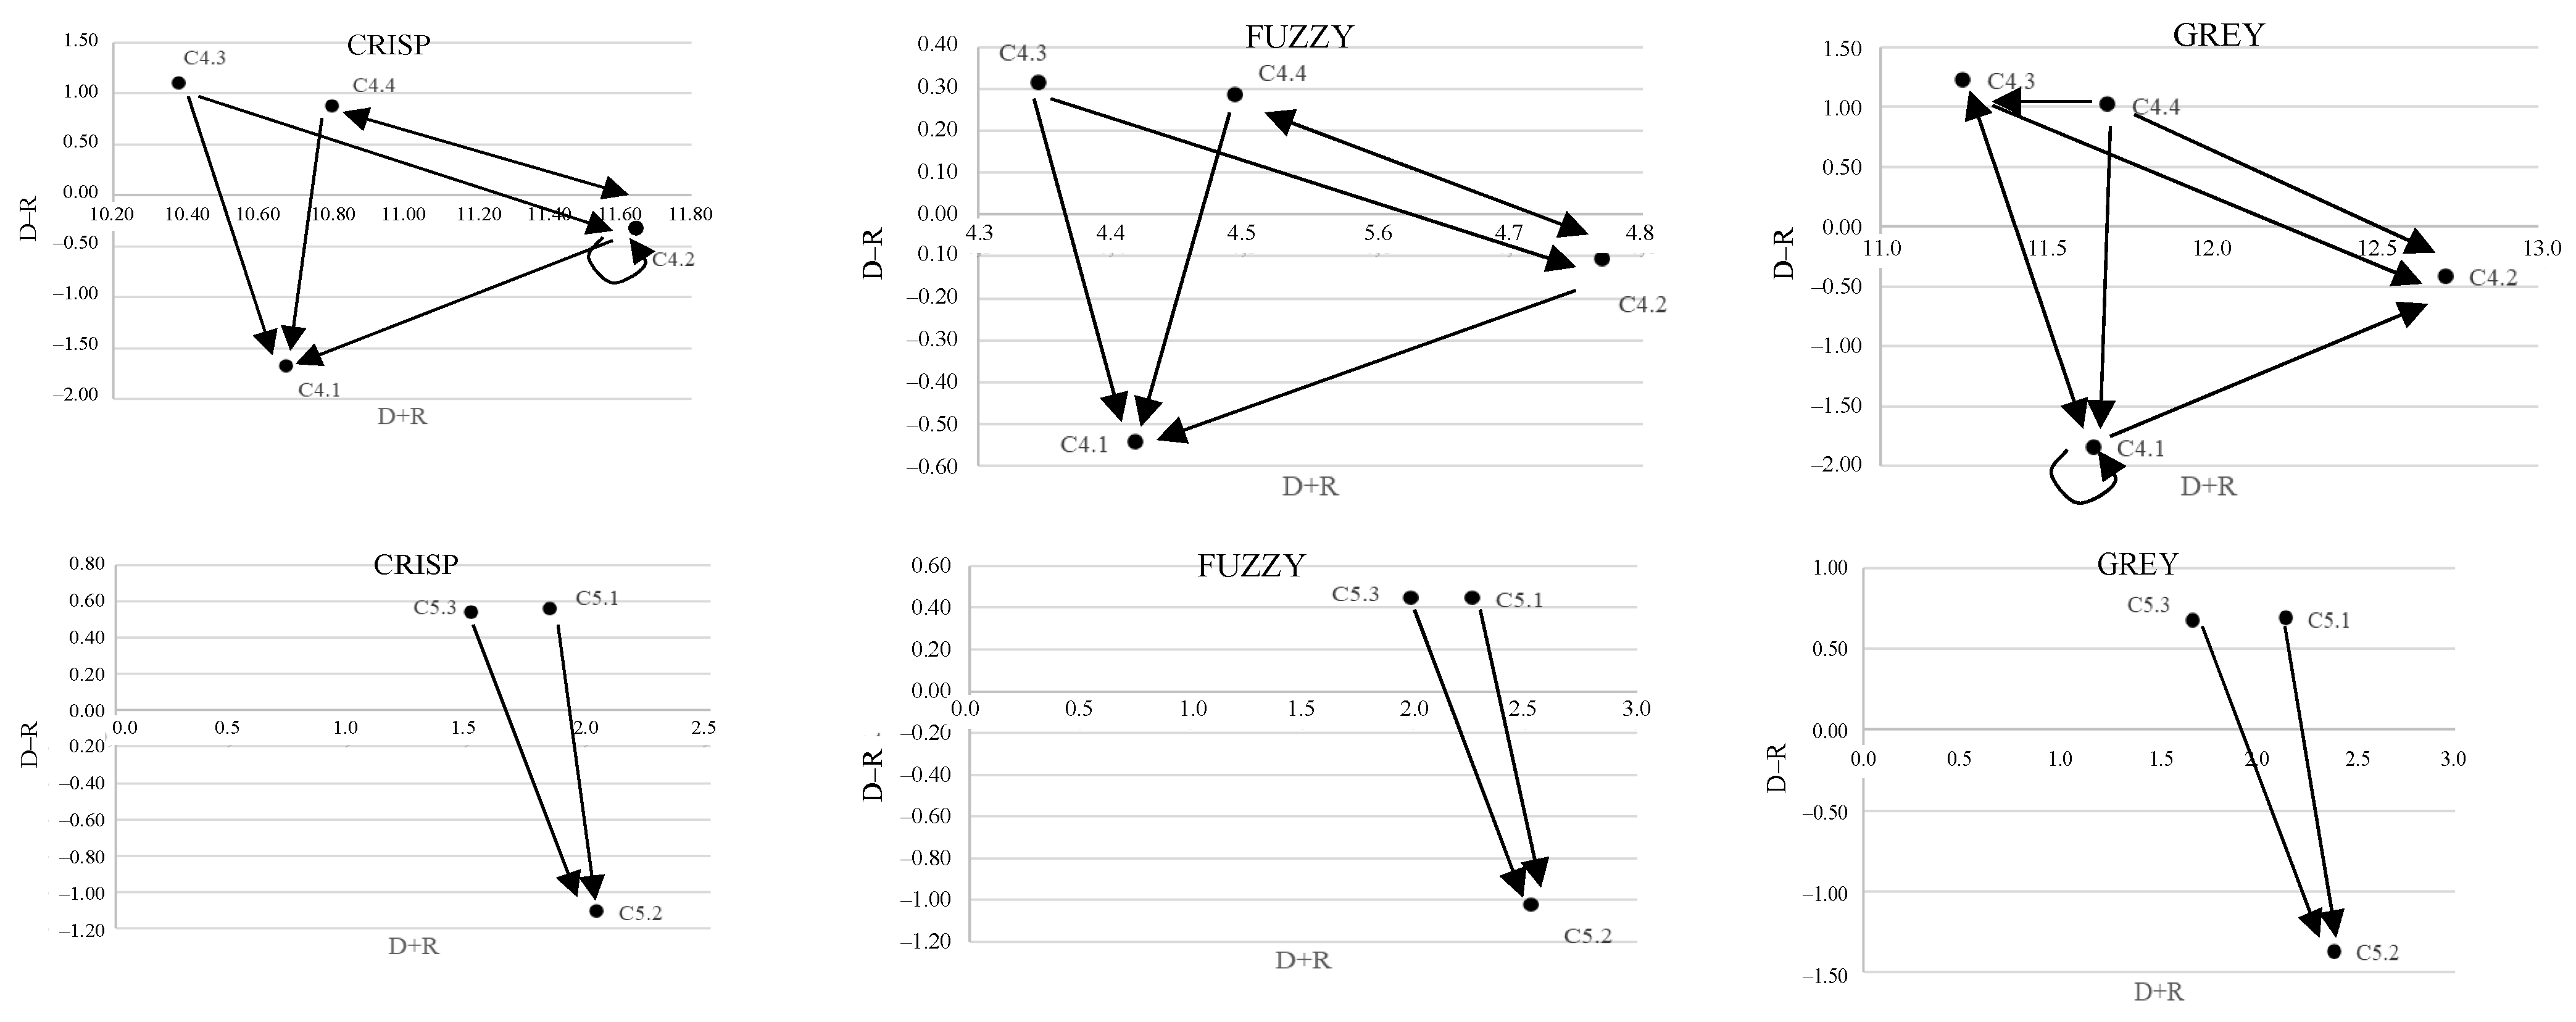
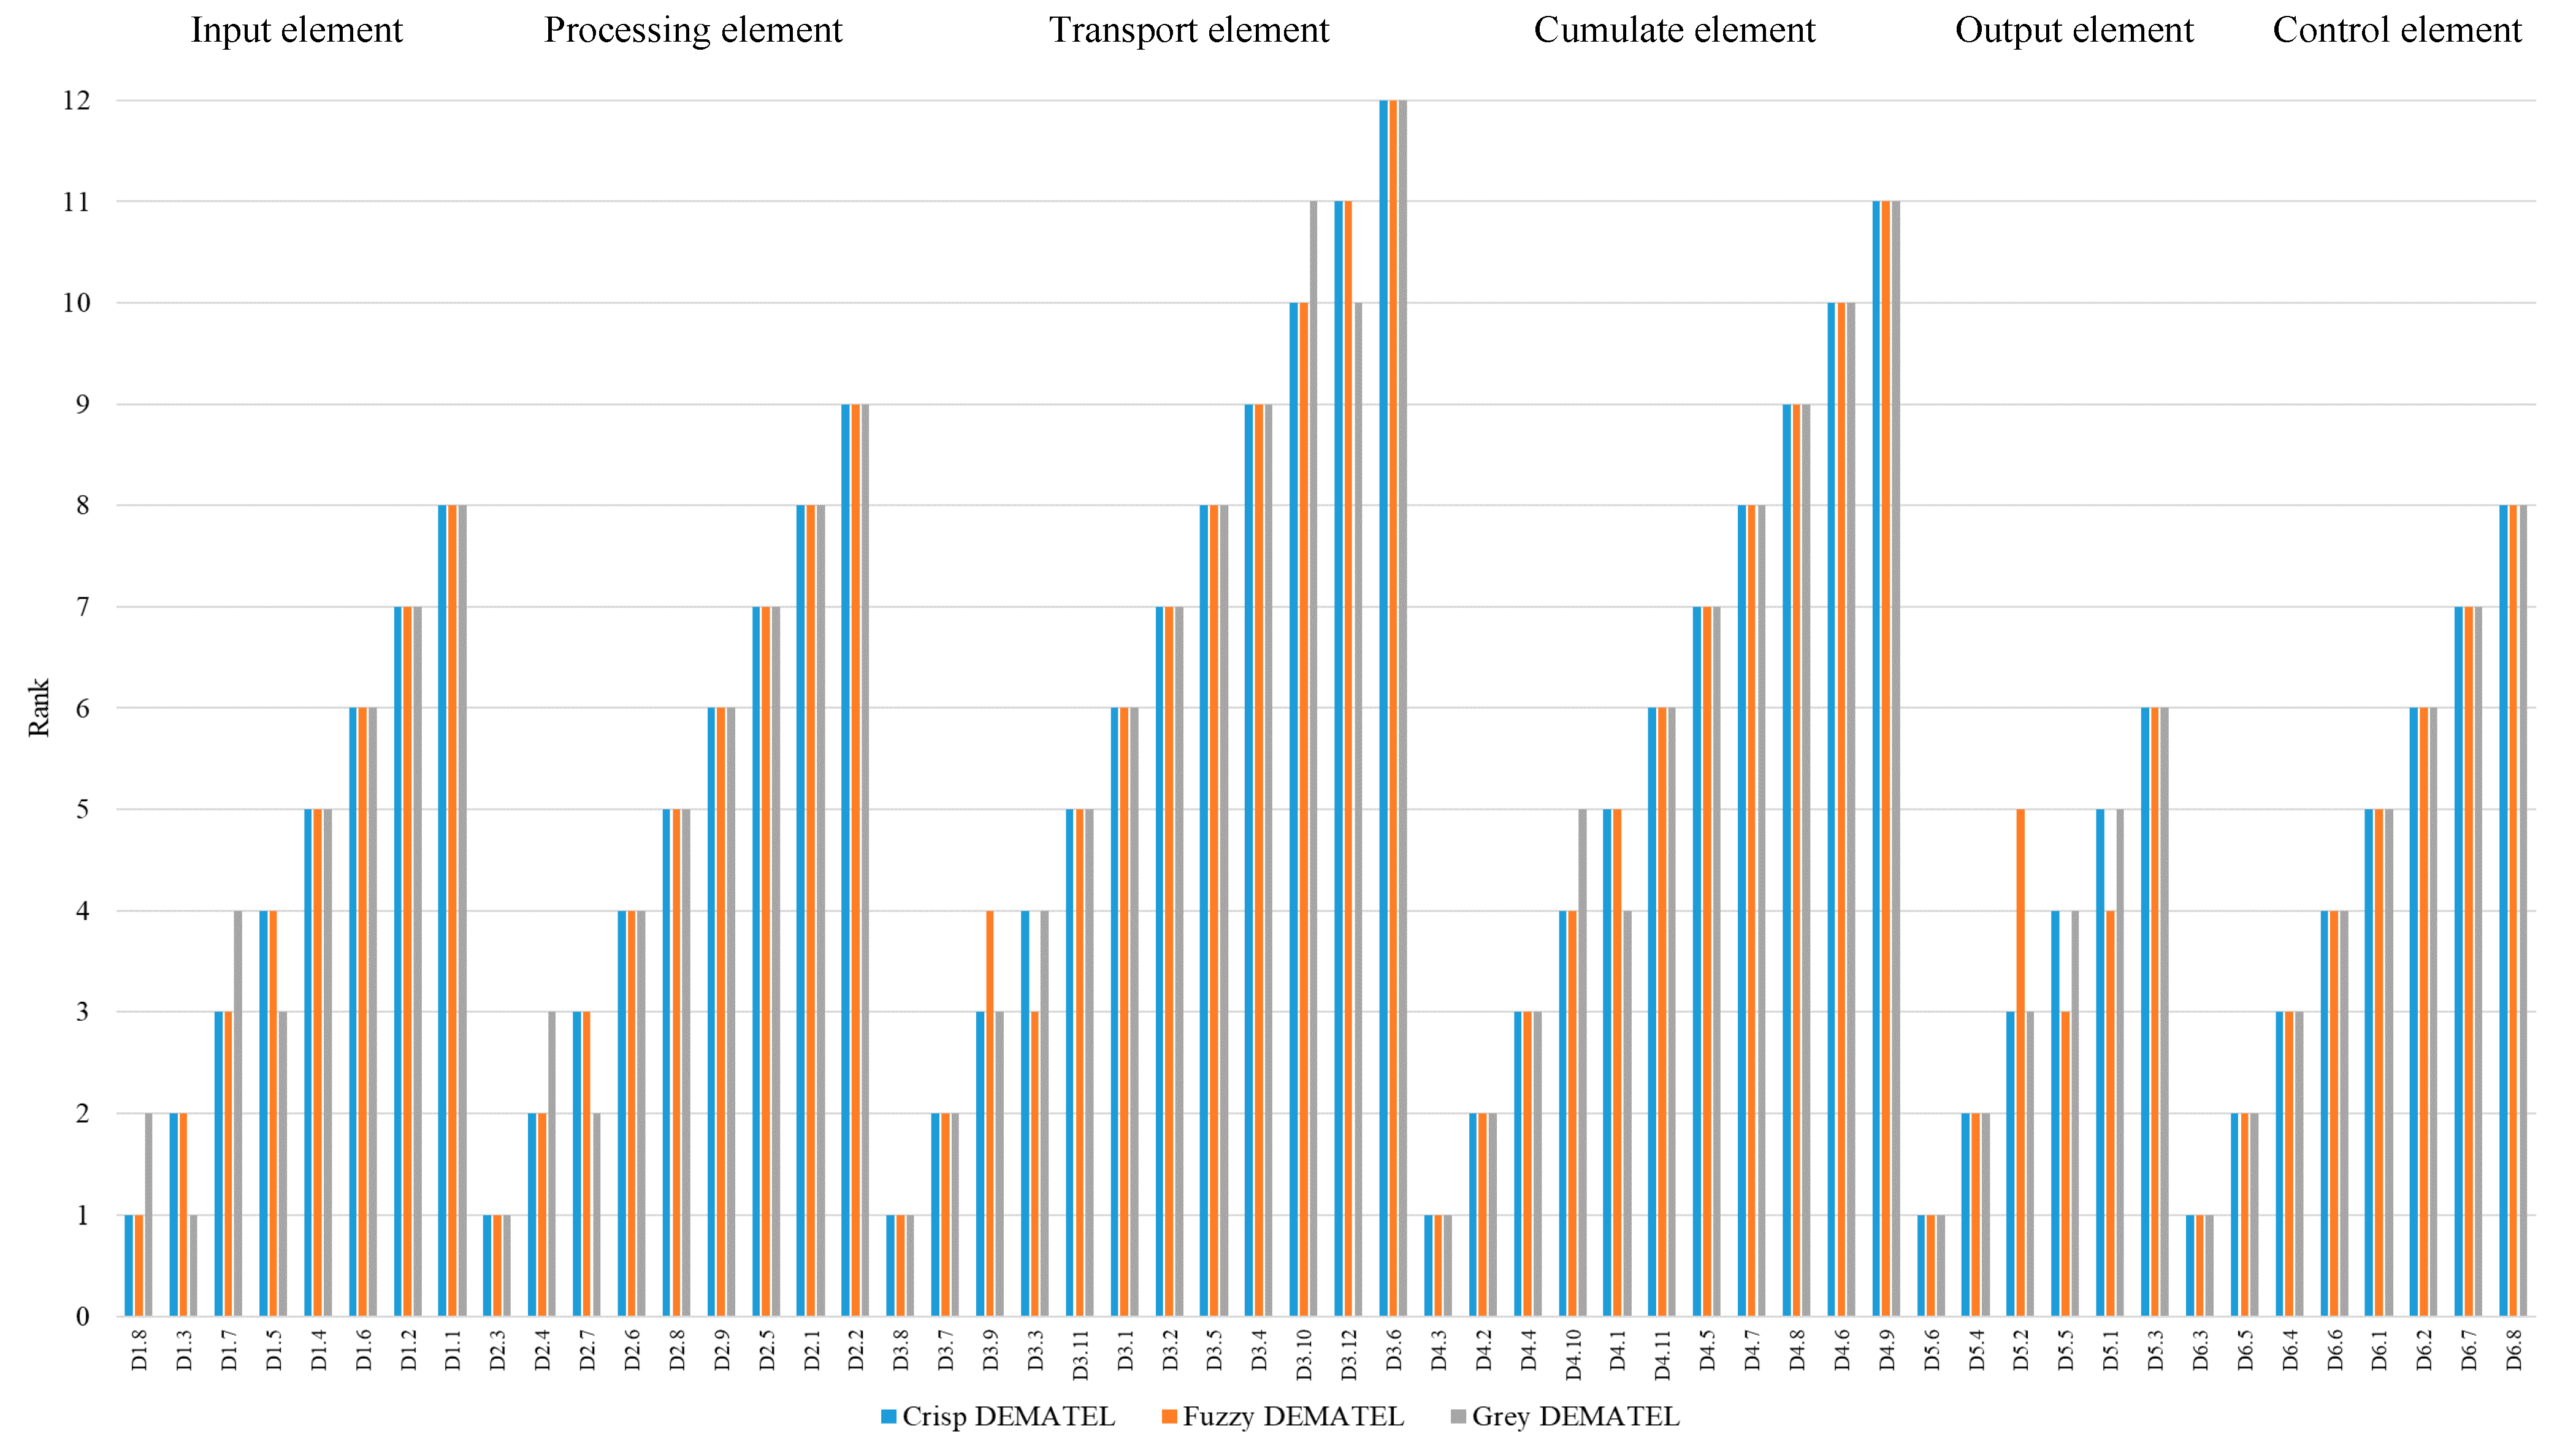
4.2. Results of DEMATEL and CRADIS Methods
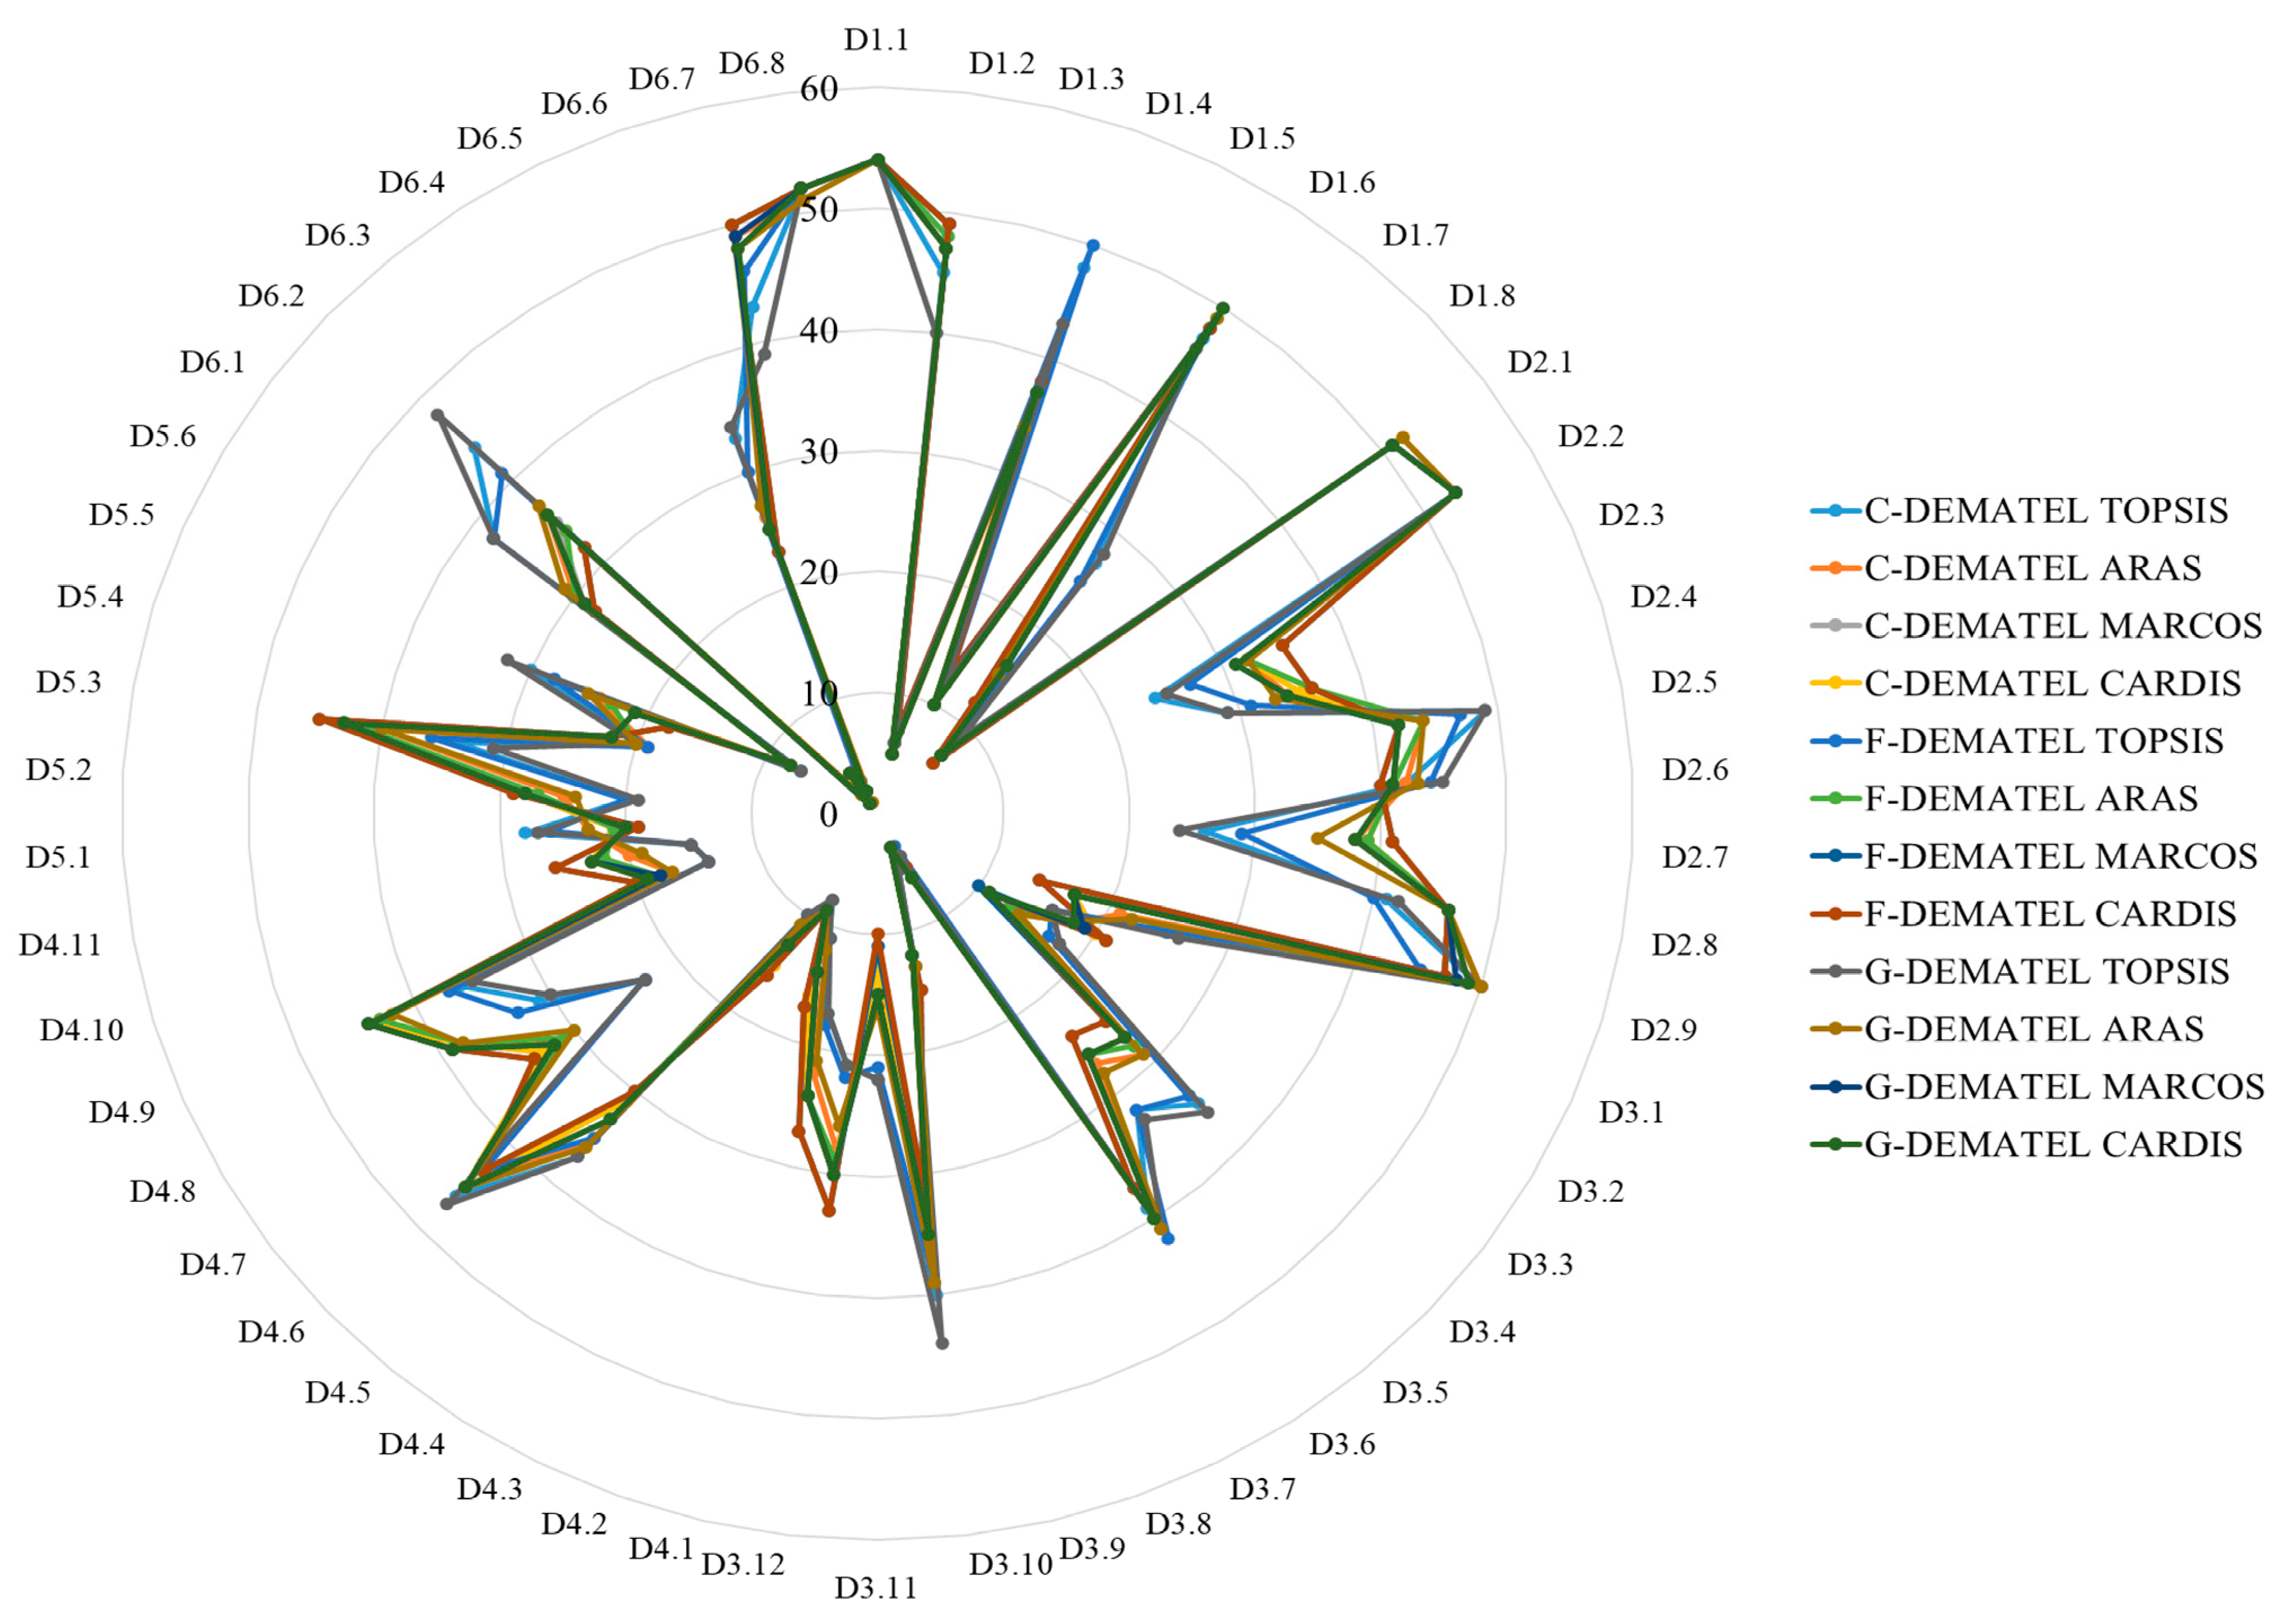
4.3. Sensitivity Analysis
4.4. Managerial Implications of Assessing Supply Chain Sustainability Drivers
4.5. Discussion
5. Conclusions
- −
- A new approach to describing the structure and functions of the supply chain, which views the chain as a system of six elements that perform specific functions in the passage and processing of material logistics flow. Such functions are: supply and delivery (input element); production (processing element); warehousing (accumulation element); transportation (transportation element); sales and distribution (output element); and management (control element). The allocation of functions in the supply chain based on the structural–functional approach allows the drivers of supply chain sustainability to be systematized by two main features—belonging to the element of the supply chain and the functions that each element implements. This eliminates the duplication of drivers at different stages of the logistics process, and will help to identify promising solutions for supply chain sustainability.
- −
- The system of supply chain sustainability drivers is justified based on an analysis of scientific research in the field of logistics and supply chain management practice over the last 20 years. Supporting functions of supply chain elements—a set of specific functions of each element which influence the material flow—were used as the main features of driver systematization.
- −
- The methodology of evaluation and ranking of sustainable supply chain drivers, including methods for describing the structure and functions of SCM, a system of SCM drivers, and a reasonable system of SCM evaluation criteria.
- −
- The increasing number of driver evaluation attributes caused by changes in economics, politics, and international relations and influences on the formation and management of global supply chains.
- −
- Combination of multi-criteria analysis methods with other methods (mathematical optimization methods, heuristic methods) to improve the quality of driver assessment and efficiency of implementation of management decisions to improve supply chain sustainability.
- −
- Integration of the results of sustainability drivers’ assessment into a combined multi-criteria simulation model for the implementation of green logistics tools in supply chains. Such a combination will make it possible to systematically consider the functional complexity of the supply chain and the main drivers of its sustainability for the comprehensive implementation of green logistics tools.
Author Contributions
Funding
Data Availability Statement
Conflicts of Interest
Appendix A
| Criteria | Economic Criteria | Energy-Ecological Criteria | Quality Criteria | Statistical Criteria | Flow’s Physical Criteria |
|---|---|---|---|---|---|
| Economic criteria | N | ||||
| Energy–ecological criteria | N | ||||
| Quality criteria | N | ||||
| Statistical criteria | N | ||||
| Flow’s physical criteria | N |
| Sub-Criteria | Profit | Operating Expenses | … | … | The Mass (Quantity) of Flow | The Speed of Flow | The Length of the Route |
|---|---|---|---|---|---|---|---|
| Profit | N | ||||||
| Operating expenses | N | ||||||
| … | N | ||||||
| … | N | ||||||
| The mass (quantity) of flow | N | ||||||
| The speed of flow | N | ||||||
| The length of the route | N |
| № | Drivers | Sub-Criteria | |||
|---|---|---|---|---|---|
| Profit | Operating Expenses | … | The Length of the Route | ||
| Input element of supply chain | |||||
| 1 | Environmentally friendly raw materials (at supplier) | ||||
| 2 | Raw materials able to reuse or recycle | ||||
| 3 | Raw materials procurement system | ||||
| 4 | Eco-friendly suppliers | ||||
| 5 | Delivery distance of raw materials | ||||
| 6 | Type of packaging for raw materials | ||||
| 7 | Raw material eco-labeling | ||||
| 8 | E-commerce with supplier | ||||
| Processing element of supply chain | |||||
| … | … | … | … | … | … |
| … | … | … | … | … | … |
| Control element of supply chain | |||||
| … | … | … | … | … | … |
| 53 | Return and reverse flow management systems | ||||
| 54 | Recycling processes for waste, packaging, and finished products | ||||
Appendix B
| Supply Chain Elements | Drivers | C-DEMATEL TOPSIS | C-DEMATEL ARAS | C-DEMATEL MARCOS | C-DEMATEL CARDIS | F-DEMATEL TOPSIS | F-DEMATEL ARAS | F-DEMATEL MARCOS | F-DEMATEL CARDIS | G-DEMATEL TOPSIS | G-DEMATEL ARAS | G-DEMATEL MARCOS | G-DEMATEL CARDIS |
|---|---|---|---|---|---|---|---|---|---|---|---|---|---|
| Input element | D1.1 | 54 | 54 | 54 | 54 | 54 | 54 | 54 | 54 | 54 | 54 | 54 | 54 |
| D1.2 | 45 | 47 | 49 | 49 | 49 | 48 | 49 | 49 | 40 | 47 | 47 | 47 | |
| D1.3 | 6 | 5 | 6 | 6 | 6 | 5 | 7 | 7 | 6 | 5 | 5 | 5 | |
| D1.4 | 48 | 33 | 37 | 37 | 50 | 37 | 38 | 38 | 43 | 34 | 37 | 37 | |
| D1.5 | 12 | 10 | 10 | 10 | 13 | 10 | 13 | 13 | 12 | 10 | 10 | 10 | |
| D1.6 | 47 | 48 | 48 | 48 | 48 | 49 | 48 | 48 | 46 | 49 | 50 | 50 | |
| D1.7 | 27 | 16 | 14 | 14 | 25 | 16 | 12 | 12 | 28 | 15 | 16 | 16 | |
| D1.8 | 9 | 7 | 7 | 7 | 8 | 7 | 6 | 6 | 9 | 7 | 7 | 7 | |
| Processing element | D2.1 | 51 | 52 | 51 | 51 | 51 | 51 | 51 | 51 | 51 | 52 | 51 | 51 |
| D2.2 | 53 | 53 | 53 | 53 | 53 | 53 | 53 | 53 | 53 | 53 | 53 | 53 | |
| D2.3 | 24 | 32 | 32 | 32 | 27 | 32 | 35 | 35 | 25 | 32 | 31 | 31 | |
| D2.4 | 29 | 34 | 36 | 35 | 31 | 36 | 36 | 36 | 29 | 33 | 34 | 34 | |
| D2.5 | 49 | 44 | 42 | 42 | 47 | 44 | 42 | 42 | 49 | 44 | 42 | 42 | |
| D2.6 | 42 | 42 | 41 | 41 | 44 | 41 | 40 | 40 | 45 | 43 | 41 | 41 | |
| D2.7 | 26 | 38 | 39 | 39 | 29 | 39 | 41 | 41 | 24 | 35 | 38 | 38 | |
| D2.8 | 41 | 46 | 46 | 46 | 40 | 46 | 46 | 46 | 42 | 46 | 46 | 46 | |
| D2.9 | 50 | 50 | 47 | 47 | 45 | 47 | 47 | 47 | 50 | 50 | 48 | 49 | |
| Transport element | D3.1 | 25 | 21 | 17 | 17 | 24 | 17 | 14 | 14 | 26 | 22 | 17 | 17 |
| D3.2 | 16 | 18 | 20 | 20 | 16 | 19 | 21 | 21 | 16 | 18 | 19 | 18 | |
| D3.3 | 18 | 14 | 11 | 11 | 17 | 13 | 10 | 11 | 18 | 14 | 11 | 11 | |
| D3.4 | 35 | 29 | 27 | 27 | 34 | 28 | 25 | 25 | 36 | 29 | 27 | 27 | |
| D3.5 | 32 | 27 | 26 | 26 | 32 | 26 | 24 | 24 | 33 | 28 | 26 | 26 | |
| D3.6 | 39 | 41 | 40 | 40 | 42 | 40 | 37 | 37 | 41 | 41 | 40 | 40 | |
| D3.7 | 4 | 6 | 5 | 5 | 3 | 6 | 5 | 5 | 4 | 6 | 6 | 6 | |
| D3.8 | 5 | 3 | 3 | 3 | 5 | 3 | 3 | 3 | 5 | 3 | 3 | 3 | |
| D3.9 | 13 | 13 | 12 | 12 | 12 | 12 | 15 | 15 | 13 | 13 | 12 | 12 | |
| D3.10 | 40 | 37 | 34 | 34 | 39 | 35 | 31 | 31 | 44 | 39 | 35 | 35 | |
| D3.11 | 22 | 15 | 13 | 13 | 21 | 15 | 11 | 10 | 22 | 16 | 15 | 15 | |
| D3.12 | 21 | 28 | 30 | 30 | 22 | 29 | 33 | 33 | 21 | 26 | 30 | 30 | |
| Cumulate element | D4.1 | 17 | 22 | 24 | 24 | 18 | 24 | 27 | 27 | 17 | 21 | 24 | 24 |
| D4.2 | 11 | 12 | 16 | 16 | 11 | 14 | 17 | 17 | 11 | 12 | 14 | 14 | |
| D4.3 | 8 | 9 | 9 | 9 | 9 | 9 | 9 | 9 | 8 | 9 | 9 | 9 | |
| D4.4 | 10 | 11 | 15 | 15 | 10 | 11 | 16 | 16 | 10 | 11 | 13 | 13 | |
| D4.5 | 37 | 35 | 31 | 31 | 35 | 33 | 30 | 30 | 37 | 36 | 33 | 33 | |
| D4.6 | 46 | 45 | 45 | 45 | 43 | 45 | 43 | 43 | 47 | 45 | 45 | 45 | |
| D4.7 | 23 | 31 | 33 | 33 | 23 | 31 | 34 | 34 | 23 | 30 | 32 | 32 | |
| D4.8 | 31 | 39 | 38 | 38 | 33 | 38 | 39 | 39 | 30 | 38 | 39 | 39 | |
| D4.9 | 36 | 43 | 44 | 44 | 37 | 43 | 44 | 44 | 35 | 42 | 44 | 44 | |
| D4.10 | 14 | 17 | 19 | 19 | 14 | 18 | 20 | 20 | 14 | 17 | 18 | 19 | |
| D4.11 | 15 | 20 | 23 | 23 | 15 | 22 | 26 | 26 | 15 | 19 | 23 | 23 | |
| Output element | D5.1 | 28 | 23 | 21 | 21 | 26 | 21 | 19 | 19 | 27 | 23 | 20 | 20 |
| D5.2 | 20 | 25 | 28 | 28 | 20 | 27 | 29 | 29 | 19 | 24 | 28 | 28 | |
| D5.3 | 34 | 40 | 43 | 43 | 36 | 42 | 45 | 45 | 31 | 40 | 43 | 43 | |
| D5.4 | 19 | 19 | 22 | 22 | 19 | 20 | 22 | 22 | 20 | 20 | 22 | 22 | |
| D5.5 | 30 | 24 | 18 | 18 | 28 | 23 | 18 | 18 | 32 | 25 | 21 | 21 | |
| D5.6 | 7 | 8 | 8 | 8 | 7 | 8 | 8 | 8 | 7 | 8 | 8 | 8 | |
| Control element | D6.1 | 38 | 30 | 29 | 29 | 38 | 30 | 28 | 28 | 38 | 31 | 29 | 29 |
| D6.2 | 44 | 36 | 35 | 36 | 41 | 34 | 32 | 32 | 48 | 37 | 36 | 36 | |
| D6.3 | 1 | 2 | 1 | 1 | 1 | 1 | 1 | 1 | 1 | 2 | 1 | 1 | |
| D6.4 | 2 | 4 | 4 | 4 | 2 | 4 | 4 | 4 | 2 | 4 | 4 | 4 | |
| D6.5 | 3 | 1 | 2 | 2 | 4 | 2 | 2 | 2 | 3 | 1 | 2 | 2 | |
| D6.6 | 33 | 26 | 25 | 25 | 30 | 25 | 23 | 23 | 34 | 27 | 25 | 25 | |
| D6.7 | 43 | 49 | 50 | 50 | 46 | 50 | 50 | 50 | 39 | 48 | 49 | 48 | |
| D6.8 | 52 | 51 | 52 | 52 | 52 | 52 | 52 | 52 | 52 | 51 | 52 | 52 |
References
- Alfaro-Saiz, J.-J.; Bas, M.C.; Giner-Bosch, V.; Rodríguez-Rodríguez, R.; Verdecho, M.-J. An evaluation of the environmental factors for supply chain strategy decisions using grey systems and composite indicators. Appl. Math. Model. 2020, 79, 490–505. [Google Scholar] [CrossRef]
- Guterres, A. Carbon Neutrality by 2050: The World’s Most Urgent Mission. Available online: https://www.un.org/sg/en/content/sg/articles/2020-12-11/carbon-neutrality-2050-the-world%E2%80%99s-most-urgent-mission (accessed on 11 December 2020).
- Zhang, A.; Alvi, M.F.; Gong, Y.; Wang, J.X. Overcoming barriers to supply chain decarbonization: Case studies of first movers. Resour. Conserv. Recycl. 2022, 186, 106536. [Google Scholar] [CrossRef]
- Gandhi, S.; Mangla, S.K.; Kumar, P.; Kumar, D. Evaluating factors in implementation of successful green supply chain management using DEMATEL: A case study. Int. Strateg. Manag. Rev. 2015, 3, 96–109. [Google Scholar] [CrossRef]
- Rehman Khan, S.A.; Yu, Z.; Golpîra, H.; Sharif, A.; Mardani, A. A state-of-the-art review and meta-analysis on sustainable supply chain management: Future research directions. J. Clean. Prod. 2021, 278, 123357. [Google Scholar] [CrossRef]
- Lazar, S.; Klimecka-Tatar, D.; Obrecht, M. Sustainability orientation and focus in logistics and supply chains. Sustainability 2021, 13, 3280. [Google Scholar] [CrossRef]
- Schrettle, S.; Hinz, A.; Scherrer-Rathje, M.; Friedli, T. Turning sustainability into action: Explaining firms’ sustainability efforts and their impact on firm performance. Int. J. Prod. Econ. 2014, 147, 73–84. [Google Scholar] [CrossRef]
- Saeed, M.; Kersten, W. Drivers of sustainable supply chain management: Identification and classification. Sustainability 2019, 11, 1137. [Google Scholar] [CrossRef]
- George, J.; Pillai, V.M. A study of factors affecting supply chain performance. J. Phys. Conf. Ser. 2019, 1355, 12018. [Google Scholar] [CrossRef]
- Kalaiarasan, R.; Olhager, J.; Agrawal, T.K.; Wiktorsson, M. The ABCDE of supply chain visibility: A systematic literature review and framework. Int. J. Prod. Econ. 2022, 248, 108464. [Google Scholar] [CrossRef]
- Nilsson, F.; Göransson, M. Critical factors for the realization of sustainable supply chain innovations—Model development based on a systematic literature review. J. Clean. Prod. 2021, 296, 126471. [Google Scholar] [CrossRef]
- Chakraborty, A.; Al Amin, M.; Baldacci, R. Analysis of internal factors of green supply chain management: An interpretive structural modeling approach. Clean. Logist. Supply Chain. 2023, 7, 100099. [Google Scholar] [CrossRef]
- Ahi, P.; Searcy, C. An analysis of metrics used to measure performance in green and sustainable supply chains. J. Clean. Prod. 2015, 86, 360–377. [Google Scholar] [CrossRef]
- Paul, A.; Shukla, N.; Paul, S.K.; Trianni, A. Sustainable supply chain management and multi-criteria decision-making methods: A systematic review. Sustainability 2021, 13, 7104. [Google Scholar] [CrossRef]
- Apeji, U.D.; Sunmola, F.T. Principles and factors influencing visibility in sustainable supply chains. Procedia Comput. Sci. 2022, 200, 1516–1527. [Google Scholar] [CrossRef]
- Govindan, K.; Bouzon, M. From a literature review to a multi-perspective framework for reverse logistics barriers and drivers. J. Clean. Prod. 2018, 187, 318–337. [Google Scholar] [CrossRef]
- Walker, H.; Di Sisto, L.; McBain, D. Drivers and barriers to environmental supply chain management practices: Lessons from the public and private sectors. J. Purch. Supply Manag. 2008, 14, 69–85. [Google Scholar] [CrossRef]
- Yang, M.; Movahedipour, M.; Zeng, J.; Xiaoguang, Z.; Wang, L. Analysis of success factors to implement sustainable supply chain management using interpretive structural modeling technique: A real case perspective. Math. Probl. Eng. 2017, 2017, 1–14. [Google Scholar] [CrossRef]
- Anand, K.R.; Ramalingaiah; Parthiban, P. Evaluation of green supply chain factors using DEMATEL. Appl. Mech. Mater. 2014, 592–594, 2619–2627. [Google Scholar] [CrossRef]
- Liu, M.; Fan, H.H.; Zhou, Y.W. Analysis of influencing factors to green supply chain based on ISM. Appl. Mech. Mater. 2012, 220–223, 309–314. [Google Scholar] [CrossRef]
- Giusti, R.; Manerba, D.; Bruno, G.; Tadei, R. Synchromodal logistics: An overview of critical success factors, enabling technologies, and open research issues. Transp. Res. Part. E Logist. Transp. Rev. 2019, 129, 92–110. [Google Scholar] [CrossRef]
- Anand, K.R.; Ramalingaiah; Parthiban, P. Fuzzy quantitative approach to prioritize green factors in supply chain. Appl. Mech. Mater. 2014, 592–594, 2645–2653. [Google Scholar] [CrossRef]
- Wittstruck, D.; Teuteberg, F. Understanding the success factors of sustainable supply chain management: Empirical evidence from the electrics and electronics industry. Corp. Soc. Responsib. Environ. Manag. 2012, 19, 141–158. [Google Scholar] [CrossRef]
- Jiang, F. Analysis of the potential and influencing factors of regional logistics industry development from the perspective of supply chain. Adv. Multimed. 2022, 2022, 1–10. [Google Scholar] [CrossRef]
- Zhu, Q.; Shah, P.; Sarkis, J. Addition by subtraction: Integrating product deletion with lean and sustainable supply chain management. Int. J. Prod. Econ. 2018, 205, 201–214. [Google Scholar] [CrossRef]
- Hossain, M.I.; Al Amin, M.; Baldacci, R.; Rahman, M.H. Identification and prioritization of green lean supply chain management factors using fuzzy DEMATEL. Sustainability 2023, 15, 10523. [Google Scholar] [CrossRef]
- Nag, U.; Sharma, S.K.; Govindan, K. Investigating drivers of circular supply chain with product-service system in automotive firms of an emerging economy. J. Clean. Prod. 2021, 319, 128629. [Google Scholar] [CrossRef]
- Lahane, S.; Kant, R. Evaluating the circular supply chain implementation barriers using Pythagorean fuzzy AHP-DEMATEL approach. Clean. Logist. Supply Chain. 2021, 2, 100014. [Google Scholar] [CrossRef]
- Sunmola, F.; Burgess, P.; Tan, A.; Chanchaichujit, J.; Balasubramania, S.; Mahmud, M. Prioritising visibility influencing factors in supply chains for resilience. Procedia Comput. Sci. 2023, 217, 1589–1598. [Google Scholar] [CrossRef]
- Mangla, S.K.; Govindan, K.; Luthra, S. Critical success factors for reverse logistics in Indian industries: A structural model. J. Clean. Prod. 2016, 129, 608–621. [Google Scholar] [CrossRef]
- Large, R.O.; Gimenez Thomsen, C. Drivers of green supply management performance: Evidence from Germany. J. Purch. Supply Manag. 2011, 17, 176–184. [Google Scholar] [CrossRef]
- Sancha, C.; Longoni, A.; Giménez, C. Sustainable supplier development practices: Drivers and enablers in a global context. J. Purch. Supply Manag. 2015, 21, 95–102. [Google Scholar] [CrossRef]
- Giunipero, L.C.; Hooker, R.E.; Denslow, D. Purchasing and supply management sustainability: Drivers and barriers. J. Purch. Supply Manag. 2012, 18, 258–269. [Google Scholar] [CrossRef]
- Tsai, J.-F.; Wu, S.-C.; Pham, T.K.L.; Lin, M.-H. Analysis of key factors for green supplier selection: A case study of the electronics industry in Vietnam. Sustainability 2023, 15, 7885. [Google Scholar] [CrossRef]
- Govindan, K.; Diabat, A.; Madan Shankar, K. Analyzing the drivers of green manufacturing with fuzzy approach. J. Clean. Prod. 2015, 96, 182–193. [Google Scholar] [CrossRef]
- Seth, D.; Rehman, M.A.A.; Shrivastava, R.L. Green manufacturing drivers and their relationships for small and medium (SME) and large industries. J. Clean. Prod. 2018, 198, 1381–1405. [Google Scholar] [CrossRef]
- Olatunji, O.O.; Akinlabi, S.A.; Ayo, O.O.; Madushele, N.; Adedeji, P.A.; Fatoba, S.O. Drivers and barriers to competitive carbon footprint reduction in manufacturing supply chain: A brief review. Procedia Manuf. 2019, 35, 992–1000. [Google Scholar] [CrossRef]
- Zailani, S.; Jeyaraman, K.; Vengadasan, G.; Premkumar, R. Sustainable supply chain management (SSCM) in Malaysia: A survey. Int. J. Prod. Econ. 2012, 140, 330–340. [Google Scholar] [CrossRef]
- Xia, X.; Govindan, K.; Zhu, Q. Analyzing internal barriers for automotive parts remanufacturers in China using grey-DEMATEL approach. J. Clean. Prod. 2015, 87, 811–825. [Google Scholar] [CrossRef]
- Verma, A.; Tripathy, S.; Singhal, D. The significance of warehouse management in supply chain: An ISM approach. Decis. Mak. Appl. Manag. Eng. 2023, 6, 92–110. [Google Scholar] [CrossRef]
- Zhang, Y.; Thompson, R.G.; Bao, X.; Jiang, Y. Analyzing the promoting factors for adopting green logistics practices: A case study of road freight industry in Nanjing, China. Procedia Soc. Behav. Sci. 2014, 125, 432–444. [Google Scholar] [CrossRef]
- Jasmi, M.F.A.; Fernando, Y. Drivers of maritime green supply chain management. Sustain. Cities Soc. 2018, 43, 366–383. [Google Scholar] [CrossRef]
- Shao, J.; Taisch, M.; Ortega-Mier, M. A grey-DEcision-MAking Trial and Evaluation Laboratory (DEMATEL) analysis on the barriers between environmentally friendly products and consumers: Practitioners’ viewpoints on the European automobile industry. J. Clean. Prod. 2016, 112, 3185–3194. [Google Scholar] [CrossRef]
- Cheng, S.-H.; Ou, S.M.; Lin, S.-M. Using decision-making trial and evaluation laboratory (DEMATEL) to explore the key success factors for green logistics manufacturers. Afr. J. Bus. Manag. 2018, 12, 58–65. [Google Scholar] [CrossRef]
- Kumar, S.; Luthra, S.; Haleem, A. Customer involvement in greening the supply chain: An interpretive structural modeling methodology. J. Ind. Eng. Int. 2013, 9, 6. [Google Scholar] [CrossRef]
- Kumar, S.; Luthra, S.; Haleem, A. Critical success factors of customer involvement in greening the supply chain: An empirical study. Int. J. Logist. Syst. Manag. 2014, 19, 283. [Google Scholar] [CrossRef]
- Gandhi, S.; Mangla, S.K.; Kumar, P.; Kumar, D. A combined approach using AHP and DEMATEL for evaluating success factors in implementation of green supply chain management in Indian manufacturing industries. Int. J. Logist. Res. Appl. 2016, 19, 537–561. [Google Scholar] [CrossRef]
- Sureeyatanapas, P.; Poophiukhok, P.; Pathumnakul, S. Green initiatives for logistics service providers: An investigation of antecedent factors and the contributions to corporate goals. J. Clean. Prod. 2018, 191, 1–14. [Google Scholar] [CrossRef]
- Diabat, A.; Govindan, K. An analysis of the drivers affecting the implementation of green supply chain management. Resour. Conserv. Recycl. 2011, 55, 659–667. [Google Scholar] [CrossRef]
- Hu, A.H.; Hsu, C.-W. Critical factors for implementing green supply chain management practice. Manag. Res. Rev. 2010, 33, 586–608. [Google Scholar] [CrossRef]
- Wiśniewski, T.; Tundys, B. Comparative analysis of sustainability factors in supply chain links. Evidence of empirical research. Procedia Comput. Sci. 2022, 207, 3358–3366. [Google Scholar] [CrossRef]
- de Brito, M.P.; Dekker, R. Reverse Logistics—A framework. In Reverse Logistics: Quantitative Models for Closed-Loop Supply Chains; Dekker, R., Ed.; Springer: Berlin/Heidelberg, Germany, 2010; pp. 3–27. ISBN 978-3-642-07380-9. [Google Scholar]
- Akdoğan, M.; Coşkun, A. Drivers of reverse logistics activities: An empirical investigation. Procedia Soc. Behav. Sci. 2012, 58, 1640–1649. [Google Scholar] [CrossRef]
- Kumar, A.; Moktadir, M.A.; Khan, S.A.R.; Garza-Reyes, J.A.; Tyagi, M.; Kazançoğlu, Y. Behavioral factors on the adoption of sustainable supply chain practices. Resour. Conserv. Recycl. 2020, 158, 104818. [Google Scholar] [CrossRef]
- Prasad, D.S.; Pradhan, R.P.; Gaurav, K.; Sabat, A.K. Critical success factors of sustainable supply chain management and organizational performance: An exploratory study. Transp. Res. Procedia 2020, 48, 327–344. [Google Scholar] [CrossRef]
- Pradeep, C.C. Assessment and analysis of GSCM barriers using AHP. Int. Res. J. Eng. Technol. 2017, 4, 1777–1782. [Google Scholar]
- Agi, M.A.N.; Nishant, R. Understanding influential factors on implementing green supply chain management practices: An interpretive structural modelling analysis. J. Environ. Manag. 2017, 188, 351–363. [Google Scholar] [CrossRef]
- Luthra, S.; Garg, D.; Haleem, A. An analysis of interactions among critical success factors to implement green supply chain management towards sustainability: An Indian perspective. Resour. Policy 2015, 46, 37–50. [Google Scholar] [CrossRef]
- Raut, R.D.; Narkhede, B.; Gardas, B.B. To identify the critical success factors of sustainable supply chain management practices in the context of oil and gas industries: ISM approach. Renew. Sustain. Energy Rev. 2017, 68, 33–47. [Google Scholar] [CrossRef]
- Refaie, A.A.; Momani, D. ISM approach for modelling drivers to practices of green supply chain management in Jordanian industrial firms. Int. J. Bus. Perform. Supply Chain. Model. 2018, 10, 91. [Google Scholar] [CrossRef]
- Mavi, R.K.; Kazemi, S.; Najafabadi, A.F.; Mousaabadi, H.B. Identification and assessment of logistical factors to evaluate a green supplier using the fuzzy logic DEMATEL method. Pol. J. Environ. Stud. 2013, 22, 445–455. [Google Scholar]
- Sharma, Y.K.; Sharma, S. IT success factors in sustainable food supply chain management. Mater. Today Proc. 2022, 56, 43–45. [Google Scholar] [CrossRef]
- Shibin, K.T.; Gunasekaran, A.; Papadopoulos, T.; Dubey, R.; Singh, M.; Wamba, S.F. Enablers and barriers of flexible green supply chain management: A total interpretive structural modeling approach. Glob. J. Flex. Syst. Manag. 2016, 17, 171–188. [Google Scholar] [CrossRef]
- Tippayawong, K.; Niyomyat, N.; Sopadang, A.; Ramingwong, S. Factors affecting green supply chain operational performance of the Thai auto parts industry. Sustainability 2016, 8, 1161. [Google Scholar] [CrossRef]
- Tumpa, T.J.; Ali, S.M.; Rahman, M.H.; Paul, S.K.; Chowdhury, P.; Rehman Khan, S.A. Barriers to green supply chain management: An emerging economy context. J. Clean. Prod. 2019, 236, 117617. [Google Scholar] [CrossRef]
- Wu, H.-H.; Chang, S.-Y. A case study of using DEMATEL method to identify critical factors in green supply chain management. Appl. Math. Comput. 2015, 256, 394–403. [Google Scholar] [CrossRef]
- Wu, K.-J.; Liao, C.-J.; Tseng, M.-L.; Chiu, A.S. Exploring decisive factors in green supply chain practices under uncertainty. Int. J. Prod. Econ. 2015, 159, 147–157. [Google Scholar] [CrossRef]
- Zhu, Q.; Sarkis, J. An inter-sectoral comparison of green supply chain management in China: Drivers and practices. J. Clean. Prod. 2006, 14, 472–486. [Google Scholar] [CrossRef]
- Drohomeretski, E.; Gouvea da Costa, S.; Pinheiro de Lima, E. Green supply chain management: Drivers, barriers and practices within the Brazilian automotive industry. J. Manuf. Technol. Manag. 2014, 25, 1105–1134. [Google Scholar] [CrossRef]
- Attia, E.-A.; Alarjani, A.; Uddin, M.S.; Kineber, A.F. Examining the influence of sustainable construction supply chain drivers on sustainable building projects using mathematical structural equation modeling approach. Sustainability 2023, 15, 10671. [Google Scholar] [CrossRef]
- Mathiyazhagan, K.; Govindan, K.; NoorulHaq, A.; Geng, Y. An ISM approach for the barrier analysis in implementing green supply chain management. J. Clean. Prod. 2013, 47, 283–297. [Google Scholar] [CrossRef]
- Kshitij Dashore, N.S. Green supply chain management: A hierarchical framework for barriers. Int. J. Eng. Trends Technol. 2013, 4, 2172–2182. [Google Scholar]
- Al Zaabi, S.; Al Dhaheri, N.; Diabat, A. Analysis of interaction between the barriers for the implementation of sustainable supply chain management. Int. J. Adv. Manuf. Technol. 2013, 68, 895–905. [Google Scholar] [CrossRef]
- Meager, S.; Kumar, V.; Ekren, B.; Paddeu, D. Exploring the drivers and barriers to green supply chain management implementation: A study of independent UK restaurants. Procedia Manuf. 2020, 51, 1642–1649. [Google Scholar] [CrossRef]
- Karmaker, C.L.; Ahmed, T.; Ahmed, S.; Ali, S.M.; Moktadir, M.A.; Kabir, G. Improving supply chain sustainability in the context of COVID-19 pandemic in an emerging economy: Exploring drivers using an integrated model. Sustain. Prod. Consum. 2021, 26, 411–427. [Google Scholar] [CrossRef]
- Sajjad, A.; Eweje, G.; Tappin, D. Managerial perspectives on drivers for and barriers to sustainable supply chain management implementation: Evidence from New Zealand. Bus. Strategy Environ. 2020, 29, 592–604. [Google Scholar] [CrossRef]
- Özaşkın, A.; Görener, A. An integrated multi-criteria decision-making approach for overcoming barriers to green supply chain management and prioritizing alternative solutions. Supply Chain. Anal. 2023, 3, 100027. [Google Scholar] [CrossRef]
- Sumrit, D.; Jongprasittiphol, O. Exploring barriers in supply chain disaster management using fuzzy total interpretative structure modeling approach: Insight from Thai automotive industry. Asia Pac. Manag. Rev. 2023, 29, 84–103. [Google Scholar] [CrossRef]
- Malviya, R.K.; Kant, R. Identifying critical success factors for green supply chain management implementation using fuzzy DEMATEL method. In Proceedings of the 2014 IEEE International Conference on Industrial Engineering and Engineering Management (IEEM), Selangor Darul Ehsan, Selangor, Malaysia, 9–12 December 2014; IEEE: New York, NY, USA, 2014; pp. 214–218. [Google Scholar] [CrossRef]
- Fan, L.; Yi, H. The influence factors analysis on response speed of agile supply chain. Adv. Mater. Res. 2012, 472–475, 3269–3272. [Google Scholar] [CrossRef]
- Guritno, A.D.; Fujianti, R.; Kusumasari, D. Assessment of the supply chain factors and classification of inventory management in suppliers’ level of fresh vegetables. Agric. Agric. Sci. Procedia 2015, 3, 51–55. [Google Scholar] [CrossRef]
- Mohseni, S.; Baghizadeh, K.; Pahl, J. Evaluating barriers and drivers to sustainable food supply chains. Math. Probl. Eng. 2022, 2022, 1–24. [Google Scholar] [CrossRef]
- Akcan, S.; Taş, M.A. Green supplier evaluation with SWARA-TOPSIS integrated method to reduce ecological risk factors. Environ. Monit. Assess. 2019, 191, 226. [Google Scholar] [CrossRef]
- Mumtaz, U.; Ali, Y.; Petrillo, A.; de Felice, F. Identifying the critical factors of green supply chain management: Environmental benefits in Pakistan. Sci. Total Environ. 2018, 640–641, 144–152. [Google Scholar] [CrossRef] [PubMed]
- Muduli, K.; Govindan, K.; Barve, A.; Kannan, D.; Geng, Y. Role of behavioural factors in green supply chain management implementation in Indian mining industries. Resour. Conserv. Recycl. 2013, 76, 50–60. [Google Scholar] [CrossRef]
- Akman, G.; Pışkın, H. Evaluating green performance of suppliers via analytic network process and TOPSIS. J. Ind. Eng. 2013, 2013, 1–13. [Google Scholar] [CrossRef]
- Aslam, H.; Rashid, K.; Wahla, A.R.; Tahira, U. Drivers of green supply chain management practices and their impact on firm performance: A developing country perspective. J. Quant. Methods 2018, 2, 87–113. [Google Scholar] [CrossRef]
- Zhu, Q.; Sarkis, J.; Lai, K.-H. Confirmation of a measurement model for green supply chain management practices implementation. Int. J. Prod. Econ. 2008, 111, 261–273. [Google Scholar] [CrossRef]
- Vasiliauskas, A.V.; Zinkevičiūtė, V.; Šimonytė, E. Implementation of the concept of green logistics reffering to it applications for road freight transport enterprises. Bus. Theory Pract. 2013, 14, 43–50. [Google Scholar] [CrossRef]
- Uygun, Ö.; Dede, A. Performance evaluation of green supply chain management using integrated fuzzy multi-criteria decision making techniques. Comput. Ind. Eng. 2016, 102, 502–511. [Google Scholar] [CrossRef]
- Uddin, S.; Ali, S.M.; Kabir, G.; Suhi, S.A.; Enayet, R.; Haque, T. An AHP-ELECTRE framework to evaluate barriers to green supply chain management in the leather industry. Int. J. Sustain. Dev. World Ecol. 2019, 26, 732–751. [Google Scholar] [CrossRef]
- Song, W.; Xu, Z.; Liu, H.-C. Developing sustainable supplier selection criteria for solar air-conditioner manufacturer: An integrated approach. Renew. Sustain. Energy Rev. 2017, 79, 1461–1471. [Google Scholar] [CrossRef]
- Kim, J.; Rhee, J. An empirical study on the impact of critical success factors on the balanced scorecard performance in Korean green supply chain management enterprises. Int. J. Prod. Res. 2012, 50, 2465–2483. [Google Scholar] [CrossRef]
- Zain, R.M.; Ramli, A.; Zain, M.Z.M.; Yekini, L.S.; Musa, A.; Rahim, M.N.A.; Dirie, A.N.; Aziz, N.I.C. An investigation of the barriers and drivers for implementing green supply chain in Malaysian food and beverage SMEs: A qualitative perspective. Wseas Trans. Bus. Econ. 2024, 21, 2169–2189. [Google Scholar] [CrossRef]
- Mankar, V.A.; Vichoray, C.; Shukla, H. Sustainable supply chain management in SMEs: Analyzing drivers and barriers to green practices in Nagpur. Nanotechnol. Percept. 2024, 20, 1133–1140. [Google Scholar] [CrossRef]
- Koul, P.; Roy Ghatak, R. An analysis of factors influencing green supply chain drivers in the Indian real estate sector using the ISM-DEMATEL approach. Found. Manag. 2024, 16, 83–102. [Google Scholar] [CrossRef]
- Ermawati, E.; Budiyanto, B.; Suwitho, S. The effects of internal driver, external pressure and green entrepreneurial orientation (GEO) on green supply chain management (GSCM) performance through GSCM practice in wood processing companies in Lumajang district. Uncertain. Supply Chain. Manag. 2024, 12, 633–648. [Google Scholar] [CrossRef]
- Fatima, N.; Abrar, M.; Shahbaz, M. Untangling the influencing factors of intention to adopt green supply chain management practices: An integration of Toe framework and self-determination theory. Oper. Supply Chain. Manag. Int. J. 2024, 17, 104–122. [Google Scholar] [CrossRef]
- Babalola, H.B.; Rahim, M.K.I.A.; Omar, S. Environmental factors and adoption of green supply chain management among SMEs in Nigeria: Moderating role of environmental uncertainty. Int. J. Energy Econ. Policy 2024, 14, 640–650. [Google Scholar] [CrossRef]
- Ali, R.F.; Jahankhani, H.; Ali, K.; Hassan, B. Blockchain-based security factors on sustainable supply chain management in UK manufacturing firms: A hybrid SEM-ANN approach. Systems 2024, 12, 208. [Google Scholar] [CrossRef]
- Karim, M.R.; Dulal, M.; Sakila, F.; Aditi, P.; Smrity, S.J.; Asha, N.N. Analyzing the factors influencing sustainable supply chain management in the textile sector. Clean. Logist. Supply Chain. 2024, 13, 100183. [Google Scholar] [CrossRef]
- Andalib Ardakani, D.; Kiani, M.; Saffari Darberazi, A.; Zamzam, F.; Mofatehzadeh, E. An interval type-2 fuzzy AHP approach for success factors of green supply chain management. Int. J. Res. Ind. Eng. 2024, 13, 237–256. [Google Scholar] [CrossRef]
- Jain, P.; Tambuskar, D.P.; Narwane, V. Identification of critical factors for big data analytics implementation in sustainable supply chain in emerging economies. J. Eng. Des. Technol. 2024, 22, 926–968. [Google Scholar] [CrossRef]
- Chen, J.-K.; Tseng, T.-C. A duo-theme cloud model DEMATEL approach for exploring the cause factors of green supply chain management. PLoS ONE 2024, 19, e0294684. [Google Scholar] [CrossRef] [PubMed]
- Hsu, C.-H.; Wu, J.-Z.; Zhang, T.-Y.; Chen, J.-Y. Deploying Industry 5.0 drivers to enhance sustainable supply chain risk resilience. Int. J. Sustain. Eng. 2024, 17, 211–238. [Google Scholar] [CrossRef]
- Osintsev, N.; Rakhmangulov, A.; Sładkowski, A.; Dyorina, N. Logistic flow control system in green supply chains. In Ecology in Transport: Problems and Solutions; Sładkowski, A., Ed.; Springer International Publishing: Cham, Netherlands, 2020; pp. 311–380. ISBN 978-3-030-42322-3. [Google Scholar]
- Rakhmangulov, A.; Sladkowski, A.; Osintsev, N.; Muravev, D. Green logistics: Element of the sustainable development concept. Part 1. Naše More 2017, 64, 120–126. [Google Scholar] [CrossRef]
- Rakhmangulov, A.; Sladkowski, A.; Osintsev, N.; Muravev, D. Green logistics: A system of methods and instruments—Part 2. Naše More 2018, 65, 49–55. [Google Scholar] [CrossRef]
- Rakhmangulov, A.; Sładkowski, A.; Osintsev, N. Design of an ITS for industrial enterprises. In Intelligent Transportation Systems—Problems and Perspectives; Sładkowski, A., Pamuła, W., Eds.; Springer International Publishing: Cham, Switzerland, 2016; pp. 161–215. ISBN 978-3-319-19149-2. [Google Scholar]
- Osintsev, N.; Kazarmshchikova, E. Factors of sustainable development of transport and logistics systems. Mod. Probl. Russ. Transp. Complex 2017, 7, 13–21. [Google Scholar] [CrossRef]
- Osintsev, N.; Rakhmangulov, A.; Baginova, V. Evaluation of logistic flows in green supply chains based on the combined DEMATEL-ANP method. Facta Univ. Ser. Mech. Eng. 2021, 19, 473–498. [Google Scholar] [CrossRef]
- Gabus, A.; Fontela, E. World Problems, an Invitation to Further Thought Within the Framework of DEMATEL; Battelle Geneva Research Centre: Geneva, Switzerland, 1972. [Google Scholar]
- Chang, B.; Chang, C.-W.; Wu, C.-H. Fuzzy DEMATEL method for developing supplier selection criteria. Expert. Syst. Appl. 2011, 38, 1850–1858. [Google Scholar] [CrossRef]
- Bai, C.; Sarkis, J. A grey-based DEMATEL model for evaluating business process management critical success factors. Int. J. Prod. Econ. 2013, 146, 281–292. [Google Scholar] [CrossRef]
- Govindan, K.; Kannan, D.; Shankar, K.M. Evaluating the drivers of corporate social responsibility in the mining industry with multi-criteria approach: A multi-stakeholder perspective. J. Clean. Prod. 2014, 84, 214–232. [Google Scholar] [CrossRef]
- Opricovic, S.; Tzeng, G.-H. Defuzzification within a multicriteria decision model. J. Uncertain. Fuzziness Knowl. Based Syst. 2003, 11, 635–652. [Google Scholar] [CrossRef]
- Lin, C.-J.; Wu, W.-W. A causal analytical method for group decision-making under fuzzy environment. Expert. Syst. Appl. 2008, 34, 205–213. [Google Scholar] [CrossRef]
- Puška, A.; Stević, Ž.; Pamučar, D. Evaluation and selection of healthcare waste incinerators using extended sustainability criteria and multi-criteria analysis methods. Environ. Dev. Sustain. 2021, 32, 688. [Google Scholar] [CrossRef] [PubMed]
- Seikh, M.R.; Mukherjee, A. Fermatean fuzzy CRADIS approach based on triangular divergence for selecting online shopping platform. Trans. Fuzzy Sets Syst. 2024, 3, 108–127. [Google Scholar] [CrossRef]
- Qiu, K.; Chen, J.; Ashraf, S.; Shahid, T. Strategic decision support system with probabilistic linguistic term sets: Extended CRADIS approach for supply chain risk management in sports industry. IEEE Access 2024, 1. Available online: https://www.scopus.com/record/display.uri?eid=2-s2.0-85196507996&origin=resultslist&sort=plf-f&src=s&sot=b&sdt=b&s=TITLE%28Strategic+decision+support+system+with+probabilistic+linguistic+term+sets%29&sessionSearchId=e322fdbb4bf3d2da9773c9f1f9043a8f (accessed on 3 February 2025).
- Puška, A.; Nedeljković, M.; Stojanović, I.; Božanić, D. Application of fuzzy TRUST CRADIS method for selection of sustainable suppliers in agribusiness. Sustainability 2023, 15, 2578. [Google Scholar] [CrossRef]
- Stojanović, I. Selection of green contractor for the implementation of a solar power plant project. Symmetry 2024, 16, 441. [Google Scholar] [CrossRef]
- Rani, P.; Mishra, A.R.; Alshamrani, A.M.; Alrasheedi, A.F.; Tirkolaee, E.B. Picture fuzzy compromise ranking of alternatives using distance-to-ideal-solution approach for selecting blockchain technology platforms in logistics firms. Eng. Appl. Artif. Intell. 2025, 142, 109896. [Google Scholar] [CrossRef]
- Puška, A.; Štilić, A.; Stević, Ž. A comprehensive decision framework for selecting distribution center locations: A hybrid improved fuzzy SWARA and fuzzy CRADIS approach. Computation 2023, 11, 73. [Google Scholar] [CrossRef]
- Hwang, C.-L.; Yoon, K. Multiple Attribute Decision Making: Methods and Applications: A State-of-the-Art Survey; Springer: Berlin/Heidelberg, Germany, 1981; ISBN 3642483186. [Google Scholar]
- Zavadskas, E.K.; Turskis, Z. A new additive ratio assessment (ARAS) method in multicriteria decision-making. Technol. Econ. Dev. Econ. 2010, 16, 159–172. [Google Scholar] [CrossRef]
- Stević, Ž.; Pamučar, D.; Puška, A.; Chatterjee, P. Sustainable supplier selection in healthcare industries using a new MCDM method: Measurement of alternatives and ranking according to COmpromise solution (MARCOS). Comput. Ind. Eng. 2020, 140, 106231. [Google Scholar] [CrossRef]
- Ouro-Salim, O.; Guarnieri, P. Drivers and barriers in the institutionalisation of circular economy practices in food supply chains: A review. Bus. Strat. Dev. 2023, 6, 764–784. [Google Scholar] [CrossRef]
- Hebaz, A.; Oulfarsi, S. The drivers and barriers of green supply chain management implementation: A review. Acta Logist. 2021, 8, 123–132. [Google Scholar] [CrossRef]
- Mehmood, A.; Ahmed, S.; Viza, E.; Bogush, A.; Ayyub, R.M. Drivers and barriers towards circular economy in agri-food supply chain: A review. Bus. Strategy Dev. 2021, 4, 465–481. [Google Scholar] [CrossRef]
- Hasheminasab, Z.; Nasrabadi, E.M.; Sadeqi-Arani, Z. Challenges and drivers of the internet of things in the supply chain: A systematic review. Int. J. Ind. Eng. Prod. Res. 2024, 35, 2046. [Google Scholar] [CrossRef]
- Ibrahim, M.F.; Putri, M.M.; Utama, D.M. A literature review on reducing carbon emission from supply chain system: Drivers, barriers, performance indicators, and practices. IOP Conf. Ser. Mater. Sci. Eng. 2020, 722, 12034. [Google Scholar] [CrossRef]
- Dhulla, S.; Narwal, M.S. Drivers and barriers in green supply chain management adaptation: A state-of-art review. Uncertain. Supply Chain. Manag. 2016, 4, 61–76. [Google Scholar] [CrossRef]
- Osintsev, N.A.; Rakhmangulov, A.N.; Mishkurov, P.N.; Kornilov, S.N.; Melnikov, M.S. The concept of hybrid multicriteria model of sustainable supply chain. Vestn. Rostov. Gos. Univ. Putey Soobshcheniya 2024, 93, 90–104. [Google Scholar]

| Supply Chain Elements | Sustainable Supply Chain Drivers | References |
|---|---|---|
| Input element | D1.1—Environmentally friendly raw materials (at supplier) | [19,31,43,50,55,56,59,60,61,64,66,67,68,69,72,77,96,99,101,102] |
| D1.2—Raw materials able to reuse or recycle | [11,16,19,27,31,33,44,46,49,56,64,97,104] | |
| D1.3—Raw materials procurement system | [30,31,36,50,52,53,57,59,60,64,66,67,81,105] | |
| D1.4—Eco-friendly suppliers | [4,10,12,17,22,28,32,33,42,47,48,49,50,55,57,58,60,61,63,64,66,67,68,72,75,76,77,94,96,97,99,101,102,103,105] | |
| D1.5—Delivery distance of raw materials | [31,32,64] | |
| D1.6—Type of packaging for raw materials | [12,16,36,46,52,53,60,61,64,68,73,94] | |
| D1.7—Raw material eco-labeling | [16,46,59] | |
| D1.8—E-commerce with supplier | [62,75] | |
| Processing element | D2.1—Eco-friendly raw materials from the manufacturer | [11,12,19,43,51,56,59,60,64,66,68,69,72,77,96,99] |
| D2.2—Reusable or recyclable raw materials | [16,27,44,46,56,64,77,104] | |
| D2.3—Eco-friendly equipment | [8,19,33,44,51,59,64,69,97,102] | |
| D2.4—Energy and resource saving technologies | [4,22,33,35,36,44,47,49,69,72,94,102,104,105] | |
| D2.5—Eco-friendly production technologies | [4,8,19,22,33,35,36,44,47,51,56,57,58,61,63,64,65,69,70,71,72,73,77,78,81,95,96,97,102,103,104] | |
| D2.6—Environmental protection systems | [20,32,35,51,61,64] | |
| D2.7—Industrial waste | [11,12,16,20,28,30,31,36,41,44,50,52,58,64,66,67,72,73,77,97,104,105] | |
| D2.8—Labor conditions | [51,55,58,59] | |
| D2.9—Eco-learning | [4,8,11,16,19,23,28,30,31,32,36,47,48,54,56,57,58,59,62,64,65,72,73,74,77,78,79,81,95,96,102,103,104] | |
| Transport element | D3.1—Transport type | [19,51,61,69,81] |
| D3.2—Transport link type | [51] | |
| D3.3—Route of transportation | [64] | |
| D3.4—Cargo flow structure | [81] | |
| D3.5—Frequency and size of shipments | [31,36,50,52,53,57,59,60,81] | |
| D3.6—Compliance of transportation vehicles with legal regulations | [19,35,44,51,61,64,69,94,102,104] | |
| D3.7—Fuel type | [51,64] | |
| D3.8—Technical condition of vehicle fleet | [64] | |
| D3.9—Vehicle type and model | [61,64] | |
| D3.10—Vehicles loading degree | [64] | |
| D3.11—Equipment of rolling stock with navigation and telecommunication systems | [10] | |
| D3.12—Eco-driving | [41,89] | |
| Cumulative element | D4.1—Eco-raw materials and materials for warehouse construction | [72] |
| D4.2—Warehouse type | [40,83,86] | |
| D4.3—Spatial organization of warehouse facilities | [44] | |
| D4.4—Energy-saving technologies | [4,22,33,36,44,47,49,69,72,73,104,105] | |
| D4.5—Environment protection systems | [20,35,61,64] | |
| D4.6—Eco-friendly loading and unloading equipment | [19,35,44,64] | |
| D4.7—Mechanization and automation of loading and unloading operations | [15,29,44,102,105] | |
| D4.8—Inventory management system | [9,12,32] | |
| D4.9—Placement and storage of products and waste | [11,12,16,20,36,44,47,50,52,53,58,66,72] | |
| D4.10—Type of packaging for products | [36,46,52,53,61,64,68,73,94,102] | |
| D4.11—Labor conditions | [19,59] | |
| Output element | D5.1—Eco-marketing | [4,16,20,22,27,28,30,33,35,36,41,43,46,47,48,49,58,59,63,64,65,67,68,69,72,75,76,77,81,96,99,101,105] |
| D5.2—Eco-friendly sales channels | [10,11,16,17,22,27,33,46,48,50,51,55,57,58,59,64,72,75,76,94,96,97,102] | |
| D5.3—Tare and packaging return system | [12,16,27,36,50,60,61,64,99] | |
| D5.4—Type of packaging for products | [12,16,36,46,52,53,61,64,68,73] | |
| D5.5—Eco-labeling of products | [15,29,46,58,59,60] | |
| D5.6—E-commerce with consumer | [62,75] | |
| Control element | D6.1—Environment strategy | [4,8,10,11,16,19,20,22,23,27,28,30,31,32,33,35,36,41,42,46,47,48,49,50,52,53,55,56,57,58,61,63,65,66,68,70,71,73,74,75,76,77,78,79,80,81,98,101,102] |
| D6.2—Environmental audit | [16,20,22,36,48,50,59,66,95,98,102,103] | |
| D6.3—Corporate Information Systems | [8,10,11,15,16,17,23,29,31,33,43,47,50,54,56,59,62,63,65,66,70,71,74,75,76,79,80,81,94,95,100,102,103] | |
| D6.4—Information and communication technologies | [3,9,10,12,15,23,27,29,30,33,35,42,46,50,57,58,59,62,63,66,70,71,72,73,75,76,78,79,80,81,97,100,103] | |
| D6.5—Intelligent Transportation Systems | [21,83,89] | |
| D6.6—Corporate social responsibility | [3,4,8,11,15,17,19,20,22,23,28,29,32,35,36,41,46,47,50,51,52,53,54,55,56,58,59,63,64,65,66,72,74,76,78,79,95,96,97,98,100,101,102,103,105] | |
| D6.7—Return and reverse flow management systems | [4,12,16,27,28,36,46,47,49,52,53,56,60,61,65,73,77,94,96,99,101] | |
| D6.8—Recycling processes for waste, packaging, finished products | [11,12,16,20,22,27,28,30,31,41,44,46,47,50,52,53,58,61,64,66,67,68,69,72,77,96,97,99,105] |
| Criteria | Characteristic | Sub-Criteria | Characteristic |
|---|---|---|---|
| Economic criteria (C1) | The efficiency of using all types of resources in the SSC | Profit (C1.1) | Difference between total revenue and operating costs |
| Operating expenses (C1.2) | The sum of all costs associated with converting investments into profits | ||
| Fixed investment (C1.3) | Cash flow for the formation of fixed assets | ||
| Energy–ecological criteria (C2) | The efficiency of energy use during the movement of logistics flows and their impact on the environment | The energy intensity (C2.1) | The amount of energy spent on the movement of the logistics flow |
| Greenhouse gas emissions of CO2 (C2.2) | The total volume of greenhouse gas emissions from all sources involved in the movement of the logistics flow | ||
| Quality criteria (C3) | The safety and timeliness of movement and processing of logistics flows, as well as the quality of their management | Safety of cargo transportation (C3.1) | Comprehensive indicator of the material flow movement without damage, pollution, or loss |
| Timeliness of cargo transportation (C3.2) | Comprehensive indicator of the material flow movement by the appointed date, regularly, or at the required speed | ||
| The coefficient of flow controllability (C3.3) | The ratio of the number of information messages on compliance with the indicators of safety and timeliness of transportation to the total number of management decisions | ||
| Statistical criteria (C4) | The patterns of change in the controlled sub-criteria of logistics flows | The coefficient of flow irregularity (C4.1) | Deviation of the logistics flows’ physical parameters of from their average values |
| The coefficient of complexity structure of flow (C4.2) | The number of streams within the logistic flow | ||
| The coefficient of flow discreteness (C.4.3) | The number of elements of the logistic flow in the stream | ||
| The coefficient of differentiability of flow (C4.4) | Changing the structure of the logistics flow (number of streams) in the process of movement | ||
| Flow’s physical criteria (C5) | The intensity of logistics flows and their spatio-temporal changes | The mass (quantity) of flow (C5.1) | The total number of elements in the logistics flow |
| The speed of flow (C5.2) | The speed of movement of the logistics flow elements | ||
| The length of the route (C5.3) | Distance traveled by a logistic flow element while moving along a route |
| Linguistic Variables | Scale Numbers | ||
|---|---|---|---|
| Crisp | Fuzzy | Grey | |
| No influence (N) | 0 | [0,0,0] | [0,0] |
| Low influence (L) | 1 | [0,1,2] | [0,1] |
| Medium influence (M) | 2 | [1,2,3] | [1,2] |
| High influence (H) | 3 | [2,3,4] | [2,3] |
| Very high influence (VH) | 4 | [3,4,4] | [3,4] |
| Steps | C-DEMATEL | F-DEMATEL | G-DEMATEL |
|---|---|---|---|
| III.1. Construction of the initial matrix of direct links between the criteria | where C—initial matrix of direct relations, aij—degree of influence of i-th criterion on j-th criterion | where —initial fuzzy matrix of direct relations, —degree of influence of i-th criterion on j-th criterion, represented by triangular fuzzy numbers | where G—the initial gray matrix of direct relations, ⊗gij—the gray number showing the degree of influence of the i-th criterion on the j-th criterion. If is the upper boundary of the gray number and is its lower boundary, then |
| III.2. Normalization of the direct relations matrix | , where —normalized matrix of direct relations | where —normalized fuzzy matrix of direct relations, It is considered that there is at least one value i such that where 3—number of values defining the fuzzy number | where —normalized matrix of direct relations; —, the lower and upper limits of the gray number, respectively; n—criteria number |
| III.3. Calculation of the total matrix of direct relations | where —total matrix of direct relations between criteria | then where —total fuzzy matrix of direct relations between criteria; —fuzzy numbers of the total relational matrix, , | where —total matrix of direct relations between criteria, I—single matrix |
| III.4. Calculation of the number of relationships (Di+Ri) and forces of influence (Di–Ri) between criteria | The sum of rows and the sum of columns are denoted, respectively, as vectors D and R in the total relation matrix T and are calculated by the following formulas | Compute and , where and are the sum of the rows and the sum of the columns in the overall fuzzy relations matrix . Then the fuzzy numbers are converted to absolute values [116,117]. | The sums of rows ⊗Ri and the sums of columns ⊗Di in the total relation matrix Tg are calculated by the following formulas: |
| III.5. Building a network relationship map of the criteria. Ranking of criteria according to the values of weighting coefficients calculated based on the results of the assessment of the number of interrelationships (Di + Ri) and the strength of influence (Di − Ri) between the criteria | |||
| № | Academic Degree | Number of Experts | Expert Science Interests | Work Experience in the Field of Research |
|---|---|---|---|---|
| 1 | Professor, doctor (Technical Science) | 1 | Supply chain management, transport systems | 41 |
| 1 | Supply chain management, logistics | 34 | ||
| 1 | Transport systems, logistics | 18 | ||
| 2 | Assistant Professor (PhD) | 1 | Supply chain management | 17 |
| 1 | Transport systems, warehouse systems | 17 |
| Criteria | C1 | C2 | C3 | C4 | C5 | |||||||||||||||||||||
|---|---|---|---|---|---|---|---|---|---|---|---|---|---|---|---|---|---|---|---|---|---|---|---|---|---|---|
| Experts | Ex1 | Ex2 | Ex3 | Ex4 | Ex5 | Ex1 | Ex2 | Ex3 | Ex4 | Ex5 | Ex1 | Ex2 | Ex3 | Ex4 | Ex5 | Ex1 | Ex2 | Ex3 | Ex4 | Ex5 | Ex1 | Ex2 | Ex3 | Ex4 | Ex5 | |
| Criteria | C1 | N | N | N | N | N | H | H | VH | H | H | H | H | VH | VH | VH | L | VH | M | M | M | VH | H | H | M | H |
| C2 | VH | H | L | VH | M | N | N | N | N | N | M | M | L | H | N | L | M | N | H | N | M | H | M | M | N | |
| C3 | VH | VH | VH | VH | H | H | VH | M | M | M | N | N | N | N | N | H | H | L | M | M | H | VH | H | L | M | |
| C4 | L | N | L | M | M | N | N | N | M | L | L | N | N | M | VH | N | N | N | N | N | L | N | N | M | L | |
| C5 | VH | VH | H | H | H | H | VH | M | H | VH | H | VH | H | M | L | H | VH | L | M | L | N | N | N | N | N | |
| Sub-criteria | C1.1 | C1.2 | C1.3 | C2.1 | C2.2 | |||||||||||||||||||||
| Experts | Ex1 | Ex2 | Ex3 | Ex4 | Ex5 | Ex1 | Ex2 | Ex3 | Ex4 | Ex5 | Ex1 | Ex2 | Ex3 | Ex4 | Ex5 | Ex1 | Ex2 | Ex3 | Ex4 | Ex5 | Ex1 | Ex2 | Ex3 | Ex4 | Ex5 | |
| Sub-criteria | C1.1 | N | N | N | N | N | M | M | VH | H | N | VH | VH | VH | VH | L | M | M | VH | L | N | L | H | VH | L | N |
| C1.2 | VH | VH | VH | H | VH | N | N | N | N | N | L | H | VH | H | N | M | H | VH | H | L | L | M | M | L | L | |
| C1.3 | H | H | VH | VH | VH | H | M | VH | H | H | N | N | N | N | N | L | VH | VH | H | H | L | H | VH | H | H | |
| C2.1 | H | VH | VH | H | L | VH | VH | VH | H | M | M | L | H | M | L | N | N | N | N | N | VH | VH | H | H | M | |
| C2.2 | M | H | L | L | N | H | H | L | L | H | M | L | H | M | H | H | VH | N | L | L | N | N | N | N | N | |
| C3.1 | VH | VH | H | H | VH | M | VH | M | H | H | L | L | N | L | M | L | H | VH | L | N | L | M | N | N | N | |
| C3.2 | H | H | H | H | VH | H | H | M | H | H | L | L | N | M | L | H | VH | L | M | N | M | M | N | L | N | |
| C3.3 | M | VH | L | L | M | H | VH | L | M | H | L | L | N | L | H | L | VH | M | L | L | M | M | N | L | M | |
| C4.1 | M | VH | L | L | M | H | VH | L | M | H | L | L | N | L | L | L | VH | M | M | M | L | VH | N | L | N | |
| C4.2 | L | VH | N | M | L | M | VH | M | H | M | L | L | N | L | M | M | H | M | H | L | M | H | N | M | N | |
| C4.3 | L | VH | L | L | M | M | VH | L | M | H | L | L | N | L | M | M | VH | L | M | N | H | H | N | L | N | |
| C4.4 | L | M | N | L | M | M | M | M | M | H | L | L | N | L | M | M | H | L | M | N | M | H | N | L | N | |
| C5.1 | H | VH | VH | VH | VH | H | VH | VH | VH | VH | H | H | N | M | M | VH | VH | VH | H | M | VH | VH | L | VH | H | |
| C5.2 | M | VH | VH | H | M | H | VH | L | VH | VH | M | M | N | M | VH | H | VH | M | VH | VH | M | VH | N | M | M | |
| C5.3 | M | L | M | H | L | M | VH | M | VH | L | L | H | N | L | L | H | VH | H | VH | L | M | VH | N | H | M | |
| Sub-criteria | C3.1 | C3.2 | C3.3 | C4.1 | C4.2 | |||||||||||||||||||||
| Experts | Ex1 | Ex2 | Ex3 | Ex4 | Ex5 | Ex1 | Ex2 | Ex3 | Ex4 | Ex5 | Ex1 | Ex2 | Ex3 | Ex4 | Ex5 | Ex1 | Ex2 | Ex3 | Ex4 | Ex5 | Ex1 | Ex2 | Ex3 | Ex4 | Ex5 | |
| Sub-criteria | C1.1 | M | H | VH | M | N | M | H | M | M | N | M | H | M | M | N | L | H | L | M | N | L | H | N | L | N |
| C1.2 | H | H | M | M | M | H | H | L | H | M | L | M | L | L | L | L | L | N | M | L | L | L | N | M | N | |
| C1.3 | M | M | H | M | VH | M | M | L | M | H | M | H | L | M | M | L | L | M | L | M | L | L | M | M | M | |
| C2.1 | L | L | M | L | N | L | L | L | H | N | L | H | L | M | N | L | VH | N | M | N | L | H | N | H | N | |
| C2.2 | L | N | N | L | N | L | N | N | L | N | L | N | N | L | N | L | N | N | L | N | L | N | N | L | N | |
| C3.1 | N | N | N | N | N | M | H | N | VH | L | M | H | N | L | L | L | L | L | M | L | M | N | N | H | N | |
| C3.2 | L | H | N | M | N | N | N | N | N | N | M | H | L | M | L | M | VH | L | H | M | L | VH | N | H | N | |
| C3.3 | M | H | H | L | M | VH | VH | H | M | H | N | N | N | N | N | L | VH | VH | M | M | L | VH | H | H | M | |
| C4.1 | L | H | L | M | L | H | VH | H | H | H | H | VH | L | H | L | N | N | N | N | N | M | VH | N | H | N | |
| C4.2 | H | H | H | M | M | M | VH | H | H | H | M | VH | M | H | VH | M | VH | M | M | H | N | N | N | N | N | |
| C4.3 | M | H | N | M | N | M | VH | L | H | N | M | VH | L | H | M | M | VH | VH | H | M | M | VH | L | H | H | |
| C4.4 | M | M | H | L | N | M | VH | H | M | N | M | VH | M | M | M | M | VH | M | M | L | H | VH | H | M | VH | |
| C5.1 | H | H | L | H | L | M | VH | H | H | L | H | H | L | H | L | M | VH | L | M | M | L | VH | N | VH | M | |
| C5.2 | M | VH | N | M | N | VH | VH | VH | VH | N | H | H | M | H | M | M | H | L | M | VH | L | M | N | H | L | |
| C5.3 | M | H | N | H | M | H | VH | VH | H | H | M | VH | L | H | N | M | VH | L | M | L | L | H | N | M | L | |
| Sub-criteria | C4.3 | C4.4 | C5.1 | C5.2 | C5.3 | |||||||||||||||||||||
| Experts | Ex1 | Ex2 | Ex3 | Ex4 | Ex5 | Ex1 | Ex2 | Ex3 | Ex4 | Ex5 | Ex1 | Ex2 | Ex3 | Ex4 | Ex5 | Ex1 | Ex2 | Ex3 | Ex4 | Ex5 | Ex1 | Ex2 | Ex3 | Ex4 | Ex5 | |
| Sub-criteria | C1.1 | L | H | N | L | N | L | H | N | L | N | M | VH | H | M | M | L | H | L | M | M | L | L | N | L | N |
| C1.2 | L | L | N | L | L | L | L | N | L | L | L | L | H | H | N | L | L | L | H | L | L | L | N | L | N | |
| C1.3 | M | M | L | L | M | L | L | N | L | M | L | L | H | M | H | M | M | M | H | H | L | L | L | M | L | |
| C2.1 | M | VH | N | H | N | M | H | L | H | N | H | L | VH | M | N | M | L | H | M | N | M | L | L | L | N | |
| C2.2 | L | N | N | L | N | L | N | N | L | N | L | N | N | L | N | L | N | N | L | N | L | N | N | L | N | |
| C3.1 | L | L | L | M | L | L | L | L | M | L | M | M | L | L | N | L | H | L | M | N | L | H | N | M | N | |
| C3.2 | L | VH | N | H | N | L | VH | N | H | N | L | L | L | L | N | H | M | VH | L | N | M | M | VH | L | N | |
| C3.3 | L | VH | VH | M | L | L | VH | H | M | L | L | L | M | L | N | M | H | VH | L | H | M | L | M | L | N | |
| C4.1 | M | VH | N | M | N | L | H | L | H | L | L | L | H | L | N | M | L | M | H | L | L | N | N | L | N | |
| C4.2 | L | H | L | H | M | M | VH | L | H | M | L | H | N | M | L | L | M | L | H | M | L | L | L | M | N | |
| C4.3 | N | N | N | N | N | L | M | L | H | L | L | L | H | H | N | H | M | L | H | M | M | M | N | L | N | |
| C4.4 | L | M | M | M | M | N | N | N | N | N | L | L | L | M | L | L | H | M | M | L | M | M | L | L | N | |
| C5.1 | H | VH | L | M | M | M | H | L | H | M | N | N | N | N | N | VH | H | M | H | VH | L | N | N | L | H | |
| C5.2 | H | M | M | M | L | L | H | M | H | L | L | N | N | H | N | N | N | N | N | N | L | N | N | L | N | |
| C5.3 | M | M | N | M | N | M | M | N | M | N | L | N | N | M | M | VH | M | M | H | L | N | N | N | N | N | |
| Supply Chain Elements | Drivers | Sub-Criteria | ||||||||||||||
|---|---|---|---|---|---|---|---|---|---|---|---|---|---|---|---|---|
| C1.1 | C1.2 | C1.3 | C2.1 | C2.2 | C3.1 | C3.2 | C3.3 | C4.1 | C4.2 | C4.3 | C4.4 | C5.1 | C5.2 | C5.3 | ||
| Input element | D1.1 | 3.10 | 4.00 | 1.78 | 2.70 | 3.76 | 1.00 | 1.00 | 1.15 | 1.15 | 2.70 | 2.05 | 2.64 | 2.17 | 1.89 | 2.76 |
| D1.2 | 3.81 | 4.32 | 2.05 | 3.59 | 4.32 | 1.52 | 1.52 | 1.43 | 1.32 | 2.70 | 2.17 | 2.49 | 3.29 | 2.55 | 2.72 | |
| D1.3 | 4.13 | 4.37 | 2.41 | 3.29 | 3.10 | 3.90 | 4.32 | 4.32 | 4.13 | 3.37 | 3.57 | 3.57 | 2.86 | 3.10 | 2.86 | |
| D1.4 | 2.55 | 2.70 | 1.74 | 2.22 | 3.64 | 2.35 | 2.40 | 2.09 | 1.89 | 2.22 | 2.05 | 2.17 | 1.64 | 2.17 | 4.18 | |
| D1.5 | 3.90 | 4.32 | 1.74 | 3.52 | 3.13 | 3.57 | 4.32 | 4.18 | 3.81 | 2.86 | 3.37 | 3.00 | 2.17 | 2.76 | 4.78 | |
| D1.6 | 3.10 | 4.00 | 2.35 | 2.70 | 4.13 | 1.64 | 1.32 | 1.64 | 1.52 | 2.70 | 2.49 | 2.49 | 2.55 | 2.35 | 2.14 | |
| D1.7 | 2.05 | 2.55 | 1.89 | 2.00 | 1.82 | 1.89 | 1.43 | 1.52 | 1.43 | 1.93 | 1.32 | 1.32 | 1.32 | 1.43 | 1.55 | |
| D1.8 | 2.70 | 3.10 | 2.70 | 2.35 | 2.05 | 2.93 | 3.29 | 2.95 | 2.40 | 2.17 | 1.89 | 2.05 | 1.52 | 2.14 | 1.43 | |
| Processing element | D2.1 | 3.39 | 4.57 | 2.61 | 3.47 | 3.31 | 1.38 | 1.15 | 1.15 | 1.52 | 2.35 | 1.93 | 2.05 | 2.05 | 2.17 | 1.89 |
| D2.2 | 3.13 | 4.32 | 2.35 | 3.39 | 4.32 | 1.15 | 1.32 | 1.32 | 1.64 | 2.22 | 2.05 | 2.05 | 2.76 | 2.05 | 2.27 | |
| D2.3 | 3.10 | 3.57 | 3.98 | 3.59 | 4.78 | 1.74 | 1.74 | 1.78 | 1.89 | 1.78 | 1.78 | 1.64 | 2.35 | 2.22 | 2.05 | |
| D2.4 | 3.29 | 3.95 | 3.98 | 3.98 | 4.32 | 1.52 | 1.52 | 1.43 | 1.64 | 1.52 | 1.43 | 1.64 | 2.49 | 2.17 | 2.05 | |
| D2.5 | 2.86 | 3.18 | 3.98 | 3.59 | 5.00 | 1.15 | 1.32 | 1.32 | 1.32 | 1.43 | 1.32 | 1.32 | 1.52 | 1.89 | 1.89 | |
| D2.6 | 2.55 | 3.18 | 3.64 | 3.39 | 4.51 | 1.52 | 1.15 | 1.64 | 1.52 | 1.32 | 1.15 | 1.52 | 1.64 | 1.74 | 1.74 | |
| D2.7 | 3.68 | 3.90 | 3.18 | 3.44 | 4.08 | 1.15 | 1.32 | 2.55 | 2.22 | 2.70 | 2.22 | 2.70 | 3.29 | 2.49 | 2.76 | |
| D2.8 | 2.35 | 3.95 | 2.83 | 3.10 | 2.86 | 1.52 | 1.52 | 1.78 | 1.78 | 1.74 | 1.64 | 1.64 | 1.52 | 1.52 | 1.52 | |
| D2.9 | 2.70 | 3.57 | 1.32 | 2.83 | 3.13 | 1.32 | 1.32 | 2.00 | 1.74 | 1.52 | 1.52 | 1.64 | 1.52 | 1.64 | 1.32 | |
| Transport element | D3.1 | 1.74 | 3.10 | 4.37 | 2.72 | 2.40 | 1.15 | 1.15 | 1.15 | 1.15 | 1.15 | 1.15 | 1.15 | 1.32 | 1.15 | 1.15 |
| D3.2 | 2.49 | 3.95 | 4.57 | 3.81 | 3.39 | 2.27 | 2.05 | 2.09 | 2.00 | 1.89 | 1.78 | 1.64 | 2.35 | 2.35 | 1.78 | |
| D3.3 | 1.74 | 2.70 | 4.08 | 2.46 | 2.83 | 1.43 | 1.74 | 1.74 | 1.52 | 1.52 | 1.52 | 1.52 | 2.17 | 2.49 | 1.82 | |
| D3.4 | 3.25 | 3.68 | 4.13 | 4.37 | 4.32 | 1.52 | 1.32 | 1.43 | 1.15 | 1.15 | 1.15 | 1.15 | 1.43 | 1.32 | 1.15 | |
| D3.5 | 2.00 | 2.83 | 3.95 | 3.37 | 3.95 | 1.74 | 1.43 | 1.74 | 1.32 | 1.15 | 1.15 | 1.15 | 1.15 | 1.15 | 1.15 | |
| D3.6 | 2.35 | 3.06 | 3.95 | 3.73 | 4.78 | 1.58 | 1.52 | 1.52 | 1.43 | 1.52 | 1.32 | 1.32 | 1.43 | 1.43 | 1.32 | |
| D3.7 | 3.59 | 4.08 | 4.37 | 3.18 | 3.10 | 3.13 | 3.25 | 3.13 | 2.99 | 2.22 | 2.35 | 2.05 | 1.74 | 3.59 | 1.82 | |
| D3.8 | 4.32 | 3.90 | 2.40 | 4.13 | 3.13 | 3.44 | 3.98 | 3.98 | 3.98 | 3.81 | 3.81 | 3.44 | 3.73 | 3.98 | 2.40 | |
| D3.9 | 2.49 | 2.86 | 2.35 | 2.49 | 2.40 | 3.17 | 2.61 | 2.27 | 2.61 | 2.61 | 2.46 | 2.61 | 2.35 | 2.30 | 2.17 | |
| D3.10 | 2.09 | 2.67 | 1.78 | 2.70 | 3.64 | 1.52 | 1.64 | 1.74 | 1.32 | 1.32 | 1.32 | 1.32 | 1.32 | 1.32 | 1.15 | |
| D3.11 | 2.49 | 2.83 | 3.68 | 3.95 | 3.39 | 3.68 | 1.32 | 1.32 | 1.52 | 1.15 | 1.15 | 1.15 | 1.32 | 1.32 | 1.15 | |
| D3.12 | 3.39 | 3.68 | 3.39 | 4.32 | 4.51 | 2.55 | 2.70 | 2.86 | 2.49 | 2.49 | 2.30 | 2.17 | 1.89 | 2.55 | 2.72 | |
| Cumulate element | D4.1 | 2.99 | 2.99 | 2.61 | 3.17 | 3.44 | 2.64 | 2.55 | 2.83 | 2.22 | 2.49 | 2.35 | 2.17 | 1.52 | 2.93 | 2.67 |
| D4.2 | 3.25 | 3.52 | 1.89 | 3.52 | 3.73 | 2.67 | 3.90 | 3.44 | 3.44 | 2.27 | 2.61 | 2.37 | 1.78 | 4.13 | 3.98 | |
| D4.3 | 2.99 | 3.64 | 2.41 | 3.29 | 2.86 | 2.22 | 3.44 | 4.08 | 3.31 | 3.47 | 3.31 | 3.47 | 3.31 | 3.47 | 3.10 | |
| D4.4 | 2.17 | 3.59 | 2.05 | 3.57 | 3.10 | 1.89 | 3.73 | 3.10 | 3.59 | 3.25 | 3.17 | 2.70 | 3.57 | 3.81 | 2.00 | |
| D4.5 | 2.35 | 2.70 | 3.02 | 3.31 | 3.90 | 1.64 | 1.64 | 1.32 | 1.32 | 1.43 | 1.32 | 1.32 | 1.15 | 1.89 | 1.32 | |
| D4.6 | 3.31 | 4.08 | 2.27 | 3.39 | 3.59 | 1.58 | 1.58 | 1.82 | 1.58 | 1.52 | 1.52 | 1.52 | 1.32 | 1.82 | 1.58 | |
| D4.7 | 2.86 | 3.25 | 3.31 | 4.08 | 4.57 | 2.17 | 2.35 | 1.89 | 2.00 | 1.74 | 2.00 | 1.89 | 1.74 | 2.35 | 1.52 | |
| D4.8 | 2.35 | 2.70 | 3.31 | 3.59 | 4.51 | 1.64 | 1.78 | 1.74 | 1.74 | 1.89 | 1.74 | 1.52 | 1.52 | 2.55 | 1.64 | |
| D4.9 | 3.29 | 3.44 | 2.51 | 3.90 | 4.32 | 1.97 | 1.97 | 1.64 | 2.30 | 2.27 | 2.17 | 1.78 | 2.40 | 2.14 | 1.64 | |
| D4.10 | 2.35 | 2.99 | 1.64 | 3.18 | 3.10 | 1.74 | 2.70 | 3.17 | 2.35 | 2.00 | 1.52 | 1.89 | 1.52 | 3.31 | 1.58 | |
| D4.11 | 2.40 | 3.10 | 2.05 | 3.44 | 3.52 | 2.00 | 2.49 | 3.03 | 2.17 | 2.14 | 1.82 | 1.82 | 1.58 | 3.44 | 1.55 | |
| Output element | D5.1 | 2.46 | 2.70 | 1.55 | 2.22 | 1.89 | 1.32 | 1.32 | 2.05 | 1.78 | 1.64 | 1.55 | 1.43 | 1.52 | 1.89 | 1.74 |
| D5.2 | 3.06 | 3.25 | 2.30 | 3.78 | 4.13 | 2.83 | 3.18 | 3.52 | 2.35 | 2.22 | 2.30 | 2.30 | 1.52 | 2.55 | 3.37 | |
| D5.3 | 2.86 | 3.57 | 2.35 | 3.64 | 3.44 | 2.17 | 1.52 | 2.70 | 2.35 | 2.61 | 1.89 | 2.00 | 2.64 | 2.05 | 2.61 | |
| D5.4 | 2.86 | 3.52 | 2.17 | 3.29 | 3.90 | 2.99 | 2.05 | 2.35 | 1.89 | 2.00 | 1.64 | 1.74 | 2.86 | 1.89 | 1.43 | |
| D5.5 | 1.89 | 2.17 | 1.89 | 2.05 | 3.68 | 1.64 | 1.52 | 1.52 | 1.32 | 1.32 | 1.32 | 1.32 | 1.64 | 1.89 | 1.52 | |
| D5.6 | 2.55 | 2.64 | 2.35 | 2.70 | 2.49 | 2.35 | 3.57 | 3.81 | 2.35 | 2.55 | 2.05 | 1.89 | 1.52 | 3.13 | 1.89 | |
| Control element | D6.1 | 2.35 | 2.30 | 2.14 | 3.03 | 3.81 | 1.64 | 1.52 | 1.93 | 1.32 | 1.25 | 1.15 | 1.32 | 1.78 | 1.55 | 1.89 |
| D6.2 | 2.05 | 2.77 | 1.64 | 2.64 | 3.59 | 1.64 | 1.52 | 1.89 | 1.32 | 1.15 | 1.15 | 1.32 | 1.64 | 1.43 | 1.64 | |
| D6.3 | 3.52 | 3.25 | 3.73 | 3.10 | 2.49 | 2.83 | 3.52 | 3.98 | 3.44 | 2.70 | 2.55 | 2.70 | 2.70 | 3.37 | 1.89 | |
| D6.4 | 3.44 | 3.73 | 4.08 | 3.29 | 3.29 | 3.52 | 3.73 | 3.76 | 3.59 | 3.44 | 3.03 | 3.03 | 2.55 | 3.90 | 2.86 | |
| D6.5 | 3.73 | 3.68 | 4.13 | 3.73 | 3.29 | 3.73 | 4.13 | 4.32 | 3.59 | 3.13 | 3.17 | 3.17 | 2.35 | 4.32 | 3.73 | |
| D6.6 | 2.35 | 2.35 | 1.32 | 2.17 | 2.93 | 1.89 | 1.74 | 1.64 | 1.52 | 1.43 | 1.43 | 1.43 | 1.15 | 1.15 | 1.15 | |
| D6.7 | 3.52 | 3.73 | 2.64 | 3.81 | 4.13 | 1.52 | 1.32 | 2.22 | 2.27 | 2.40 | 1.97 | 2.09 | 2.99 | 1.78 | 2.27 | |
| D6.8 | 3.10 | 3.95 | 2.30 | 3.48 | 3.90 | 1.64 | 1.32 | 1.78 | 2.05 | 2.40 | 2.17 | 2.00 | 2.61 | 2.05 | 2.35 | |
| Criteria | C1 | C2 | C3 | C4 | C5 |
|---|---|---|---|---|---|
| Crisp DEMATEL | |||||
| C1 | 0 | 3.2 | 3.6 | 2 | 3 |
| C2 | 2.8 | 0 | 1.6 | 1.2 | 1.8 |
| C3 | 3.8 | 2.6 | 0 | 2.2 | 2.6 |
| C4 | 1.2 | 0.6 | 1.4 | 0 | 0.8 |
| C5 | 3.4 | 3.2 | 2.6 | 2.2 | 0 |
| Fuzzy DEMATEL | |||||
| C1 | [0; 0; 0] | [2.2; 3.2; 4] | [2.6; 3.6; 4] | [1; 2; 3] | [2; 3; 3.8] |
| C2 | [1.8; 2.8; 3.4] | [0; 0; 0] | [0.8; 1.6; 2.4] | [0.6; 1.2; 1.8] | [1; 1.8; 2.6] |
| C3 | [2.8; 3.8; 4] | [1.6;2.6; 3.4] | [0; 0; 0] | [1.2; 2.2; 3.2] | [1.6; 2.6; 3.4] |
| C4 | [0.4; 1.2; 2] | [0.2; 0.6; 1] | [0.8; 1.4; 2] | [0; 0; 0] | [0.2; 0.8; 1.4] |
| C5 | [2.4; 3.4; 4] | [2.2; 3.2; 3.8] | [1.6; 2.6; 3.4] | [1.2; 2.2; 3] | [0; 0; 0] |
| Grey DEMATEL | |||||
| C1 | [0; 0] | [2.2; 3.2] | [2.6; 3.6] | [1; 2] | [2.0; 3.0] |
| C2 | [1.8; 2.8] | [0; 0] | [0.8; 1.6] | [0.6; 1.6] | [1.0; 1.8] |
| C3 | [2.8; 3.8] | [1.6; 2.6] | [0; 0] | [1.2; 2.2] | [1.6; 2.6] |
| C4 | [0.4; 1.2] | [0.2; 0.6] | [0.8; 1.4] | [0; 0] | [0.2; 0.8] |
| C5 | [2.4; 3.4] | [2.2; 3.2] | [1.6; 2.6] | [1.2; 2.2] | [0; 0] |
| Criteria | C1 | C2 | C3 | C4 | C5 |
|---|---|---|---|---|---|
| Crisp DEMATEL (Xc) | |||||
| C1 | 0 | 0.2712 | 0.3051 | 0.1695 | 0.2542 |
| C2 | 0.2373 | 0 | 0.1356 | 0.1017 | 0.1525 |
| C3 | 0.3220 | 0.2203 | 0 | 0.1864 | 0.2203 |
| C4 | 0.1017 | 0.0508 | 0.1186 | 0 | 0.0678 |
| C5 | 0.2881 | 0.2712 | 0.2203 | 0.1864 | 0 |
| Fuzzy DEMATEL (Xf) | |||||
| C1 | (0; 0; 0) | (0.1433; 0.2083; 0.2600) | (0.1700; 0.2350; 0.2600) | (0.0650; 0.1300; 0.1950) | (0.1292; 0.1942; 0.2467) |
| C2 | (0.1158; 0.1808; 0.2200) | (0; 0; 0) | (0.0517; 0.1033; 0.1683) | (0.0392; 0.0775; 0.1425) | (0.0642; 0.1158; 0.1808) |
| C3 | (0.1817; 0.2467; 0.2600) | (0.1025; 0.1675; 0.2200) | (0; 0; 0) | (0.0767; 0.1417; 0.2067) | (0.1025; 0.1675; 0.2200) |
| C4 | (0.0267; 0.0792; 0.1442) | (0.0133; 0.0400; 0.0925) | (0.0533; 0.0925; 0.1442) | (0; 0; 0) | (0.0133; 0.0525; 0.1175) |
| C5 | (0.1550; 0.2200; 0.2600) | (0.1425; 0.2075; 0.2467) | (0.1025; 0.1675; 0.2200) | (0.0758; 0.1408; 0.1933) | (0; 0; 0) |
| Grey DEMATEL (Xg) | |||||
| C1 | (0; 0) | (0.186; 0.271) | (0.220; 0.305) | (0.085; 0.169) | (0.169; 0.254) |
| C2 | (0.153; 0.237) | (0; 0) | (0.068; 0.136) | (0.051; 0.102) | (0.085; 0.153) |
| C3 | (0.237; 0.322) | (0.136; 0.220) | (0; 0) | (0.102; 0.186) | (0.136; 0.220) |
| C4 | (0.034; 0.102) | (0.017; 0.051) | (0.068; 0.119) | (0; 0) | (0.017; 0.068) |
| C5 | (0.203; 0.288) | (0.186; 0.271) | (0.136; 0.220) | (0.102; 0.186) | (0; 0) |
| Criteria | Crisp DEMATEL | |||
|---|---|---|---|---|
| D | R | D + R | D − R | |
| C1 | 4.7272 | 4.4452 | 9.1724 | 0.2819 |
| C2 | 3.2426 | 3.9660 | 7.2086 | −0.7234 |
| C3 | 4.5289 | 3.8167 | 8.3457 | 0.7122 |
| C4 | 1.8302 | 3.1622 | 4.9924 | −1.3321 |
| C5 | 4.5466 | 3.4854 | 8.0321 | 1.0612 |
| Fuzzy DEMATEL | ||||
| D | R | D + R | D − R | |
| C1 | (0.8106; 1.9120; 4.8102) | (0.7579; 1.7981; 4.4548) | (1.5686; 3.7101; 9.2650) | (−3.6442; 0.1140; 4.0523) |
| C2 | (0.4593; 1.2799; 3.7697) | (0.6527; 1.5931; 4.2086) | (1.1120; 2.8729; 7.9783) | (−3.7493; −0.3132; 3.1169) |
| C3 | (0.7495; 1.8194; 4.5742) | (0.6154; 1.5343; 4.0834) | (1.3649; 3.3537; 8.6576) | (−3.3339; 0.2851; 3.9587) |
| C4 | (0.1845; 0.7311; 2.7448) | (0.4179; 1.2599; 3.8177) | (0.6024; 1.910; 6.5626) | (−3.6332; −0.5288; 2.3269) |
| C5 | (0.7577; 1.8298; 4.6375) | (0.5176; 1.3868; 3.9718) | (1.2753; 3.2166; 8.6093) | (−3.2141; 0.4430; 4.1199) |
| Grey DEMATEL | ||||
| D | R | D + R | D − R | |
| C1 | (1.3040; 4.7272) | (1.2202; 4.4452) | (2.5242; 9.1724) | (−3.1417; 3.5070) |
| C2 | (0.7567; 3.2426) | (1.0576; 3.9660) | (1.8143; 7.2086) | (−3.2093; 2.1849) |
| C3 | (1.2189; 4.5289) | (0.9936; 3.8167) | (2.2125; 8.3457) | (−2.5978; 3.5353) |
| C4 | (0.2961; 1.8302) | (0.6836; 3.1622) | (0.9797; 4.9924) | (−2.8661; 1.1466) |
| C5 | (1.2288; 4.5466) | (0.8495; 3.4854) | (2.0783; 8.0320) | (−2.2566; 3.6971) |
| Criteria | Sub-Criteria | Local Weight | Global Weight | |||||||
|---|---|---|---|---|---|---|---|---|---|---|
| Crisp | Fuzzy | Grey | Crisp | Fuzzy | Grey | |||||
| Economic (C1) | Profit (C1.1) | 0.241 | 0.345 | 0.233 | 0.345 | 0.244 | 0.351 | 0.083 | 0.081 | 0.086 |
| Operating expenses (C1.2) | 0.316 | 0.318 | 0.311 | 0.076 | 0.074 | 0.076 | ||||
| Fixed investment (C1.3) | 0.338 | 0.336 | 0.337 | 0.082 | 0.078 | 0.083 | ||||
| Energy-ecological (C2) | The energy intensity (C2.1) | 0.190 | 0.521 | 0.192 | 0.500 | 0.189 | 0.500 | 0.099 | 0.096 | 0.095 |
| Greenhouse gas emissions of CO2 (C2.2) | 0.478 | 0.500 | 0.500 | 0.091 | 0.096 | 0.095 | ||||
| Quality (C3) | Safety of cargo transportation (C3.1) | 0.220 | 0.292 | 0.215 | 0.304 | 0.221 | 0.288 | 0.064 | 0.066 | 0.064 |
| Timeliness of cargo transportation (C3.2) | 0.348 | 0.345 | 0.351 | 0.077 | 0.075 | 0.078 | ||||
| The coefficient of flow controllability (C3.3) | 0.358 | 0.350 | 0.360 | 0.079 | 0.076 | 0.080 | ||||
| Statistical (C4) | The coefficient of flow irregularity (C4.1) | 0.135 | 0.247 | 0.147 | 0.246 | 0.130 | 0.247 | 0.034 | 0.036 | 0.032 |
| The coefficient of complexity structure of flow (C4.2) | 0.266 | 0.263 | 0.267 | 0.036 | 0.039 | 0.035 | ||||
| The coefficient of flow discreteness (C.4.3) | 0.238 | 0.240 | 0.237 | 0.032 | 0.036 | 0.031 | ||||
| The coefficient of differentiability of flow (C4.4) | 0.247 | 0.249 | 0.246 | 0.034 | 0.037 | 0.032 | ||||
| Flow physical (C5) | The mass (quantity) of flow (C5.1) | 0.212 | 0.329 | 0.211 | 0.326 | 0.213 | 0.330 | 0.070 | 0.069 | 0.071 |
| The speed of flow (C5.2) | 0.397 | 0.385 | 0.404 | 0.085 | 0.081 | 0.086 | ||||
| The length of the route (C5.3) | 0.273 | 0.288 | 0.264 | 0.058 | 0.061 | 0.057 | ||||
| Drivers | Method | |||||||||||||||||
|---|---|---|---|---|---|---|---|---|---|---|---|---|---|---|---|---|---|---|
| C-DEMATEL-CRADIS | F-DEMATEL-CRADIS | G-DEMATEL-CRADIS | ||||||||||||||||
| s+ | s- | K+ | K- | Q | Rank | s+ | s- | K+ | K- | Q | Rank | s+ | s- | K+ | K- | Q | Rank | |
| D1.1 | 0.995 | 0.348 | 0.487 | 0.405 | 0.446 | 54 | 0.953 | 0.339 | 0.466 | 0.400 | 0.433 | 54 | 0.937 | 0.355 | 0.453 | 0.409 | 0.431 | 54 |
| D1.2 | 0.951 | 0.392 | 0.510 | 0.456 | 0.483 | 49 | 0.911 | 0.381 | 0.487 | 0.449 | 0.468 | 49 | 0.891 | 0.401 | 0.476 | 0.462 | 0.469 | 47 |
| D1.3 | 0.810 | 0.533 | 0.599 | 0.621 | 0.610 | 6 | 0.775 | 0.517 | 0.572 | 0.609 | 0.591 | 7 | 0.745 | 0.546 | 0.569 | 0.629 | 0.599 | 5 |
| D1.4 | 0.925 | 0.419 | 0.525 | 0.488 | 0.506 | 37 | 0.885 | 0.408 | 0.502 | 0.480 | 0.491 | 38 | 0.866 | 0.426 | 0.490 | 0.491 | 0.490 | 37 |
| D1.5 | 0.862 | 0.481 | 0.563 | 0.561 | 0.562 | 10 | 0.826 | 0.466 | 0.537 | 0.550 | 0.543 | 13 | 0.798 | 0.494 | 0.531 | 0.569 | 0.550 | 10 |
| D1.6 | 0.951 | 0.392 | 0.510 | 0.457 | 0.483 | 48 | 0.911 | 0.381 | 0.487 | 0.449 | 0.468 | 48 | 0.892 | 0.400 | 0.476 | 0.461 | 0.468 | 50 |
| D1.7 | 0.871 | 0.472 | 0.557 | 0.550 | 0.554 | 14 | 0.823 | 0.469 | 0.539 | 0.553 | 0.546 | 12 | 0.813 | 0.478 | 0.521 | 0.551 | 0.536 | 16 |
| D1.8 | 0.815 | 0.529 | 0.595 | 0.616 | 0.606 | 7 | 0.773 | 0.520 | 0.574 | 0.613 | 0.594 | 6 | 0.754 | 0.538 | 0.563 | 0.620 | 0.591 | 7 |
| D2.1 | 0.968 | 0.375 | 0.501 | 0.437 | 0.469 | 51 | 0.925 | 0.367 | 0.480 | 0.433 | 0.456 | 51 | 0.908 | 0.384 | 0.467 | 0.442 | 0.455 | 51 |
| D2.2 | 0.980 | 0.363 | 0.495 | 0.423 | 0.459 | 53 | 0.939 | 0.353 | 0.473 | 0.417 | 0.445 | 53 | 0.921 | 0.371 | 0.461 | 0.428 | 0.444 | 53 |
| D2.3 | 0.917 | 0.426 | 0.529 | 0.497 | 0.513 | 32 | 0.877 | 0.416 | 0.506 | 0.490 | 0.498 | 35 | 0.857 | 0.434 | 0.495 | 0.501 | 0.498 | 31 |
| D2.4 | 0.920 | 0.423 | 0.527 | 0.493 | 0.510 | 35 | 0.878 | 0.415 | 0.506 | 0.489 | 0.497 | 36 | 0.860 | 0.431 | 0.493 | 0.497 | 0.495 | 34 |
| D2.5 | 0.935 | 0.408 | 0.519 | 0.475 | 0.497 | 42 | 0.891 | 0.401 | 0.498 | 0.473 | 0.485 | 42 | 0.877 | 0.414 | 0.483 | 0.477 | 0.480 | 42 |
| D2.6 | 0.930 | 0.413 | 0.521 | 0.481 | 0.501 | 41 | 0.885 | 0.407 | 0.501 | 0.480 | 0.490 | 40 | 0.872 | 0.419 | 0.486 | 0.483 | 0.485 | 41 |
| D2.7 | 0.929 | 0.414 | 0.522 | 0.483 | 0.502 | 39 | 0.891 | 0.401 | 0.498 | 0.473 | 0.485 | 41 | 0.867 | 0.424 | 0.489 | 0.489 | 0.489 | 38 |
| D2.8 | 0.947 | 0.396 | 0.512 | 0.461 | 0.487 | 46 | 0.902 | 0.390 | 0.492 | 0.460 | 0.476 | 46 | 0.888 | 0.403 | 0.477 | 0.465 | 0.471 | 46 |
| D2.9 | 0.949 | 0.394 | 0.511 | 0.459 | 0.485 | 47 | 0.904 | 0.389 | 0.491 | 0.458 | 0.475 | 47 | 0.891 | 0.400 | 0.476 | 0.461 | 0.469 | 49 |
| D3.1 | 0.877 | 0.467 | 0.553 | 0.544 | 0.548 | 17 | 0.827 | 0.465 | 0.537 | 0.548 | 0.542 | 14 | 0.820 | 0.471 | 0.517 | 0.543 | 0.530 | 17 |
| D3.2 | 0.887 | 0.456 | 0.547 | 0.532 | 0.539 | 20 | 0.846 | 0.447 | 0.525 | 0.526 | 0.526 | 21 | 0.826 | 0.465 | 0.513 | 0.536 | 0.525 | 18 |
| D3.3 | 0.862 | 0.481 | 0.562 | 0.560 | 0.561 | 11 | 0.820 | 0.473 | 0.541 | 0.557 | 0.549 | 10 | 0.804 | 0.487 | 0.527 | 0.562 | 0.544 | 11 |
| D3.4 | 0.899 | 0.444 | 0.540 | 0.518 | 0.529 | 27 | 0.851 | 0.441 | 0.521 | 0.520 | 0.521 | 25 | 0.841 | 0.450 | 0.504 | 0.519 | 0.511 | 27 |
| D3.5 | 0.897 | 0.446 | 0.541 | 0.520 | 0.530 | 26 | 0.849 | 0.443 | 0.523 | 0.522 | 0.522 | 24 | 0.841 | 0.451 | 0.504 | 0.520 | 0.512 | 26 |
| D3.6 | 0.929 | 0.414 | 0.522 | 0.483 | 0.502 | 40 | 0.884 | 0.408 | 0.502 | 0.481 | 0.492 | 37 | 0.872 | 0.420 | 0.486 | 0.484 | 0.485 | 40 |
| D3.7 | 0.808 | 0.535 | 0.600 | 0.623 | 0.612 | 5 | 0.771 | 0.521 | 0.575 | 0.614 | 0.595 | 5 | 0.746 | 0.546 | 0.568 | 0.629 | 0.599 | 6 |
| D3.8 | 0.798 | 0.545 | 0.608 | 0.636 | 0.622 | 3 | 0.764 | 0.529 | 0.581 | 0.623 | 0.602 | 3 | 0.732 | 0.559 | 0.579 | 0.645 | 0.612 | 3 |
| D3.9 | 0.868 | 0.475 | 0.559 | 0.554 | 0.556 | 12 | 0.828 | 0.465 | 0.536 | 0.548 | 0.542 | 15 | 0.807 | 0.485 | 0.526 | 0.559 | 0.542 | 12 |
| D3.10 | 0.919 | 0.424 | 0.528 | 0.494 | 0.511 | 34 | 0.872 | 0.421 | 0.509 | 0.496 | 0.502 | 31 | 0.863 | 0.429 | 0.491 | 0.494 | 0.493 | 35 |
| D3.11 | 0.869 | 0.474 | 0.558 | 0.552 | 0.555 | 13 | 0.820 | 0.472 | 0.541 | 0.556 | 0.549 | 11 | 0.812 | 0.480 | 0.522 | 0.553 | 0.538 | 15 |
| D3.12 | 0.913 | 0.430 | 0.531 | 0.502 | 0.516 | 30 | 0.875 | 0.417 | 0.507 | 0.492 | 0.500 | 33 | 0.851 | 0.441 | 0.498 | 0.508 | 0.503 | 30 |
| D4.1 | 0.896 | 0.448 | 0.542 | 0.522 | 0.532 | 24 | 0.857 | 0.435 | 0.518 | 0.513 | 0.516 | 27 | 0.834 | 0.457 | 0.508 | 0.527 | 0.517 | 24 |
| D4.2 | 0.873 | 0.470 | 0.555 | 0.547 | 0.551 | 16 | 0.837 | 0.455 | 0.530 | 0.536 | 0.533 | 17 | 0.811 | 0.481 | 0.523 | 0.554 | 0.539 | 14 |
| D4.3 | 0.851 | 0.493 | 0.570 | 0.574 | 0.572 | 9 | 0.816 | 0.477 | 0.544 | 0.562 | 0.553 | 9 | 0.787 | 0.505 | 0.539 | 0.582 | 0.560 | 9 |
| D4.4 | 0.873 | 0.470 | 0.556 | 0.548 | 0.552 | 15 | 0.836 | 0.456 | 0.531 | 0.538 | 0.534 | 16 | 0.810 | 0.482 | 0.523 | 0.555 | 0.539 | 13 |
| D4.5 | 0.917 | 0.426 | 0.529 | 0.497 | 0.513 | 31 | 0.871 | 0.421 | 0.510 | 0.497 | 0.503 | 30 | 0.860 | 0.432 | 0.493 | 0.498 | 0.496 | 33 |
| D4.6 | 0.944 | 0.400 | 0.514 | 0.466 | 0.490 | 45 | 0.899 | 0.393 | 0.494 | 0.464 | 0.479 | 43 | 0.885 | 0.407 | 0.479 | 0.469 | 0.474 | 45 |
| D4.7 | 0.918 | 0.426 | 0.529 | 0.496 | 0.512 | 33 | 0.876 | 0.416 | 0.506 | 0.490 | 0.498 | 34 | 0.858 | 0.434 | 0.494 | 0.500 | 0.497 | 32 |
| D4.8 | 0.926 | 0.417 | 0.523 | 0.486 | 0.504 | 38 | 0.885 | 0.408 | 0.502 | 0.480 | 0.491 | 39 | 0.868 | 0.424 | 0.489 | 0.488 | 0.489 | 39 |
| D4.9 | 0.940 | 0.403 | 0.516 | 0.470 | 0.493 | 44 | 0.899 | 0.393 | 0.494 | 0.464 | 0.479 | 44 | 0.880 | 0.412 | 0.482 | 0.475 | 0.478 | 44 |
| D4.10 | 0.887 | 0.456 | 0.547 | 0.532 | 0.539 | 19 | 0.846 | 0.447 | 0.525 | 0.527 | 0.526 | 20 | 0.827 | 0.465 | 0.513 | 0.536 | 0.524 | 19 |
| D4.11 | 0.892 | 0.451 | 0.544 | 0.525 | 0.534 | 23 | 0.852 | 0.441 | 0.521 | 0.519 | 0.520 | 26 | 0.832 | 0.459 | 0.510 | 0.530 | 0.520 | 23 |
| D5.1 | 0.887 | 0.456 | 0.547 | 0.531 | 0.539 | 21 | 0.841 | 0.451 | 0.528 | 0.532 | 0.530 | 19 | 0.828 | 0.463 | 0.512 | 0.534 | 0.523 | 20 |
| D5.2 | 0.907 | 0.436 | 0.534 | 0.508 | 0.521 | 28 | 0.869 | 0.423 | 0.511 | 0.499 | 0.505 | 29 | 0.846 | 0.446 | 0.501 | 0.514 | 0.507 | 28 |
| D5.3 | 0.940 | 0.403 | 0.516 | 0.470 | 0.493 | 43 | 0.899 | 0.393 | 0.494 | 0.463 | 0.478 | 45 | 0.879 | 0.412 | 0.482 | 0.475 | 0.479 | 43 |
| D5.4 | 0.889 | 0.454 | 0.545 | 0.529 | 0.537 | 22 | 0.846 | 0.446 | 0.524 | 0.526 | 0.525 | 22 | 0.830 | 0.462 | 0.511 | 0.532 | 0.522 | 22 |
| D5.5 | 0.885 | 0.458 | 0.548 | 0.534 | 0.541 | 18 | 0.840 | 0.453 | 0.529 | 0.534 | 0.531 | 18 | 0.830 | 0.462 | 0.511 | 0.532 | 0.522 | 21 |
| D5.6 | 0.823 | 0.520 | 0.589 | 0.606 | 0.598 | 8 | 0.784 | 0.508 | 0.566 | 0.599 | 0.583 | 8 | 0.762 | 0.530 | 0.557 | 0.611 | 0.584 | 8 |
| D6.1 | 0.908 | 0.435 | 0.534 | 0.507 | 0.521 | 29 | 0.862 | 0.431 | 0.515 | 0.507 | 0.511 | 28 | 0.851 | 0.441 | 0.498 | 0.508 | 0.503 | 29 |
| D6.2 | 0.920 | 0.423 | 0.527 | 0.493 | 0.510 | 36 | 0.873 | 0.420 | 0.509 | 0.494 | 0.501 | 32 | 0.864 | 0.428 | 0.491 | 0.493 | 0.492 | 36 |
| D6.3 | 0.780 | 0.564 | 0.622 | 0.657 | 0.639 | 1 | 0.744 | 0.549 | 0.597 | 0.647 | 0.622 | 1 | 0.716 | 0.576 | 0.592 | 0.664 | 0.628 | 1 |
| D6.4 | 0.802 | 0.541 | 0.605 | 0.630 | 0.618 | 4 | 0.768 | 0.524 | 0.578 | 0.618 | 0.598 | 4 | 0.738 | 0.553 | 0.574 | 0.638 | 0.606 | 4 |
| D6.5 | 0.782 | 0.561 | 0.620 | 0.654 | 0.637 | 2 | 0.749 | 0.543 | 0.592 | 0.640 | 0.616 | 2 | 0.717 | 0.574 | 0.591 | 0.662 | 0.626 | 2 |
| D6.6 | 0.896 | 0.447 | 0.541 | 0.521 | 0.531 | 25 | 0.849 | 0.443 | 0.523 | 0.522 | 0.522 | 23 | 0.840 | 0.452 | 0.505 | 0.521 | 0.513 | 25 |
| D6.7 | 0.952 | 0.391 | 0.509 | 0.456 | 0.482 | 50 | 0.912 | 0.380 | 0.487 | 0.448 | 0.467 | 50 | 0.891 | 0.400 | 0.476 | 0.461 | 0.469 | 48 |
| D6.8 | 0.970 | 0.374 | 0.500 | 0.435 | 0.468 | 52 | 0.929 | 0.364 | 0.478 | 0.429 | 0.453 | 52 | 0.909 | 0.382 | 0.466 | 0.441 | 0.453 | 52 |
| s0 | 0.485 | 0.858 | 0.444 | 0.849 | 0.424 | 0.867 | ||||||||||||
| MCDM Model | C-DEMATEL TOPSIS | C-DEMATEL ARAS | C-DEMATEL MARCOS | C-DEMATEL CARDIS | F-DEMATEL TOPSIS | F-DEMATEL ARAS | F-DEMATEL MARCOS | F-DEMATEL CARDIS | G-DEMATEL TOPSIS | G-DEMATEL ARAS | G-DEMATEL MARCOS | G-DEMATEL CARDIS |
|---|---|---|---|---|---|---|---|---|---|---|---|---|
| C-DEMATEL TOPSIS | 1.000 | 0.945 | 0.917 | 0.918 | 0.994 | 0.934 | 0.884 | 0.884 | 0.995 | 0.955 | 0.929 | 0.929 |
| C-DEMATEL ARAS | 0.945 | 1.000 | 0.991 | 0.991 | 0.957 | 0.996 | 0.978 | 0.977 | 0.932 | 0.999 | 0.994 | 0.994 |
| C-DEMATEL MARCOS | 0.917 | 0.991 | 1.000 | 1.000 | 0.937 | 0.997 | 0.995 | 0.995 | 0.898 | 0.986 | 0.998 | 0.998 |
| C-DEMATEL CARDIS | 0.918 | 0.991 | 1.000 | 1.000 | 0.938 | 0.996 | 0.994 | 0.994 | 0.899 | 0.987 | 0.998 | 0.998 |
| F-DEMATEL TOPSIS | 0.994 | 0.957 | 0.937 | 0.938 | 1.000 | 0.951 | 0.909 | 0.908 | 0.983 | 0.965 | 0.945 | 0.945 |
| F-DEMATEL ARAS | 0.934 | 0.996 | 0.997 | 0.996 | 0.951 | 1.000 | 0.989 | 0.988 | 0.917 | 0.993 | 0.998 | 0.998 |
| F-DEMATEL MARCOS | 0.884 | 0.978 | 0.995 | 0.994 | 0.909 | 0.989 | 1.000 | 1.000 | 0.861 | 0.970 | 0.991 | 0.990 |
| F-DEMATEL CARDIS | 0.884 | 0.977 | 0.995 | 0.994 | 0.908 | 0.988 | 1.000 | 1.000 | 0.861 | 0.970 | 0.990 | 0.990 |
| G-DEMATEL TOPSIS | 0.995 | 0.932 | 0.898 | 0.899 | 0.983 | 0.917 | 0.861 | 0.861 | 1.000 | 0.945 | 0.912 | 0.913 |
| G-DEMATEL ARAS | 0.955 | 0.999 | 0.986 | 0.987 | 0.965 | 0.993 | 0.970 | 0.970 | 0.945 | 1.000 | 0.991 | 0.991 |
| G-DEMATEL MARCOS | 0.929 | 0.994 | 0.998 | 0.998 | 0.945 | 0.998 | 0.991 | 0.990 | 0.912 | 0.991 | 1.000 | 1.000 |
| G-DEMATEL CARDIS | 0.929 | 0.994 | 0.998 | 0.998 | 0.945 | 0.998 | 0.990 | 0.990 | 0.913 | 0.991 | 1.000 | 1.000 |
| Supply Chain Elements | Highest-Ranked Drivers | Solutions for the Implementation of Green Logistics Methods and Tools [108] | |
|---|---|---|---|
| Green Logistics Method | Green Logistics Instrument | ||
| Input element | D1.8—E-commerce with supplier | Procurement planning, execution, and supply control | Electronic document management with organizations and suppliers |
| Processing element | D2.3—Eco-friendly equipment | The use of eco-friendly equipment and technologies | Equipment with minimal impact on the environment |
| Transport element | D3.8—Technical condition of vehicle fleet | Selection of eco-friendly vehicles | Vehicles with the least impact on the environment |
| Selection of vehicles’ relevant requirements in the field of ecology | |||
| Transport management and transport planning | Provision of technological unity for transport and warehouse process | ||
| Cumulative element | D4.3—Spatial organization of warehouse facilities | Environmental design of warehouse complexes | Environmentally sound spatial organization of elements of a warehouse complex |
| Output element | D5.6—E-commerce with consumer | Work with consumers of products and services | Electronic document circulation in the organization of interaction with consumers |
| Control element | D6.3—Corporate Information Systems | Development and implementation of corporate information systems | ERP (Enterprise Resource Planning System) |
| CRM (Customer Relationship Management System) | |||
| MES (Manufacturing Execution System) | |||
| WMS (Warehouse Management System) | |||
| EAM (Enterprise Asset Management) | |||
| HRM (Human Resources Management) | |||
| D6.5—Intelligent Transportation Systems | Development and implementation of intelligent transport systems | Implementation of advanced information technologies (RFID, GPS, GIS, EDI, GPRS, GSM) | |
Disclaimer/Publisher’s Note: The statements, opinions and data contained in all publications are solely those of the individual author(s) and contributor(s) and not of MDPI and/or the editor(s). MDPI and/or the editor(s) disclaim responsibility for any injury to people or property resulting from any ideas, methods, instructions or products referred to in the content. |
© 2025 by the authors. Licensee MDPI, Basel, Switzerland. This article is an open access article distributed under the terms and conditions of the Creative Commons Attribution (CC BY) license (https://creativecommons.org/licenses/by/4.0/).
Share and Cite
Osintsev, N.; Rakhmangulov, A. Supply Chain Sustainability Drivers: Identification and Multi-Criteria Assessment. Logistics 2025, 9, 24. https://doi.org/10.3390/logistics9010024
Osintsev N, Rakhmangulov A. Supply Chain Sustainability Drivers: Identification and Multi-Criteria Assessment. Logistics. 2025; 9(1):24. https://doi.org/10.3390/logistics9010024
Chicago/Turabian StyleOsintsev, Nikita, and Aleksandr Rakhmangulov. 2025. "Supply Chain Sustainability Drivers: Identification and Multi-Criteria Assessment" Logistics 9, no. 1: 24. https://doi.org/10.3390/logistics9010024
APA StyleOsintsev, N., & Rakhmangulov, A. (2025). Supply Chain Sustainability Drivers: Identification and Multi-Criteria Assessment. Logistics, 9(1), 24. https://doi.org/10.3390/logistics9010024