Development of a Residual Biomass Supply Chain Simulation Model Using AnyLogistix: A Methodical Approach
Abstract
1. Introduction
- In what ways does simulation modeling improve the efficiency and reliability of residual biomass supply chains compared to traditional optimization methods?
- What role does anyLogistix simulation software play in analyzing and optimizing the performance of a residual biomass supply chain?
- What key performance indicators (KPIs) should be used to evaluate the financial, operational, customer satisfaction, and environmental metrics of a residual biomass supply chain?
- How can the simulation model designed for residual biomass supply chains be applied to real-world case studies, and what insights can be gained from empirical analysis?
2. Literature Review
3. Methodology
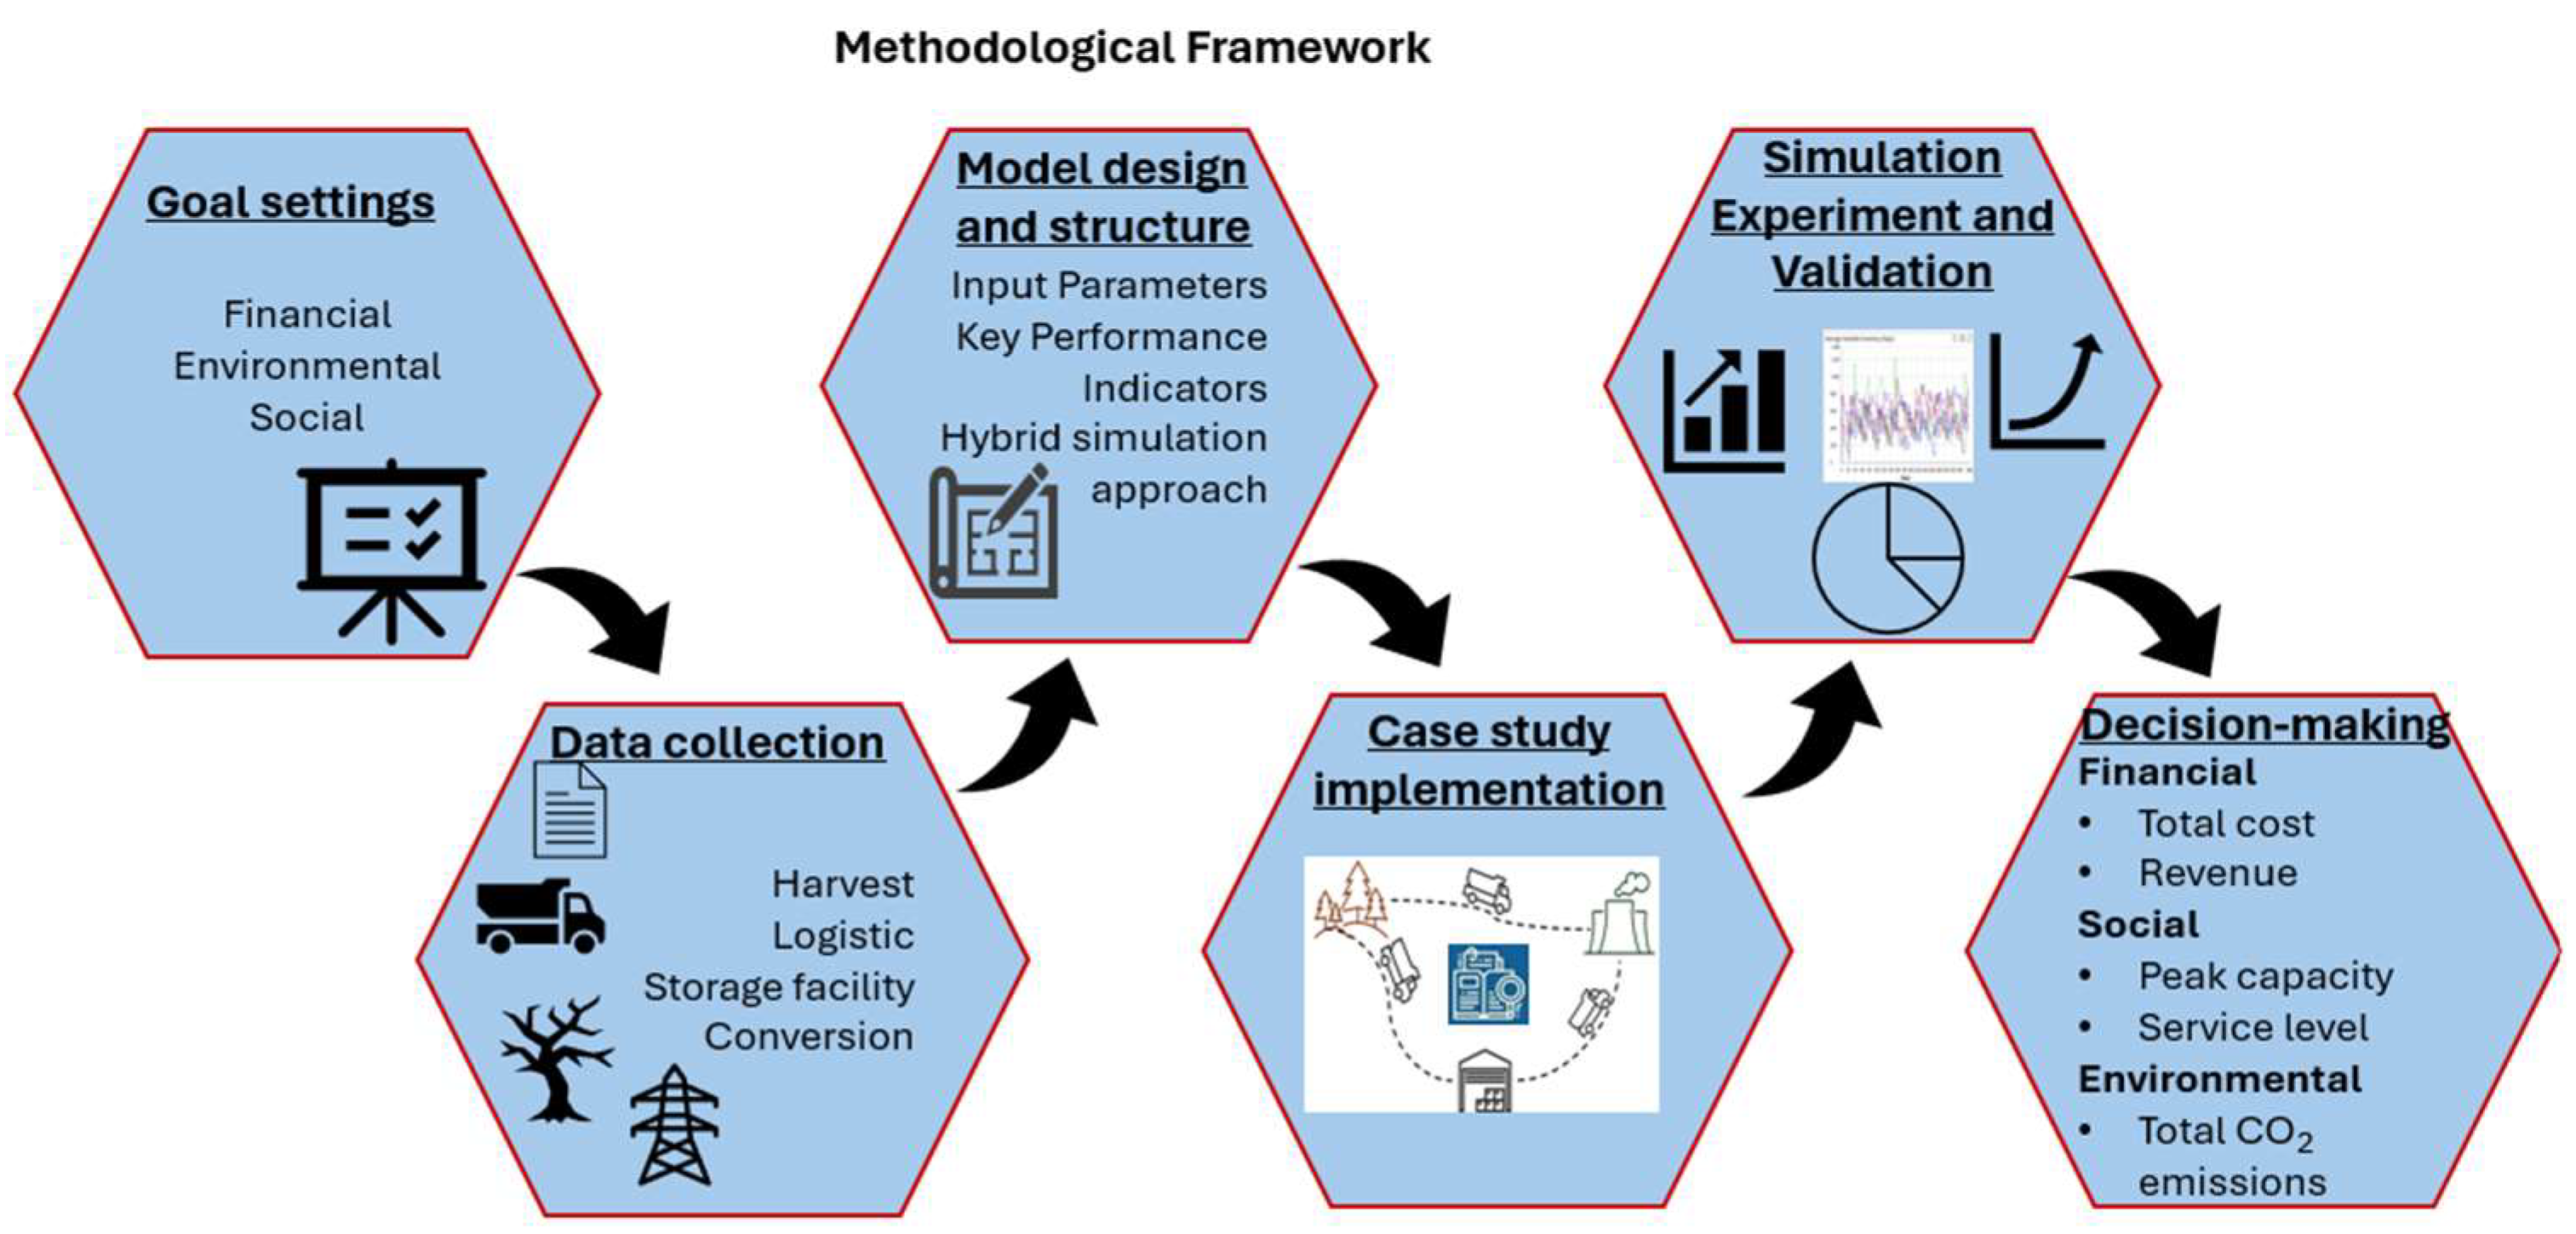
- Define the objectives of the simulation models.
- Data collection for each component of the agroforestry biomass supply chain.
- Model design and structure (hybrid simulation approach).
- Case study implementation
- Simulation experiment.
- Decision making.
3.1. Model Design and Structure
3.2. Supply Chain Factors and Entity
- Supplier: An organization or function that supplies products, resources, or services to clients or other upstream entities is referred to as a supplier in a supply chain system. To satisfy consumer demand, the supplier serves as the origin or source of the goods or resources required. The location, name, and number of distribution centers define the supplier entity.
- Customer: An organization or position within a logistics system or supply chain that receives products or services from a provider or supplier is referred to as a customer. Depending on the situation, it may refer to a variety of entities, including people, businesses, or organizations. It is defined based on the name, type, and location of the customer.
- Distribution Center: Supply chains that hold completed goods prior to being selected and packaged to fulfill orders for customers are known as distribution centers.
- Transportation Cost: This is the cost calculated based on product volume, distance, and truck capacity. It involves a simple, yet effective, method to compute the cost per unit of transported biomass (in cubic meters) using a product and distance-based approach.
4. Case Study
4.1. Data Collection for Supply Chain Entities
- Their supply chain offers one product (pellet).
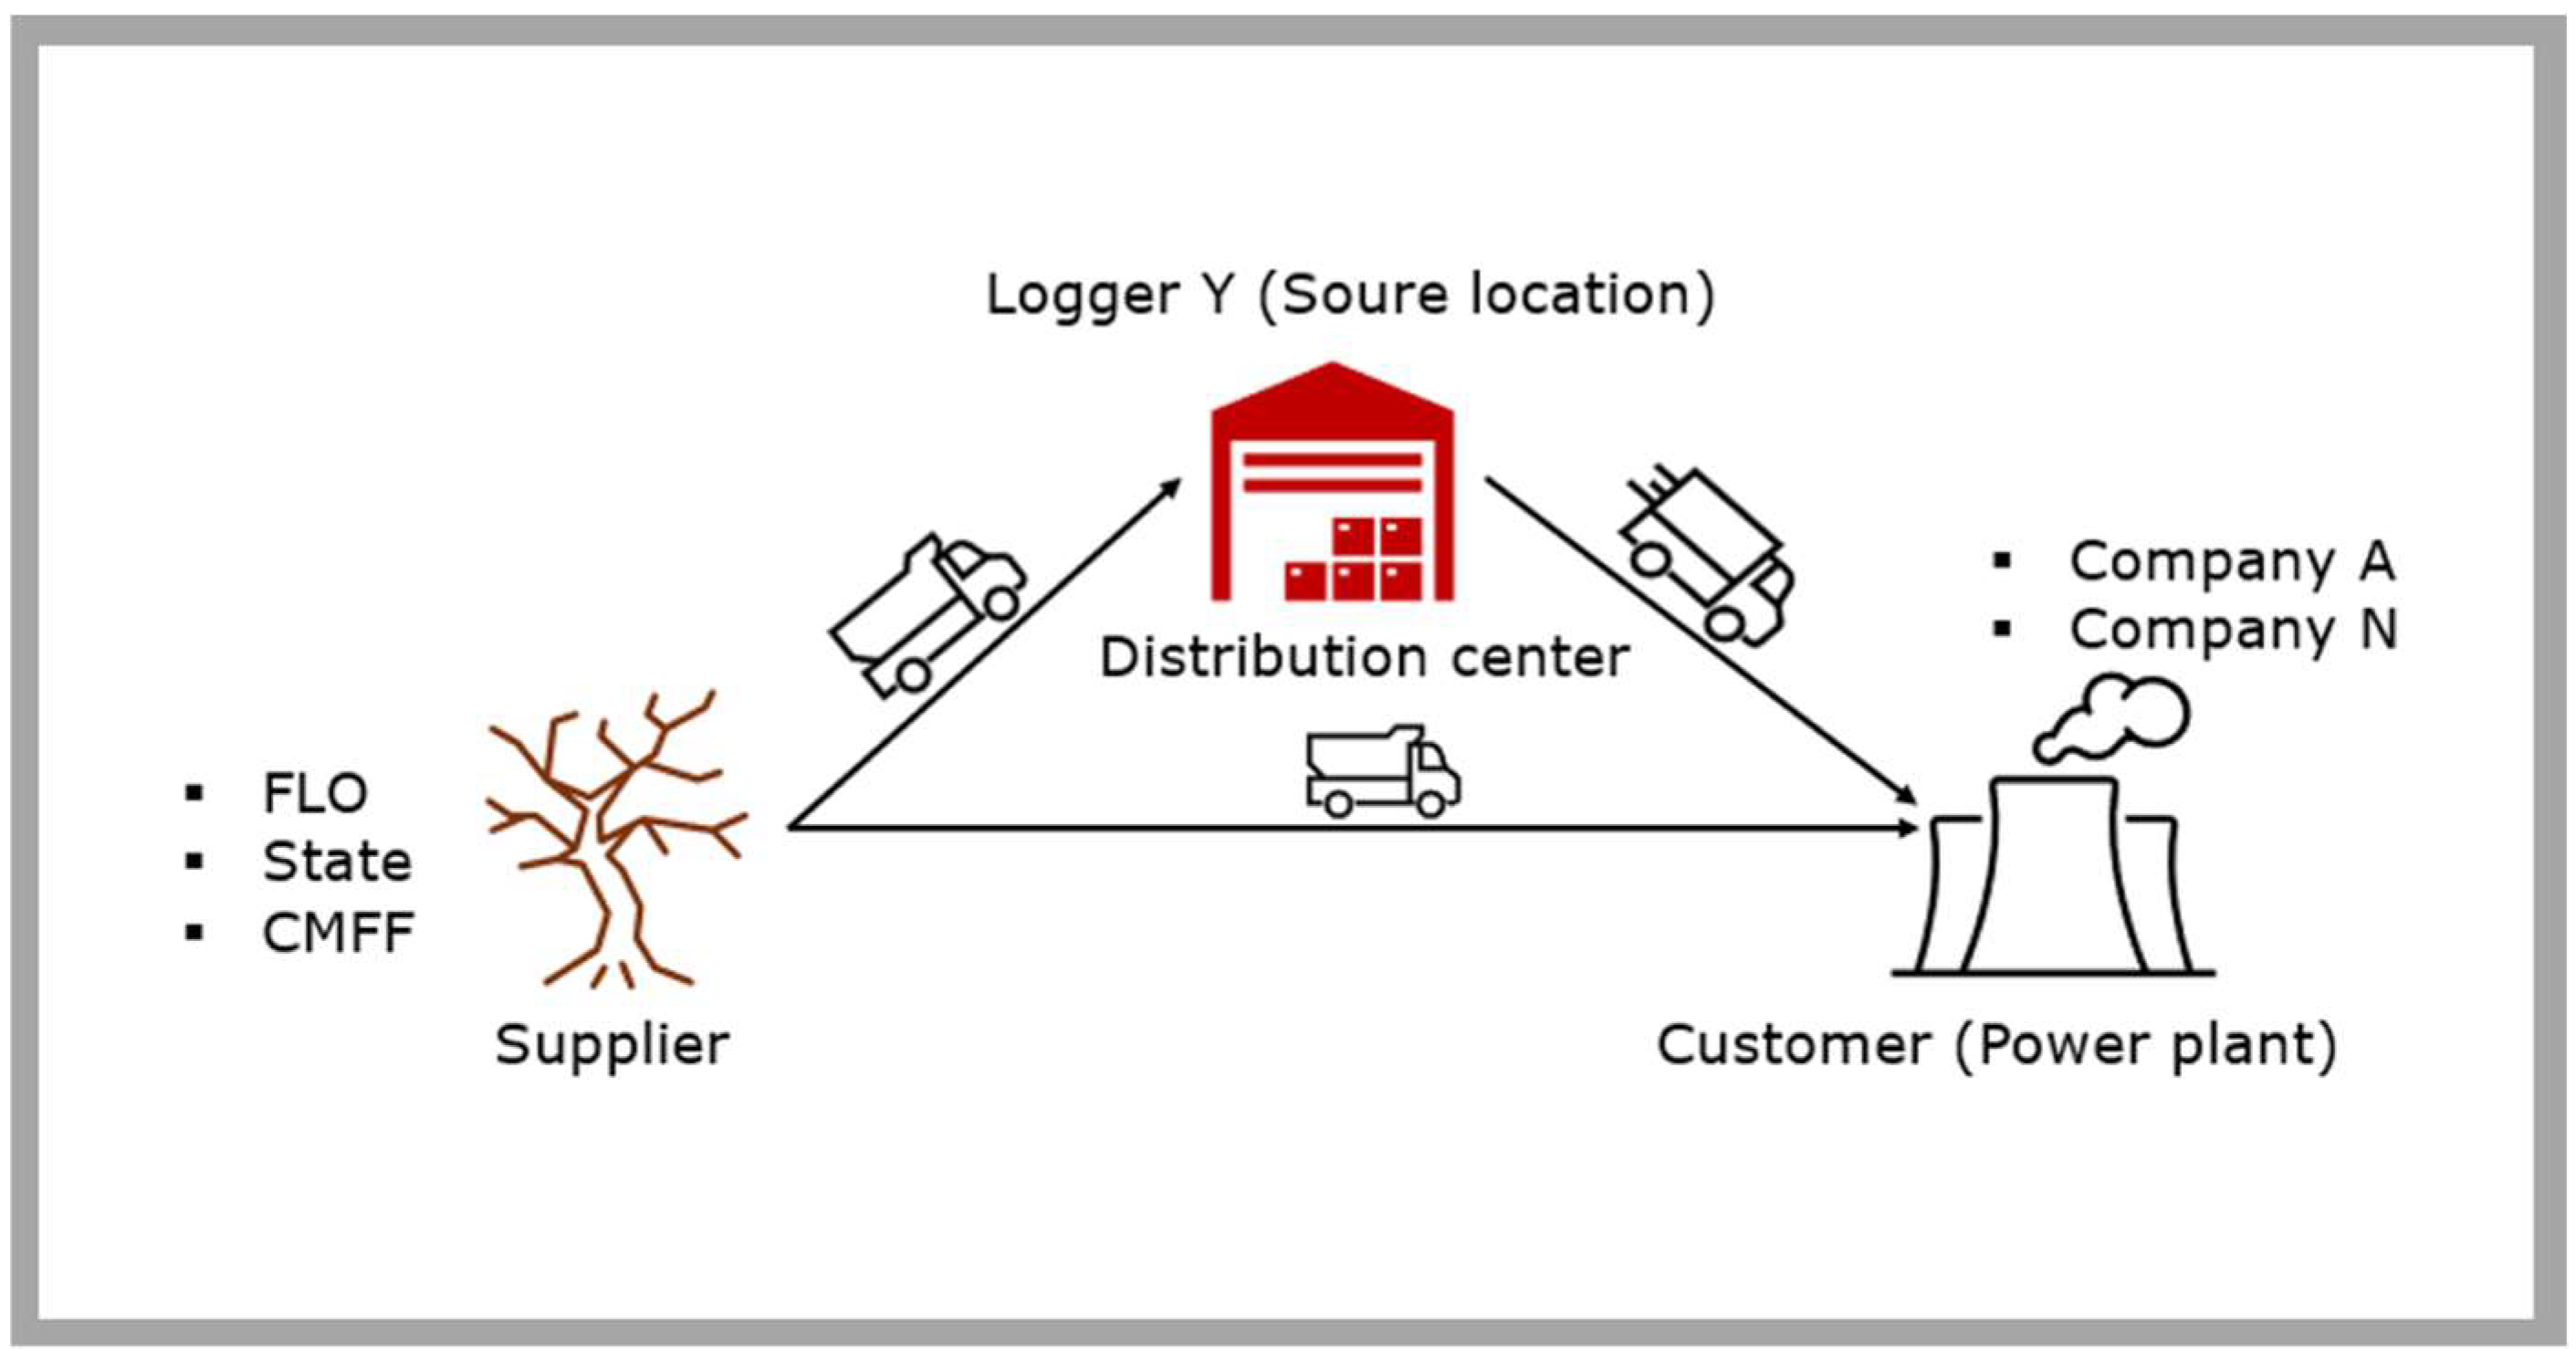
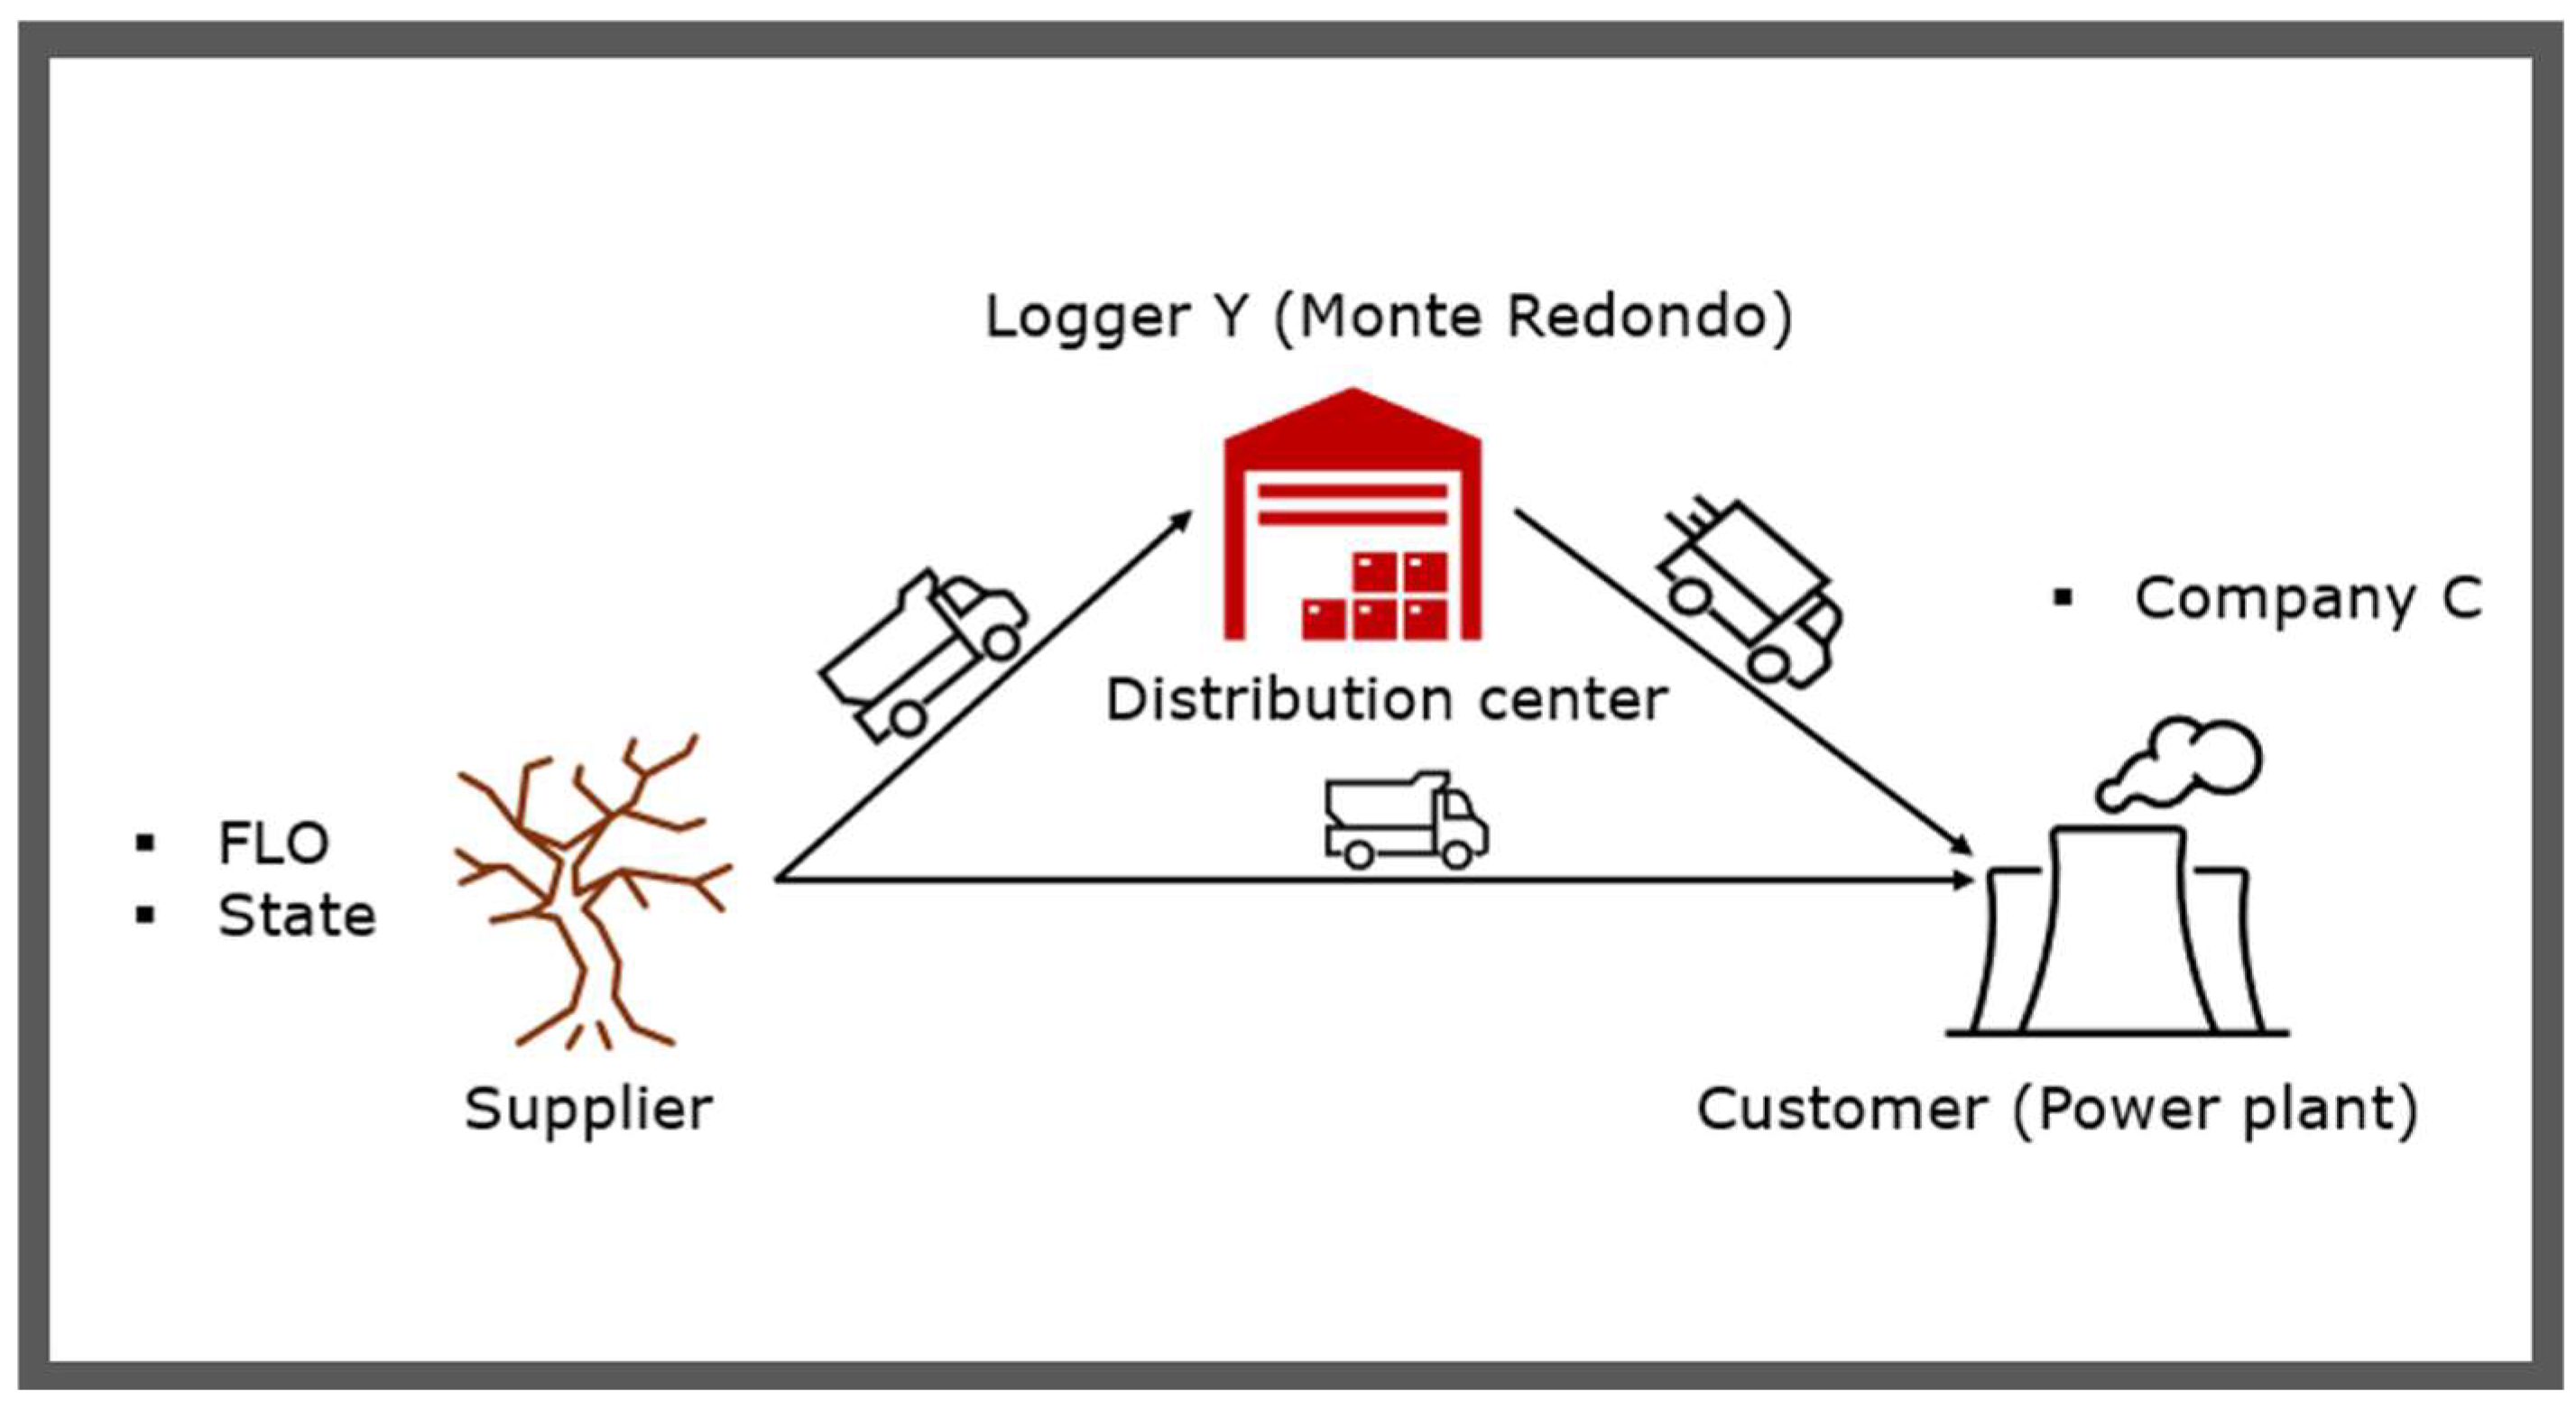
- The supply chain is made up of three customers, two distribution centers (DCs), and three suppliers.
- Their supply chain runs at a 90% customer service level (CSL) policy.
- The distribution centers use an order on demand inventory control policy. The minimum level is 33.58 m3 subject to the customer service level of 90%. The maximum level is 514 312.03 subject to the maximum storage area capacity for each product at each distribution center.
- The customer expects to receive their order in a random time limit within intervals of 5 to 7 days.
- The demand is operating on an expected lead time (ELT) of 1 day.
- Trucks with a 95 m3 capacity transport products from the supplier to the distribution centers. Lorries with a capacity of 90 m3 transport products from the distribution centers to the customers. Both vehicle types travel a distance of 50 km.
- CO2 produced from a DC = 1.35 kg/m3. This value is adapted from the existing literature [24].
- Sourcing policy of FIFO (First-in First-out) FTL (Full Truck Load) shipments are used with a minimum load ratio of 0.9. A direct shipment distribution network is used.
4.2. Model Structure and Implementation
- Volume: the shipment’s entire value.
- Distance: the length of the trip.
- The cost of transporting one unit (m3) of the truck capacity in use is derived by dividing the total cost of transporting on full truck capacity by full truck capacity, see equations 1 and 2 for the reference.
- Where:
- sup>∙ C1/m3 is the cost per unit for 95 m3 truck capacity;
- C2/m3 is the cost per unit for 90 m3 lorry capacity.
5. Results
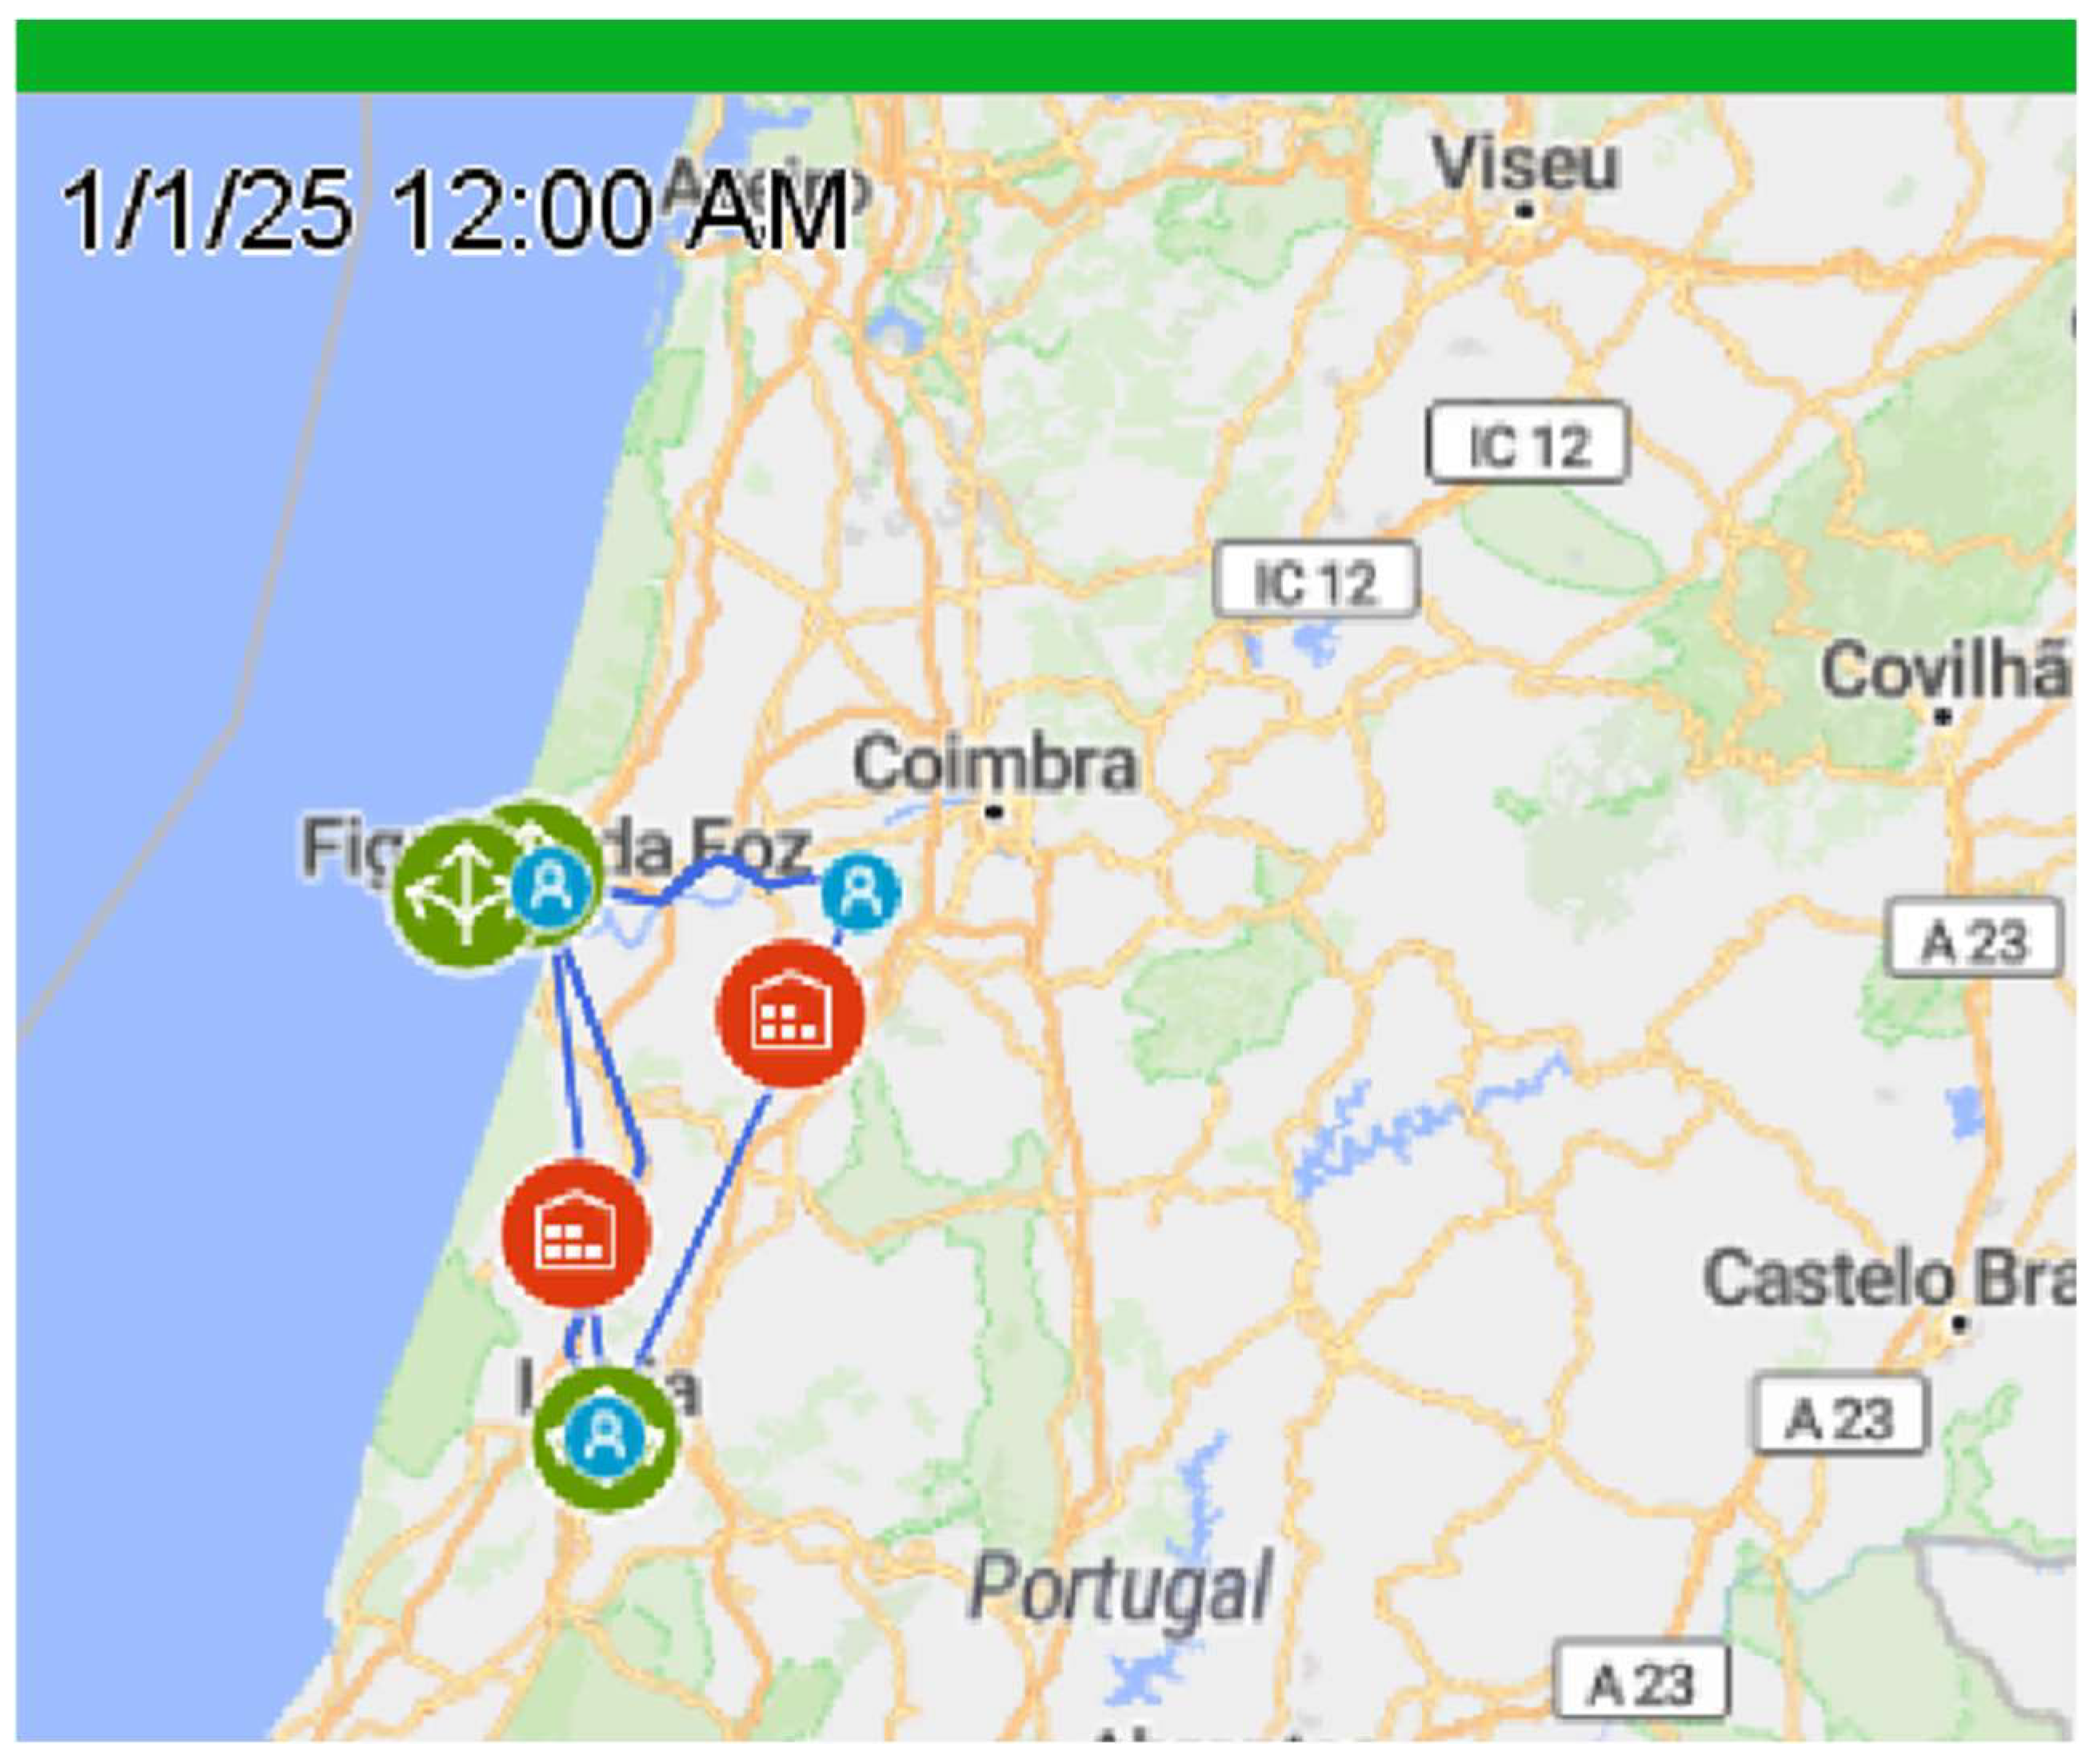
- Blue circular icon with an A symbol: This represents the customer.
- Green circular icon with 3 interconnected arrows: This depicts the supplier.
- Red circular enclosure with a house icon inside it: This stands for the distribution centers of the supply chain.
- Blue lines: Connecting routes from one point to the other.
5.1. Total Cost
5.2. Revenue by Customer
5.3. Number of Trips
5.4. Peak Capacity
5.5. Lead Time and Mean Time
5.6. Expected Lead Time (ELT) Service Level
5.7. Total CO2 Emissions
5.8. Validation
6. Discussion/Analysis
6.1. Managerial Insights and Impacts of Study in the Society
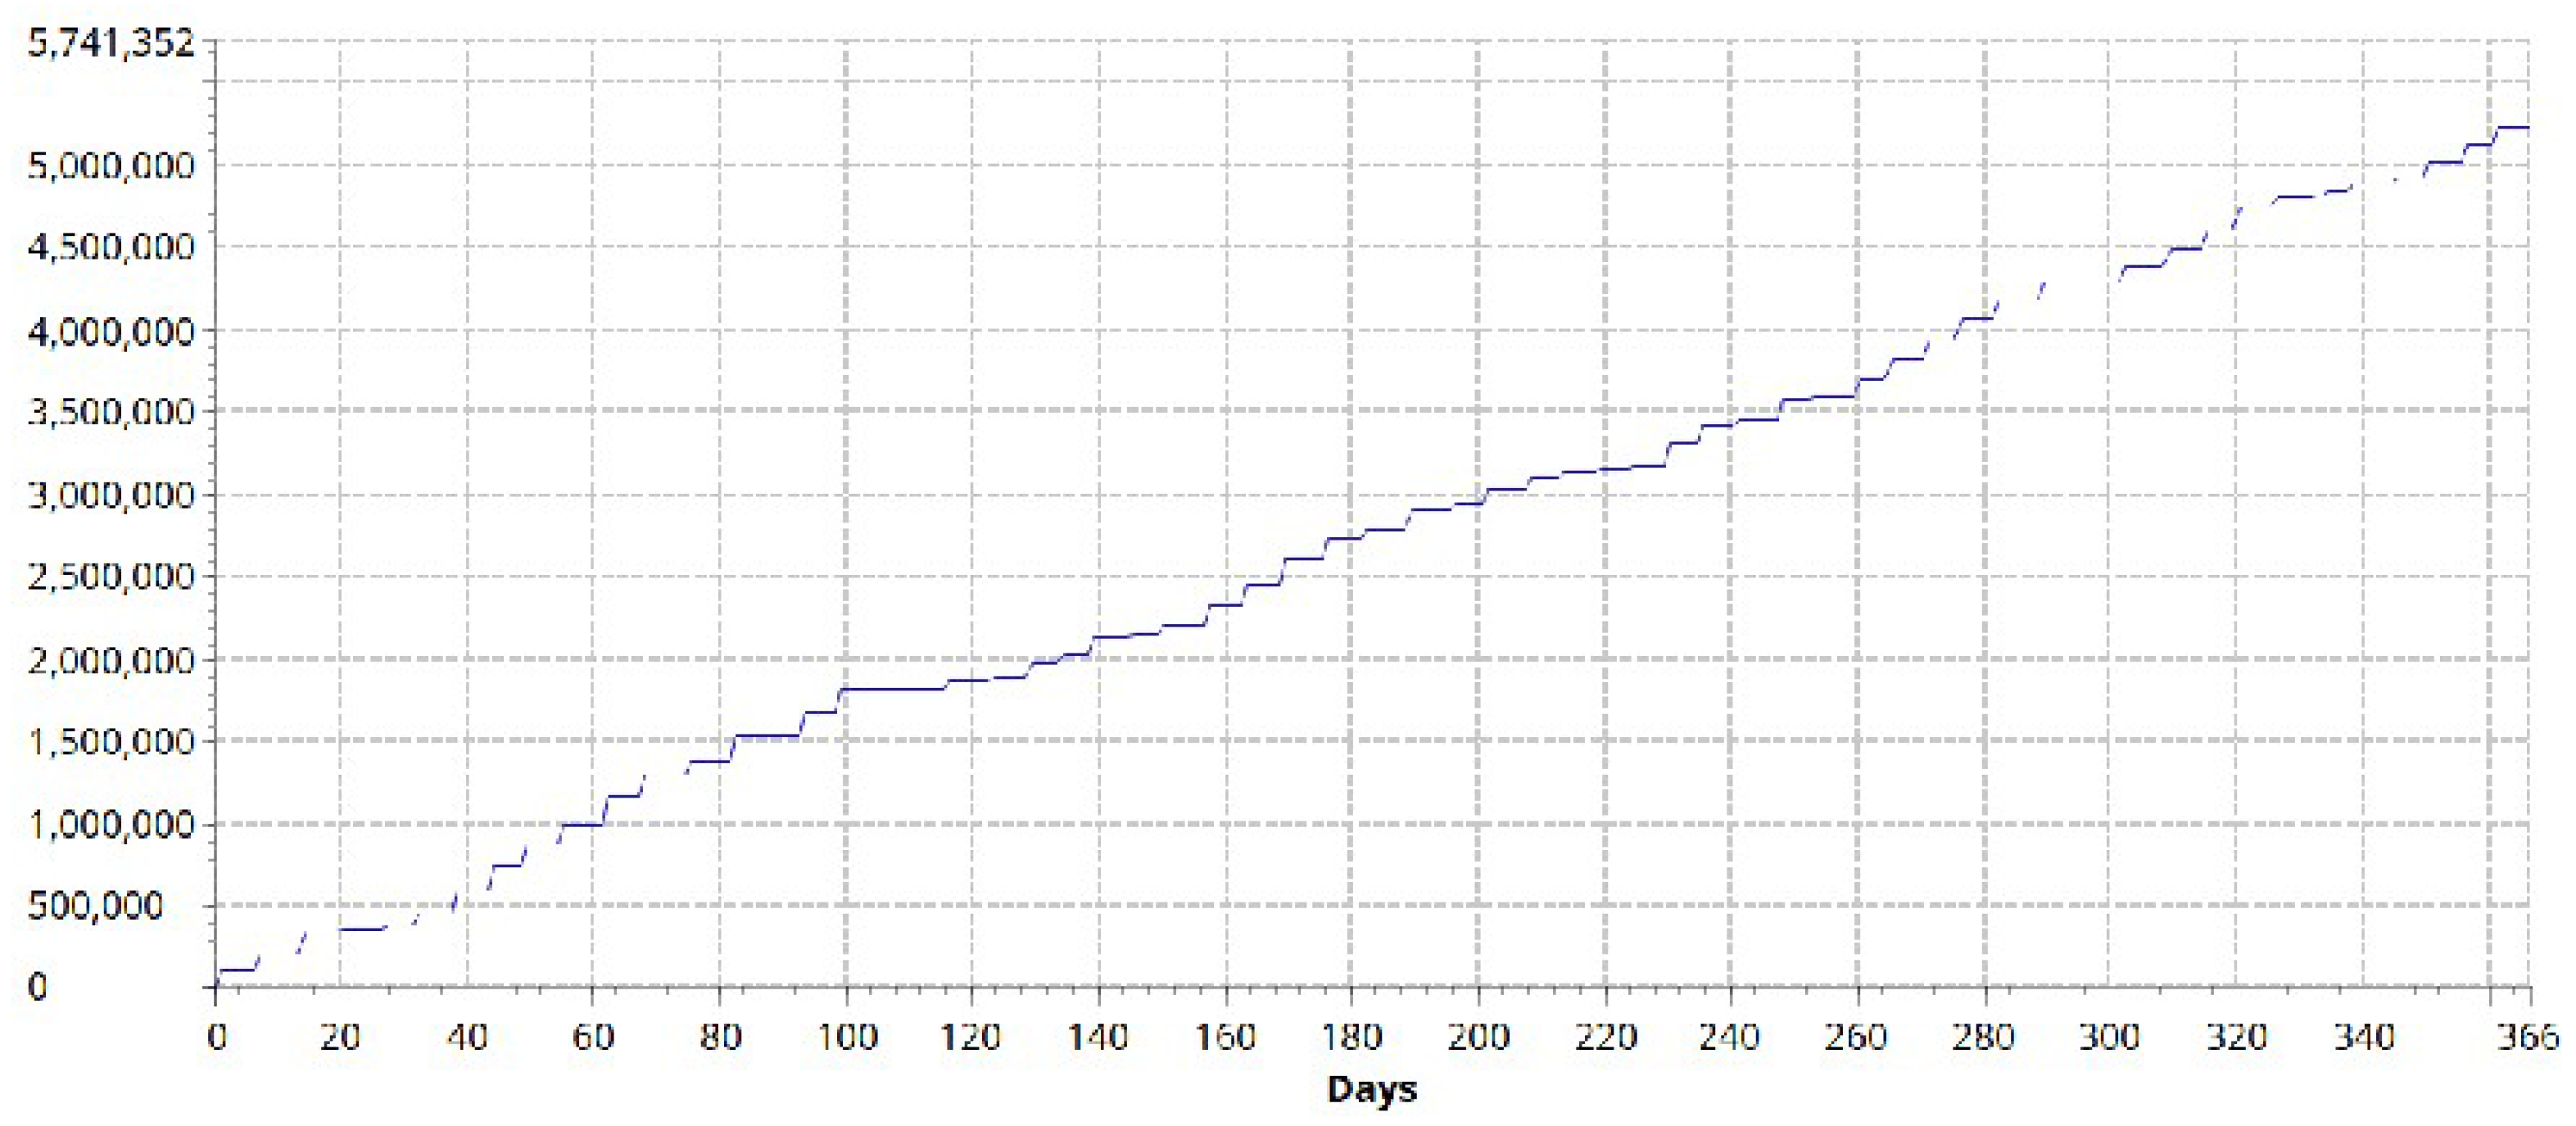
- Cost Management: The high total cost (EUR 5,219,411.3) identified in the study, mainly due to transportation, suggests that companies must focus on optimizing logistics. Strategies like load optimization, route management, or inventory adjustments can help reduce operational costs and improve profitability.
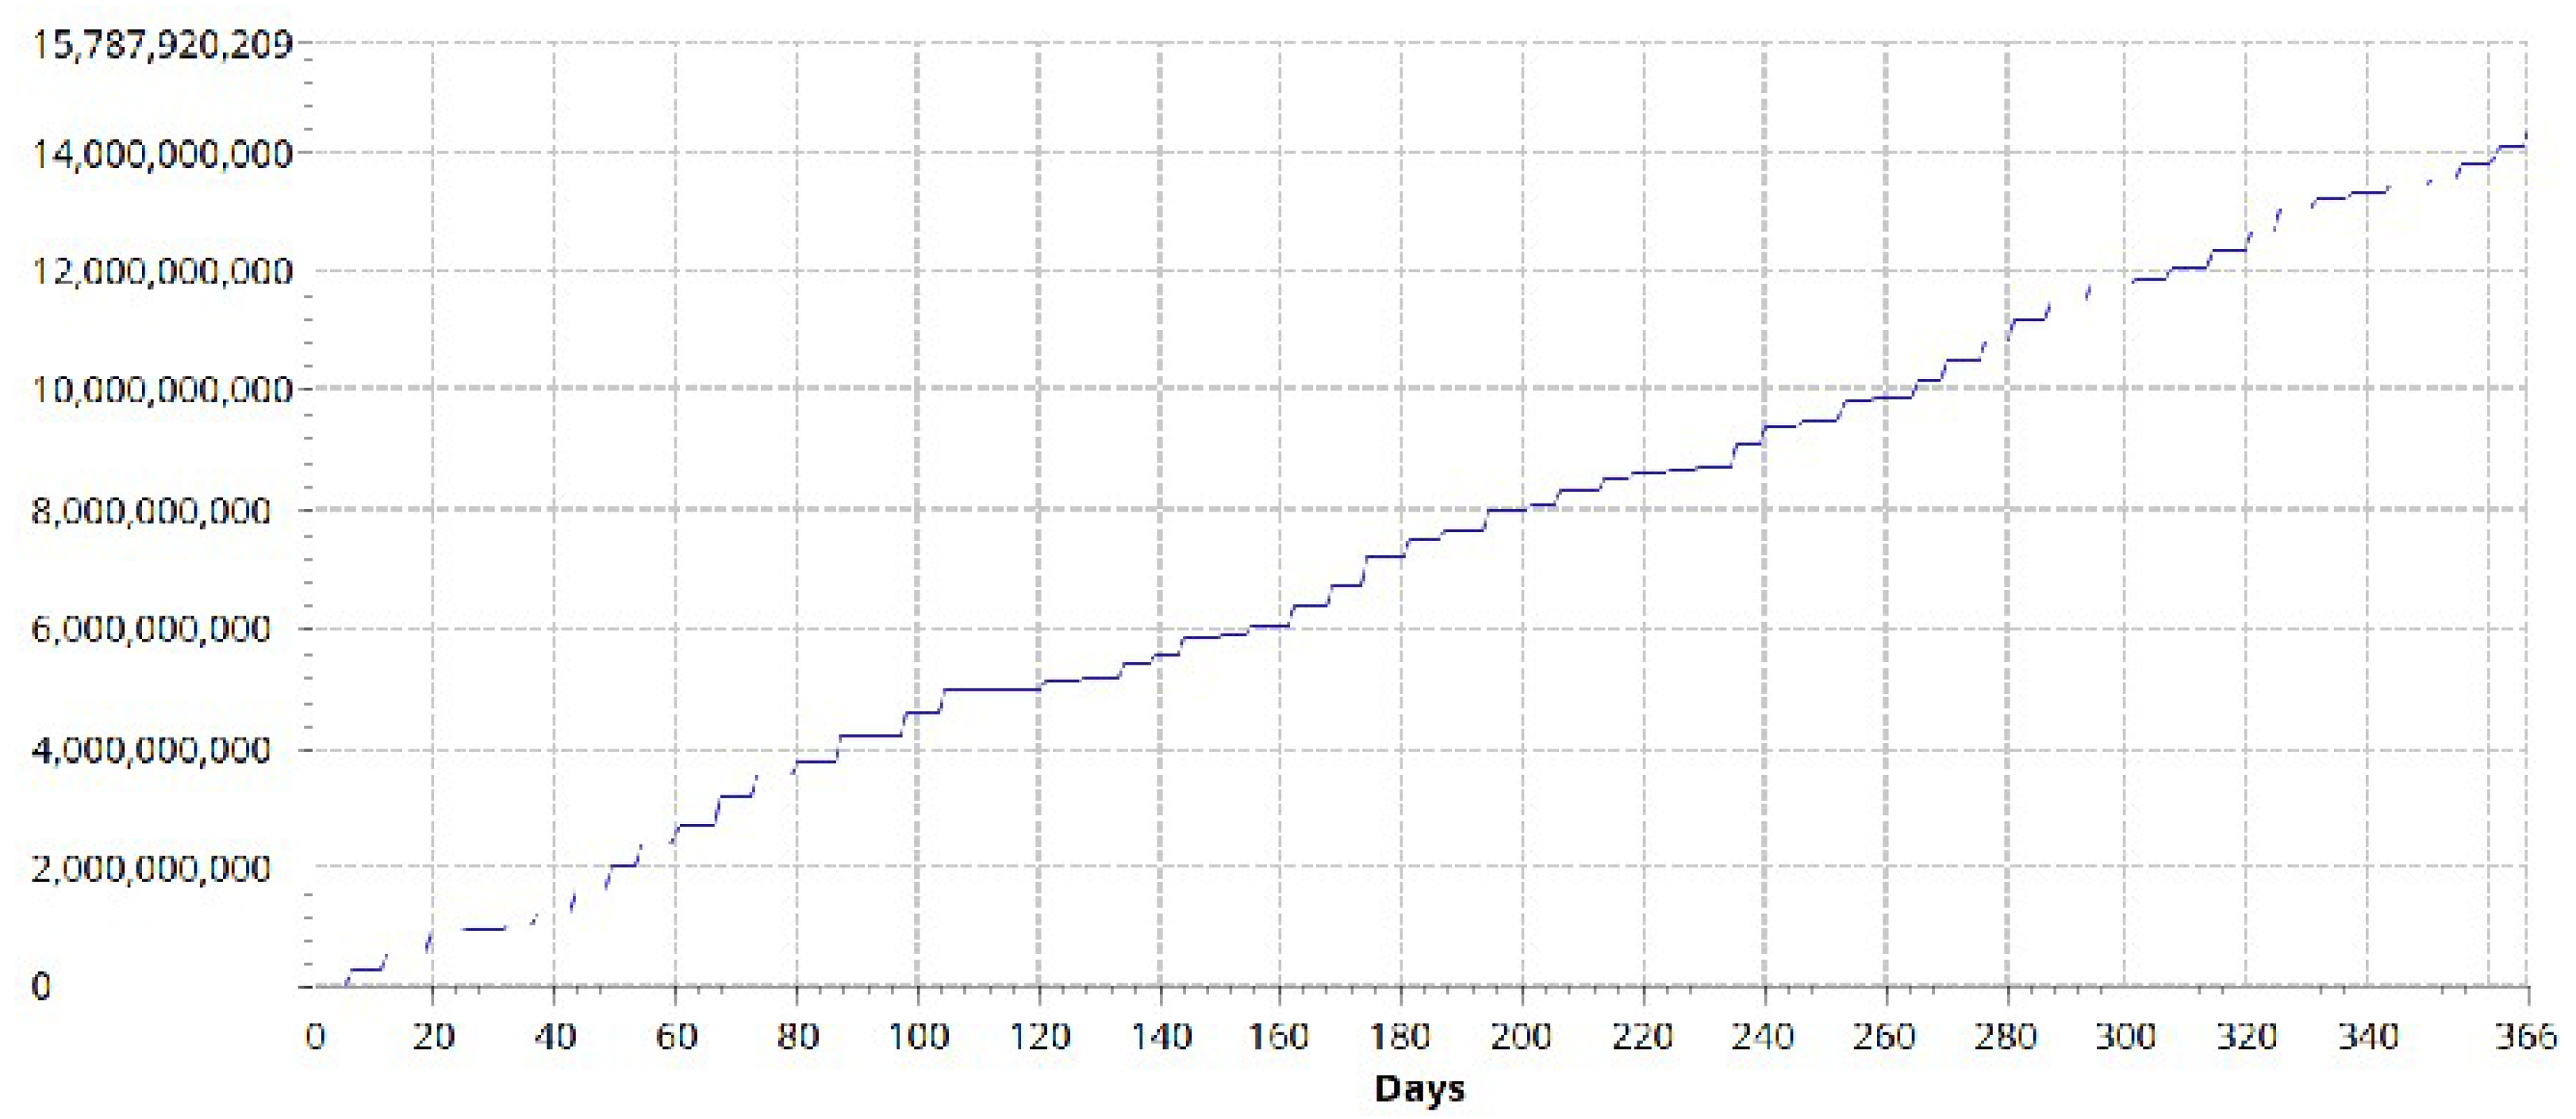
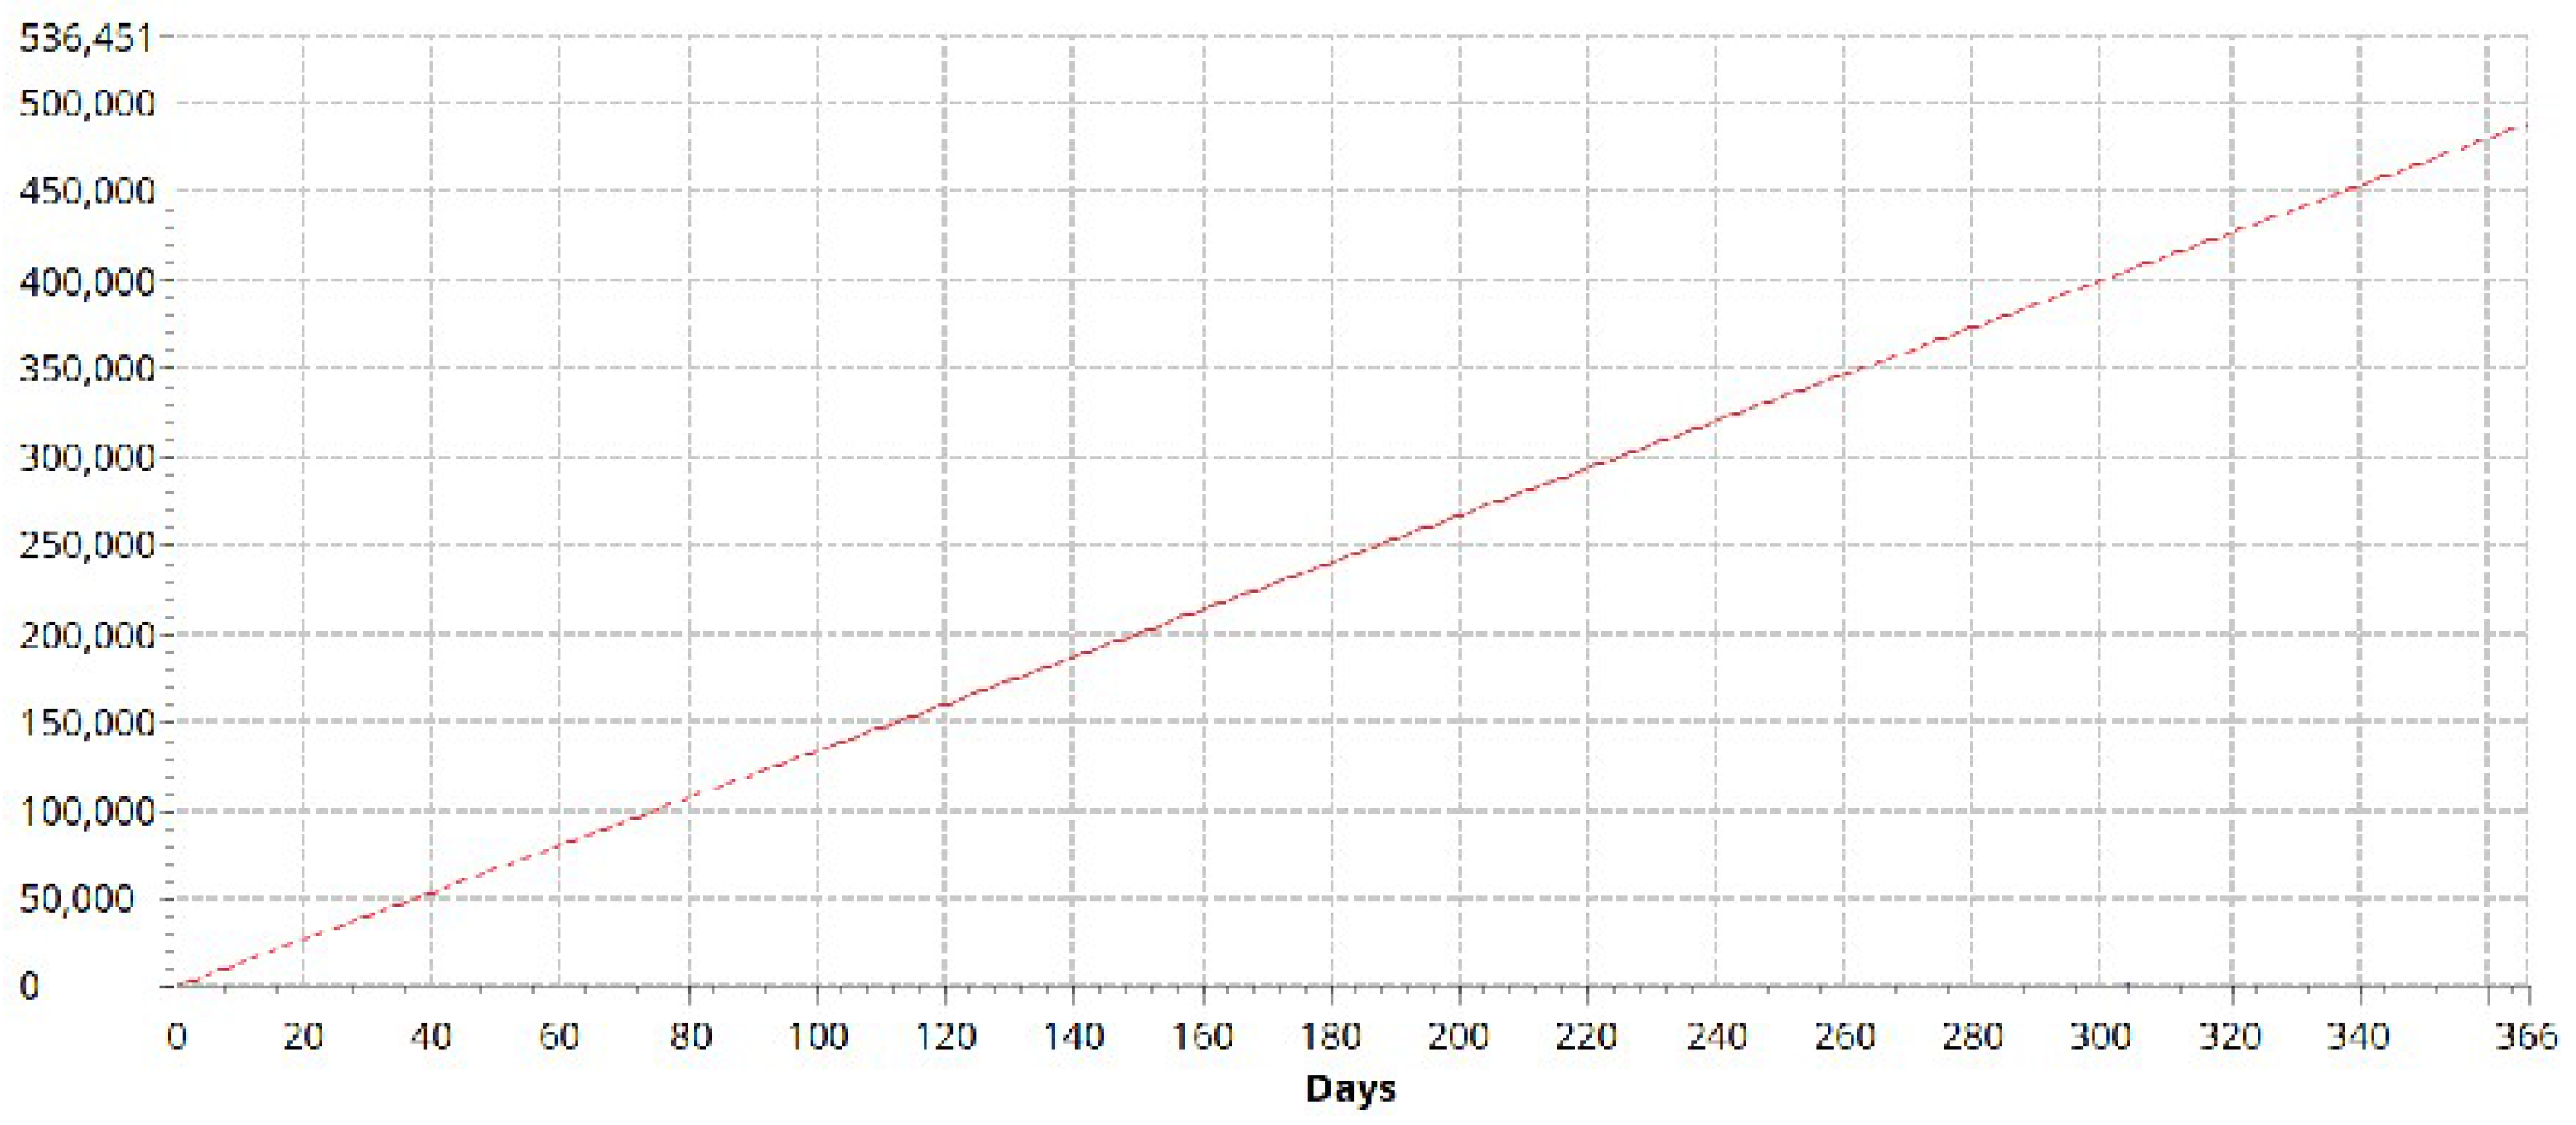
- Revenue Growth: The simulation shows a steady increase in revenue (EUR 14,352,654.73), which indicates that demand for biomass is growing. Managers could focus on expanding market reach while ensuring that operational costs are controlled to maximize profits.
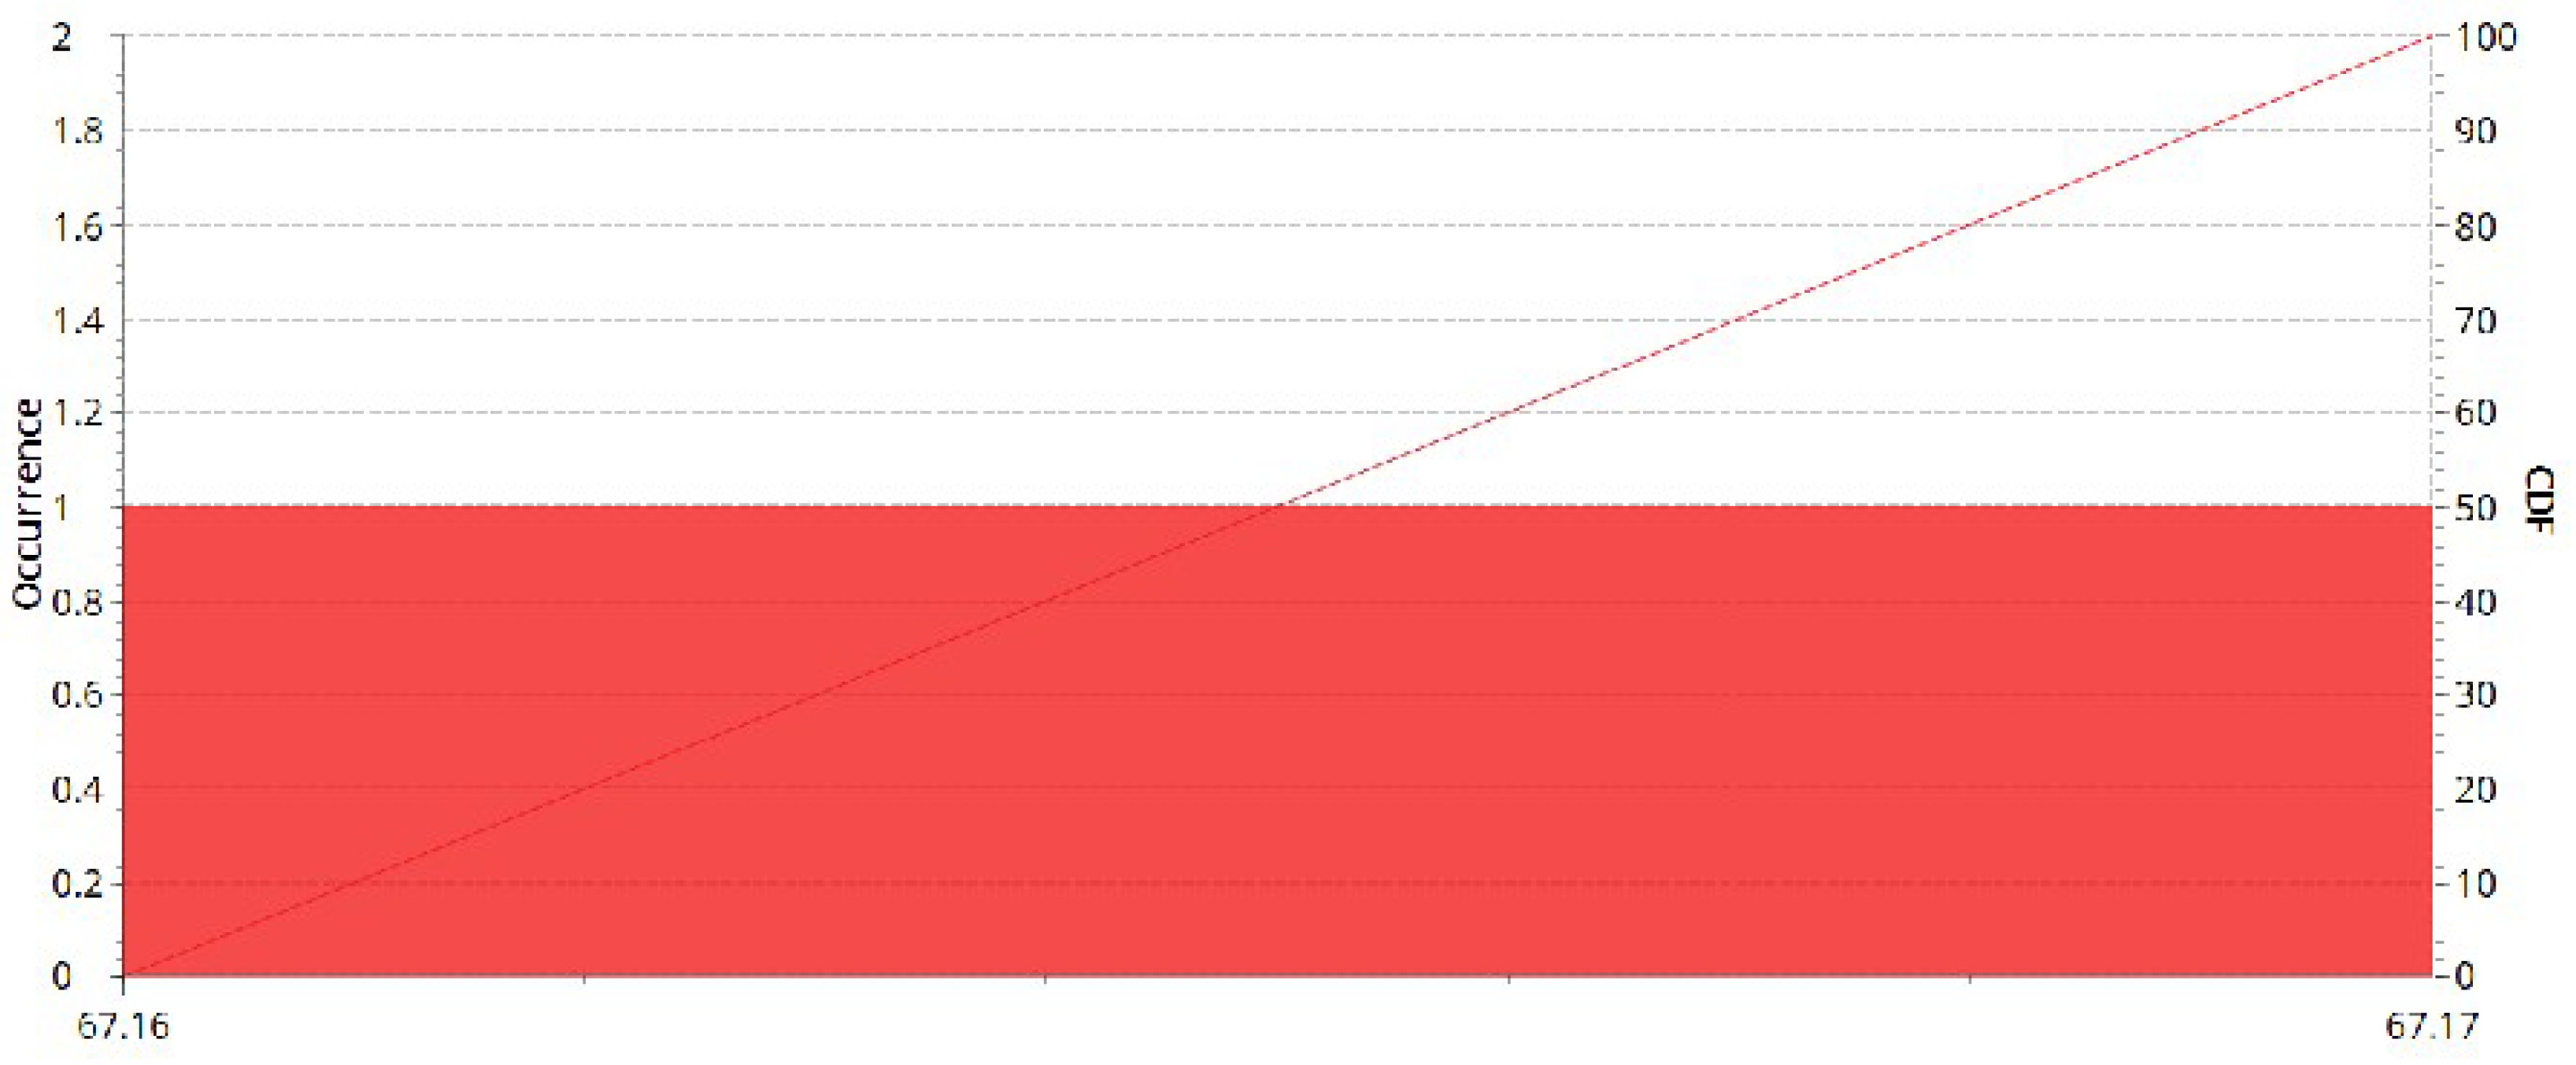
- Logistics Optimization: The analysis of trips (5678 vehicles) and peak capacity (67 m3) highlights the importance of efficient fleet management and inventory control. Managers can use this information to optimize transport schedules and storage capacity, reducing excess trips and unnecessary inventory buildup.
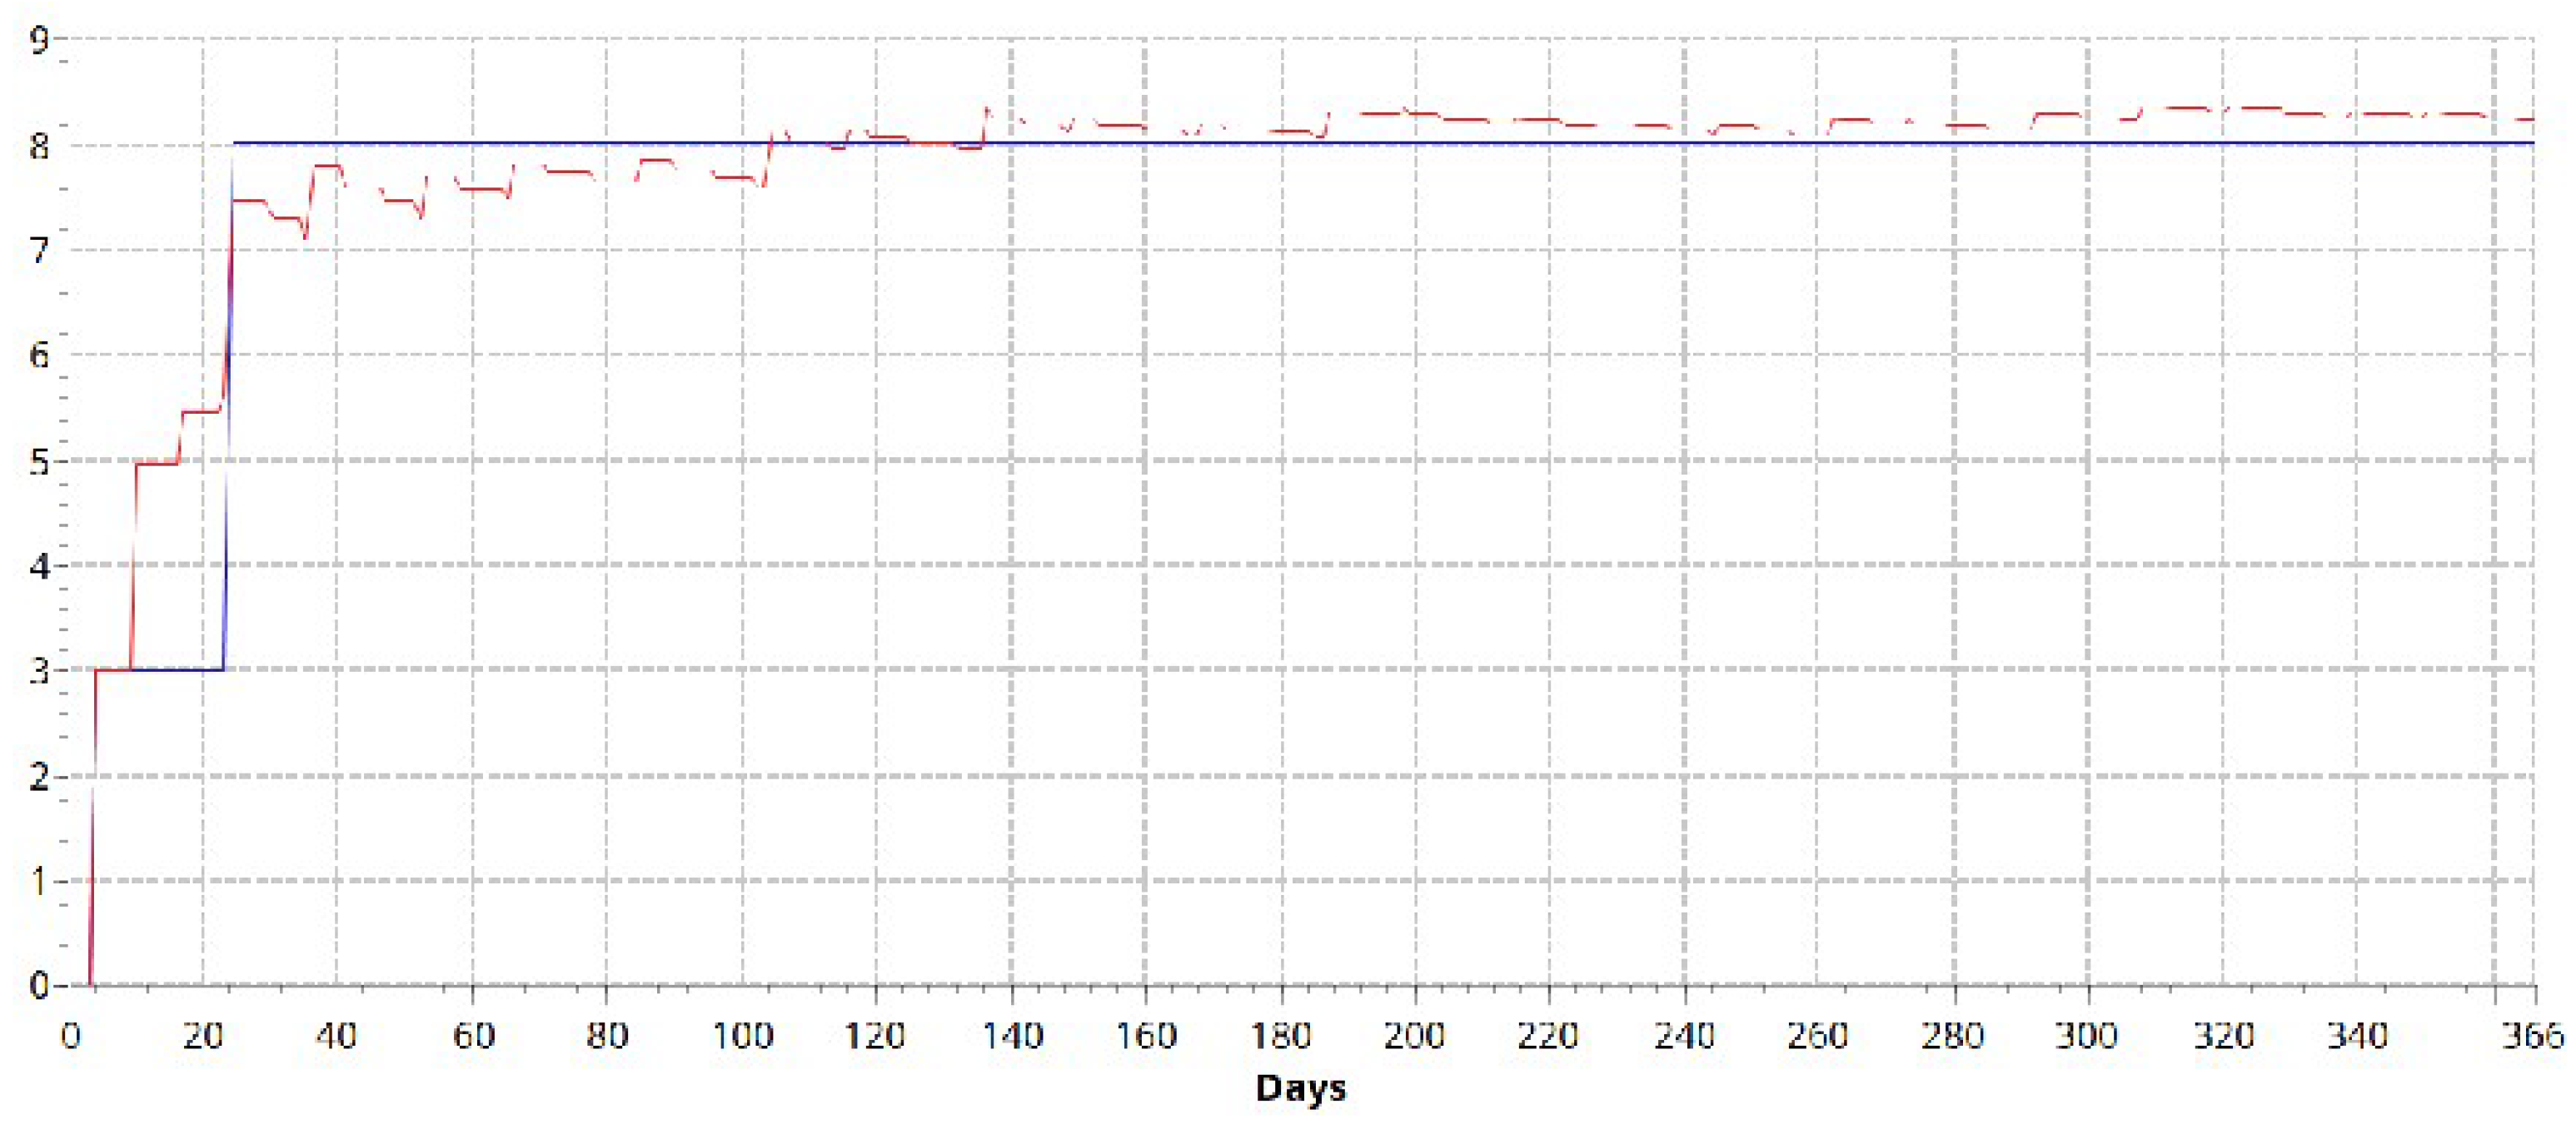
- Customer Satisfaction: With the lead time stabilizing at around 10 days, it is critical to monitor and improve service levels. The study shows a service level by order ratio of 0.1 initially, indicating room for improvement in the early stages. Managers should ensure that processes are in place to meet customer expectations, especially in the first 30 days, to prevent service level dips.
- Environmental Impact: Total CO2 emissions of 487.7 kg/m3 reveal opportunities to reduce the supply chain’s environmental footprint. Managers can adopt greener transport options and improve logistics to meet sustainability goals while complying with regulations.
- Scenario Testing: The simulation model allows decision makers to test different strategies in a controlled environment, enabling them to predict outcomes and make informed adjustments in real operations.
- Sustainable Energy Solutions: By optimizing the biomass supply chain, this study contributes to the broader societal goal of promoting affordable and clean energy (SDG 7). Biomass as a renewable energy source becomes more viable when supply chain costs are reduced and environmental impacts are minimized.
- Environmental Sustainability: Reducing CO2 emissions directly supports climate action (SDG 13). With improved logistics and greener transportation options, the study encourages more sustainable supply chain practices, contributing to lower greenhouse gas emissions.
- Resource Efficiency: The focus on minimizing waste and maximizing the use of residual biomass aligns with responsible consumption and production (SDG 12). Companies can adopt best practices to reduce waste, promoting a circular economy and more efficient resource utilization.
6.2. Recommendations for Future Work
- Integration with other Renewable Energy Systems: Comprehensive development of sustainable energy solutions through combination of bio-mass supply chains and other renewable energy systems such as wind and solar should be considered in future studies.
- Broad Sector and Regional Applications: Simulating biomass supply chains in different regions and sectors could help in deriving general insights that will encourage adoption of optimized biomass supply chains across the globe.
7. Conclusions
- Comprehensive KPI Analysis: The study provided a detailed examination of key performance indicators, including financial, operational, environmental, and customer satisfaction metrics. This offers a holistic view of supply chain performance.
- Supply Chain Simulation: The use of anyLogistix and agent-based modeling for simulating the agroforestry residual biomass supply chain provided a practical demonstration of how supply chain elements interact in real time, aiding in decision making.
- Environmental Impact Assessment: The analysis of CO2 emissions and suggestions for reducing greenhouse gases by adopting environmentally friendly transportation highlighted the study’s contribution toward sustainability in supply chain operations.
- Optimization Insights: The results emphasized the need for optimizing logistics, particularly transportation, to reduce costs and environmental impact, aligning with the sustainable development goals.
- Validation of Theoretical Models: The simulation results validated theoretical models, confirming that optimization of transportation and logistics would significantly improve supply chain efficiency and reduce financial losses.
Author Contributions
Funding
Data Availability Statement
Acknowledgments
Conflicts of Interest
References
- Rijal, B.; Gautam, S.H.; LeBel, L. The impact of forest disturbances on residual biomass supply: A long-term forest level analysis. J. Clean. Prod. 2020, 248, 119278. [Google Scholar] [CrossRef]
- Dangprok, B.; Tippayawong, K.Y.; Tippayawong, N. Development of a cost optimization model for power generation from agricultural residual biomass in Thailand. Energy Rep. 2023, 9, 55–62. [Google Scholar] [CrossRef]
- Ng, W.P.Q.; How, B.S.; Lim, C.H.; Ngan, S.L.; Lam, H.L. Biomass Supply Chain Synthesis and Optimization. In Value-Chain of Biofuels; Elsevier: Amsterdam, The Netherlands, 2022; pp. 445–479. [Google Scholar] [CrossRef]
- Nunes, L.J.R.; Causer, T.P.; Ciolkosz, D. Biomass for energy: A review on supply chain management models. Renew. Sustain. Energy Rev. 2020, 120, 109658. [Google Scholar] [CrossRef]
- Chidozie, B.C.; Ramos, A.L.; Ferreira, J.V.; Ferreira, L.P. Analytical and Simulation Models as Decision Support Tools for Supply Chain Optimization—An Empirical Study. In International Conference Interdisciplinarity in Engineering; Springer Nature Switzerland: Berlin/Heidelberg, Germany, 2023; pp. 197–206. [Google Scholar] [CrossRef]
- Vitale, I.; Dondo, R.G.; González, M.; Cóccola, M.E. Modelling and optimization of material flows in the wood pellet supply chain. Appl. Energy 2022, 313, 118776. [Google Scholar] [CrossRef]
- Chidozie, B.; Ramos, A.; Ferreira, J.; Ferreira, L.P. The Importance of Digital Transformation (5.0) in Supply Chain Optimization: An Empirical Study. Prod. Eng. Arch. 2024, 30, 127–135. [Google Scholar] [CrossRef]
- Sharma, J.; Jayant, A.; Tyagi, M. Simulation based design of Production and Multi echelon supply chain network for job shop manufacturing environment: A Case Study. In Journal of Physics: Conference Series; IOP Publishing: Bristol, England, 2019; Volume 1240, p. 012066, No. 1. [Google Scholar]
- Melis, E.; Andrea, V.; Pier, F.O. An overview of current models and approaches to biomass supply chain design and management. Curr. Sustain. Renew. Energy Rep. 2018, 5, 138–149. [Google Scholar] [CrossRef]
- Chidozie, B.C.; Ramos, A.L.; Ferreira, J.V.; Ferreira, L.P. Residual Agroforestry Biomass Supply Chain Simulation Insights and Directions: A Systematic Literature Review. Sustainability 2023, 15, 9992. [Google Scholar] [CrossRef]
- Jazinaninejad, M.; Nematollahi, M.; Zamenjani, A.S.; Tajbakhsh, A. Sustainable operations, managerial decisions, and quantitative analytics of biomass supply chains: A systematic literature review. J. Clean. Prod. 2022, 374, 133889. [Google Scholar] [CrossRef]
- Ahmadvand, S.; Sowlati, T. A robust optimization model for tactical planning of the forest-based biomass supply chain for syngas production. Comput. Chem. Eng. 2022, 159, 107693. [Google Scholar] [CrossRef]
- Aalto, M.; Raghu, K.C.; Korpinen, O.J.; Karttunen, K.; Ranta, T. Modeling of biomass supply system by combining computational methods–A review article. Appl. Energy 2019, 243, 145–154. [Google Scholar] [CrossRef]
- Nunes, L.J.R.; Silva, S. Optimization of the Residual Biomass Supply Chain: Process Characterization and Cost Analysis. Logistics 2023, 7, 48. [Google Scholar] [CrossRef]
- Rijal, P.; Bras, P.; Garrido, S.; Matias, J.; Pimentel, C.; Carvalho, H. Residual Forestry Biomass Supply Chain: A Mapping Approach. Int. J. Ind. Eng. Manag. 2023, 14, 244–256. [Google Scholar] [CrossRef]
- Hong, B.H.; Bing, S.H.; Hon, L.L. Overview of sustainable biomass supply chain: From concept to modelling. Clean Technol. Environ. Policy 2016, 18, 2173–2194. [Google Scholar] [CrossRef]
- Wu, J.; Zhang, J.; Yi, W.; Cai, H.; Li, Y.; Su, Z. Agri-biomass supply chain optimization in north China: Model development and application. Energy 2022, 239, 122374. [Google Scholar] [CrossRef]
- Wang, H.S.H.; Yao, Y. Machine learning for sustainable development and applications of biomass and biomass-derived carbonaceous materials in water and agricultural systems: A review. Resour. Conserv. Recycl. 2023, 190, 106847. [Google Scholar] [CrossRef]
- Zailan, R.; Lim, J.S.; Manan, Z.A.; Alwi, S.R.W.; Mohammadi-ivatloo, B.; Jamaluddin, K. Malaysia scenario of biomass supply chain-cogeneration system and optimization modeling development: A review. Renew. Sustain. Energy Rev. 2021, 148, 111289. [Google Scholar] [CrossRef]
- Sharma, B.; Ingalls, R.G.; Jones, C.L.; Khanchi, A. Biomass supply chain design and analysis: Basis, overview, modeling, challenges, and future. Renew. Sustain. Energy Rev. 2013, 24, 608–627. [Google Scholar] [CrossRef]
- Bastos, T.; Teixeira, L.C.; Matias, J.C.O.; Nunes, L.J.R. Agroforestry Biomass Recovery Supply Chain Management: A More Efficient Information Flow Model Based on a Web Platform. Logistics 2023, 7, 56. [Google Scholar] [CrossRef]
- Burgos and Ivanov. Food retail supply chain resilience and the COVID-19 pandemic: A digital twin-based impact analysis and improvement directions. Transp. Res. Part E Logist. Transp. Rev. 2021, 152, 102412. [Google Scholar] [CrossRef]
- Brás, P.C. Residual Agroforestry Biomass Supply Chain Characterization: A Mapping Approach. Master’s Thesis, NOVA University, Lisbon, Portugal, 2022. Available online: https://run.unl.pt/bitstream/10362/160161/1/Bras_2022.pdf (accessed on 24 September 2024).
- Ivanov, D. Design and deployment of sustainable recovery strategies in the supply chain. Comput. Ind. Eng. 2023, 183, 109444. [Google Scholar] [CrossRef]
- Bui-Duy, L.; Le, L.T.; Vu-Thi-Minh, N.; Hoang-Huong, G.; Bui-Thi-Thanh, N.; Nguyen, P.N. Economic and environmental analysis of biomass pellet supply chain using simulation-based approach. Asia Pac. Manag. Rev. 2023, 28, 470–486. [Google Scholar] [CrossRef]
- Zhao, X.; Fan, Y.; Zhang, W. Optimizing CO2 emissions and energy consumption in e-commerce logistics networks with electric vehicles. Sustain. Cities Soc. 2022, 81, 103846. [Google Scholar] [CrossRef]
- Liu, Z.; Wang, Q.; Yang, X. Cost-benefit analysis of biomass supply chains: The impact of logistics optimization. Renew. Sustain. Energy Rev. 2021, 149, 111381. [Google Scholar] [CrossRef]



| Entity | Input Parameter | Key Performance Indicators |
|---|---|---|
| Suppliers | Name Location | Total cost Transportation cost |
| Sites (Distribution Centers and Factories) | Name Location Capacity | Inventory costs |
| Customer | Name Type Location | Service level Customer revenue Fulfillment order |
| Demand | Customer Product Time period Revenue Currency Expected lead time. Back-order policy | Expected lead time (ELT) Service level |
| Period | Name Start and End date. | Lead time |
| Products | Name Unit Cost Selling price Currency | Peak capacity |
| Vehicle | Name Capacity Capacity unit Speed Speed unit CO2 emission | Total CO2 emissions Transportation cost Number of vehicles used |
| Name | Location | |
|---|---|---|
| Customer (3) | Energy company A Power plant company N Power plant company C | Coimbra Coimbra Leiria |
| Distributor (2DCs) | Logger Y | Leiria (Monte Redondo) Coimbra (Soure) |
| Suppliers (3) | Forest landowners (FLO) State CMFF | Figueira da foz (Coimbra) Figueira da foz (Coimbra Leiria |
| Type | Capacity (m3) | Speed (km/h) |
|---|---|---|
| Truck | 95 | 50 |
| Lorry | 90 | 50 |
| Metric | KPIs | Values |
|---|---|---|
| Financial | Total cost (EUR) Transportation cost (EUR) Customer revenue (EUR) | 5,219,411.3 5,219,411.3 14,352,654.73 |
| Customer satisfaction | Service level (ratio) | 1 |
| Operational | Peak capacity (m3) Lead time (day) ELT service level by customer (ratio) ELT service level by order (ratio) | 67 m3 8 days 1 0.1 |
| Environmental (CO2 emission) | Total CO2 emissions (kg/m3) Number of trips | 487.7 kg/m3 5678 |
Disclaimer/Publisher’s Note: The statements, opinions and data contained in all publications are solely those of the individual author(s) and contributor(s) and not of MDPI and/or the editor(s). MDPI and/or the editor(s) disclaim responsibility for any injury to people or property resulting from any ideas, methods, instructions or products referred to in the content. |
© 2024 by the authors. Licensee MDPI, Basel, Switzerland. This article is an open access article distributed under the terms and conditions of the Creative Commons Attribution (CC BY) license (https://creativecommons.org/licenses/by/4.0/).
Share and Cite
Chidozie, B.; Ramos, A.; Vasconcelos, J.; Ferreira, L.P. Development of a Residual Biomass Supply Chain Simulation Model Using AnyLogistix: A Methodical Approach. Logistics 2024, 8, 107. https://doi.org/10.3390/logistics8040107
Chidozie B, Ramos A, Vasconcelos J, Ferreira LP. Development of a Residual Biomass Supply Chain Simulation Model Using AnyLogistix: A Methodical Approach. Logistics. 2024; 8(4):107. https://doi.org/10.3390/logistics8040107
Chicago/Turabian StyleChidozie, Bernardine, Ana Ramos, José Vasconcelos, and Luis Pinto Ferreira. 2024. "Development of a Residual Biomass Supply Chain Simulation Model Using AnyLogistix: A Methodical Approach" Logistics 8, no. 4: 107. https://doi.org/10.3390/logistics8040107
APA StyleChidozie, B., Ramos, A., Vasconcelos, J., & Ferreira, L. P. (2024). Development of a Residual Biomass Supply Chain Simulation Model Using AnyLogistix: A Methodical Approach. Logistics, 8(4), 107. https://doi.org/10.3390/logistics8040107


