Article

Advanced Supply Chain Management Using Adaptive Serial Cascaded Autoencoder with LSTM and Multi-Layered Perceptron Framework

by
Aniruddha Deka
1,†,
Parag Jyoti Das
1,† and
Manob Jyoti Saikia
2,3,*
1
Department of Computer Science and Engineering, Assam Down Town University, Guwahati 781026, India
2
Department of Electrical and Computer Engineering, University of Memphis, Memphis, TN 38152, USA
3
Biomedical Sensors & Systems Lab, University of Memphis, Memphis, TN 38152, USA
*
Author to whom correspondence should be addressed.
These authors contributed equally to this work.
Logistics 2024, 8(4), 102; https://doi.org/10.3390/logistics8040102
Submission received: 31 July 2024 / Revised: 24 September 2024 / Accepted: 4 October 2024 / Published: 10 October 2024

Abstract

:
Supply chain management is essential for businesses to handle uncertainties, maintain efficiency, and stay competitive. Financial risks can arise from various internal and external sources, impacting different supply chain stages. Companies that effectively manage these risks gain a deeper understanding of their procurement activities and implement strategies to mitigate financial threats. This paper explores financial risk assessment in supply chain management using advanced deep learning techniques on big data. The Adaptive Serial Cascaded Autoencoder (ASCA), combined with Long Short-Term Memory (LSTM) and Multi-Layered Perceptron (MLP), is used to evaluate financial risks. A data transformation process is used to clean and prepare financial data for analysis. Additionally, Sandpiper Galactic Swarm Optimization (SGSO) is employed to optimize the deep learning model’s performance. The SGSO-ASCALSMLP-based financial risk prediction model demonstrated superior accuracy compared to traditional methods. It outperformed GRU (gated recurrent unit)-ASCALSMLP by 3.03%, MLP-ASCALSMLP by 7.22%, AE-LSTM-ASCALSMLP by 10.7%, and AE-LSTM-MLP-ASCALSMLP by 10.9% based on F1-score performance. The SGSO-ASCALSMLP model is highly efficient in predicting financial risks, outperforming conventional prediction techniques and heuristic algorithms, making it a promising approach for enhancing financial risk management in supply chain networks.

1. Introduction

There are many opportunities and difficulties that arise in the international economy’s rapid development. The domestic perspective does not include huge firms’ activities. In globalization, it is important to pay attention to the entire world. Multinational corporations engage in outsourcing and offshore production, which are important strategic decisions to maintain reduced risk [1]. In financially and economically underdeveloped areas, cost-depression-oriented supply chains and distribution channels are formed. The structural stability and financial cost of the entire supply chain are impacted by Small and Medium-sized Enterprises (SMEs), which have limited financial resources [2]. The marginal impact of continual investment has declined based on the information flow and logistics developed in supply chain management [3]. But, most scholars and professionals are focused on capital restraints in the supply chain [4]. Supply chain financing is particularly significant because it becomes necessary to move the target of supply chain exploration and research to the supply chain. While efficient productivity, fast services, reduced costs, and safe product delivery are the goals of supply chain management, the complexity is only increased by having several vendors, channels, producers, and distributors [5]. It is more difficult to analyze and gather data because of the huge number of resources involved. Big data analytics ultimately offers processes with simple and appropriate solutions. Big data intends to be more cumulative. The information gathered and used in one application is easily transferable to another [6]. Additionally, it results in more accurate forecasts, and the outcomes are better with more available data sources.
Downstream and upstream businesses have supplied new finance, and enterprises and funding channels have enlarged the development area to improve the determination of the crucial domain, which is the core value of the supply chain members. A golden age of development has been achieved by specific plans in mobile environments, the cloud, big data, and blockchain, as well as the depth of application of related financial and artificial intelligence technologies, the growth of online financial supply chains using the Internet as a singular financial mode, and ongoing high-speed upgrades. Enterprises are subjected to objective and global supply chain risks [7]. The fragility of the supply chain system becomes increasingly apparent as a result of the complexity of the supply chain and the unpredictability of its external environment, both of which raise the likelihood of supply chain risks [8]. A crucial problem is handling supply chain risks rationally and successfully [9]. Risk evaluation, risk management, risk identification, risk monitoring, and risk decision-making are all parts of managing supply chain risks. However, it is important to ensure the security of the supply chain by assessing the risks faced and clarifying their levels before taking effective risk management and monitoring measures to reduce the supply chain’s vulnerability, reduce costs, and control and mitigate risks and losses. Risk evaluation is the foundation of risk management and decision-making and is a crucial component of supply chain risk management. Consequently, it is crucial to research supply chain risk assessment.
One typical approach to assessing the credit risks of SCF is the credit risk evaluation model based on professional experience [10]. The simple processing of qualitative information and high flexibility are advantages of the SCF system. It depends on expert judgment [11]. The credit risk assessment system relates to conventional financial indicators, and its benefit is that it can thoroughly take into account numerous financial indicators, even though it only focuses on assessing financial data [12]. The most popular techniques include regression analysis, fuzzy comprehensive evaluation, the analytical hierarchy process, and the gray system method [13]. However, the current approaches also have some drawbacks. Sometimes, only one or a few evaluation factors are chosen [5]. When establishing the index’s weight, artificial effects and subjective effects are very significant. Furthermore, the characteristics of each index frequently exhibit complicated nonlinear relationships, although the linear regression analysis approach deals with the link between the components and original values according to a linear relationship, which is very different from reality [14].
The numerous contributions made to the established financial risk prediction process in the supply chain management system are discussed here. In this paper, we have implemented effective deep learning-based financial risk prediction in the supply chain management model to predict financial risk and help avoid financial losses. An effective hybrid algorithm is proposed for optimizing the parameters, and the developed SGSO algorithm is used to maximize the accuracy and thus improve the performance of the financial risk prediction model in the supply chain management system. We developed an effective ASCALSMLP approach that increases the financial risk prediction model’s performance and enhances the analysis of the prediction data by optimizing the epochs and hidden neuron count in LSTM, the hidden neuron count and epochs in the autoencoder, and the learning rate and hidden neuron count in the MLP model. Lastly, the efficiency of several commonly used financial risk prediction methods and heuristic algorithms is compared with that of the newly developed model for financial risk prediction in the supply chain.
The proposed model is briefly explained in the subsequent parts. Section 2 discusses the numerous financial risk prediction algorithms and approaches recently used. Section 3 presents the recommended model for the newly developed financial risk prediction process and an explanation of the dataset. Section 4 describes the data transformation stages, deep learning techniques, and newly developed algorithms. Section 5 explains the methodology used to construct the financial risk prediction model in the supply chain. Section 6 illustrates the outcomes of financial risk prediction in the supply chain model and evaluation measures. The conclusion regarding the developed financial risk prediction model is finally provided in Section 7.

2. Literature Survey

In 2020, Cai et al. [15] suggested a new risk evaluation system using a deep learning approach for analyzing the factors of the supply chain. The findings demonstrated that BPNN has distinct advantages for tackling extremely nonlinear situations in supply chain risk assessment. The implemented approach was recognized to identify supply chain risks. Therefore, the developed system leads to better business profits.
In 2022, Bassiouni et al. [16] proposed a new COVID-19 risk prediction model using deep learning. Denoising, feature extraction, pre-processing, classification, and data collection were the four primary phases of the implemented deep learning technique. Two primary deep learning model variations were required for the feature extraction phase. Six distinct classifiers were used in the overall proposed procedure. An online dataset was utilized with the developed model. The outcomes of the demonstrated model showed accurate prediction in estimating the risk of shipping to a specific location while subject to COVID-19 constraints.
In 2021, Feng et al. [17] designed a deep learning-based risk prediction system for corporate finance. First, forecast indexes were chosen based on the index selection concept, and an index system for early warning was built. After that, factor analysis was used to optimize the index system. The developed financial risk prediction system showed high accuracy and precision. The developed deep learning-based financial crisis forecasting model produced better outcomes.
In 2021, Zhang et al. [18] implemented a credit risk prediction model of finance using deep learning with an optimization strategy. Thirteen and fifteen third-level indicators were ultimately identified. The dataset was chosen from the Electronic and Computer Manufacturing Industry. The inputs were chosen through application analysis. The supply chain financial evaluation used the firefly algorithm in the developed model.
In 2022, Yao et al. [19] suggested a unique ensemble feature selection approach using deep learning. The best and most stable feature subset could be produced using the FS-MRI method, which could also implement an automatic threshold function while considering model performance. Compared to other ensemble models and single classifiers, the developed model performed better in terms of KS and AUC. With maximum AUC and KS values, the two algorithms worked together to produce the best prediction performance.
In 2022, Dang et al. [20] implemented a deep learning-based risk prediction model with a blockchain framework. The financial risks were first examined using the pertinent monetary inward theory. In order to discuss the potential credit risk associated with supply chain finance, the financing model of this industry was also examined. At last, the testing process and simulation process were performed on the developed model. An analysis of the results revealed that the developed model was capable of accurately predicting the prospective credit risk of the industry. The developed model had higher accuracy than other existing approaches.
In 2021, Zhang et al. [21] developed a new risk prediction model using deep learning. To build the accompanying system and index model for online financial risk prediction in supply chain management based on enhanced random forest, an improved stochastic algorithm was applied to online supply chain risk prediction. Data analysis demonstrated the precision and viability of the enhanced random forest for online financial risk prediction in supply chain management.
In 2021, Wu et al. [22] proposed a deep learning-based credit risk management model using optimization. Indicator selection was implemented in this model. The behaviors of these indicators were chosen using principal component analysis because several elements affect credit risks, which causes difficulties in choosing characteristics. An ideal credit risk assessment approach was established, and the case analysis method was used to validate the suggested risk assessment method. Through validation, it was discovered that the optimization method performed better in predicting agricultural credit risk, and both the accuracy and speed of its prediction were increased. As a result, the proposed model employed in agricultural risk prediction in supply chain management had good results when assessing the financial risk to lower agricultural risks.
In 2022, Ghazikhani et al. [23] argued that recent advancements in meteorological prediction models, such as the Climate Forecast System Version 2 (CFSV2), have not fully resolved issues related to accuracy, prompting the need for effective post-processing methods. Post-processing techniques, particularly those employing machine learning algorithms, have become essential in refining these models’ predictions. The random forest (RF) algorithm, in particular, demonstrated notable success, achieving a correlation coefficient above 0.87, making it more accurate than other methods. This study not only proposed a post-processing method for CFSV2 but also developed a Decision Support System (DSS) that leverages this method to address precipitation-related challenges, such as floods and droughts, thereby contributing to sustainable development goals (SDGs). The research also highlighted the innovative transition from academic concepts to industrial applications, facilitated by a user-friendly graphical interface, marking a significant step in improving meteorological prediction accuracy and utility.
In 2023, Mamoudan et al.’s study [24] contributed to this growing body of knowledge by proposing innovative hybrid neural network-based metaheuristic algorithms for more accurate signal analysis in the precious metals market. The previous literature had explored various deep learning and machine learning models for financial prediction, but this study’s novelty lay in combining a convolutional neural network (CNN) and a bidirectional gated recurrent unit (BiGRU), with hyperparameters optimized using the firefly algorithm. Additionally, the study employed the moth–flame optimization algorithm to select the most influential variables, enhancing the model’s predictive performance. Comparative analyses with other state-of-the-art methods demonstrate that the proposed hybrid approach significantly improves the reliability of technical analysis indicators, offering a valuable decision support tool for investors navigating the volatile financial and precious metals markets.
In 2024, Zhan et al. [25] explored various methods for assessing and improving sustainable transportation, with recent studies highlighting the effectiveness of hybrid approaches combining quantitative and qualitative analysis techniques. This study contributed to the existing body of knowledge by introducing a novel hybrid method that integrates the Criteria Importance Through Intercriteria Correlation (CRITIC) and Decision-Making Trial and Evaluation Laboratory (DEMATEL) with deep learning features. This approach not only enhances the accuracy of low-carbon transportation assessments but also objectively identifies key influencing factors and their interconnections. The application of this method in a Chinese case study, validated through sensitivity analysis, demonstrated its potential for informing policy- and decision-making, thereby advancing sustainable transportation initiatives in China.
In the reviewed literature, most studies rely on either one or two prediction-based models, each having its own strengths and weaknesses. In this paper, we propose a hybrid supply chain management framework called SGSOASCALSMLP by amalgamating three deep learning architectures, namely, an autoencoder, LSTM, and MLP, which achieves better efficiency and accuracy than conventional risk prediction approaches by leveraging their various advantages and mitigating their disadvantages.

3. Problem Statement

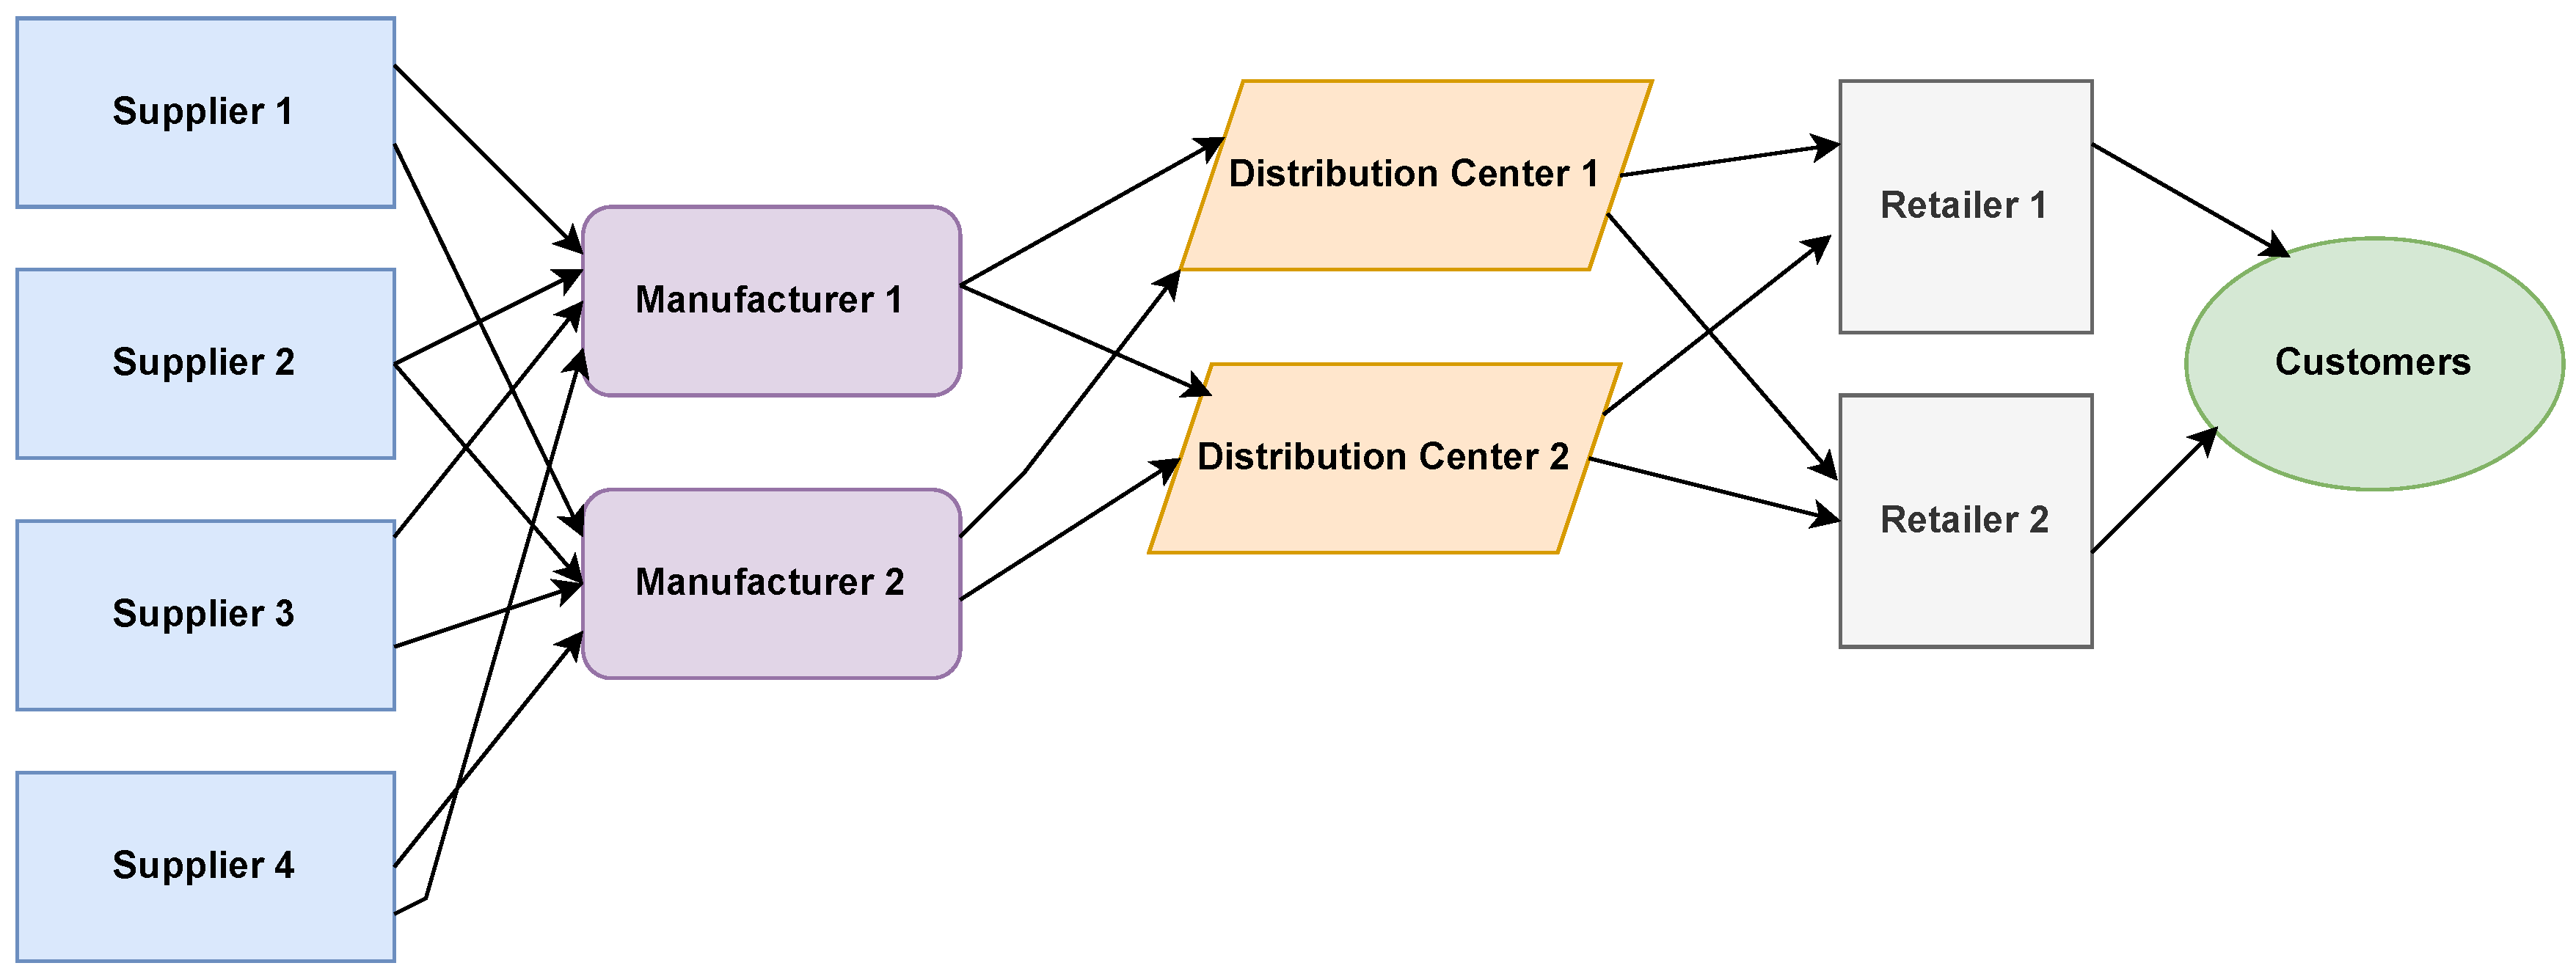
Evaluating financial risk in supply chain management is complex due to the challenge of selecting appropriate risk characteristics. As listed in Table 1, existing deep learning techniques, such as BPNN and FA-SVM, offer some advantages but struggle with issues like qualitative indicator bias, training complexity, and the inability to adapt to dynamic changes. Models like SBFS-RI and FS-MRI demonstrate high accuracy but lack practical applicability. Moreover, the improved stochastic forest algorithm fails to effectively integrate capital and information flows. Consequently, a comprehensive model that addresses these limitations and enhances prediction accuracy, adaptability, and robustness is essential for effective financial risk evaluation in supply chains. Therefore, the need for an Advanced Supply Chain Management framework using an Adaptive Serial Cascaded Autoencoder with LSTM and Multi-Layered Perceptron (ASCALSMLP) arises from the complexities of accurately predicting financial risks in supply chains. Traditional models struggle with handling dynamic, multidimensional data, adapting to real-time conditions, and ensuring prediction accuracy. The ASCALSMLP framework integrates deep learning techniques to enhance feature extraction, handle sequential data, and improve risk prediction accuracy. It offers improved scalability, adaptability to changing market conditions, and a more robust risk management approach. This makes it highly effective for real-world financial risk assessment in supply chains. Figure 1 depicts the supply chain network used in our study.

4. Financial Risk Prediction in Supply Chain Management Using Soft Computing-Based Deep Learning

4.1. Framework of Financial Risk Prediction in SCM

The ability of businesses to adapt to the environmental market depends on the effective integration of global operations into Closed-Loop Supply Chains (CLSCs), which combine the forward and reverse flow of products in the direction of environmental and financial objectives. SCs are effectively built and run significantly, which helps to reduce their negative effects on the environment. Companies add social and environmental considerations to their business priorities as a result. The sustainable supply chain (SSC) has emerged from the three sustainability pillars. Supply chain financial services are completely covered in order to increase transactions and data sharing. In addition to the need for specialists, consensus procedures and block hardware infrastructure pose some difficulties. Internet finance, which has seen recent growth, has been demonstrated to be a financial technology that improves the adaptability and inclusivity of financial institutions. It may also hasten the transmission of financial risk and pose more difficulties in providing financial security. However, from the standpoint of national policy, which is not unique or specialized with regard to risk response techniques, it also introduces a systematic and all-encompassing risk prevention system to maintain financial security. Users can use this functionality to run the model without focusing on how the model functions and give it data to work with previously utilized functions. But, it raises several difficulties for researchers during risk prediction. A diagram of the investigated deep learning-based supply chain management model is given in Figure 2.
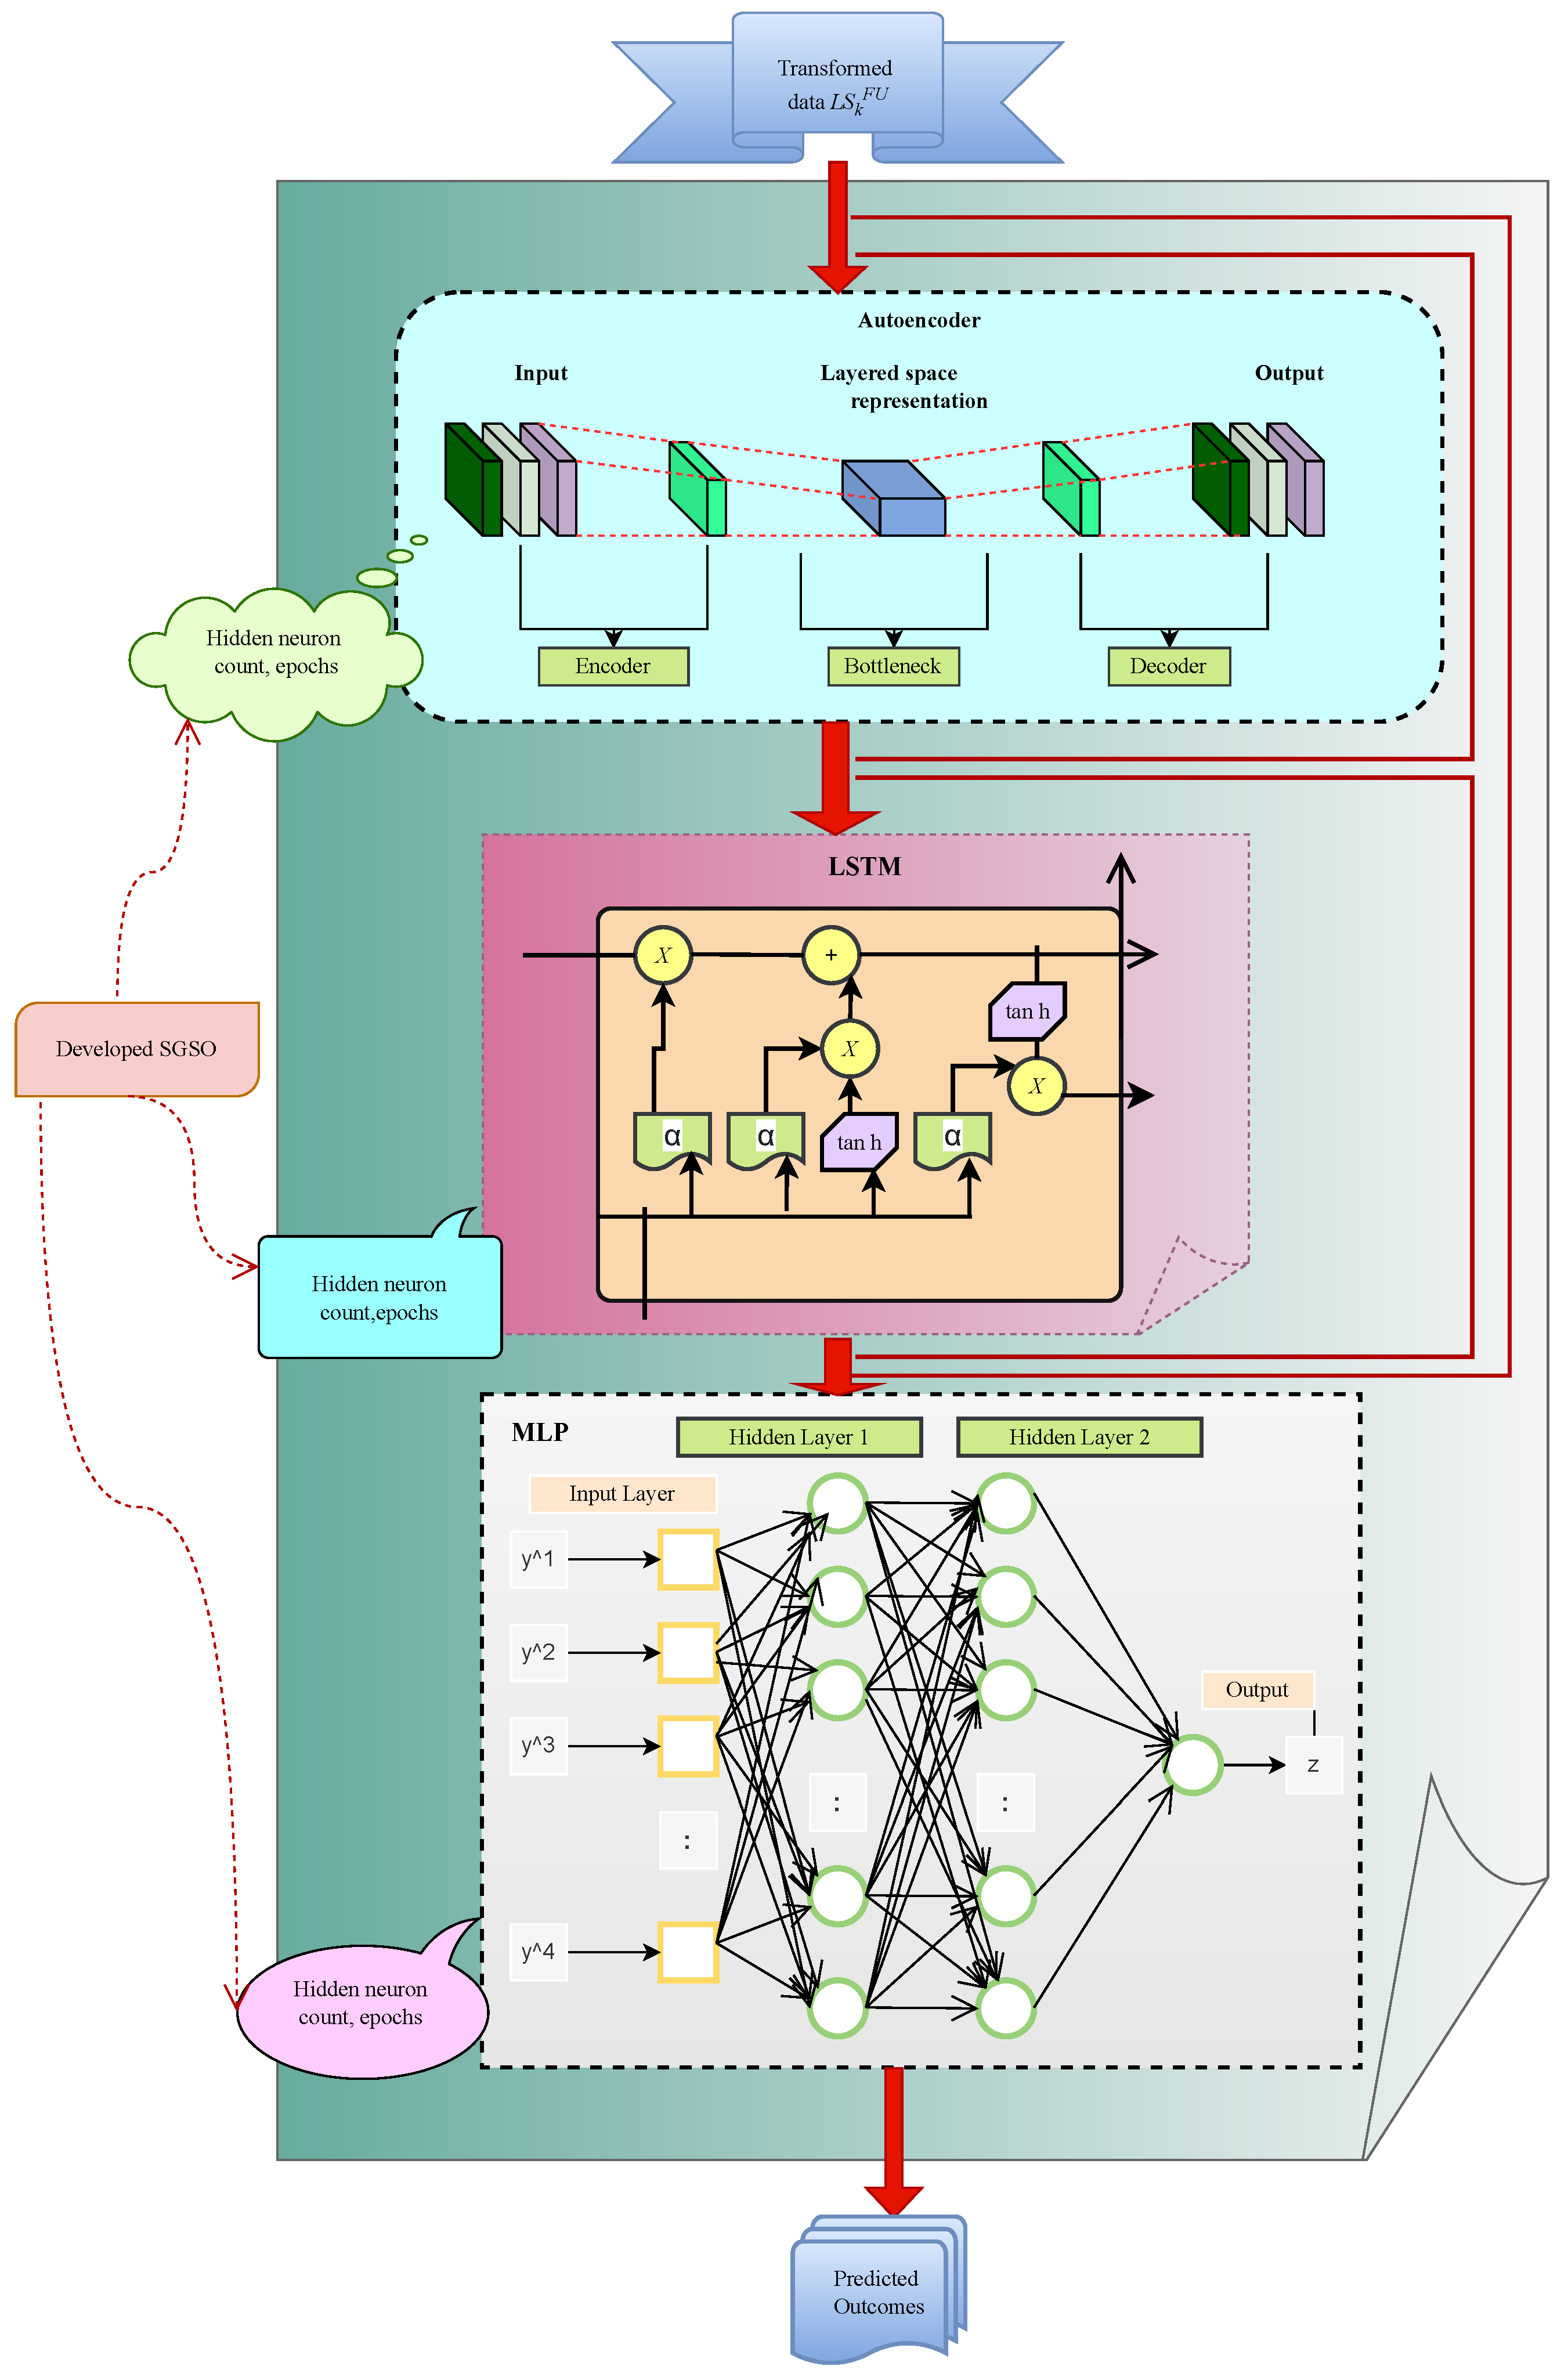
The newly suggested deep learning-based supply chain management model is utilized to predict financial risk in supply chain management. It helps to provide an early warning of risk. The developed financial risk prediction system is adopted in supply chain management to solve problems like information leakage, capital loss, and information fraud in supply chain management. The financial data used in this study were collected from online resources. The collected financial data are subjected to a data transformation stage. Here, data transformation includes normalization, duplicate removal, and the replacement of NAN and NULL values. Then, the transformed data are passed on to the financial risk prediction phase. Financial risk prediction can be performed by the ASCALSMLP system. Deep learning techniques, namely, LSTM, autoencoder, and MLP, are serially cascaded here. The transformed data are processed by the autoencoder method in the prediction stage. Next, the effective features are extracted from the autoencoder. The extracted features are given to the LSTM and MLP networks for the prediction of risk levels. The developed SGSO strategy is adopted for optimizing parameters like the hidden neuron count and epochs in LSTM, the hidden neuron count and epochs in the autoencoder, and the learning rate and hidden neuron count in MLP to enhance the effectiveness of the supply chain management system. The proposed SGSO algorithm is used to maximize the accuracy. The suggested SGSOASCALSMLP-based method for supply chain management is compared to conventional financial risk prediction techniques and heuristic algorithms to check its efficiency. The developed model showed high accuracy.

4.2. Financial Risk Prediction in SCM Dataset Details

A large-dimensional dataset was used to predict financial risk in supply chain management. A description of the collected dataset for predicting financial crises in supply chain management is given below.
Dataset (Bankruptcy Risk Prediction): This dataset can be obtained from the Kaggle database using the link “https://www.kaggle.com/competitions/bankruptcy-risk-prediction/data” (Access Date: 1 October 2023). This dataset is provided by banks. The variables in these datasets are presented in numerical and categorical forms. The numerical values are sum, dependents, term, age, payment, credits, and residence duration. The categorical values are qualification, reason, status, credit report, immigrant employment, other credits, savings, marital status, guarantees, estate, and phone accommodation. The variable target in the training set is determined by bankruptcy. The identification number is indicated by id. This dataset contains three folders, which are test.csv, train.csv, and submission example.csv. Generally, the dataset files are presented in a CSV format. There are 45 columns in the dataset.

5. Data Transformation with the Use of Deep Learning Models for Financial Risk Prediction in Supply Chain Management

5.1. Data Transformation

The gathered data applied to the data transformation method are denoted by DT A IN . Data transformation involves translating data from one format to another, often from the source system’s format to the desired destination system’s format, without altering the dataset content. Usually, it is employed to increase the data quality. Most data integration and management operations include data wrangling, data warehousing, and different types of data transformation.
Step 1: Normalization: The input applied to the normalization method is DT A IN . Here, data are transformed into similar-scale data through data normalization. Depending on the size of the data, data normalization models recenter and rescale the data so that they lie between 0 and 1 or −1 and 1. This enhances the model’s training stability and functionality. The output of the normalized data is indicated by DT A NOM .
Step 2: Replacement of NAN and NULL values: The normalized data DT A NOM are given to the NAN and NULL replacing section. Eliminating rows or columns containing null values is one method for addressing missing values. The entire column is removed if any columns contain one or more null values. Similar to how columns can be dropped if one or more of their values are null, rows can be dropped. The output is denoted by DT A REP .
Step 3: Removal of duplicate values: The input given to the duplicate removal stage is denoted by DT A REP . Duplicates are not always present in the same column but can be present anywhere in the data. This may result in skewed performance predictions, which would decrease the model’s performance when it comes to its actual use. This step eliminates duplicate rows based on all columns by default. The output of the transformed data is indicated by DT A DU .

5.2. Autoencoder-Based Feature Extraction

The transformed data are given to the autoencoder and are denoted by DT A DU . There are three levels in the autoencoder: an output layer, an input layer, and a concealed layer. Decoding is handled by the output layer. Encoding is handled by the hidden layer. In order to produce the intended output, the network is configured to copy or recreate its input. In an autoencoder, the dimensions of the output and input layers must coincide. The encoder’s hidden layer is provided in Equation (1):
h = i ( Y x k + d )
The input decoder’s hidden representation is given in Equation (2):
Z ^ K = h ( Y j + e )
The error loss of the squared function is computed from Equation (3):
l ( θ ) = Min 1 o l = 1 n l = 1 n z k l z ^ k l 2
Finally, the term h is an activation function. The term z ^ k denotes the reconstructed input, and the weight Y is indicated with c bias. The autoencoder contains three parts: the encoder, decoder, and code. An incomplete autoencoder can capture all of the essential details of the inputs. The autoencoder may display both linear and nonlinear changes. An under-complete autoencoder is often used for data denoising and dimension reduction. Therefore, the autoencoder extracts the relevant features, and it is indicated by AU p EX .

5.3. LSTM-Based Prediction

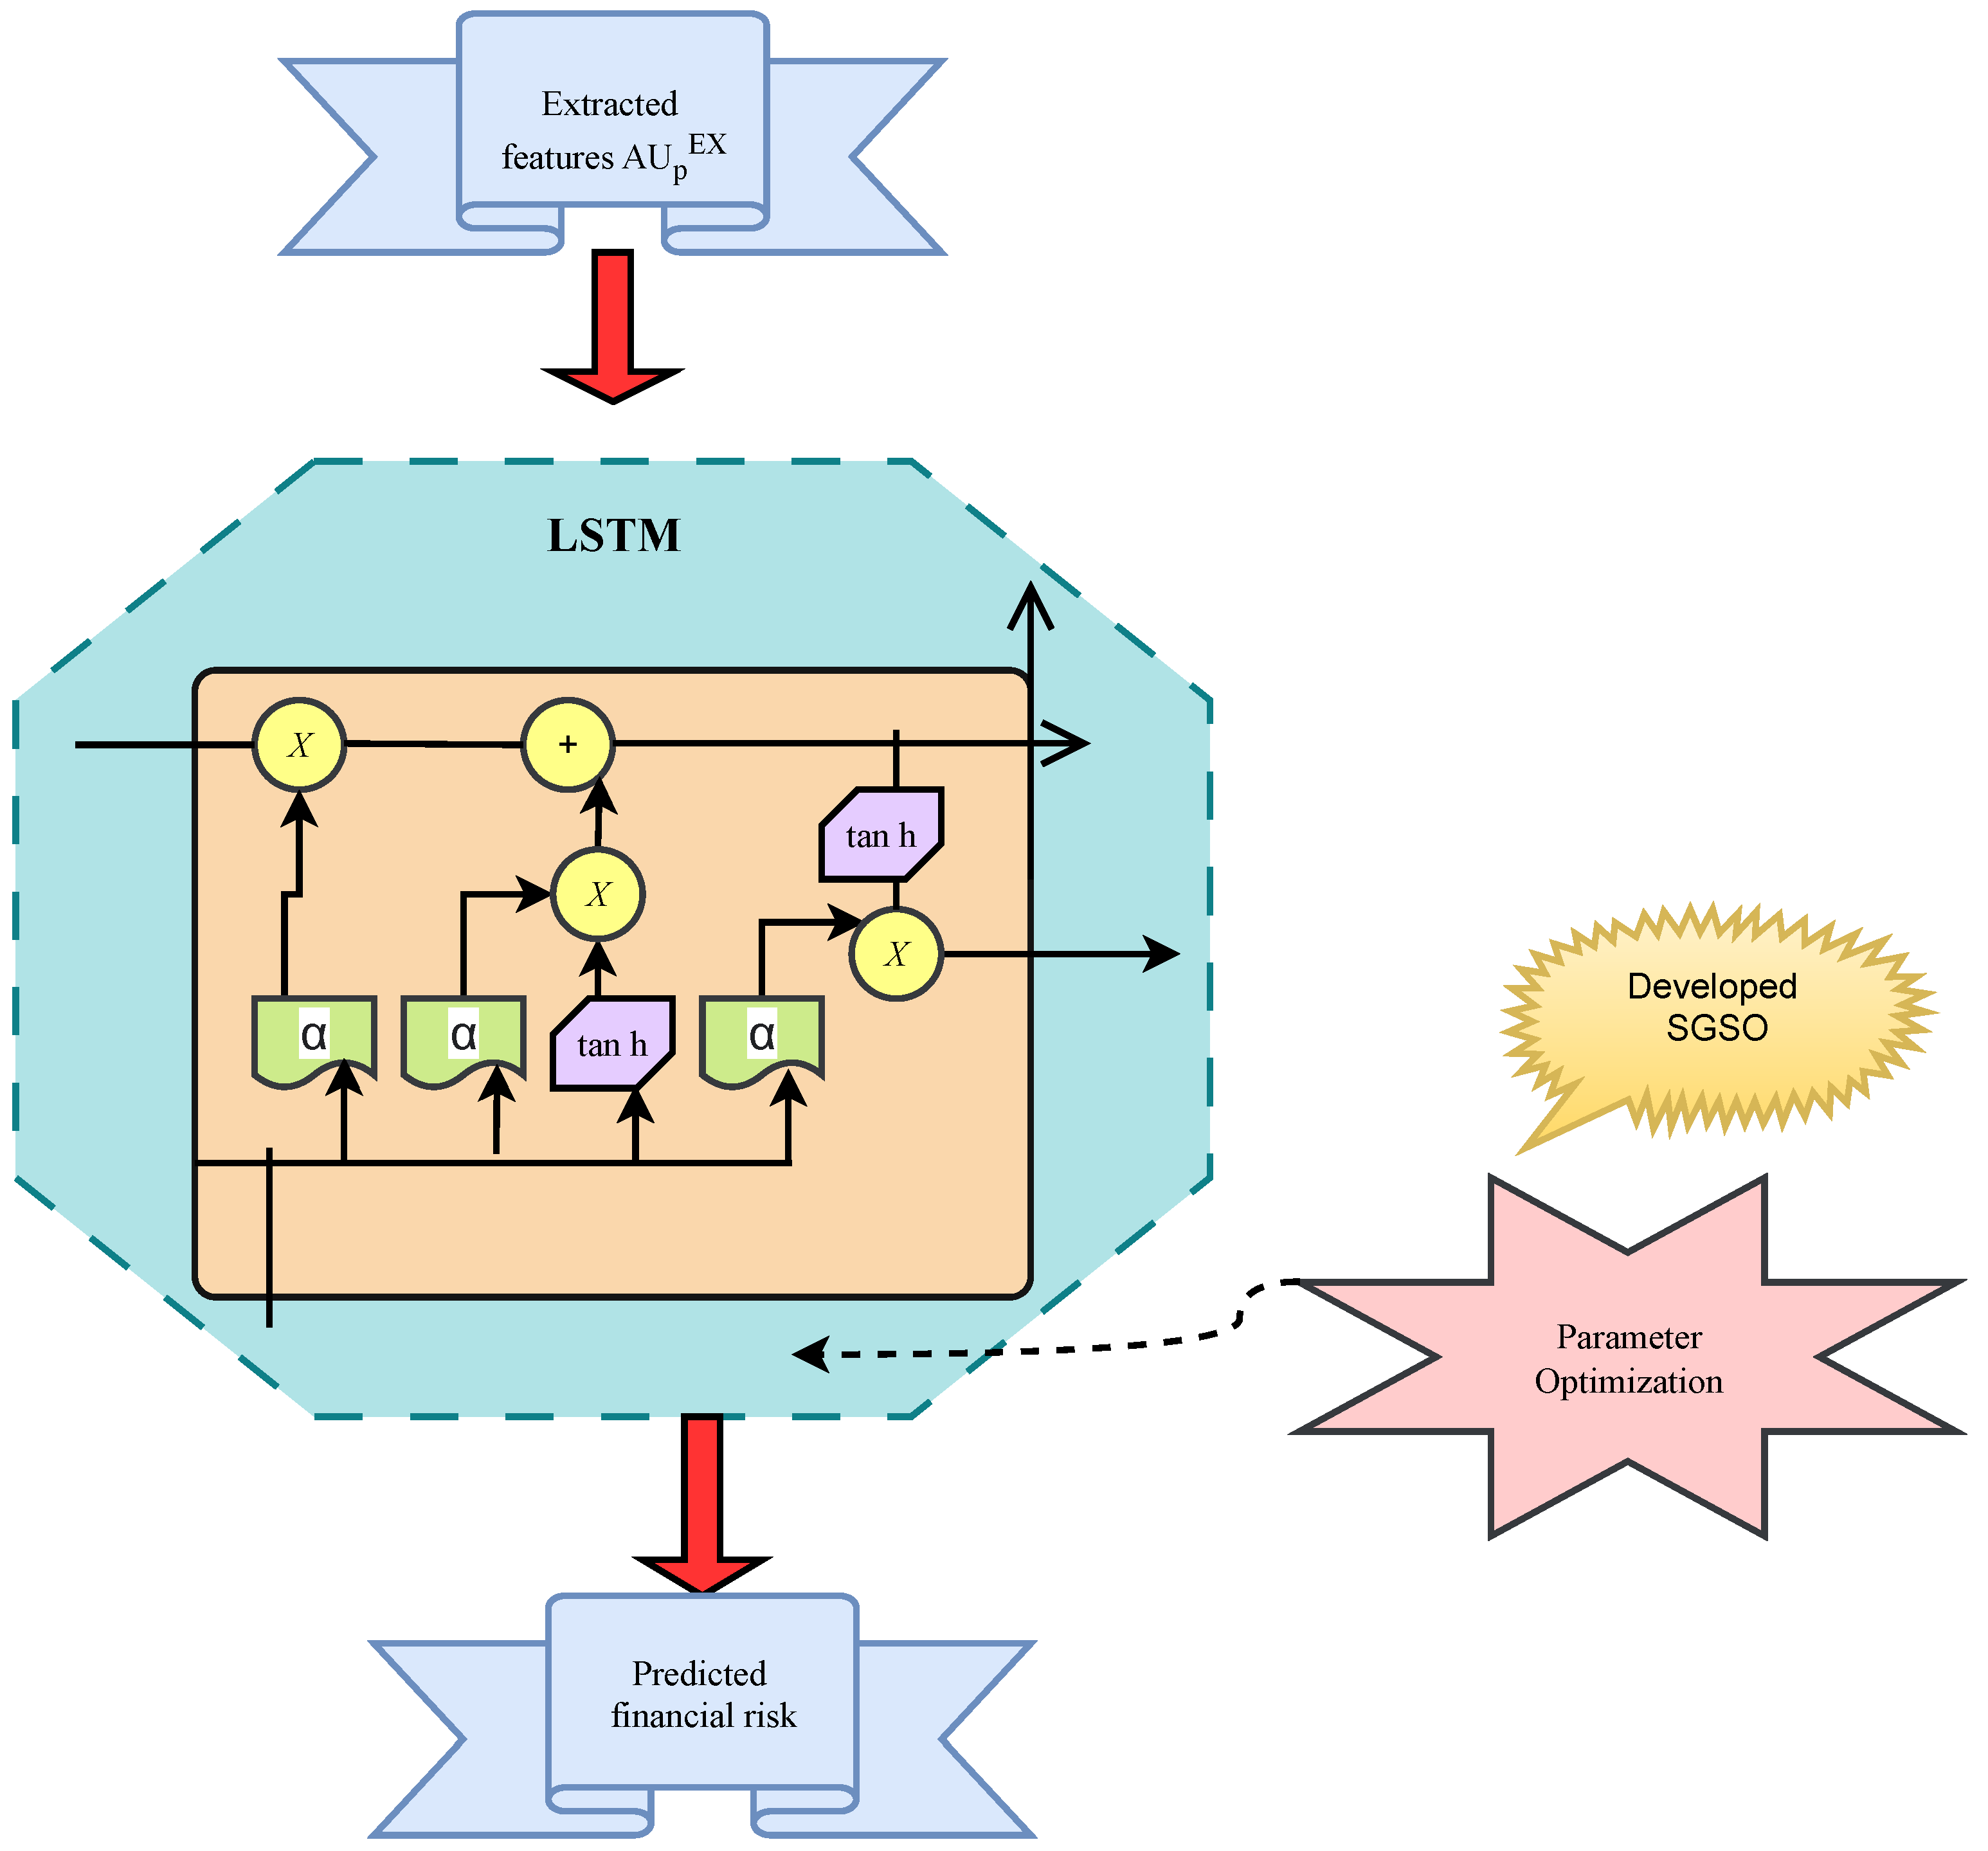
The deep features given to LSTM [26] are represented by AU p EX . Variants are developed by the internal activities of the LSTM cell. Data operations can be forgotten by the LSTM. The core of the LSTM network is composed of a cell state and several gates. The cell state serves as a conduit for the transmission of important data during data processing. It is also said to be the memory of the network. The information that can be applied to a cell state is controlled by several neural networks that act as gates. Throughout training, the gates discover what knowledge they should remember and what they should forget. Three distinct gates of the LSTM cell control the information flow. The terms v and v − 1 represent the input and output times, respectively. The output and input times are calculated by Equation (4):
K v = η W z k y v + W h k h v u 1 + W e k e v 1 + d k
f v = η W z f y v + W h f g v 1 + W e f E v 1 + d k
e v = f v e v 1 + K v tanh W z e z v + W h e h v 1 + d e
Here, the weight of the LSTM is indicated by W, and the bias is denoted by d:
Q v = η W q z v + W h q h v 1 + W e q e v 1 + d q
The term tanh is an activation function, and the cell state is denoted by c. The output is represented by h v , and the vector of inputs z is estimated from Equation (8):
h t = o t tanh ( c t )
Therefore, the forget function is represented by f v . The basic LSTM model in supply chain management is shown in Figure 3.

5.4. MLP-Based Prediction

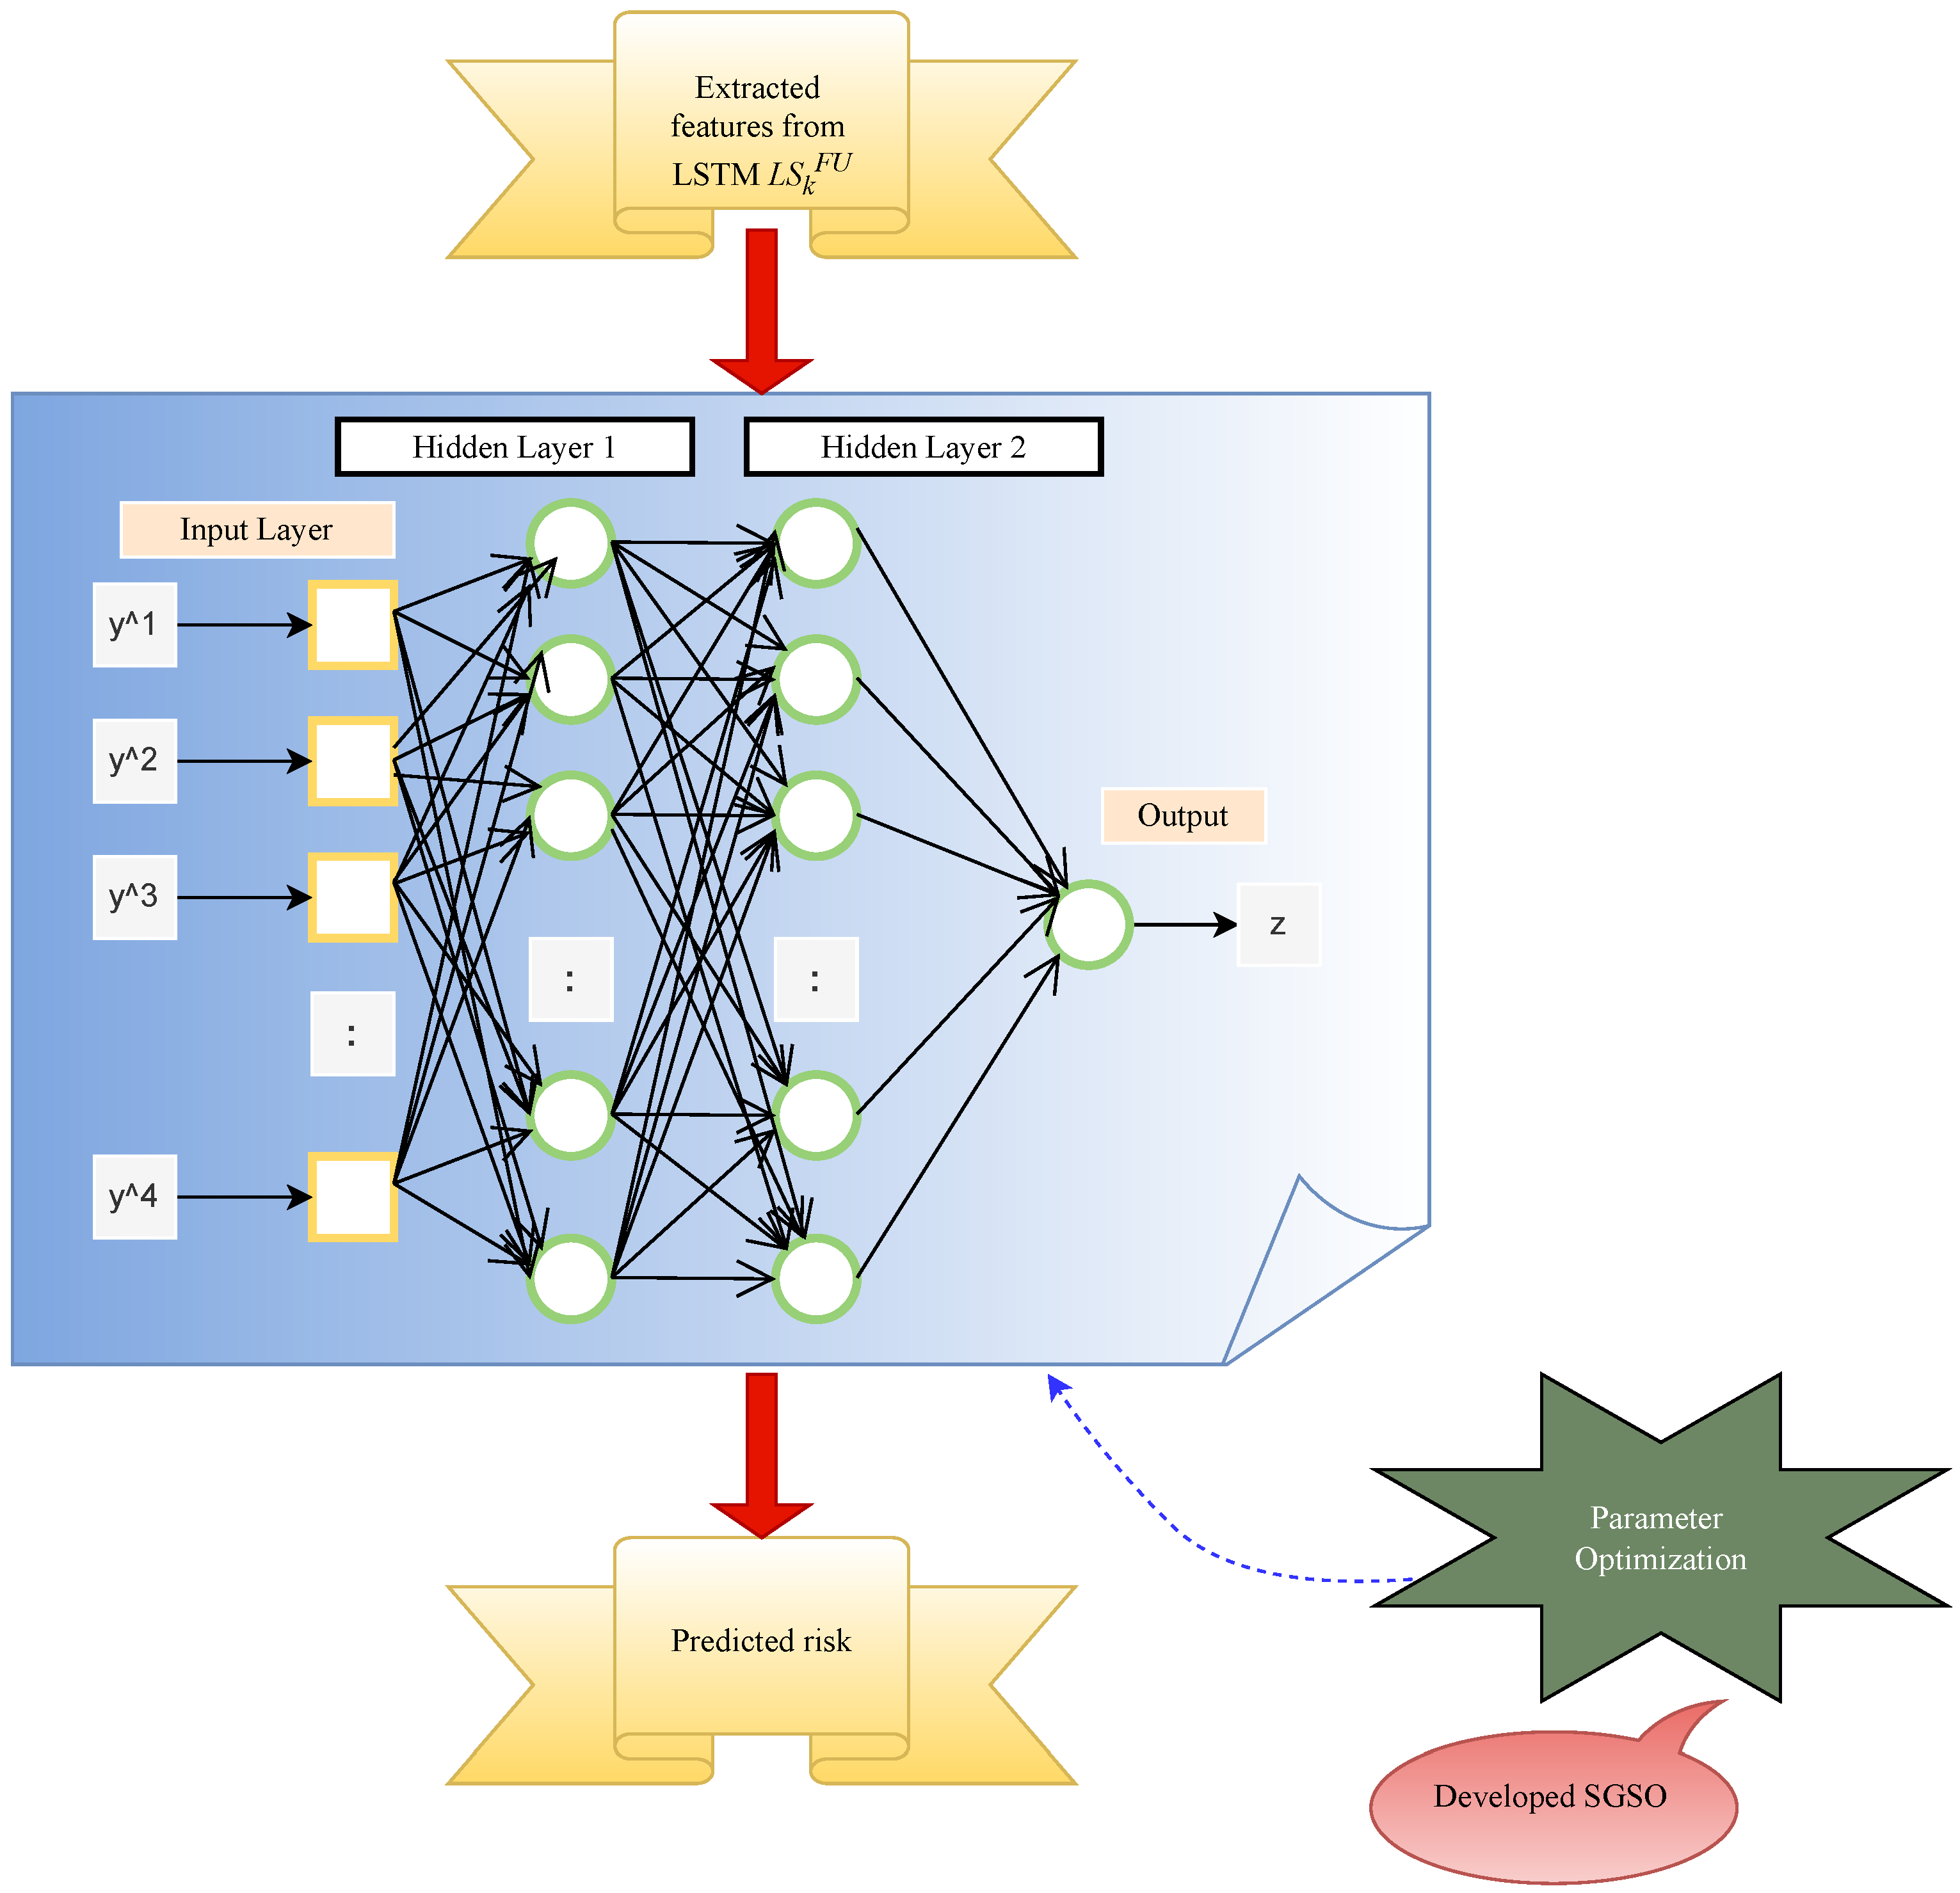
Currently, most deep learning methods use MLP [27] for financial risk prediction in supply chain management. Simple neurons, known as perceptrons, are the building blocks of the MLP network. The perceptron creates a linear combination based on the input weights. Also, they express the output through a nonlinear transfer function to create a single output from many real-valued inputs. This mathematical expression can be calculated using Equation (9):
b = g j 1 o v k y k + c
Here, the input vector is indicated by y k , and the bias is denoted by c. The transfer function is indicated by g. The logistic sigmoid function and transfer function are calculated using Equation (10):
g ( t ) = 1 ( 1 + f t )
The tangent sigmoid function transfers the functions using a variable t, and it is given in Equation (11):
g ( t ) = 2 ( 1 + f 2 t ) 1
Here, the output is denoted by b, and the term v k is a weight vector. A basic diagram of the MLP is shown in Figure 4.

6. Prediction of Financial Risk in Supply Chains Using ASCALSMLP

6.1. Proposed ASCALSMLP

In the ASCALSMLP, the MLP, LSTM, and autoencoder are connected serially to enhance the prediction effectiveness of the suggested financial risk prediction system. The output from one network is given as the input of another network. The major aim of the developed ASCALSMLP system is to increase the performance of financial risk prediction. The developed SGSO algorithm in the ASCALSMLP model is used to optimize the parameters that can help improve the accuracy. LSTM has a variety of ways to modify the size, and a greater filter size or dilation factors are both workable measures to enhance the availability and dependability. But, it has expanding and vanishing gradient issues. The MLP’s advantage is that it can learn nonlinear data and train models in real time. But, it introduces inefficiency and redundant results. The MLP is fully integrated and has too many parameters. The autoencoder method gives quick and effective results. It offers an effective approach to significantly reduce the noise in the input data. But, it possesses more complex and delicate parts. To avoid these issues, the ASCALSMLP-based financial risk prediction model is implemented to provide accurate prediction results of financial risk. In the autoencoder network and LSTM, the epochs and hidden neuron count are optimized by utilizing the newly investigated SGSO algorithm, where the hidden neurons are optimized in the interval of [5, 255] and the epochs are optimized in the interval of [50, 100]. The learning rate of MLP is optimized in the interval of [0.01, 0.99], and the hidden neuron count of the MLP is optimized in the interval of [5, 255]. The investigated ASCALSMLP-based financial risk prediction model uses a fitness function for maximized accuracy, which is given in Equation (12):
F i t = a r g m i n { M L k L e r n R , M L k H i d d e n , L S o e p o c h s , L S l H i d d e n , A U o e p o c h s , A U l H i d d e n } 1 A
The optimized learning rate and hidden neurons in the MLP are denoted by ML k LernR and ML k Hidden , respectively. The optimized hidden neurons and epochs in LSTM are indicated by LS o epochs and LS l hidden , respectively. The optimized epochs and hidden neurons in the autoencoder are denoted by AU o epochs and AU l hidden , respectively. The accuracy of the investigated financial risk prediction system for supply chain management is calculated using Equation (13):
A = Y K p + O C m Y K p + O C m + Y K u + O C o
In the accuracy analysis, the true positives are represented by YK p , and the true negatives are denoted by YK u . The false positives are indicated by OC m , and the false negatives are represented by OC o , respectively. The developed ASCALSMLP-related financial risk detection model is shown in Figure 5.

6.2. Adaptive Concept by SGSO Algorithm

The developed SGSO algorithm is adopted to improve the effectiveness of the deep learning-based financial risk prediction model in the supply chain management system by optimizing parameters in the serially cascaded network. The epochs and hidden neuron count in the autoencoder, epochs and hidden neuron count in LSTM, and the learning rate and hidden neuron count in the MLP are optimized using the implemented SGSO algorithm. The SOA algorithm effectively solves the high-dimensionality issue and also solves real-life problems. But, it needs more abundant data. The GSO algorithm performs multiple functions. Also, it gives more flexibility and freedom to arrive at a better solution. But, it does not strike a balance between the exploitation and exploration phases. So, it sometimes struggles to give optimal results. Therefore, the investigated SGSO algorithm is utilized in the supply chain model to predict financial risk. SGSO optimization is implemented based on fitness. Here, the random number is indicated by S 1 . In the conventional algorithm, the random number is chosen in the range of [−1, 1]. If s 1 ≥ 0.5, then the fitness is calculated via the GSO algorithm; otherwise, it is evaluated using the SOA algorithm. The implemented SGSO algorithm effectively optimizes the features from SGSO, hence the increased accuracy of the investigated deep learning-related financial risk prediction system in the supply chain management system.
SOA [28]: The goal of optimization is to minimize or maximize constraints. The constraints are inequality and equality. The minimized and maximized constraints are calculated using Equation (14):
G a = g 1 a
h q a 0
i q a = 0
Then, the lower and upper values are represented by m c q and v c q , respectively. This is expressed in Equation (17):
m c q a q v c q , q = 1 , 2 , , s
Here, the number of inequality constraints is denoted by q. The term r represents several equality constraints. One of the main tasks is to detect local solutions.
The algorithm examines a sandpiper flock that migrates from one location to another. The new position is indicated by D B , and it is calculated using Equation (18):
D t q = D B × Q t q ( a )
Here, the term Q t q ( a ) is a search agent’s progress position. The movement is represented by D B , and it is measured using Equation (19):
D B = D s a × D s / MAX iter
Then, the iteration progress is denoted by a, and it is shown in Equation (20):
a = 0 , 1 , 2 , , MAX iter
Here, the term D g is the control frequency. The term N t q denotes the search agent’s locations, and the search agent’s best fitness is represented by Q c t q ( a ) :
N t q = D c Q c t q ( a ) Q t q ( a )
The random value is represented by D c , and it is measured using Equation (22):
D c = 0.5 × Q nd
The random number is chosen in the range of [0, 1]. Based on the best search agent, the sandpiper position is updated. The gap in the solution is indicated by E t q , and it is measured using Equation (23):
E t q = D t q + N t q
Sandpipers attack their prey using three-plane behavior, which is given by Equation (24):
y = Q ius × sin ( j )
y = Q ius × cos ( j )
y = Q ius × j
s = v × f l w
Here, the term Q t q ( a ) indicates the position of the search agent, and it is calculated using Equation (28):
Q t q ( a ) = E t q × y + z + a × Q c t q ( a )
Here, the spiral radius is indicated by Q. The variables are v and w, respectively.
GSO [29]: A galaxy of stars is compared to a subswarm in the GSO method, and a cluster of galaxies is compared to a superswarm. Galaxies serve as markers for galaxy clusters. Similar to this, each member of the superswarm reflects the individual subswarm’s best global solution. The swarm framework is calculated using Equation (29):
Y j I : j = 1 , 2 , , N
Y j ( j ) Y j : k = 1 , 2 , , O
Y j Y j = : j k
j = 1 N Y j = Y
Here, the swarm size is denoted by Y j . The particle position and velocity are indicated by W k ( j ) and q k ( j ) , respectively.
Here, the subswarm’s movement is indicated by Y ( j ) , and the galactic best is denoted by h. This best can be updated anytime, and one global best is indicated by ( h ( j ) ) . The updated positions are calculated using Equation (33). The velocity is measured using Equation (34).
W k ( j ) x 1 ( j ) + d 1 s 1 ( Q k ( j ) y k ( j ) ) + d 2 s 2 ( h ( j ) y k ( j ) )
y k ( j ) y k ( j ) + W k ( j )
Then, the weight is indicated by x 1 and it is calculated using Equation (35):
x 1 = 1 l M 1 + 1
Then, the current iteration number is denoted by l. The terms s 1 and s 2 are random values and calculated by Equation (36):
s j = V ( 1 , 1 )
The updated superswarm is measured using Equations (37) and (38):
Z ( j ) z : j = 1 , 2 , , N
z ( j ) = h ( j )
The term w ( j ) denotes the velocity, and the term z ( j ) indicates the updated position; they are calculated using Equation (39) and Equation (40), respectively:
w ( j ) x 2 w ( j ) + d 3 s 3 ( Q ( j ) y ( j ) ) + d 4 s 4 ( h z ( j ) )
z ( j ) z ( j ) + w ( j )
The advantage of GSO is the adoption of the best solution that the subswarms have already computed. The pseudocode of the implemented SGSO is described in Algorithm 1.
Algorithm 1: Investigated SGSO
1:
Set the parameters D B and D C
2:
Initialize the population Q q ( a )
3:
Update the parameter  S 1  with the adaptive concept
4:
for  j = 1 to M a x i t  do
5:
    for  i = 1 to N p o p  do
6:
        Calculate GSO by Equation (33)
7:
        if  S 1 0.5  then
8:
           Determine the position vector
9:
           Calculate the velocity by Equation (39)
10:
       else
11:
         Update the SOA
12:
         Calculate the search agent positions
13:
       end if
14:
       Determine the best optimal value
15:
   end for
16:
end for

7. Results and Discussion

7.1. Experimental Setup

The proposed deep learning-based financial risk prediction model in supply chain management was developed in the Python 3.12.2 environment. In the risk prediction model, a chromosomal length of 5 and a population size of 10 were considered to conduct the experiments. Then, the developed supply chain management system used 25 iterations to obtain the best fitness values. For the experimental validation of the SGSO-ASCALSMLP-based financial risk prediction model in the supply chain management system, several metrics were adopted, like accuracy, precision, specificity, F1-score, FNR, FPR, and FDR. For comparison, the Deer Hunting Optimization Algorithm (DHOA) [26], Owl Search Optimization (OSO) [27], GSO [28], and SOA [29] algorithms were considered. The developed supply chain management system was also compared to some other techniques, which were GRU [30], MLP [31], A E L S T M [24], and A E L S T M M L P [25].

7.2. Evaluation Measures

Below is an explanation of the effectiveness measures used to evaluate risk prediction by the supply chain management model.
(a) Fnr: It is possible to calculate the ratio of positive values to negative samples in the suggested system, which is given by Equation (41):
Fnr = Y K p O C t + O C m
(b) Npv: The supply chain management system’s negative observations are determined by Equation (42):
Npv = O C t O C t + Y K p
(c) Sensitivity: Sensitivity is a measure of the ability to distinguish real observations for each accessible value and is given by Equation (43):
S = O C m O C m + Y K u
(d) Fpr: The Fpr value is the proportion of false positive outcomes to all negative observations, as given by Equation (44):
F P R = O C t O C t + Y K u
(e) F1-score: This value is used to calculate the average of precision and recall and is given by Equation (45):
F 1 = 2 × O C m 2 O C m + Y K u + Y K p
(f) MCC: The MCC is a binary classification rate, which is generated by Equation (46):
M = Y K p × Y K u O C m × O C t ( Y K p + N S n ) ( Y K p + O C t ) ( Y K u + O C m ) ( Y K u + O C t )
(g) Precision: Precision calculates the sample observation’s positive values in the supply chain management system and is given in Equation (47):
P I = Y K u Y K p + O C m
(h) FDR: The FDR is measured as the ratio of false positives to all positive observations using Equation (48):
R = O C t O C t + Y K p
(i) Specificity: Specificity is calculated from the negative samples in the supply chain management model, and it is given by Equation (49):
S C = Y K u Y K u + O C m

7.3. Performance Analysis of Different Heuristic Algorithms and Techniques

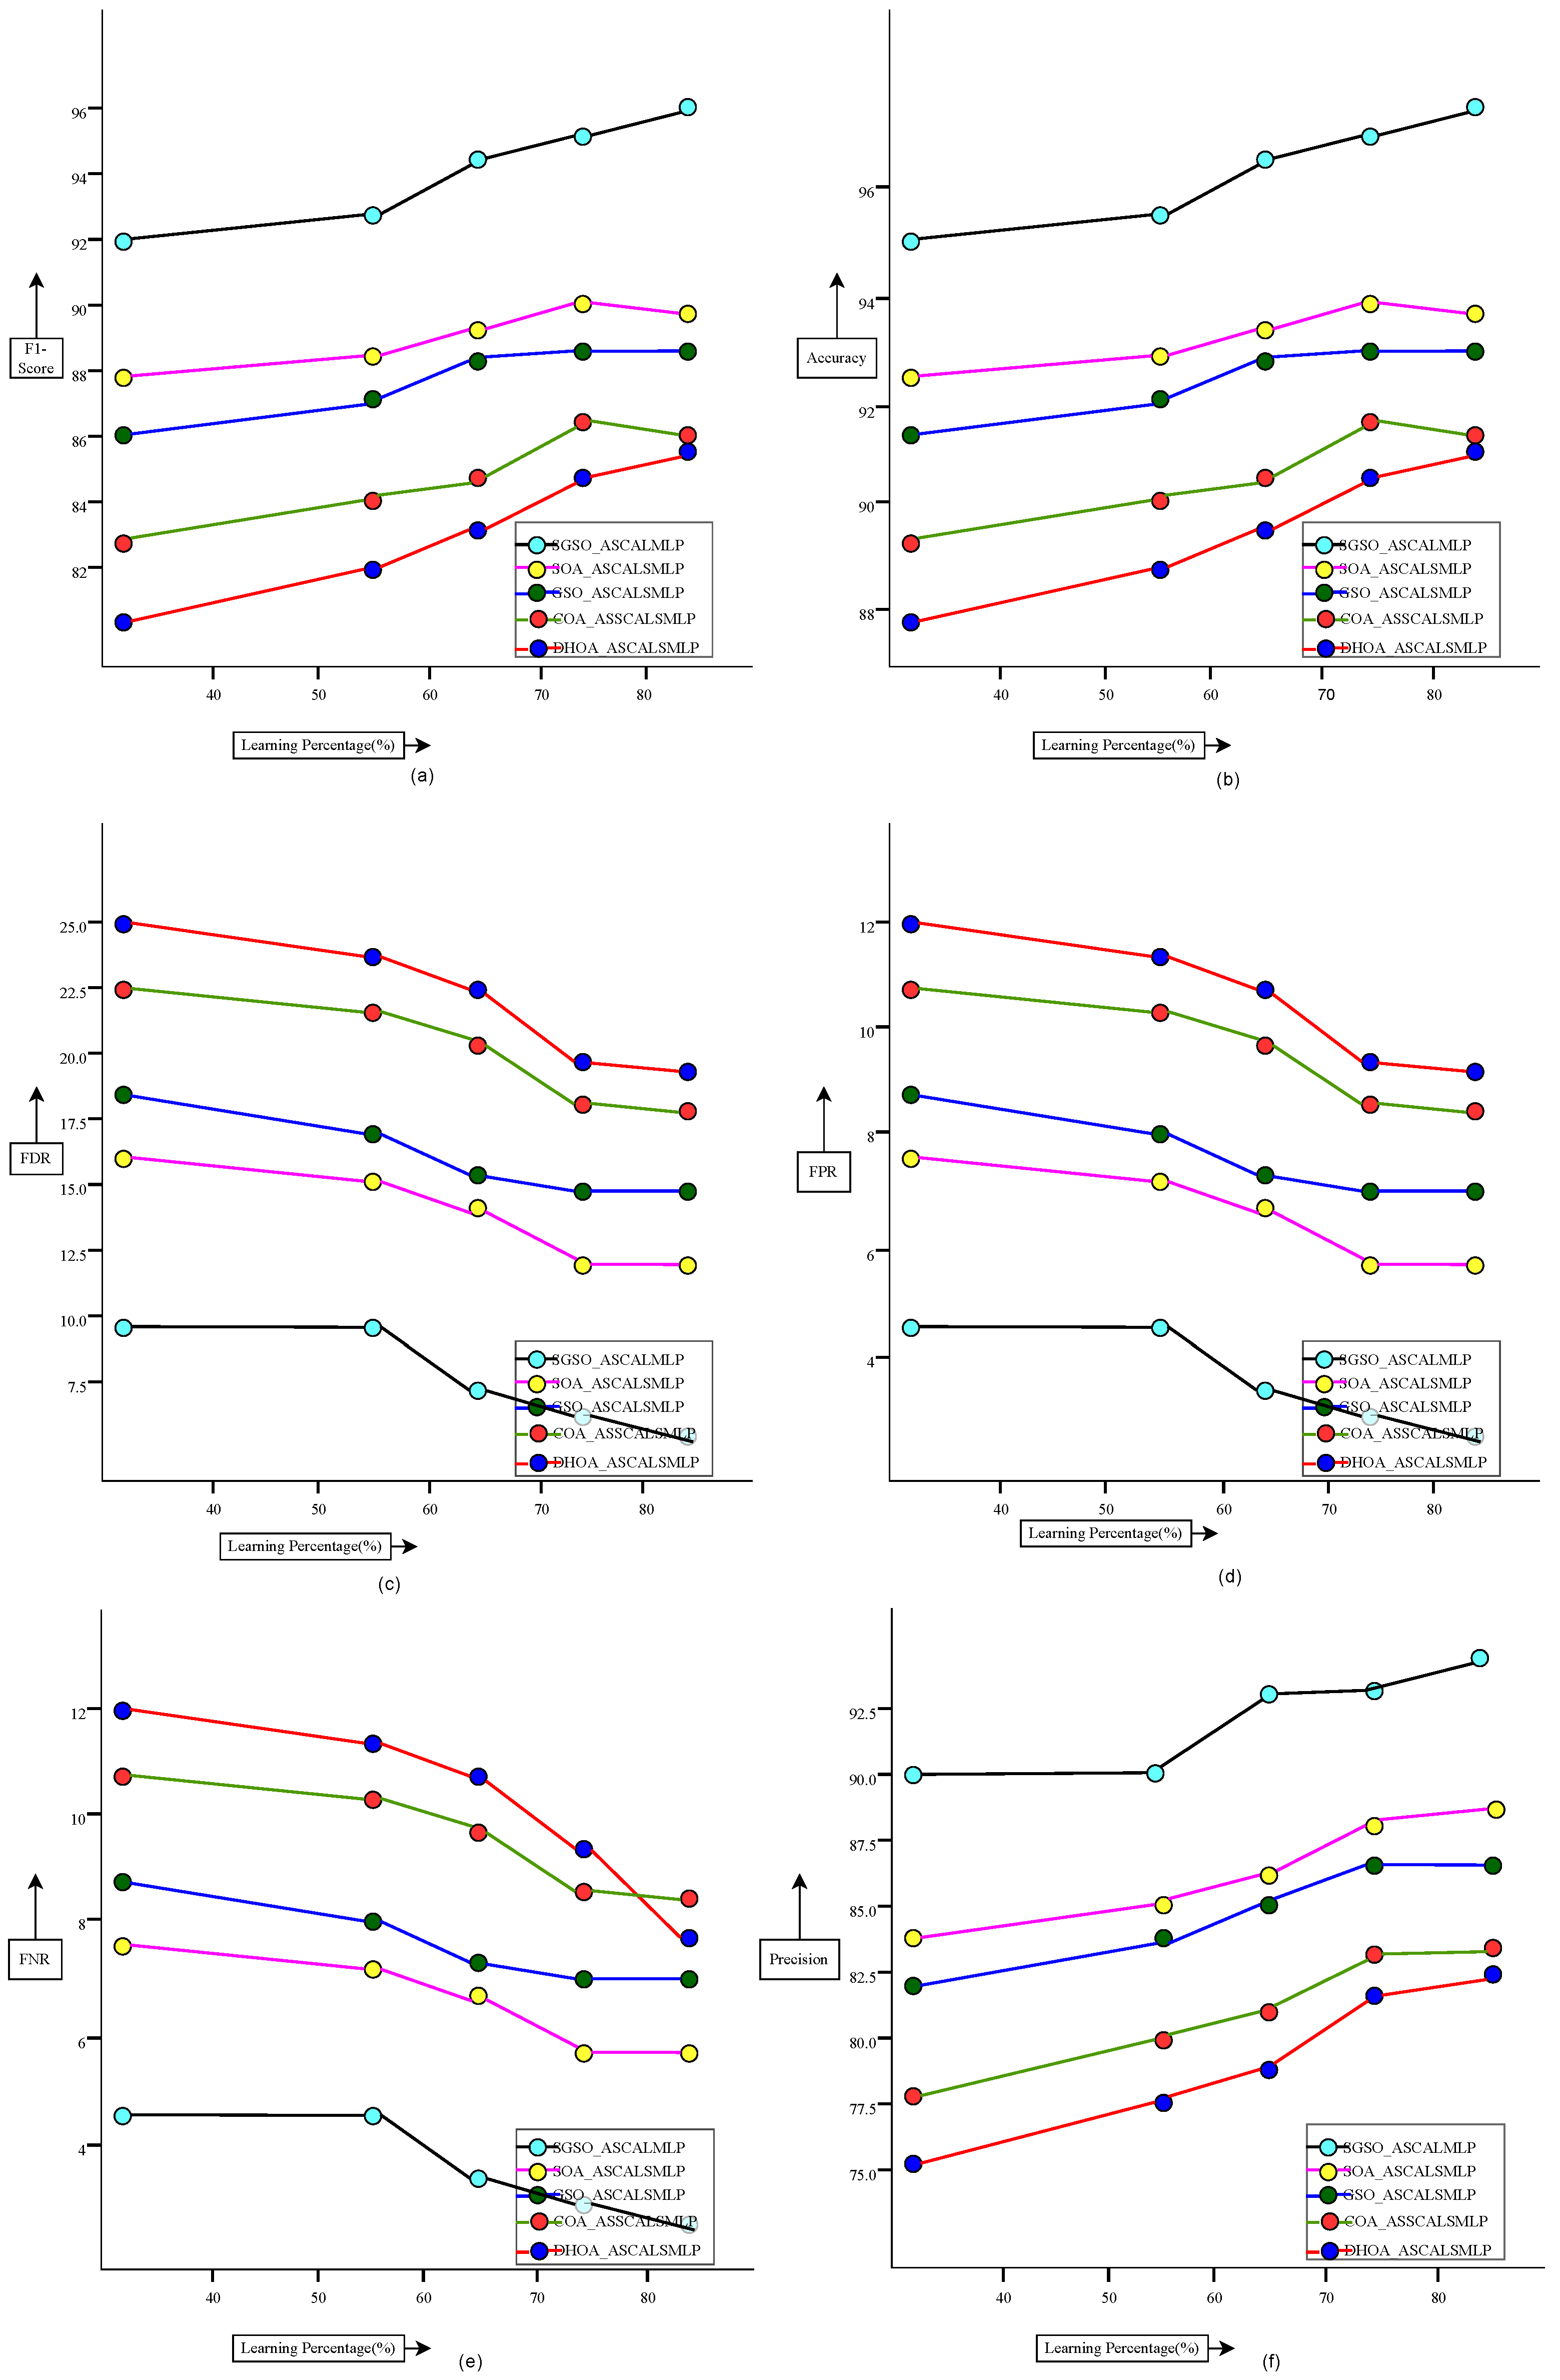
Below, Figure 6 and Figure 7 display the effectiveness analysis of other techniques and heuristic algorithms compared to the newly developed supply chain management system. The effectiveness analysis of the proposed SGSO-ASCALSMLP-based financial risk prediction model in the supply chain management system showed an F1-score that was 8.66% greater than GRU, 7.22% greater than MLP, 5.92% greater than AE-LSTM, and 5.45% greater than AE-LSTM-MLP, with a learning percentage of 55. As a result, compared to conventional algorithms, the suggested SGSO-ASCALSMLP-based financial risk prediction model in the supply chain management system provides high prediction rates.

7.4. K-Fold Evaluation of Various Heuristic Algorithms and Methods

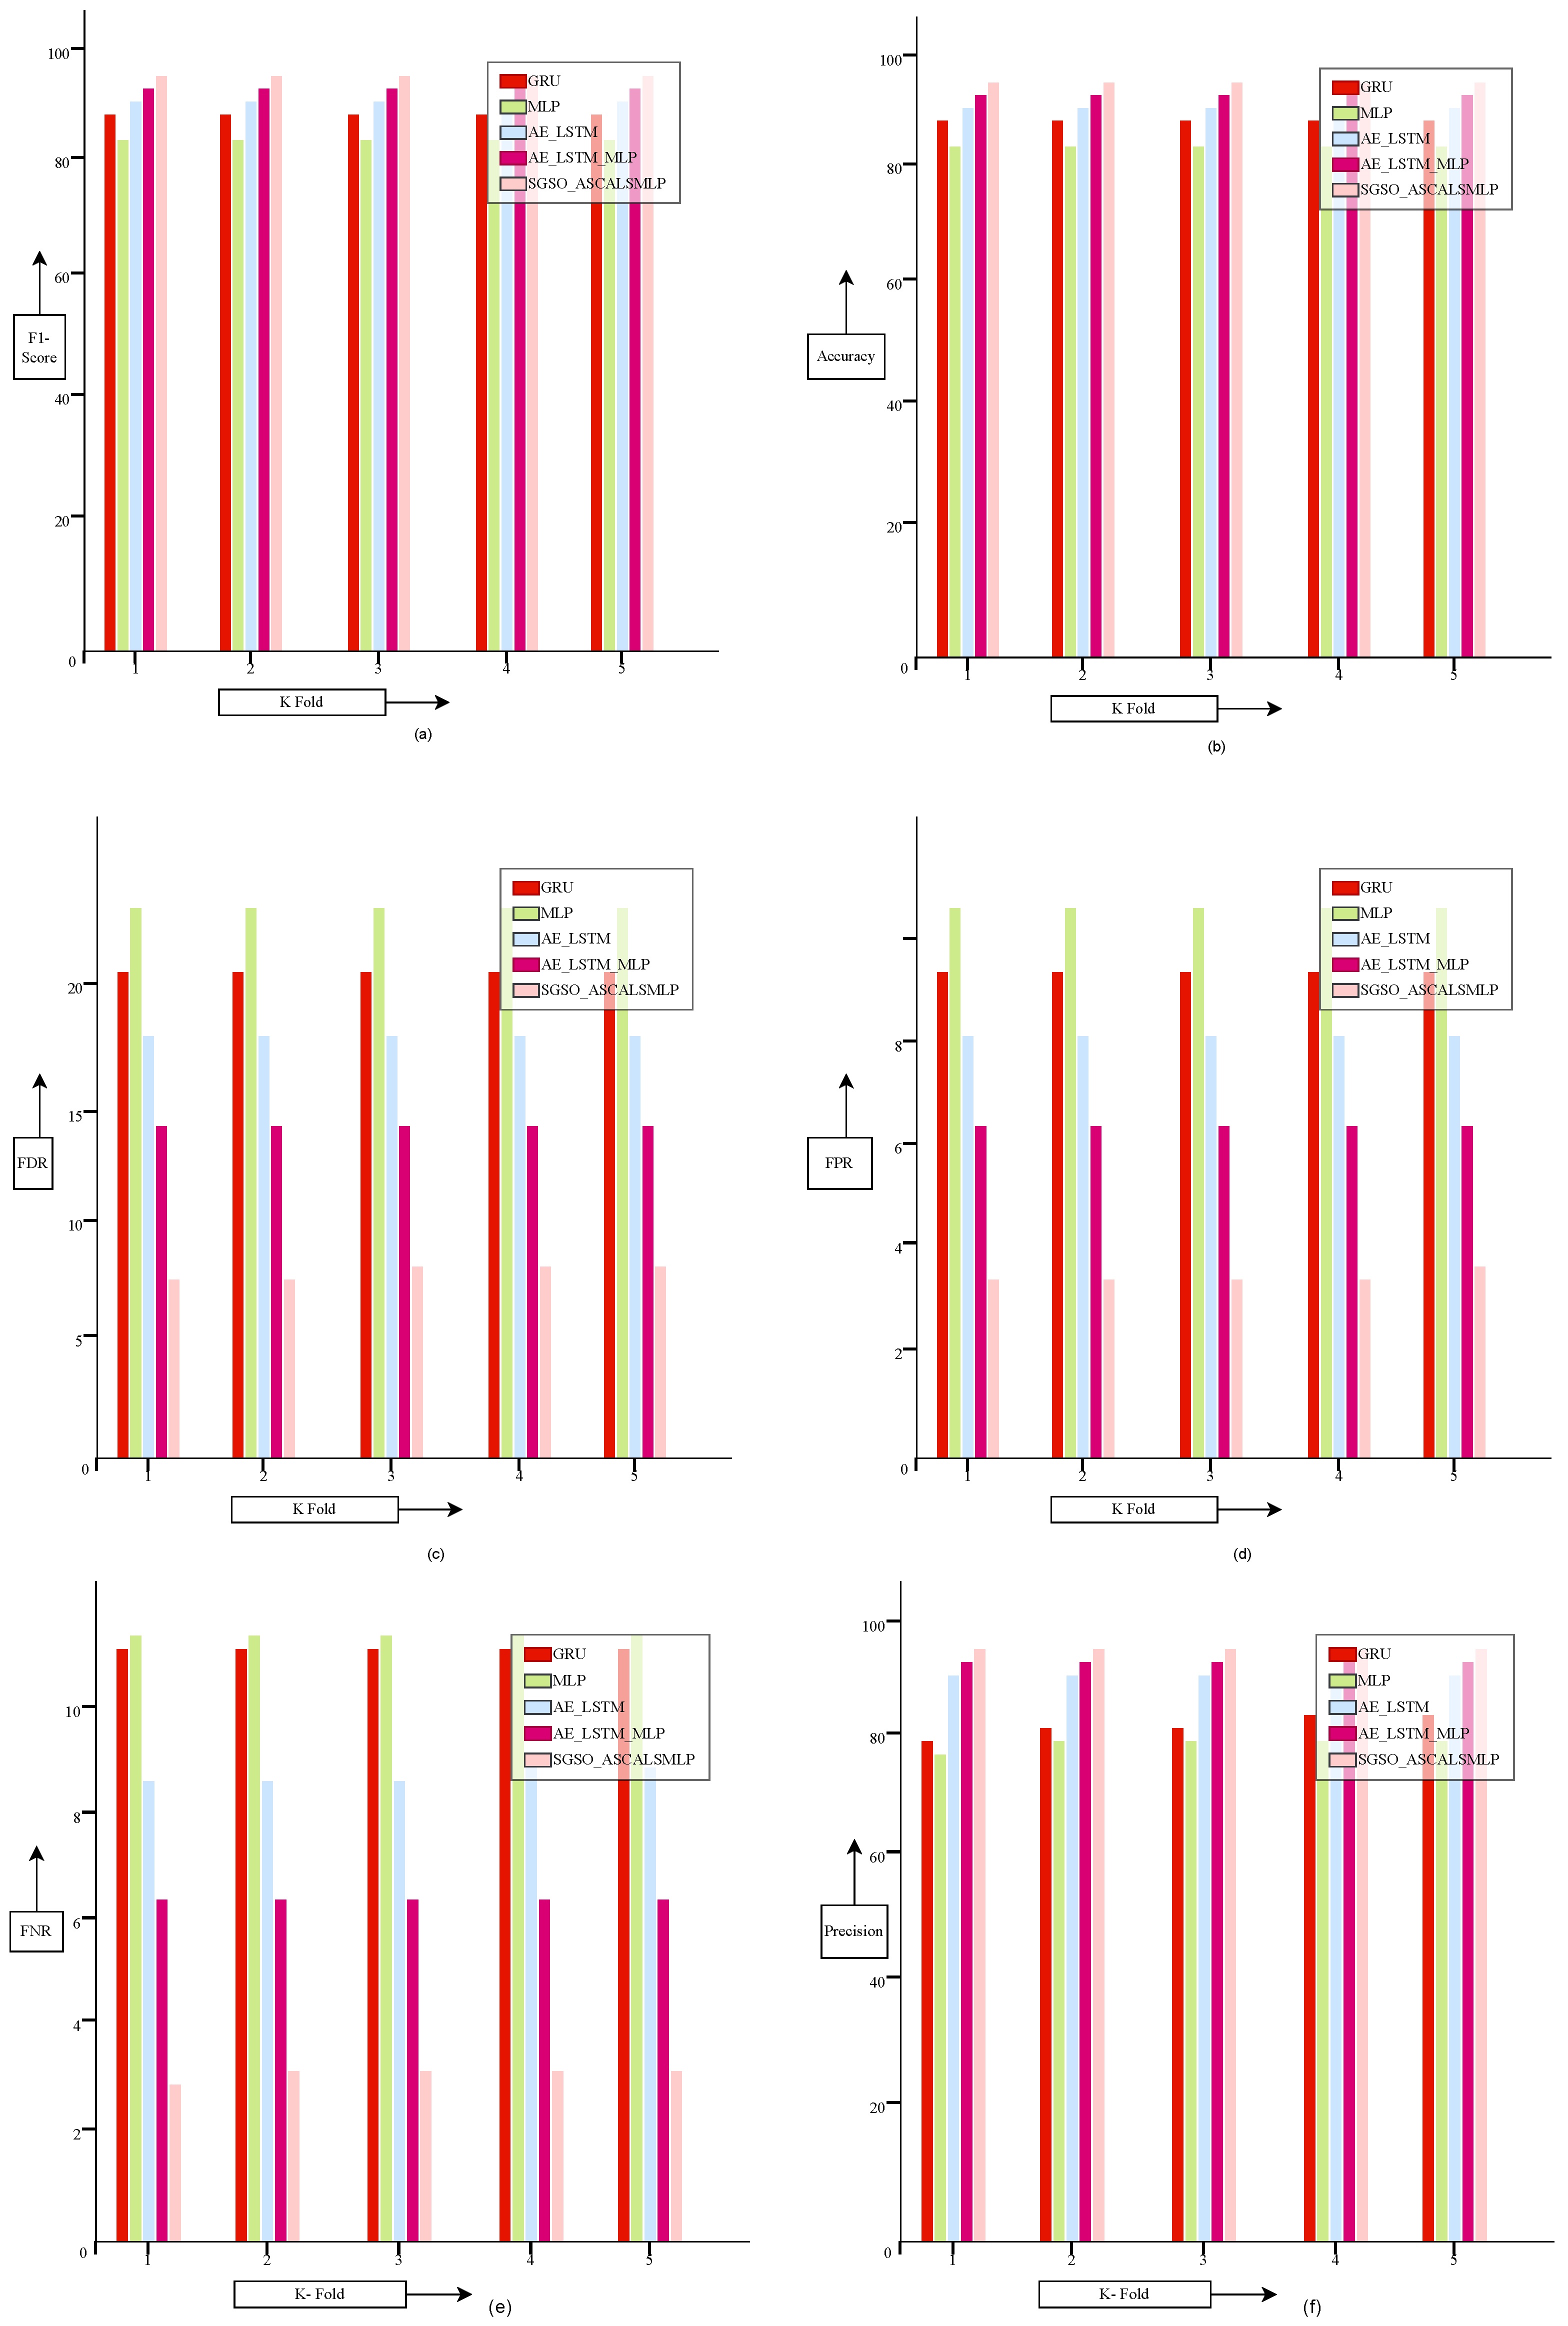
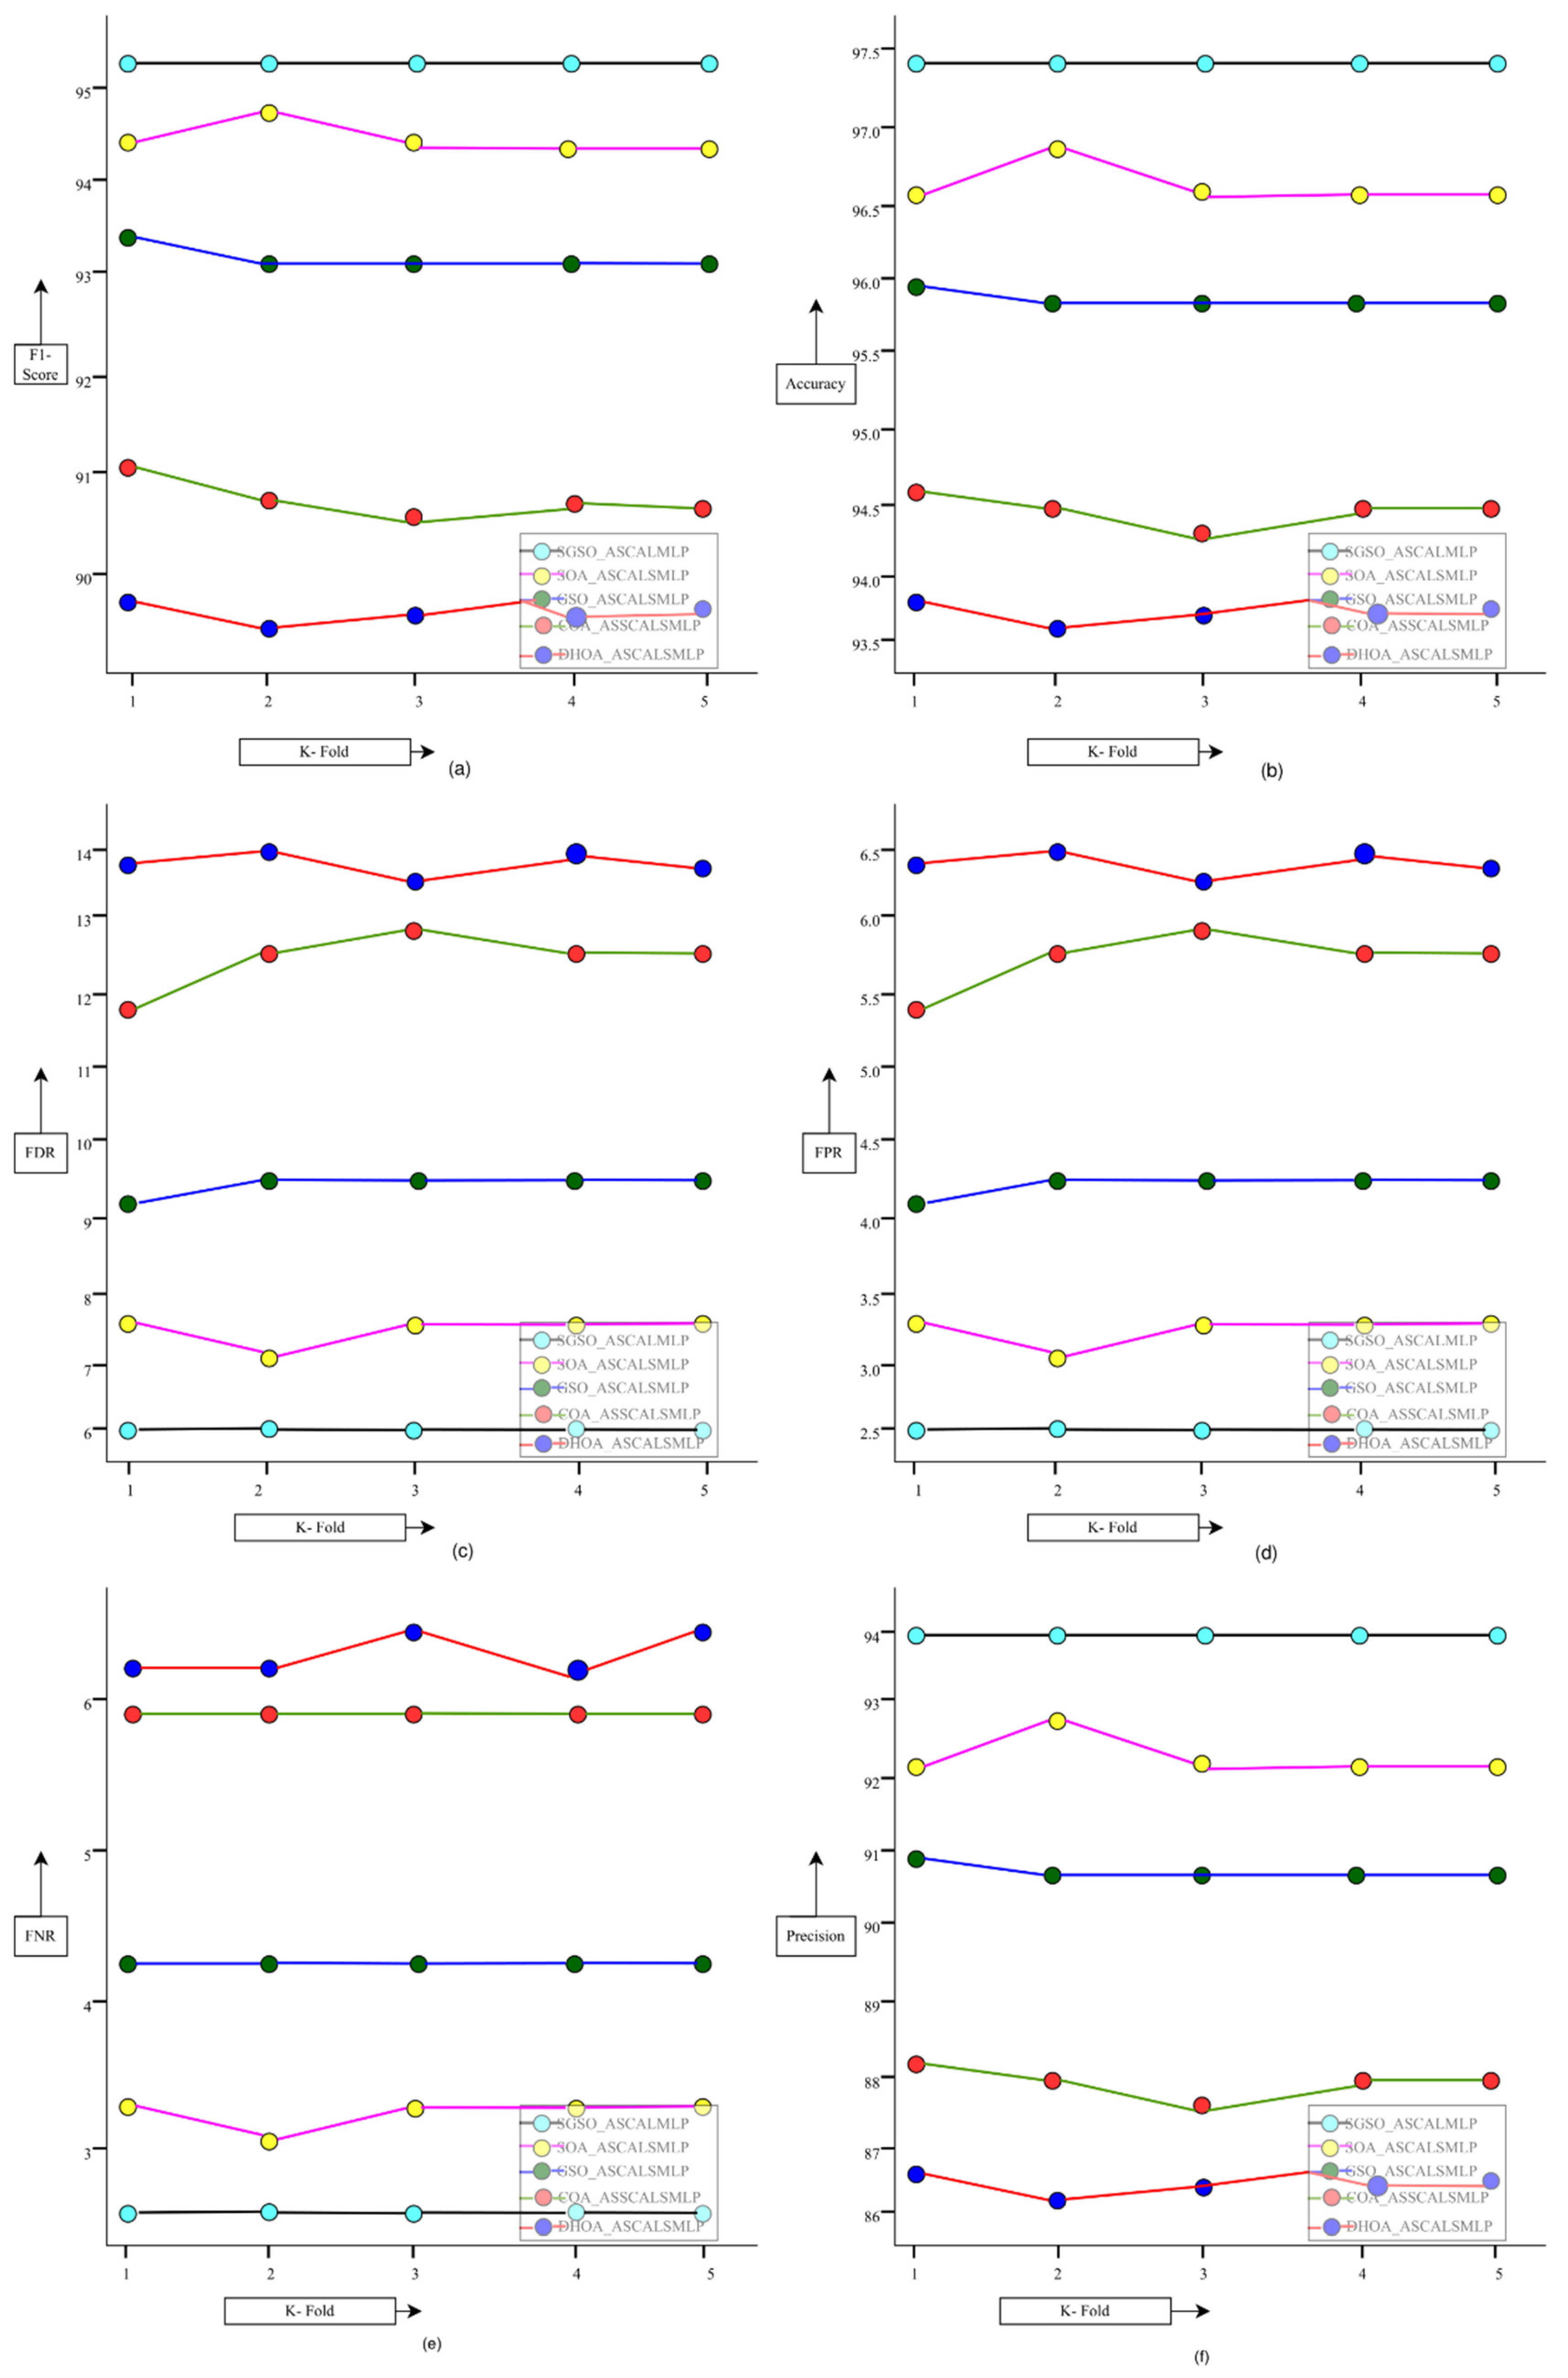
The k-fold validation of the proposed deep learning-based financial risk prediction system for supply chain management was performed, and the results were compared with those of different existing approaches and heuristic algorithms for risk identification, which are shown in Figure 8 and Figure 9, respectively. The performance validation of the suggested SGSO-ASCALSMLP-based supply chain management system showed high performance in terms of F1-score, which was 11.1% higher than that of GRU, 11.2% higher than that of MLP, 7.22% higher than that of AE-LSTM, and 5.20% higher than that of AE-LSTM-MLP, with a K-fold value of 2. Therefore, the proposed SGSO-ASCALSMLP-based financial risk prediction system for supply chain management had greater efficacy than the other approaches.

7.5. Overall Analysis of the Proposed Deep Learning-Based Supply Chain Management Model

To evaluate the newly proposed SGSO-ASCALSMLP-based financial risk prediction model in the context of supply chain management (SCM) systems, various heuristic algorithms and techniques have been applied, with a focus on performance benchmarking against existing models. The results of this performance analysis, specifically when comparing the SGSO-ASCALSMLP with other models, demonstrate its significant advantages in several key performance metrics, particularly in accuracy and F1-score, which are crucial for predicting financial risks in SCM. Performance Analysis of SGSO-ASCALSMLP-Based Financial Risk Prediction Model: The performance of the SGSO-ASCALSMLP model is evaluated in comparison with other risk prediction models, such as DHOA-ASCALSMLP, COA-ASCALSMLP, GSO-ASCALSMLP, and SOA-ASCALSMLP. These models represent a range of heuristic algorithms that have been integrated with ASCALSMLP (Adaptive Sine Cosine Algorithm-based Stochastic Cuckoo Algorithm Linear Summation Multi-Layer Perceptron) frameworks. The analysis reveals that the SGSO-ASCALSMLP model exhibits superior performance in terms of both accuracy and F1-score, which are critical for assessing the robustness and reliability of financial risk prediction in supply chain systems. Heuristic Algorithm Performance Comparison (Table 2): Table 2 highlights the effectiveness of different heuristic algorithms when integrated with the ASCALSMLP framework for financial risk prediction. The algorithms included in the comparison are (1) SGSO (Stochastic Glowworm Swarm Optimization), (2) DHOA (Dynamic Hawk Optimization Algorithm), (3) COA (Cuckoo Optimization Algorithm), (4) GSO (Glowworm Swarm Optimization), and (5) SOA (Sine Cosine Optimization Algorithm). Among these algorithms, SGSO outperforms the others in terms of providing a more accurate model for financial risk assessment in the supply chain. The SGSO-ASCALSMLP model demonstrates higher effectiveness in terms of identifying potential risks and minimizing false positives and negatives. Performance Improvement in F1-Score (Table 3): The F1-score is a key performance metric, combining both precision and recall to give a balanced measure of the model’s accuracy, especially in cases where class distributions are imbalanced. According to Table 3, the SGSO-ASCALSMLP model shows a consistent improvement in F1-score over other models, specifically, 4.05% higher than DHOA-ASCALSMLP, 5.67% higher than COA-ASCALSMLP, 7.95% higher than GSO-ASCALSMLP, and 10.5% higher than SOA-ASCALSMLP. This improvement in F1-score indicates that the SGSO-ASCALSMLP model is more capable of balancing precision and recall, making it a more reliable predictor of financial risks in supply chain scenarios, where the consequences of both false positives (predicting risk where none exists) and false negatives (failing to predict actual risk) can be substantial. Efficacy in Accuracy: The newly developed SGSO-ASCALSMLP-based financial risk prediction model also demonstrates superior accuracy when compared to its predecessors. Accuracy is crucial in financial risk prediction, as small errors can lead to significant financial losses or missed opportunities within the supply chain. The accuracy improvements demonstrated by SGSO-ASCALSMLP stem from the algorithm’s ability to optimize the weights and biases of the MLP (Multi-Layer Perceptron) more effectively than other algorithms, allowing for better generalization and improved prediction capability. This enhanced accuracy makes the SGSO-ASCALSMLP model more applicable to real-world financial risk prediction in supply chains, where large datasets and complex interactions between variables demand a robust, adaptive approach. The combination of the SGSO heuristic and the ASCALSMLP framework results in a model that is not only more efficient in identifying risks but also better at adapting to the dynamic and uncertain nature of financial data in supply chains.

8. Conclusions and Future Work

The newly investigated deep learning-based financial risk prediction model in the supply chain management framework was specifically adopted to predict financial risks with greater precision. To achieve this, the required financial data were gathered from online resources and subjected to a pre-processing stage. This pre-processing involved the transformation of the raw data through normalization, the removal of duplicates, and the replacement of missing values (NAN and NULL), ensuring that the dataset was clean and suitable for further analysis. Once transformed, the data were passed on to the financial risk prediction module, where the ASCALSMLP (Stacked Cascaded Autoencoder with LSTM and MLP) system was employed. This system integrates multiple deep learning techniques—LSTM (Long Short-Term Memory), autoencoder, and MLP (Multi-Layer Perceptron)—which were serially cascaded to enhance their predictive capabilities. In the prediction stage, the transformed data were initially processed using the autoencoder method, enabling the extraction of deep features. These features were then passed to the LSTM network, which is adept at handling sequential data, making it particularly suitable for time-series financial risk analysis. The final prediction of financial risk was achieved using both LSTM and MLP techniques, working in tandem to ensure effective prediction. To further improve accuracy, the proposed SGSO (Sparrow Search and Genetic Swarm Optimization) algorithm was incorporated. This hybrid optimization algorithm helped maximize the accuracy of the ASCALSMLP system by optimizing hyperparameters and model performance. As a result, the SGSO-ASCALSMLP-based financial risk prediction model for the supply chain management system achieved significantly higher performance compared to conventional risk prediction approaches. Specifically, it outperformed other models by achieving a greater F1-score, showing a 3.03% improvement over the GRU-ASCALSMLP model, a 7.22% improvement over the MLP-ASCALSMLP model, a 10.7% improvement over the AE-LSTM-ASCALSMLP model, and a 10.9% improvement over the AE-LSTM-MLP-ASCALSMLP model. This demonstrates the superior performance of the proposed model. In addition to improving prediction accuracy, the developed system also enhances the security of financial data in the supply chain. By employing robust deep learning techniques, the model reduces vulnerability to data breaches and ensures secure data handling throughout the prediction process. This added layer of security makes the system more reliable for real-world applications, where financial risk management is crucial.
There are a few potential limitations of our proposed framework: (1) Complexity of Model Integration: The integration of multiple advanced techniques, such as the Adaptive Serial Cascaded Autoencoder (ASCA), Long Short-Term Memory (LSTM), and Sandpiper Galactic Swarm Optimization (SGSO), may introduce complexity into the model, making it challenging to implement and maintain. (2) Data Dependency: The effectiveness of the SGSO-ASCALSMLP model relies heavily on the quality and quantity of big data available. Any inconsistencies, biases, or missing data during the data transformation process could affect the accuracy and reliability of the financial risk predictions. (3) Computational Resources: Given the sophisticated nature of the deep learning techniques involved, the model likely requires significant computational resources, which may not be feasible for all organizations, particularly smaller ones. (4) Generalization to Different Contexts: While the model has shown superior performance in the tested scenarios, its generalization to different industries, supply chain structures, or financial conditions may be limited. The model may need to be fine-tuned or adapted to different contexts. (5) Interpretability and Transparency: The use of advanced deep learning models can make it difficult to interpret the decision-making process, potentially reducing transparency. This might be a concern for stakeholders who require clear justification for financial risk predictions. (6) Lack of Benchmarking Against a Wider Range of Methods: Although the model outperforms several conventional techniques, it should be compared to a wider range of machine learning or statistical methods, which could offer insights into its relative strengths and weaknesses.
While the proposed SGSO-ASCALSMLP-based financial risk prediction model has demonstrated superior accuracy and performance compared to existing approaches, several areas for future research and enhancement remain. (1) Real-time Prediction: One area for future work is integrating real-time data streams into the risk prediction model. Incorporating dynamic, real-time data could further enhance the system’s predictive accuracy and responsiveness to sudden changes in the supply chain environment, such as unexpected disruptions or market fluctuations. (2) Scalability: Another direction for future work is scaling the system to handle larger and more complex datasets. As global supply chains generate vast amounts of financial data, ensuring that the system can efficiently process and analyze this information is critical. Employing distributed computing or cloud-based infrastructure could help improve the system’s scalability. (3) Cross-domain Adaptation: The model could be adapted and tested in different financial sectors or industries beyond supply chain management. This would involve cross-domain learning, where the model’s robustness is tested against different types of financial risk scenarios in industries such as banking, insurance, and healthcare. (4) Explainability and Interpretability: Deep learning models, while powerful, are often viewed as “black boxes”. Future work could focus on making the risk prediction process more interpretable by incorporating explainable AI (XAI) techniques. This would provide decision-makers with insights into why certain predictions are made, leading to more informed risk management strategies. (5) Incorporation of External Factors: The current model focuses primarily on internal financial data. Future iterations could consider the integration of external factors, such as geopolitical risks, environmental changes, or regulatory shifts, to further enhance the predictive power of the system. This would make the model more holistic and adaptive to real-world complexities. (6) Multi-objective Optimization: While the SGSO algorithm improves the model’s accuracy, there is room for further exploration of other multi-objective optimization techniques. These could optimize the trade-offs between prediction accuracy, computational efficiency, and model robustness, leading to a more balanced system. (7) Combination with Blockchain: Lastly, exploring the integration of blockchain technology could be an interesting avenue. Blockchain can enhance data transparency and security within the supply chain, potentially complementing the existing financial risk prediction model by ensuring the integrity and immutability of financial data.
In summary, while the proposed SGSO-ASCALSMLP model has demonstrated significant advancements in predicting financial risk within supply chain management, future research could further enhance its capabilities by focusing on real-time processing, scalability, cross-domain applications, model interpretability, and the incorporation of emerging technologies such as blockchain. These improvements would not only increase the system’s effectiveness but also broaden its applicability across various industries and risk scenarios.
Author Contributions

Conceptualization, A.D. and P.J.D.; methodology, A.D., P.J.D. and M.J.S.; software, A.D. and P.J.D.; validation, A.D. and M.J.S.; formal analysis, A.D. and P.J.D.; investigation, A.D. and M.J.S.; resources, A.D. and M.J.S.; data curation, A.D. and P.J.D.; writing—original draft preparation, A.D. and P.J.D.; writing—review and editing, M.J.S.; visualization, A.D. and P.J.D.; supervision, M.J.S.; project administration, A.D. and M.J.S. All authors have read and agreed to the published version of the manuscript.

Funding

This research received no external funding.

Institutional Review Board Statement

Not applicable.

Informed Consent Statement

Not applicable.

Data Availability Statement

The original data presented in the study are openly available at “https://www.kaggle.com/competitions/bankruptcy-risk-prediction/data”; Access Date: 1 October 2023.

Acknowledgments

The authors thank the Biomedical Sensors & Systems Lab, University of Memphis, Memphis, TN, 38152, USA, for supporting this research and the article processing charges. The authors gratefully acknowledge Riajul Hoque Choudhury for contributing to data analysis and providing computing resources.

Conflicts of Interest

The authors declare no conflicts of interest.

References

  1. Zhang, Q.; Li, F. Financial Resilience and Financial Reliability for Systemic Risk Assessment of Electricity Markets with High-Penetration Renewables. IEEE Trans. Power Syst. 2022, 37, 2312–2321. [Google Scholar] [CrossRef]
  2. Shahbazi, Z.; Byun, Y.-C. Machine Learning-Based Analysis of Cryptocurrency Market Financial Risk Management. IEEE Access 2022, 10, 37848–37856. [Google Scholar] [CrossRef]
  3. Zhou, H.; Sun, G.; Fu, S.; Liu, J.; Zhou, X.; Zhou, J. A Big Data Mining Approach of PSO-Based BP Neural Network for Financial Risk Management with IoT. IEEE Access 2019, 7, 154035–154043. [Google Scholar] [CrossRef]
  4. Chan, J.Y.; Milanović, J.V.; Delahunty, A. Risk-Based Assessment of Financial Losses Due to Voltage Sag. IEEE Trans. Power Deliv. 2011, 26, 492–500. [Google Scholar] [CrossRef]
  5. Lyu, X.; Zhao, J. Compressed Sensing and its Applications in Risk Assessment for Internet Supply Chain Finance under Big Data. IEEE Access 2019, 7, 53182–53187. [Google Scholar] [CrossRef]
  6. Maia, W.; Ekel, P.; Vieira, D.A.G.; de Castro, E.A.; de Oliveira, M.A.D.; Reis, I.M.; Dos Santos, K.M.G. Evaluation of Operational Risk in Power Substations and Its Rational Reduction on the Basis of Multicriteria Allocating Resources. IEEE Access 2021, 9, 149383–149397. [Google Scholar] [CrossRef]
  7. Wu, D.D.; Olson, D.L.; Luo, C. A Decision Support Approach for Accounts Receivable Risk Management. IEEE Trans. Syst. Man Cybern. Syst. 2014, 44, 1624–1632. [Google Scholar] [CrossRef]
  8. Diao, Y.; Lou, N.; Liang, S.; Zhang, Y.; Ning, Y.; Li, G.; Zhao, G. A Novel Environment-Adaptive Timed Up and Go Test System for Fall Risk Assessment with Wearable Inertial Sensors. IEEE Sens. J. 2021, 21, 18287–18297. [Google Scholar] [CrossRef]
  9. Assef, F.; Steiner, M.T.; Neto, P.J.S.; Franco, D.G.d.B. Classification Algorithms in Financial Application: Credit Risk Analysis on Legal Entities. IEEE Lat. Am. Trans. 2019, 17, 1733–1740. [Google Scholar] [CrossRef]
  10. Zhang, M.; Zhang, J.; Ma, R.; Chen, X. Quantifying Credit Risk of Supply Chain Finance: A Chinese Automobile Supply Chain Perspective. IEEE Access 2019, 7, 144264–144279. [Google Scholar] [CrossRef]
  11. Choi, T.-M. A System of Systems Approach for Global Supply Chain Management in the Big Data Era. IEEE Eng. Manag. 2018, 46, 91–97. [Google Scholar] [CrossRef]
  12. Tao, Q.; Gu, C.; Wang, Z.; Rocchio, J.; Hu, W.; Yu, X. Big Data Driven Agricultural Products Supply Chain Management: A Trustworthy Scheduling Optimization Approach. IEEE Access 2018, 6, 49990–50002. [Google Scholar] [CrossRef]
  13. Jiang, W. An Intelligent Supply Chain Information Collaboration Model Based on Internet of Things and Big Data. IEEE Access 2019, 7, 58324–58335. [Google Scholar] [CrossRef]
  14. Kaur, A.; Jain, S.; Goel, S. Sandpiper optimization algorithm: A novel approach for solving real-life engineering problems. Appl. Intell. 2020, 50, 582–619. [Google Scholar] [CrossRef]
  15. Cai, X.; Qian, Y.; Bai, Q.; Liu, W. Exploration on the financing risks of enterprise supply chain using Back Propagation neural network. J. Comput. Appl. Math. 2020, 367, 112457. [Google Scholar] [CrossRef]
  16. Bassiouni, M.M.; Chakrabortty, R.K.; Hussain, O.K.; Rahman, H.F. Humyun Fuad Rahman. Advanced deep learning approaches to predict supply chain risks under COVID-19 restrictions. Expert Syst. Appl. 2023, 211, 118604. [Google Scholar] [CrossRef]
  17. Feng, Q.; Chen, H.; Jiang, R. Analysis of early warning of corporate financial risk via deep learning artificial neural network. Microprocess. Microsyst. 2021, 87, 104387. [Google Scholar] [CrossRef]
  18. Zhang, H.; Shi, Y.; Yang, X.; Zhou, R. A firefly algorithm modified support vector machine for the credit risk assessment of supply chain finance. Res. Int. Bus. Financ. 2021, 58, 101482. [Google Scholar] [CrossRef]
  19. Yao, G.; Hu, X.; Wang, G. A novel ensemble feature selection method by integrating multiple ranking information combined with an SVM ensemble model for enterprise credit risk prediction in the supply chain. Expert Syst. Appl. 2022, 200, 117002. [Google Scholar] [CrossRef]
  20. Dang, C.; Wang, F.; Yang, Z.; Zhang, H.; Qian, Y. Evaluating and forecasting the risks of small to medium-sized enterprises in the supply chain finance market using blockchain technology and deep learning model. Oper. Manag. Res. 2022, 15, 662–675. [Google Scholar] [CrossRef]
  21. Ghazikhani, A.; Babaeian, I.; Gheibi, M.; Hajiaghaei-Keshteli, M.; Fathollahi-Fard, A.M. A Smart Post-Processing System for Forecasting the Climate Precipitation Based on Machine Learning Computations. Sustainability 2022, 14, 6624. [Google Scholar] [CrossRef]
  22. Mousapour Mamoudan, M.; Ostadi, A.; Pourkhodabakhsh, N.; Fathollahi-Fard, A.M.; Soleimani, F. Hybrid neural network-based metaheuristics for prediction of financial markets: A case study on global gold market. J. Comput. Des. Eng. 2023, 10, 1110–1125. [Google Scholar] [CrossRef]
  23. Zhan, C.; Zhang, X.; Yuan, J.; Chen, X.; Zhang, X.; Fathollahi-Fard, A.M.; Wang, C.; Wu, J.; Tian, G. A hybrid approach for low-carbon transportation system analysis: Integrating CRITIC-DEMATEL and deep learning features. Int. J. Environ. Sci. Technol. 2024, 21, 791–804. [Google Scholar] [CrossRef] [PubMed]
  24. Zhang, H.; Shi, Y.; Tong, J. Online supply chain financial risk assessment based on improved random forest. J. Data Inf. Manag. 2021, 3, 41–48. [Google Scholar] [CrossRef]
  25. Wu, Y.; Li, X.; Liu, Q.; Tong, G. The Analysis of Credit Risks in Agricultural Supply Chain Finance Assessment Model Based on Genetic Algorithm and Backpropagation Neural Network. Comput. Econ. 2022, 60, 1269–1292. [Google Scholar] [CrossRef]
  26. Liu, Y.; Zhao, C.; Huang, Y. A Combined Model for Multivariate Time Series Forecasting Based on MLP-Feedforward Attention-LSTM. IEEE Access 2022, 10, 88644–88654. [Google Scholar] [CrossRef]
  27. Muthiah-Nakarajan, V.; Noel, M.M. Galactic Swarm Optimization: A new global optimization metaheuristic inspired by galactic motion. Appl. Soft Comput. 2016, 38, 771–787. [Google Scholar] [CrossRef]
  28. Yuan, Z.; Wang, W.; Wang, H.; Ashourian, M. Parameter identification of PEMFC based on Convolutional neural network optimized by balanced deer hunting optimization algorithm. Energy Rep. 2020, 6, 1572–1580. [Google Scholar] [CrossRef]
  29. Martha, T.R.; Kerle, N.; van Westen, C.J.; Jetten, V.; Kumar, K.V. Segment Optimization and Data-Driven Thresholding for Knowledge- Based Landslide Detection by Object-Based Image Analysis. IEEE Trans. Geosci. Remote Sens. 2011, 49, 4928–4943. [Google Scholar] [CrossRef]
  30. Zeng, C.; Ma, C.; Wang, K.; Cui, Z. Parking Occupancy Prediction Method Based on Multi Factors and Stacked GRU-LSTM. IEEE Access 2022, 10, 47361–47370. [Google Scholar] [CrossRef]
  31. Cheng, Z.; Zhang, Y.; Tang, C. Solving Monocular Sensors Depth Prediction Using MLP-Based Architecture and Multi-Scale Inverse Attention. IEEE Sens. J. 2022, 22, 16178–16189. [Google Scholar] [CrossRef]
Figure 1. Supply chain network used in our study.
Logistics 08 00102 g001
Figure 2. Deep learning-based supply chain management model.
Logistics 08 00102 g002
Figure 3. A basic representation of LSTM in supply chain management.
Logistics 08 00102 g003
Figure 4. Basic representation of MLP model in supply chain management.
Logistics 08 00102 g004
Figure 5. Structural representation of suggested ASCALSMLP-based financial risk detection system.
Logistics 08 00102 g005
Figure 6. Performance evaluation of designed deep learning-related financial risk prediction model in supply chain management compared to various existing methods in regard to (a) F1-score, (b) accuracy, (c) FDR, (d) FPR, (e) FNR, (f) precision.
Logistics 08 00102 g006
Figure 7. Performance validation of investigated deep learning-related financial risk prediction system for supply chain management compared to various heuristic algorithms in regard to (a) F1-score, (b) accuracy, (c) FDR, (d) FPR, (e) FNR, (f) precision.
Logistics 08 00102 g007
Figure 8. K-fold evaluation of designed deep learning-related financial risk prediction model for supply chain management compared with various existing methods in regard to (a) F1-score, (b) accuracy, (c) FDR, (d) FPR, (e) FNR, (f) precision.
Logistics 08 00102 g008
Figure 9. K-fold evaluation of designed deep learning-related financial risk prediction model in supply chain management compared with various heuristic algorithms in regard to (a) F1-score, (b) accuracy, (c) FDR, (d) FPR, (e) FNR, (f) precision.
Logistics 08 00102 g009
Table 1. Features and challenges of existing financial risk evaluation frameworks in supply chain management.
Author [Citation]AI ModelFeaturesChallenges
Cai et al. [15]BPNNIt can handle multiple factors, nonlinearity, and uncertainty problems, which make it highly suitable for risk evaluation.It is affected by qualitative indicators together with the scorer quality and subjective consciousness when performing the scoring process.
Bassiouni et al. [16]EnsembleIt improves the accuracy of credit evaluation.
It effectively ranks explanatory variables according to their relative importance.
It shows a slight deviation due to the dependency of the training complexity of the network on the length of the input data sequence.
Feng et al. [17]BPNNIt ensures good references in order to support the effective decision systems of enterprises.It shows a slight deviation in assessment accuracy.
Zhang et al. [18]FA-SVMIt helps forecast satisfactory services along with the prices and enables fair supplier estimation.This model suffers from an inability to adapt to dynamic characteristics under continuous development and also does not address the variance occurring in the financial business under the supply chain.
Yao et al. [19]SBFS-RI and FSMRIIt is highly appropriate for providing better prediction accuracy with minimum errors.It does not apply to practical systems since it was not tested accordingly.
Dang et al. [20]Monetary inward theoryIt has the capability to identify the turning points when a fall or rise occurs in the market for a long time.It does not effectively analyze the quantitative data and index system related to particular business operations.
Zhang et al. [21]Improved stochastic forest algorithmIt attained comparatively better performance in estimating financial risks and has a social influence.It does not fuse capital and information flows to provide efficient results.
Wu et al. [22]GA-BPNNIt has a high ability to forecast shipments for exporting with better accuracy and considerable computational time.It is not capable of processing with a multidimensional index.
Table 2. Effectiveness evaluation of developed supply chain management model compared with several heuristic algorithms.
MeasuresDHOA-ASCALSMLPCOA-ASCALSMLPGSO-ASCALSMLPSOA-ASCALSMLPSGSO-ASCALSMLP
Accuracy (%)91.12592.593.7594.62597
Sensitivity (%)91.2133992.4686293.7238594.5606797.07113
Specificity (%)91.0873492.5133793.7611494.6524196.9697
Precision (%)81.3432884.0304286.4864988.2812593.17269
FPR (%)8.9126567.4866316.2388595.3475943.030303
FNR (%)8.7866117.5313816.2761515.4393312.92887
NPV (%)91.0873492.5133793.7611494.6524196.9697
FDR (%)18.6567215.9695813.5135111.718756.827309
F1-score (%)85.9960688.0478189.9598491.3131395.08197
MCC (%)0.7981070.8280230.8557860.8753660.929654
Table 3. Effectiveness evaluation of suggested supply chain management model with several prediction approaches.
MeasuresGRU-ASCALSMLPMLP-ASCALSMLPAE LSTM-ASCALSMLPAE LSTM-MLP-ASCALSMLPSGSO-ASCALSMLP
Accuracy (%)90.87591.12592.87595.2597
Sensitivity (%)90.7949890.3765792.8870394.9790897.07113
Specificity (%)90.9090991.4438592.8698895.3654296.9697
Precision (%)80.9701581.8181884.7328289.7233293.17269
FPR (%)9.0909098.556157.1301254.6345813.030303
FNR (%)9.2050219.6234317.1129715.0209212.92887
NPV (%)90.9090991.4438592.8698895.3654296.9697
FDR (%)19.0298518.1818215.2671810.276686.827309
F1-score (%)85.6015885.8846988.6227592.2764295.08197
MCC (%)0.792320.7964490.8363880.8892590.929654
Disclaimer/Publisher’s Note: The statements, opinions and data contained in all publications are solely those of the individual author(s) and contributor(s) and not of MDPI and/or the editor(s). MDPI and/or the editor(s) disclaim responsibility for any injury to people or property resulting from any ideas, methods, instructions or products referred to in the content.