Article

Multi-Objective Technology-Based Approach to Home Healthcare Routing Problem Considering Sustainability Aspects

by
Ahmed Adnan Zaid
1,*,
Ahmed R. Asaad
2,*,
Mohammed Othman
3,4,* and
Ahmad Haj Mohammad
5
1
Department of Logistic Management, Faculty of Business and Economics, Palestine Technical University-Kadoorie, Tulkarm, Palestine
2
Palestinian Broadcasting Corporation (PBC), Ramallah, Palestine
3
Department of Industrial and Mechanical Engineering, Faculty of Engineering and Information Technology, An-Najah National University, Nablus, Palestine
4
Department of Mechanical and Industrial Engineering, College of Engineering, Sultan Qaboos University, Muscat 123, Oman
5
Independent Researcher, Ajman, United Arab Emirates
*
Authors to whom correspondence should be addressed.
Logistics 2024, 8(3), 75; https://doi.org/10.3390/logistics8030075
Submission received: 20 May 2024 / Revised: 9 July 2024 / Accepted: 16 July 2024 / Published: 23 July 2024

Abstract

:
Background: This research aims to solve a home healthcare vehicle routing problem (HHCVRP) model that considers the social aspect of sustainability and will be implemented in smart cities. In addition to the dynamism and uncertainty caused by variations in the patient’s condition, the proposed model considers parameters and variables that enhance its practicability, such as assuming different levels of patient importance (priority). Methods: The model was solved using a metaheuristic algorithm approach via the Ant Colony Optimization algorithm and the Non-Dominated Sorting technique due to the ability of such a combination to work out with dynamic models with uncertainties and multi-objectives. Results: This study proposes a novel mathematical model by integrating body sensors on patients to keep updating their conditions and prioritizing critical conditions in service. The sensitivity analysis demonstrates that using a heart rate sensor improves service quality and patient satisfaction without affecting the energy consumed. In addition, quality costs are increased if the importance levels of patients increase. Conclusions: The suggested model can assist healthcare practitioners in tracking patients’ health conditions to improve the quality of service and manage workload effectively. A trade-off between patient satisfaction and service provider satisfaction should be maintained.

1. Introduction

The demand for Home Healthcare (HHC) services has evolved dramatically in recent years [1], mainly due to the increasing awareness of sustainability, the global aging society, the prevalence of chronic diseases, the high costs of traditional healthcare systems, and more recently, social distancing policies to curb the spread of the COVID-19 pandemic [2]. This growth in demand inspired HHC companies and researchers to provide patients with a comprehensive range of services delivered by a fleet of qualified personnel [3,4,5]. In addition, patients noted that it would be more convenient in terms of both money and effort to receive medical care at their homes rather than at hospitals and medical centers [6]. In a traditional HHC system, caregivers travel from a single or multi-depot, whether a pharmacy or HHC company, to provide the necessary medical services to different patients within predefined time windows before returning to their starting locations [4,6].
As the demand for HHC services increases, the necessity for adequate planning and scheduling of nurses’ activities becomes more critical; such plans involve matching the right caregivers to the right patients based on the required services and qualifications. Therefore, planning vehicle routing is critical for HHC companies. Enhancing profitability and the level of service can be achieved by cutting travel costs and meeting customer demands in a professional and timely fashion. Moreover, in addition to profitability, HHC companies have social and environmental responsibilities to address, since increased operational activities may lead to dangerous environmental and staff violations. According to Zhang et al. [7], transportation holds the largest share of environmental pollution among logistic and supply chain systems. Furthermore, to present a realistic home healthcare vehicle routing problem (HHCVRP) model, research goals must be matched with real-world needs, problems, and trends. Trends such as shifting toward a technology-based lifestyle, where technology assists in the execution of nearly all activities, must be addressed. According to Gandhi [8], healthcare solutions driven by body sensor technology are an interesting research topic, and further contributions in this field are recommended.
This study proposes a smart and sustainable HHCVRP (SSHHCVRP) model. The model considers the concept of smart mobility, one of the eight pillars of smart cities [9]. Smart cities utilize various technologies to enhance operational efficiency and citizens’ well-being across different applications, including vehicle routing in healthcare solutions [10]. In addition, sustainability in the HHC system should be considered based on the Triple Bottom Line (TBL) theory [11]. While economic and environmental aspects of TBL are frequently addressed in research, the social aspect is usually ignored [12]. This research contributes to the literature on the HHCVRP in two dimensions. First, a novel mathematical model is proposed, assuming that heart rate sensors are used to transmit real-time data to display patients’ medical status, and the collected data are used to update the routing path according to the patient’s health conditions. The second contribution is integrating different levels of patient importance (priority) to increase patients’ satisfaction levels and reduce the poor quality of service. It is recommended to prioritize service among patients in a sustainable home care process [1]. To the best of the authors’ knowledge, using Information and Communications Technology (ICT) and the Internet of Things (IoT) in the HHCVRP is a novel concept in the healthcare sector [13].
This paper is organized as follows: Section 2 discusses previous contributions to the literature. Section 3 shows the problem presentation, the developed mathematical model, and the research methodology. Furthermore, Section 4 discusses the obtained results. The conducted sensitivity analysis is shown and explained in Section 5. Section 6 presents managerial insights. Finally, Section 7 presents the conclusions and recommendations for future work.

2. Literature Review

Generally speaking, sustainability is defined as the set of practices that allow current generations to meet their needs without compromising the ability of future generations to meet their own necessities [14]. Such practices should sustain resources (economic and environmental) and human well-being rather than depleting and relying on them. The three pillars of sustainability are interrelated; mainly, the environmental and social dimensions’ impacts can be translated into economic costs indirectly, as shown in the results of Vega-Mejía et al. [15]. For instance, minimizing CO2 emissions reduces fuel consumption, and balancing workload among drivers will result in higher loyalty and productivity. Such practices are referred to as the Green VRP (GVRP). It is considered the branch of green logistics where different techniques and practices are considered in route planning so that green gas emission, travel time, vehicle speed, fuel consumption, and vehicle capacity are utilized to have minimum environmental impact [15,16].
On the other hand, the social dimension focuses on human well-being. It is often debated that social impacts result from economic and environmental factors; for example, air pollution caused by transportation and other industries poses a risk to health [17] despite the importance of social impact, since it deals with the most crucial resource (human beings). It is usually ignored and given less focus in the context of sustainability and supply chain research [18,19]. Despite the difficulty in measuring the social aspects, several attempts were found in the literature. Yang et al. [20] studied the VRP by introducing a multi-objective model that considers maximizing customer satisfaction as a social dimension. Given the complexity of the VRP, researchers often need to develop multi-objective optimization models and design specialized algorithms to solve these models [21].
Moreover, Wang et al. [22] investigated the impact of speed variations on travel safety. Therefore, minimizing the risk of accidents or maximizing travel safety could be considered a measure of sustainability’s social aspect. Workload equity in the VRP, where workload (in terms of time and travel distance) is distributed among drivers, was presented by Matl et al. [23]. On the other hand, Habibnejad-Ledari et al. [24] developed a multi-objective model to minimize operational costs, maximize customer satisfaction, and reduce the number of employees in each service. In their model, the social dimension was addressed twice: first, from the customer’s perspective by including constraints such as staff preferences, where the assignment of caregivers is based on patient preferences regarding service; second, from the employee’s perspective by considering maximum working hours and cross-training.

2.1. Home Healthcare Vehicle Routing

To a certain extent, the first work on the HHCVRP was introduced by Fernandez et al. [25], which considered the working days of community nurses to identify the ideal location for service-providing nurses. Various articles have addressed this problem with VRP variants [26,27,28]. Shi et al. [29] developed a robust optimization model that accounts for uncertainty in travel and service times. The authors noted a significant degree of uncertainty in the field of the HHCVRP, mainly concerning caregiver traveling time to reach patients and the time required to provide services. Likewise, Doulabi et al. [30] addressed the issue of uncertainty by studying the HHCVRP with stochastic travel and service times, along with synchronized visits and scheduling. Hiermann et al. [31] presented a multi-objective model considering customer and staff satisfaction. The authors included 13 objective functions divided into hard constraint violations (such as violation of nurse availability), soft constraint violations (such as the deviation from the start time window), and additional aspects, such as travel and work times, impacting the solution quality. On the other hand, in the context of smart mobility and the use of technology in vehicle routing, Erdem and Koç [3] proposed a novel approach that uses Electric Vehicles (EVs) in the HHCVRP. Using EVs reduces the impact of green emissions caused by fuel combustion and thereby preserves the environment; in addition, using the technology to produce electric engines rather than fuel combustion engines promotes smart mobility in the transportation sector of emerging smart cities.

2.2. Quality of Service in Vehicle Routing

Despite the importance of quality, a lack of VRP models that consider the quality of service has been noticed in the literature [32]. Most of these models tend to measure the quality of service by the difference between expected and actual time of service. A strict time interval, with defined start- and end-of-service periods, is used as a reference. Moreover, Yang et al. [33] discussed a dynamic VRP with time windows and multiple priorities, where the quality of service was measured by the difference between the arrival time and the upper bound of the service interval, which was the planned time to start the service. Similarly, Orlis et al. [34] measured the quality of service by studying the service level requirements, where customers will set a minimum acceptable level of service, and penalties will be incurred if not met by the service provider. Khorshidi and Hejazi [35] measured the quality of service using the well-known SERVQUAL model. The authors argued that obtaining data for the SERVQUAL model, which includes expected and perceived service levels, is not always feasible and does not provide continuous data. Therefore, internal measures specified by experts were used along with the SERVQUAL model to measure quality and maximize customer satisfaction. Finally, Ghannadpour and Zarrabi [36] developed a mathematical model that aims to maximize customer satisfaction by measuring any deviation from the desired time of service. Their VRP model considered customers with different levels of importance and service priorities. Important customers are serviced with strict time windows to ensure precision in service, whereas causal ones are served within soft, more flexible time windows. As a result, a value for the customer’s priority level and the deviation from the desired time of service are calculated for customers of different levels of importance. Indeed, adding time-related restrictions, such as waiting times, service duration, intervals between service calls, and service levels, along with service-level criteria restraints, can eventually standardize the service and improve its quality.

2.3. Smart Vehicle Routing

Smart mobility is one of the components of smart cities [9], which use technology and ICT to improve traffic, transportation, and all types of logistics for the preservation of the environment, a secure and safe transport system, and to make life easier and smarter for citizens [37]. Mamun et al. [38] introduced an algorithm that provides continuous real-time data regarding the status of waste bins. The authors argued that using such a network of sensors that instantly provides data will significantly reduce costs and harmful emissions. Hannan et al. [39] also studied the capacitated VRP in solid waste collection. They introduced a model that selects the optimal path to follow, as well as selecting which waste bin to visit and which one does not depend on the waste threshold level using ultrasonic and load sensors. Moreover, Ramos et al. [40] presented a smart waste collection model considering uncertainty regarding waste bin full levels. They suggested using volume sensors to provide real-time data about full levels to decide on bins to be visited and plan vehicle routing.
Furthermore, Ding et al. [41] introduced a review of smart logistics by exploring the employment of IoT technologies in logistics. They found a lack of a smart VRP in logistics. It was observed that the logistics, distribution, and waste management industries were the only ones using ICT and IoT solutions in the VRP. Moreover, dynamic routing (in the sense that the path of the vehicle changes while routing and serving customers or patients) due to provided real-time data from IoT technology had not been considered previously. On the other hand, Rout et al. [10] highlighted the advantages of integrating IoT technologies in emergency vehicle routing, such as reducing travel time and increasing casualty survival. According to Lai et al. [42], Body Sensor Networks (BSNs) are a division of Wireless Sensor Networks (WSNs), which, through the rapid development of technology, are employed in many sectors such as healthcare, sports, and social welfare. BSNs can be classified into two categories based on the signal type. The first category is sensors that measure the continuous signal supporting real-time data acquisition, such as Electrocardiography (ECG) and Electromyography (EMG). The second one is sensors measuring discrete time signals with low sampling frequency, such as temperature, blood oxygen, and glucose sensors [43].
Moreover, monitoring health status using sensors was classified as critical monitoring, such as monitoring patients with heart diseases, and non-critical tracking, such as monitoring the physical condition of athletes while exercising. Integrating BSNs with other healthcare applications improves service effectiveness and efficiency, making it more convenient for patients and doctors [43]. In the general architecture of BSNs, different body sensors with various functions and purposes are employed on the patient’s body, and then the data are collected and analyzed before being transmitted to a base station. Finally, the gathered data are shared over the internet to a predefined address [43]. Note that different transmission methods could deliver patient data to service providers.

3. Problem Presentation

Undoubtedly, patients may require low to medium medical service abilities on a regular basis. Such patients include the elderly, chronic disease patients, and those recovering from injuries or surgeries. The purpose of this study is to highlight technological integration and quality of service measurement in HHCVRPs. Regarding technology use, this paper presents a novel approach that uses heart rate sensors to identify patients with normal or critical conditions to minimize the gap between expectation and perception. In addition, this study minimizes travel time (which eventually minimizes fuel consumption) and the use of EVs. It also considers the minimization of deviation from the average workload, which yields better working conditions. The proposed model can be described as follows.
In a network of single depots, multi vehicles (caregivers), and a predefined number of nodes (patients), a caregiver drives a vehicle to serve a predetermined set of geographically separated patients. These patients could have two conditions, either normal or critical. The heart rate sensor provides continuous patient measurements and is used to determine if the patient’s condition is normal or critical and then transmits the data to the HHC service provider. The technology used for transferring data from patients using heart rate sensors is assumed to be transmitted by a third party; in other words, this model does not take into account the technical aspects of data transmission. Such technologies may include cellular (3G, 4G, and 5G in some regions), Fiber Optics, and Internet Clouding.
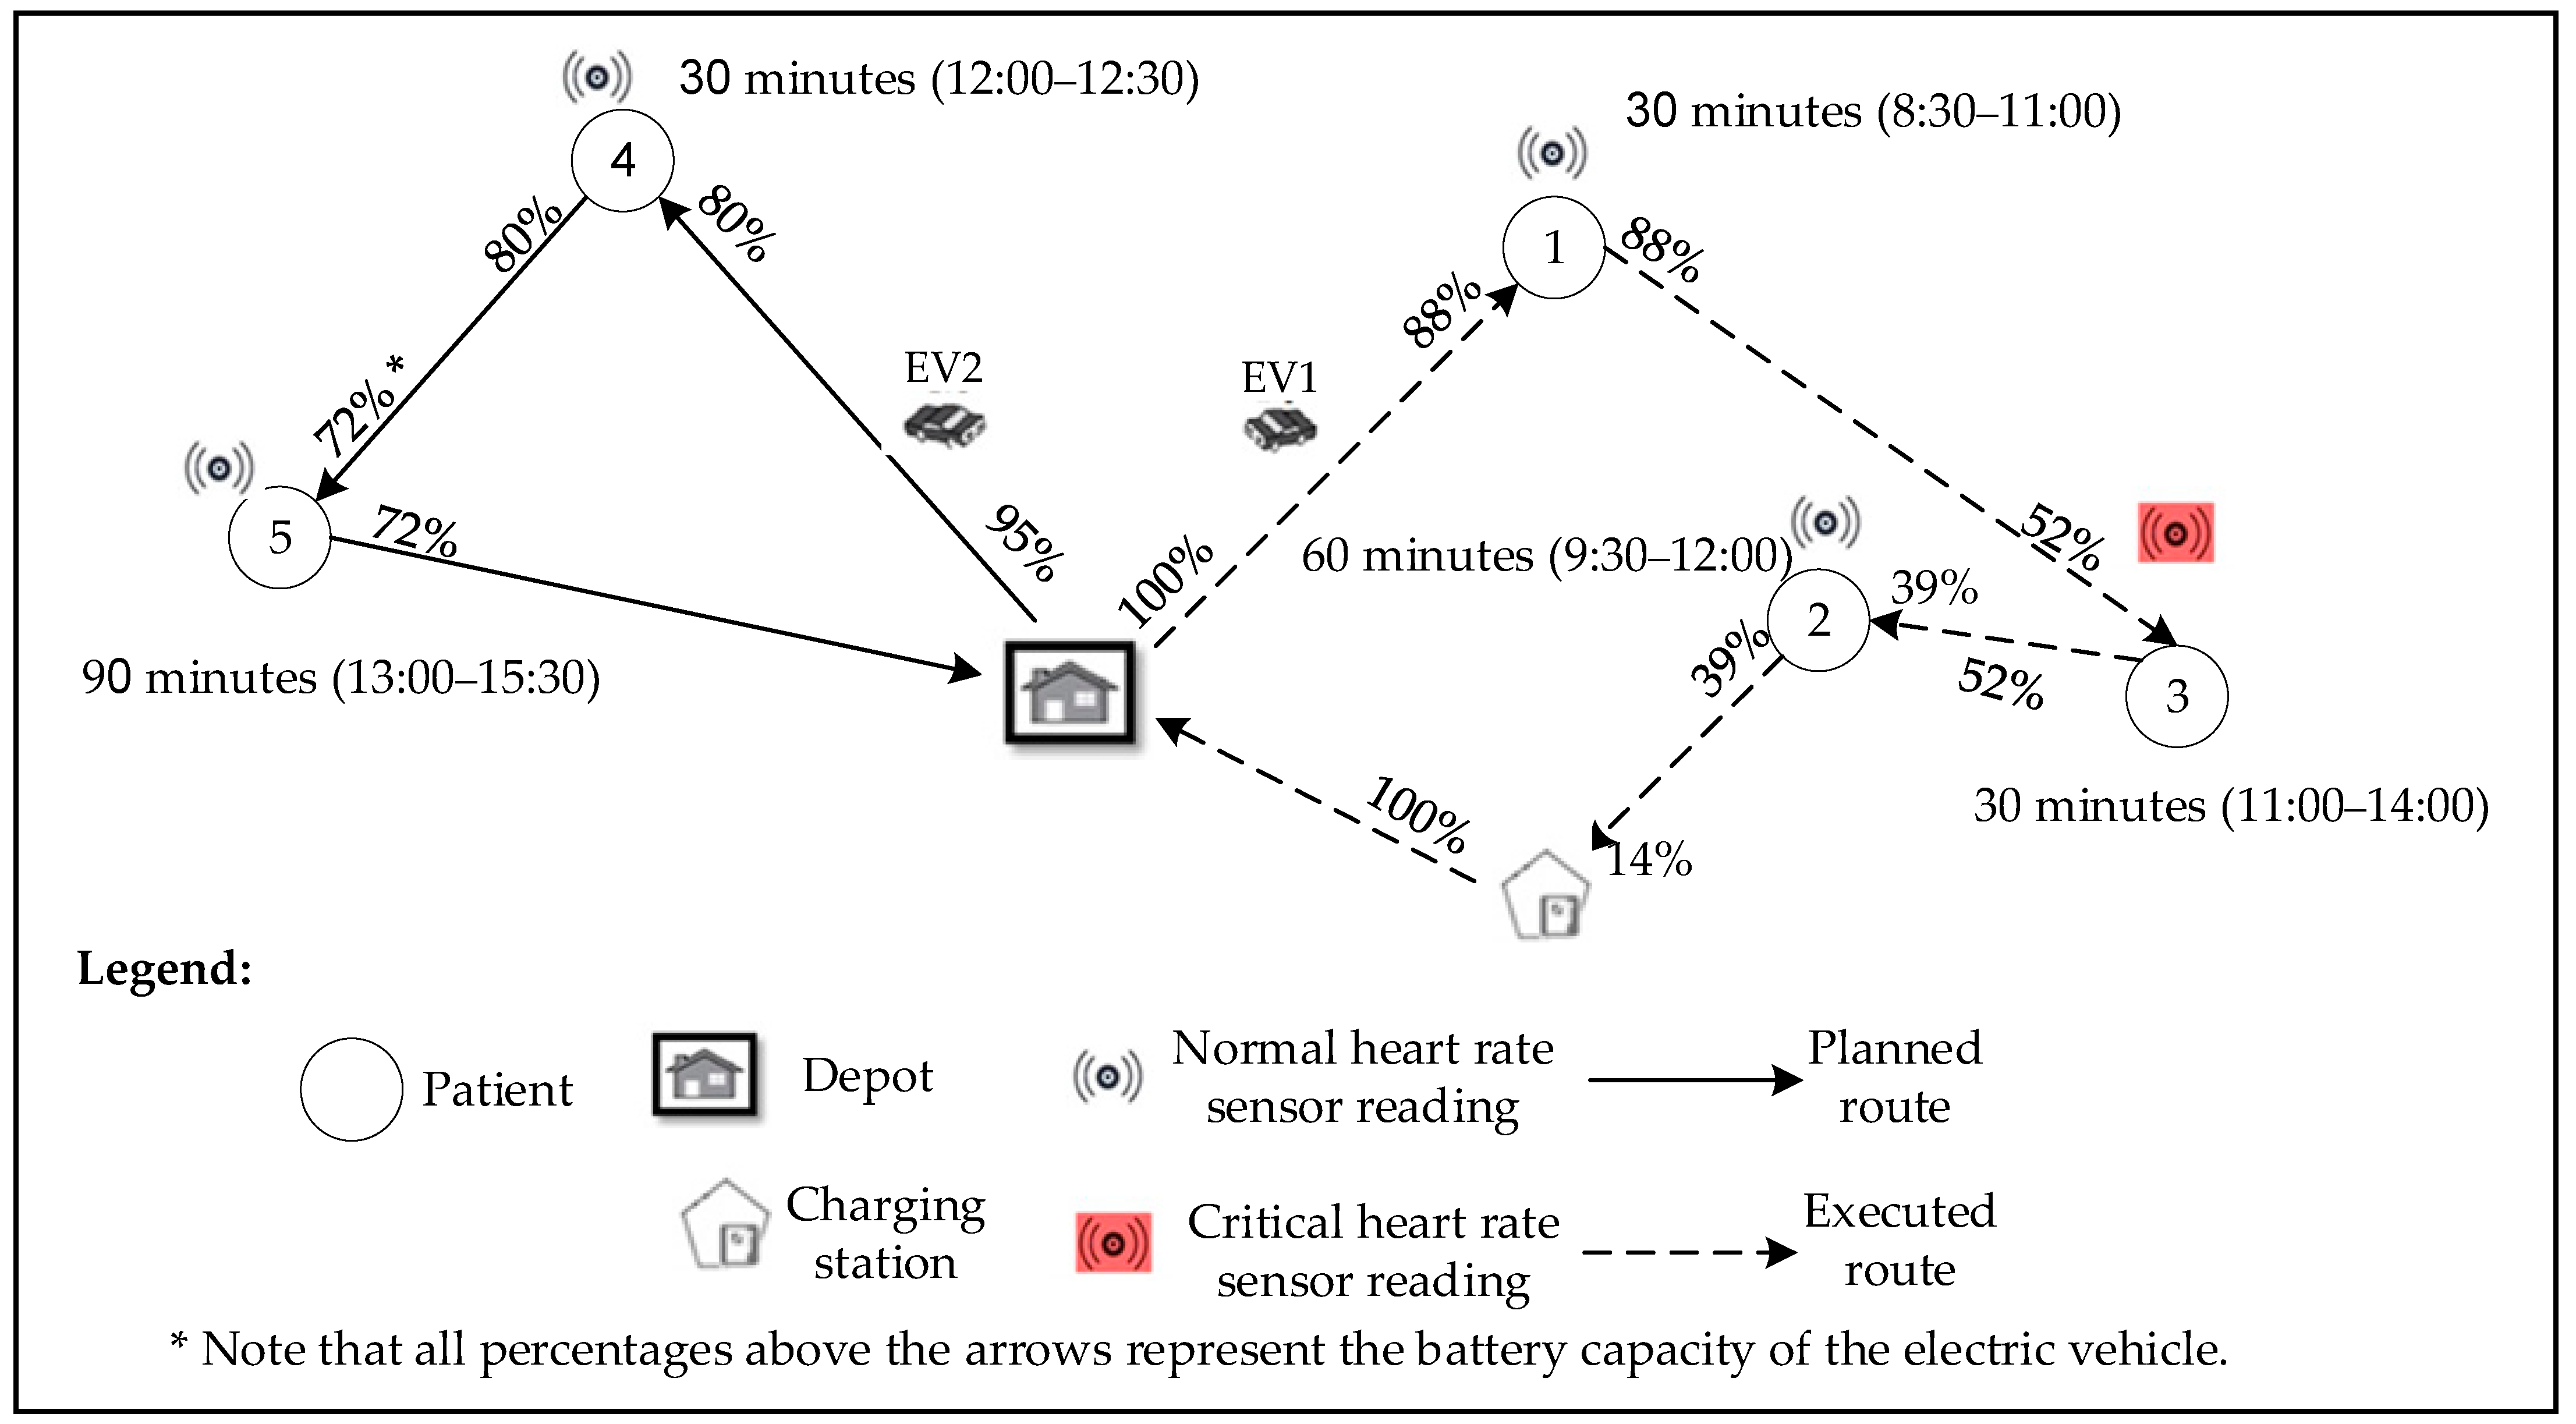
In this model, one type of vehicle assumed is the EV. Such vehicles are powered by electrical energy rather than fuel, thus eliminating fuel combustion and the emission of greenhouse gases (GHGs). The model considers battery charging status, charging duration, and charging stations for the EV, as shown in the work of Erdem and Koç [3]. Battery levels must be checked before leaving and arriving at patient nodes, as well as before and after visiting the charging station. Figure 1 and Figure 2 illustrate an example of the proposed problem that considers EVs and heart rate sensors. Note the dynamic behavior of the model, where the planned route changes when a critical condition arises. Moreover, it is assumed that there are four types of routes; each corresponds to a different speed range, energy consumption, and different terrain nature [44].
Route one (1–30 Km/h): as seen in cities and urban areas, this speed limit leads to high fuel consumption. Route two (31–55 Km/h): such speed limits drop fuel consumption, as seen in routes in rural and sub-urban areas. Route three (56–80 Km/h): as seen in rural areas and highways, this speed limit leads to the ideal fuel consumption. Route four (81–120 Km/h): in this speed limit, fuel consumption rises due to high engine Revolutions Per Minute (RPM), which leads to high fuel burning and, therefore, high consumption. This type of route includes multi-lane highways. Furthermore, any variations from the predetermined workload for each caregiver that complies with labor laws and regulations will be calculated. If any deviation from these workloads exists, costs will be incurred.
Moreover, the work of Khorshidi and Hejazi [35] was used to assess the quality of the provided service, as well as internal measures set by HHC experts. However, patients’ needs and expectations are measured internally. The normalized relationship between quality-related dimensions and the internal measure will be determined along with the degree of fulfillment of the defined internal measure, to determine the expected quality of service. In addition, the work of Ghannadpour and Zarrabi [36] was adopted to assess patient’s perceived satisfaction.
In this paper, the patients are classified into two categories, non-urgent and urgent, to assign different levels of priority in service based on medical necessities. Non-urgent patients are given a priority of service ranging from 1 to 3 (from a scale of 5) depending on their medical status. On the other hand, urgent patients are given a priority level of either 4 or 5. Note that among different quality dimensions, reliability, and responsiveness dimensions are considered in this model in the form of meeting the patient’s desired time of service with a predefined acceptable time window of service (reliability), as well as being able to serve critical condition patients quickly using the data from the employed sensors (responsiveness). The difference between expectations and perceptions is multiplied by a penalty, which is the cost of poor quality of service, to minimize such costs. Figure 1 and Figure 2 show an example of the proposed problem considering electric vehicles and heart rate sensors. Figure 1 shows an example of an HHCVRP with a single depot, two EVs, two charging stations, and five patients under normal conditions to be served, with a planned route. On the other hand, Figure 2 demonstrates a situation where one patient shows critical heart rate readings, and thus, a higher priority of service is given to him/her; therefore, the planned route changes.

3.1. Mathematical Modeling

The proposed model was formulated based on multi-objective Mixed-Integer Non-linear Programming (MINLP). The SSHHCVRP model presents much complexity due to addressing a real-life problem; such efforts lead to a more realistic model. On the other hand, the model includes many decision variables with different values. For instance, heart rate sensor readings are binary variables, whereas the battery state of electric vehicles is fractional. Variables such as level of customer satisfaction are real numbers ( [ 0,1 ] ). Thus, using MINLP for optimization is more reasonable and yields more realistic results. The developed model aims at managing the following objective functions: (1) minimizing travel time from one node (patient) to another while considering the patient’s condition (normal or critical) and the type of route (denoted by Z1), (2) maximizing the velocity of the vehicle traveling between nodes while considering patient’s condition and route type (denoted by Z2), (3) minimizing costs related to the deviation from the average workload of a caregiver (denoted by Z3), and (4) minimizing the penalty costs due to poor quality of service, by measuring the difference (gap) between the expected and perceived quality of service (denoted by Z4). The mathematical formulation of the model is shown in the following sub-sections.

3.1.1. Model Assumptions

  • Single depot (starting point) and multi-destination points (patients to be served);
  • The patients to be served are assumed to have cardiovascular conditions, such as patients recovering from heart diseases or patients with chronic heart conditions;
  • A caregiver must visit all patients;
  • Normal patients are assumed to have a heart rate between 60 and 100 beats per minute (BPM), whereas heart beats below 60 BPM and above 100 BPM classify a patient as under critical conditions [45];
  • There are variations in the distances between the same pair of nodes when driving on different kinds of routes;
  • The limited battery capacity of the electric vehicle is assumed to illustrate real-world scenarios where different EVs have different batteries and can be used under various driving conditions. This assumption will ensure the generalizability and robustness of the mathematical model.
  • The electric vehicle must visit a charging station if battery capacity falls below 50%;
  • The location of charging stations is assumed to be fixed;
  • Electric vehicle battery capacity should be 100% charged after visiting a charging station;
  • Electric vehicle energy consumption differs from one route to another and was classified according to Hosseini-Nasab and Lotfalian (2017) [44] as follows:
    • Route 1: 0.14 (kWh/km);
    • Route 2: 0.12 (kWh/km);
    • Route 3: 0.10 (kWh/km);
    • Route 4: 0.13 (kWh/km).
  • The degree of patient importance (priority) is based on the complexity of their medical condition, needed care, and how they are affected by time of service, i.e., time of medication and needed checkups.

3.1.2. Sets and Indices

NSet of a source or destination node;
SSet of recharging stations;
SSet of dummy recharging stations to allow multiple visits;
PSet of a patient under normal conditions;
CSet of a patient under critical conditions;
MSet of measures of quality of service;
i Index   of   the   source   node   ( i   N );
j Index   of   destination   node   under   normal   conditions   ( j   N );
j Index   of   destination   node   under   critical   conditions   ( j N );
rIndex of type of route (r = 1,2,3,4);
h Index   of   caregiver   ( h   H );
d Index   of   day   ( d   D );
t Index   of   the   time   slot   ( t   T );
k Index   of   electric   vehicles   ( k K );
q Index   of   quality   dimension   ( q   Q );
α , β Indices   of   internal   measures   of   quality   of   service   ( α , β Q ).

3.1.3. Model Parameters

ParameterDescription
T i m e d normalized work time on day d;
C O h d costs associated with the caregiver h’s workload deviation from the normalized value on day d;
O h d maximum working time in a single day for caregiver h on day d;
Eheart rate sensor reading for patients;
V E L i j r velocity of travel between node i and node j along route r (Km/hr);
V r the upper speed limit allowed on route r (Km/hr);
e i earliest arrival time within a time window of service at patient node i;
l i latest arrival time within a time window of service at patient node i;
f i the duration of service time at patient node i;
u i the desired time of service at patient node i;
ω i waiting time at patient node i;
P R i importance degree of a patient at node i based on medical status and needed service;
t r k total travel time of vehicle k;
Asufficiently large positive number;
σ constant for violating the hard time windows;
s i j r travel time from node i to node j along route r (i, j   N   S );
d i s i j r travel distance from node i to node j along route r (i, j   N S );
δ k recharging rate of electric vehicle k;
Y k the battery capacity of electric vehicle k;
λ k the consumption rate of electric vehicles k;
R n o r m q α the normalized relationship between the qth service quality dimension and the αth internal measure of service;
γ α β the dependencies and correlation between internal measures where α and β M;
R q β the relationship between the qth service quality dimension and the βth internal measure of service;
P e n q the cost (USD) of poor quality of service for the qth dimension of service quality;
W T Z i predefined target weight for objective function Zi, set by decision makers;
Z o p t i m a l summation of all objective functions with their weights.

3.1.4. Decision Variables

x i j p r   =1, if a caregiver travels from i to j through route r serving patient p under normal conditions; =0, otherwise;
C i j c r   =1, if a caregiver travels from i to j′ through route r serving patient c under critical conditions; =0, otherwise;
HR=1 if the heart rate of a patient is within critical range; =0, otherwise;
y i k battery state of an electric vehicle k K, at node i;
g i k battery state of an electric vehicle k K after visiting a charging station   i   ϵ   S ;
l o a d h d the total workload of caregiver h on day d;
W i k electric vehicle k charging duration   i   ϵ   S ;
S a t . e x p q the expected level of patient satisfaction from the qth dimension of service quality;
S a t . p e r q the perceived level of patients’ satisfaction from the qth dimension of service quality;
F u l α the level of fulfillment of the αth internal measure;
μ i ( t i ) membership function of patient node i;
η i control variable for each patient at node i;
a t i actual arrival time at patient node i;
t i start time of service at patient node i.

3.1.5. Defining Equations

T = p   c
H R = 1   i f   0 E 60 ,   0   i f   60 < E < 100 ,   1   i f   100 E
V E L i j r k 0   i , j N ,   i j , r = 1,2 , 3,4   , k   ϵ   K
V E L i j r k 0   i , j N ,   i j , r = 1,2 , 3,4   ,   k   ϵ   K
R n o r m q α = β = 1 M R q β × γ β α α = 1 M β = 1 M R q α × γ α β
S a t . e x p q = α = 1 M R n o r m q α   ×   F u l α   q   Q  
S a t . p e r q = i = 1 N μ i ( t i )   q   Q  
μ i t i = a t i + ω i e i u i e i × 1 η i + l i a t i + ω i l i u i × η i     i P
μ i t i = a t i + ω i ( e i σ ) u i ( e i σ ) × 1 η i + ( l i + σ ) a t i + ω i ( l i + σ ) u i × η i   i C
u i a t i + ω i × η i + a t i + ω i u i × 1 η i < 0     i P C
Z o p t i m a l = i = 1 4 W T Z i × Z i

3.1.6. Objective Functions

min Z 1 = i = 0 N r = 1 4 j = 1 N p = 1 P ( s i j r × x i j p r   × ( 1 H R ) )   + j = 1 N c = 1 C ( s i j r × C i j c r   × H R )
max Z 2 = i = 0 N r = 1 4 j = 1 N p = 1 P ( V E L i j r × x i j p r   × ( 1 H R ) ) + j = 1 N c = 1 C ( V E L i j r × C i j c r   × H R )
min Z 3 = i = 0 N r = 1 4 d = 1 D h = 1 H j = 1 N p = 1 P ( C O h d × T i m e d × x i j p r l o a d h d × ( 1 H R ) ) + j = 1 N c = 1 C ( C O h d × × T i m e d × x i j p r l o a d h d × C i j c r   × H R )
min Z 4 = i = 0 N r = 1 4 q = 1 Q j = 1 N p = 1 P ( ( S a t . e x p q S a t . p e r q ) × P R i × P e n q × x i j p r   × ( 1 H R ) )   + j = 1 N c = 1 C ( ( S a t . e x p q S a t . p e r q ) × P R i × P e n q × C i j c r   × H R )

3.1.7. Constraints

i = 0 N x i j p r = 1 j   N ,   p P ,   r = 1 , , 4 ,   i j
i = 0 N C i j c r   = 1 j N ,   c C   ,   r = 1 , , 4 ,   i j  
j = 1 N p = 1 P r = 1 4 x i j p r = 1 i N ,   i j
j = 1 N p = 1 P r = 1 4 C i j c r   = 1 i N ,   i j
p = 1 P r = 1 4 x i j p r 1 i , j N ,   i j  
c = 1 C r = 1 4 C i j c r 1 i , j N ,   i j  
i = 0 N r = 1 4 x i j p r j = 0 N r = 1 4 x i j p r = 0   p P   ,   i j
i = 0 N r = 1 4 C i j c r j = 0 N r = 1 4 C i j c r = 0 c C   ,   i j  
j = 1 N p = 1 P r = 1 4 x i j p r   1 i S
l o a d h d   O h d   h ,   d
a t i + ω i + f i + s i j r 1 x i j p r × A   t r k     i ,   j N ,   p P ,   r = 1,2 , 3,4 ,   i j
a t i + ω i + f i + s i j r 1 x i j p r × A   a t j     i ,   j N , p P , r = 1,2 , 3,4 ,   i j
e i     a t i + ω i     l i   i P
e i σ     a t i + ω i     l i   + σ   i C
a t i + ( s i j r + f i + ω i ) × x i j p r + W i k     a t j + δ k × Y k × 1 x i j p r     i ,   j N ,   i S ,   k K ,   p P ,   r = 1,2 , 3,4   ,   i j
0     y j k     y i k s i j r × λ k × x i j p r + Y k × 1 x i j p r     i , j N ,   k K   ,   p P ,   r = 1,2 , 3,4   ,   i j
0     y j k     g i k s i j r × λ k × x i j p r + Y k × 1 x i j p r     i , j N ,   k K ,   i S ,   p P ,   r = 1,2 , 3,4   ,   i j
y j k     g i k     Y k   j N ,   i S ,   k K
w i k     δ k × g i k y i k   i S ,   k K
V E L i j r V r × x i j p r i , j   N ,   p P   r = 1 , , 4 ,   i j
x i j p r + C i j c r = 1   i , j , j N ,   p P ,   c C ,   r = 1,2 , 3,4   ,   i j j
x i j p r     0,1
C i j c r       0,1
y i k   0 ,   t i k   0   i   N ,   k K
g i k   0 ,   W i k   0   i   S ,   k K
0   S a t . e x p q   1   q Q
0   S a t . p e r q   1   q Q
0   F u l α   1   α   M
Equation (1) defines a set T, which is the total number of patients, including normal (p) or critical (c) patients. Equation (2) shows the equivalent binary heart rate sensor reading values. Equations (3) and (4) specify that the velocity parameter does not equal zero in normal and critical conditions. Equation (5) defines the normalized relationship between the service quality element and a predefined internal measure (specified by experts). Equation (6) shows the expected patient satisfaction. Equation (7) calculates the perceived satisfaction with the provided service using the triangular membership function   μ i t i . Equations (8)–(10) show how to compute the perceived satisfaction levels for different patients (urgent and non-urgent). The variable η i is used to control if the start of service is before or after the desired time of service. The value of the objective function is shown in Equation (11). Equation (12) shows the first objective function, which minimizes the overall traveled time for normal and critical patients. The second objective function is presented in Equation (13), which aims to maximize the velocity of the EV. The third objective function is shown in Equation (14), which aims at minimizing the costs related to having a deviation from the average daily workload for a caregiver. Deviations more or less than the average workload result in costs in the form of overtime or not adequately allocating workload among employees. Equation (15) presents the fourth objective function that aims to minimize the cost of poor quality of service, which is the product of penalties for poor service and the difference between patients’ expected and perceived satisfaction with the provided health service. Constraints (16) and (17) specify that from patient node i, any patient could be visited. Constraints (18) and (19) guarantee that each patient is visited only once. Constraints (20) and (21) ensure that only one route must be selected to travel from one patient to another. The law of flow conservation and the continuity of paths are shown in constraints (22) and (23). Constraint (24) states that it is not mandatory to visit a charging station. Moreover, constraint (25) restricts caregivers from exceeding a predefined workload. The maximum allowable travel time is presented in constraint (26). The arrival times and the service time windows are defined in constraints (27)–(29). On the other hand, constraint (30) safeguards time feasibility but differs from constraint (27) by considering the recharging duration of electric vehicles. Constraints (31) and (32) represent the battery status (after each node and after visiting a charging station) and restrict consumption occurring between nodes. Constraint (33) restricts battery capacity from exceeding its maximum after visiting the charging station, yet it restricts capacity levels to be greater than or equal to the node before visiting the charging station. Constraint (34) shows the charging duration of EVk and the difference in battery capacities before and after visiting the charging station. Constraint (35) limits the travel speed to the selected route’s upper speed limit. Constraint (36) implies that either normal or critical patients are served. Constraints (37) and (38) restrict the domain of decision variables to binary numbers. Constraints (39) and (40) restrict a positive battery level value, vehicle charging duration, and service time. Finally, constraints (41–43) define the boundaries of the variables; note that these variables are real numbers between 0 and 1, i.e.,   0,1 .

3.2. Solution Methodology

As discussed earlier, the proposed SSHHCVRP model is characterized by its dynamism and uncertainties in service; therefore, it is considered an NP-hard problem. Thus, using exact methods to solve the optimization problem is nearly impossible. Several heuristic algorithms have been developed to address the VRP, including the hybrid beetle swarm optimization algorithm [46], the ant colony system–improved grey wolf optimization algorithm [47], and a hybrid metaheuristic algorithm combining Discrete Particle Swarm Optimization (DPSO) with Harris Hawks Optimization (HHO) [21]. In this study, the solution was carried out using an approximate method that starts with the Ant Colony Optimization (ACO) algorithm [48] to generate a population of feasible solutions for the problem, where the nature of ACO helps to overcome the dynamic routing problem. Then, Non-Dominated Sorting (NDS) takes place to provide the best possible solutions to the problem. To address the dynamic nature of the proposed model and the multi-objective functions, the Non-Dominated Sorting Ant Colony Optimization (NS-ACO) algorithm was employed. Such an algorithm will generate near-optimal solutions compared to the exact optimization methods that produce global optimal solutions [49]. The nature of the presented SSHHCVRP model requires a decision to be made after each visited node to select which node to visit next, depending on the condition of patients, which is transmitted continuously by the employed sensors, as well as the energy level of the vehicle. However, this is not the only issue to be solved by the proposed algorithm; the presence of multi-objective functions must be considered. Therefore, ACO is used to handle the issue of dynamic vehicle routing that arises in two situations: first, when changing the planned routing path depending on the medical condition of patients (normal or critical), and the second situation is related to the energy levels of the electric vehicle when deciding to visit a charging station or not.
Meanwhile, the NDS technique finds and sorts the best solutions generated from the ACO algorithm, presenting the Pareto front solutions. The patient’s condition and vehicle’s energy level are continuously updated and possess the highest priority when needed. Therefore, the traveling ant may follow an established desirable route (exploitation) or take a new random route (exploration) based on a probability that favors higher pheromone levels and shorter distances. However, in our proposed model, a higher likelihood must be given to patients with critical conditions (if there is one) and charging stations if the energy level is low. This ensures the algorithm prioritizes critical condition patients and charging nodes whenever required. To do so, the level of pheromones must be altered at routes leading to those nodes, guaranteeing that the virtual ants (vehicles) will follow those routes. Equation (44) illustrates the probability of taking the above routes in different situations.
τ i j = 0.1   i f   S   i s   n o t   c r i t i c a l   a n d   e n e r g y   l e v e l > m i n i m u m   0.9 ,   i f   S   i s   c r i t i c a l   a n d   e n e r g y   l e v e l > m i n i m u m 1.0 ,   i f   S   i s   c h a r g i n g   s t a t i o n   a n d   e n e r g y   l e v e l < m i n i m u m
where τ i j is the level of pheromones between the current node i and the possible destination node j. From Equation (44), when a critical node is found, the level of pheromones will increase to 90%, increasing the probability in Equation (45) of the vehicle to take the shortest route to that node.
p i j = τ i j × η i j β u     M k τ i j × η i j β   i f   j     M k   ,   0   o t h e r w i s e
where η i u is the inverse of the distance between nodes i and u, and β is a parameter that shows the importance of pheromone levels compared to distance. Moreover, M k represents the memory of the ant where visited nodes are memorized and cannot be visited twice. Similarly, when the node is not critical, and energy levels are above the minimum, pheromones will be 10%, and the probability of selecting different routes will depend on the distance between nodes. Finally, when the energy levels are below the minimum allowable level, the pheromone levels will be 100% directed to the route that leads to a charging station. Note that at each iteration, the level of pheromones is updated on each route depending on the patient’s status and energy levels. The next step is trial updating, where the level of pheromones is updated continuously for each route. The process consists of two types of trial updating: local and global. After the generation of solutions, local updating is used to lower the levels of pheromones at each route to show the idea of pheromone evaporation and ensure that no solution is too dominant. Local trial updating is shown in Equation (46).
τ i j = 1 α × τ i j + α × τ 0
where α is the speed of pheromone evaporation and τ 0 is the initial level of pheromones at each route. Moreover, global trial updating is used to add more levels of pheromones in the best (near optimal) route, which was taken by one of the ants, as shown in Equation (47), where L is the best solution value.
τ i j = 1 α × τ i j + α × L 1
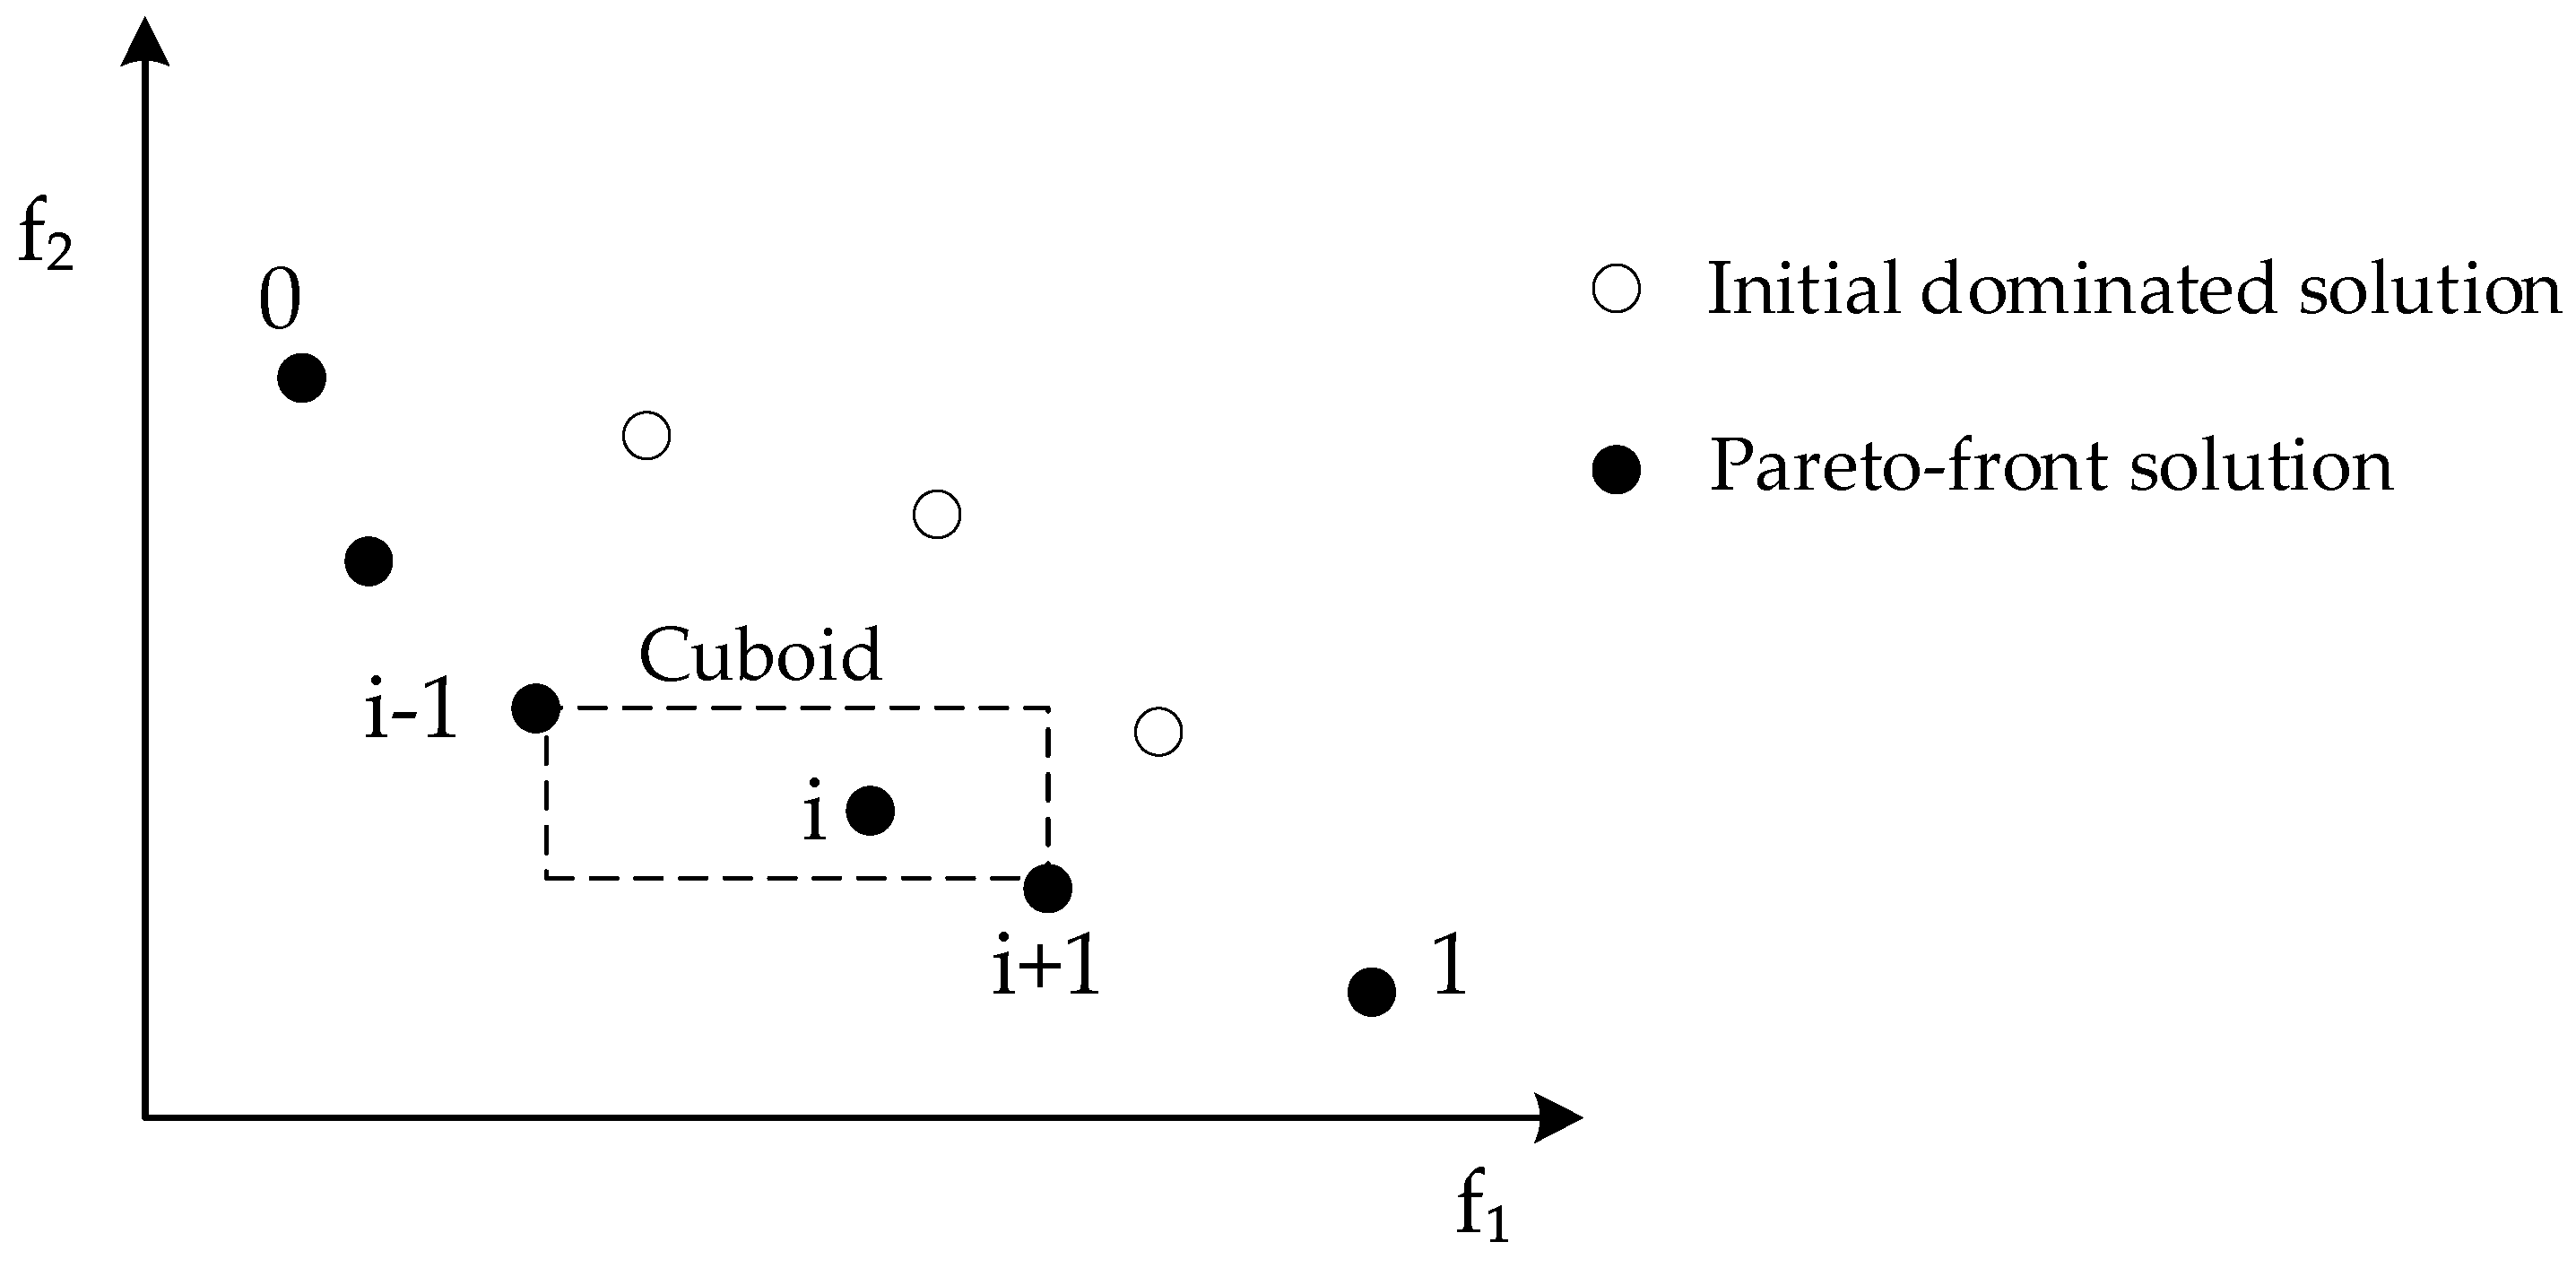
After creating different solutions for the problem using the ACO algorithm, the next step is selecting the Pareto front solutions, which are the fittest ones using NDS and the crowding distance operator. In addition to finding Pareto front solutions, NDS is used to deal with the multi-objective functions in the model. According to Deb et al. [50], the NDS process consists of two stages: non-dominated sorting and crowding distance. The NDS starts with a non-dominated sorting stage to rank each solution in the population by comparing it with others in the same population to find if other solutions dominate it. The process continues until the first class (Pareto front) solutions are obtained; the different ranks are determined by removing the Pareto front and repeating the same process above. The next and final stage is crowding distance, which is used to rank solutions of the first front (Pareto front) solutions which is based on the density of solutions that border a particular point, as shown in Figure 3, where Pareto front solutions are presented in solid circles, and the crowding distance is shown as a dashed cuboid. Therefore, the rank and selection of solutions are based on the solution’s fitness and the crowding distance. If two solutions have the same rank, the solution with the lower crowding distance is selected.
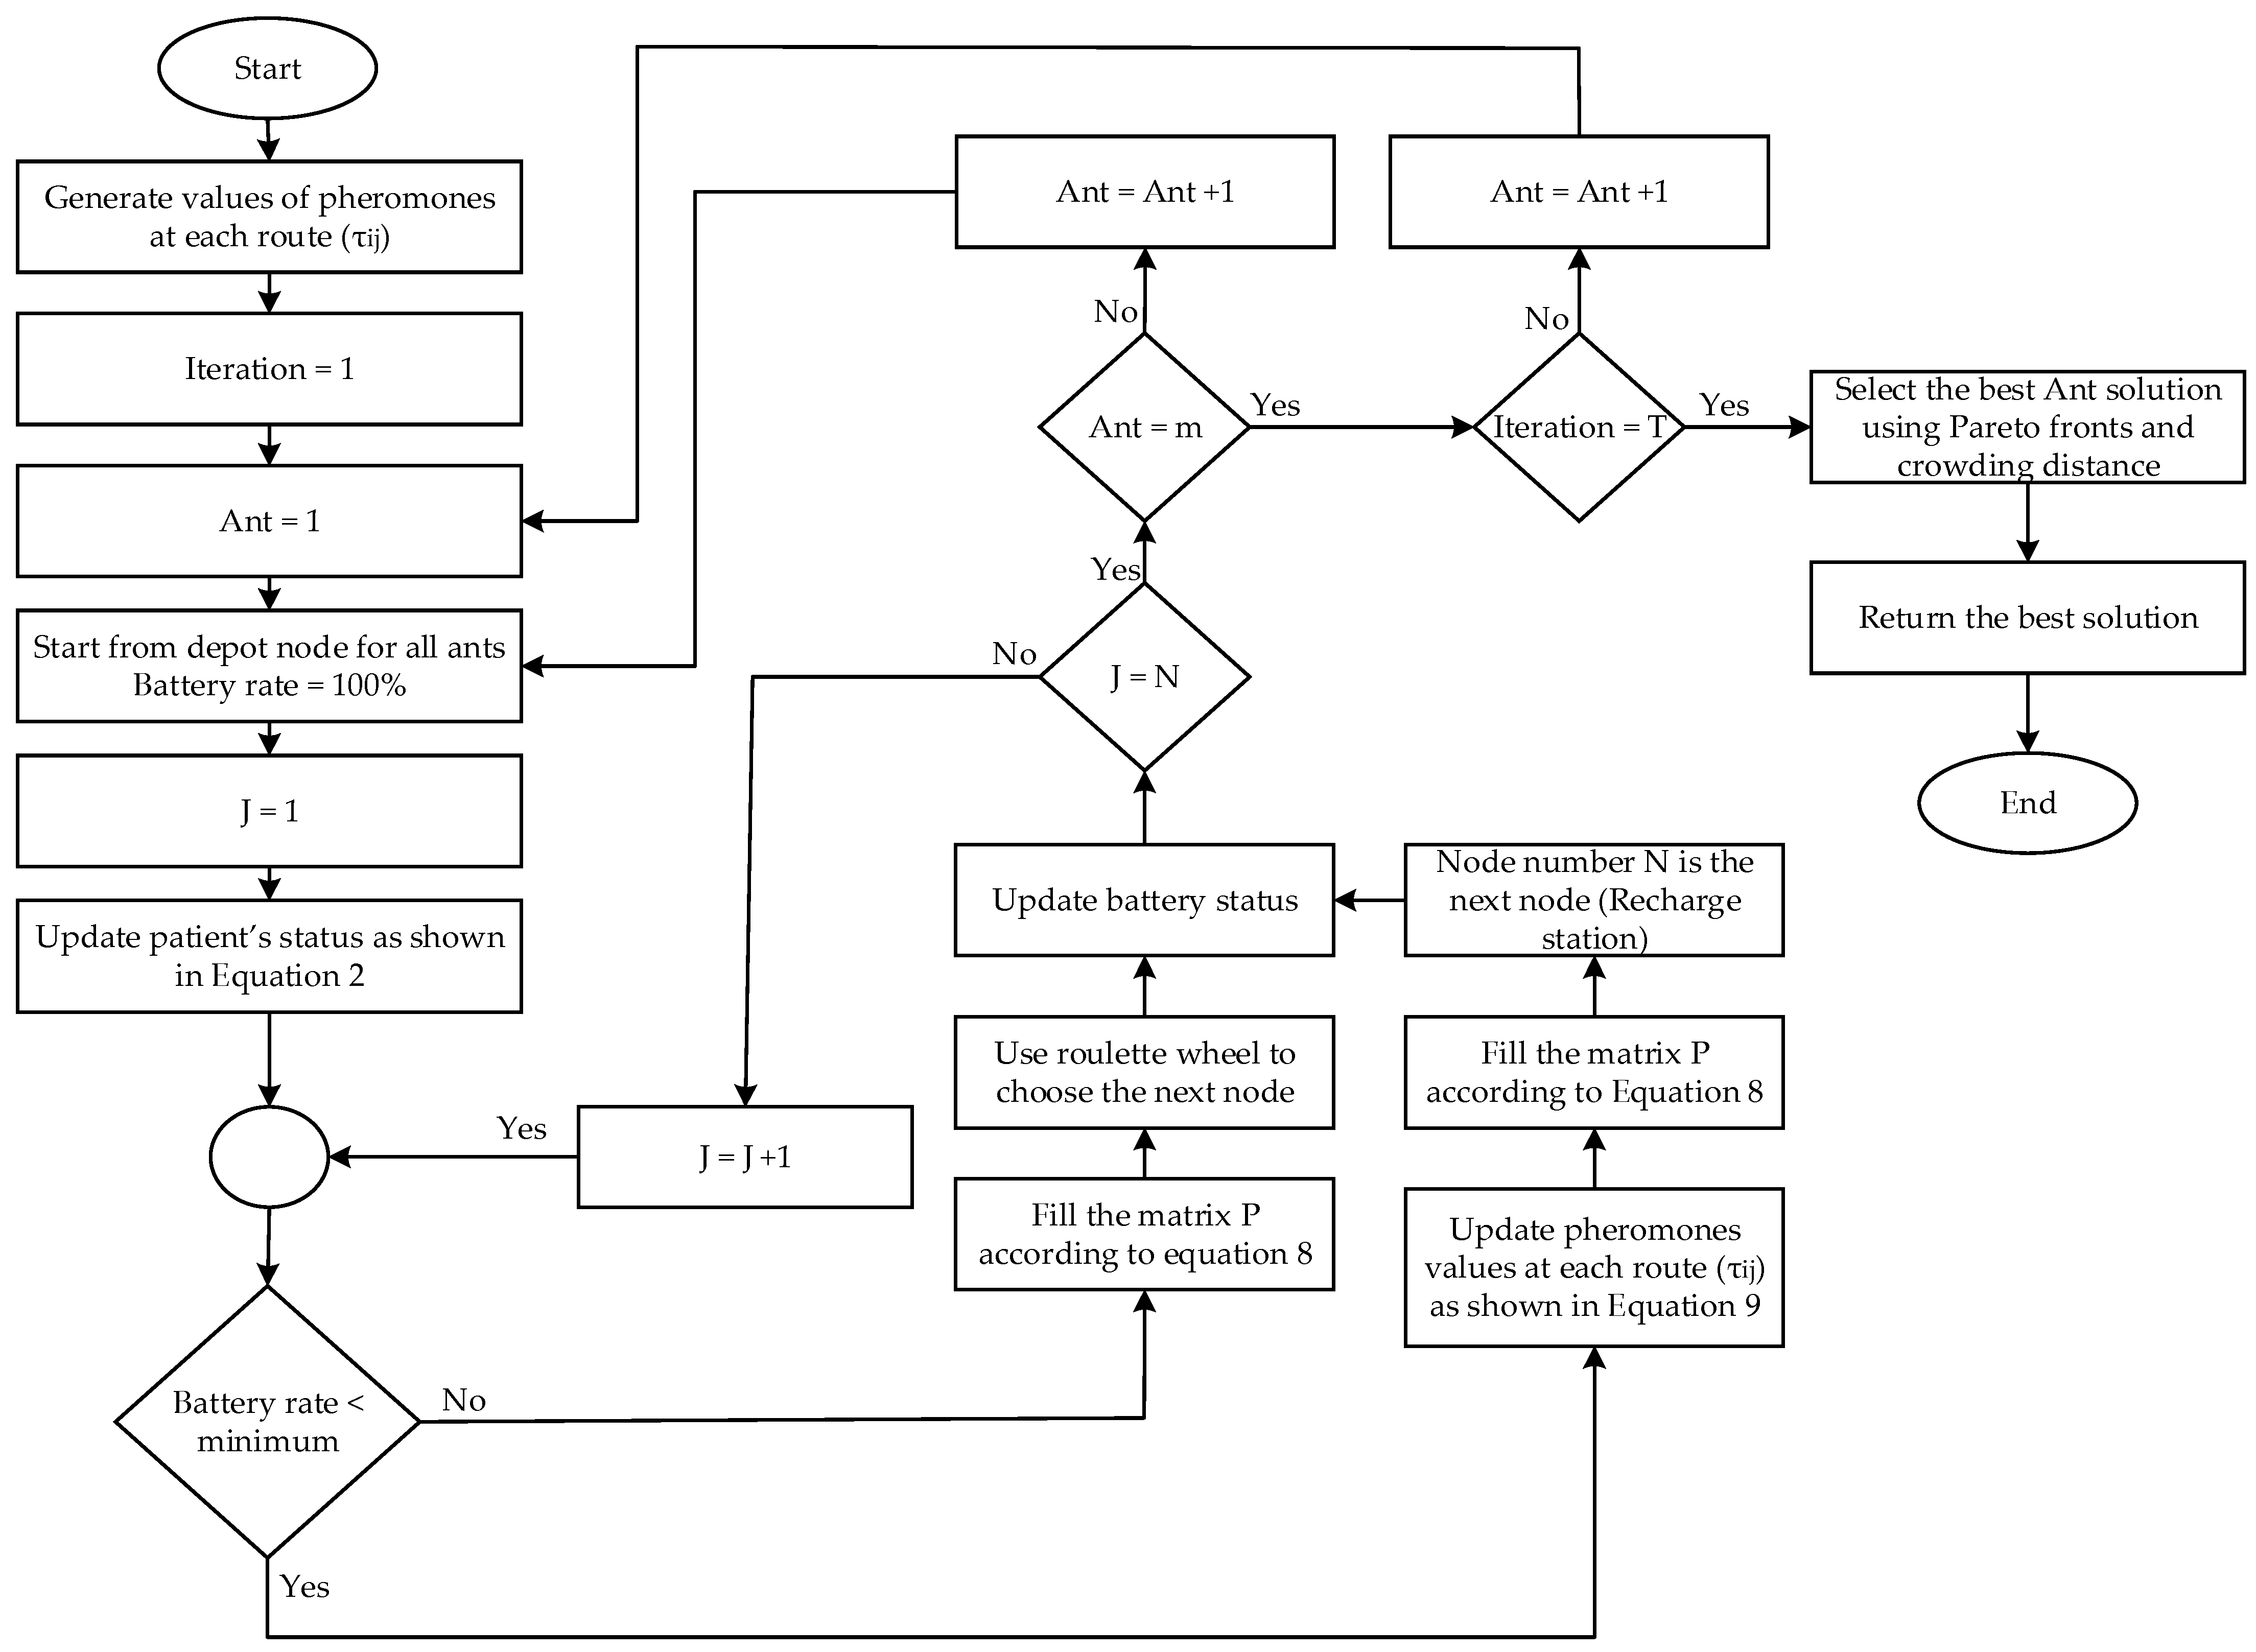
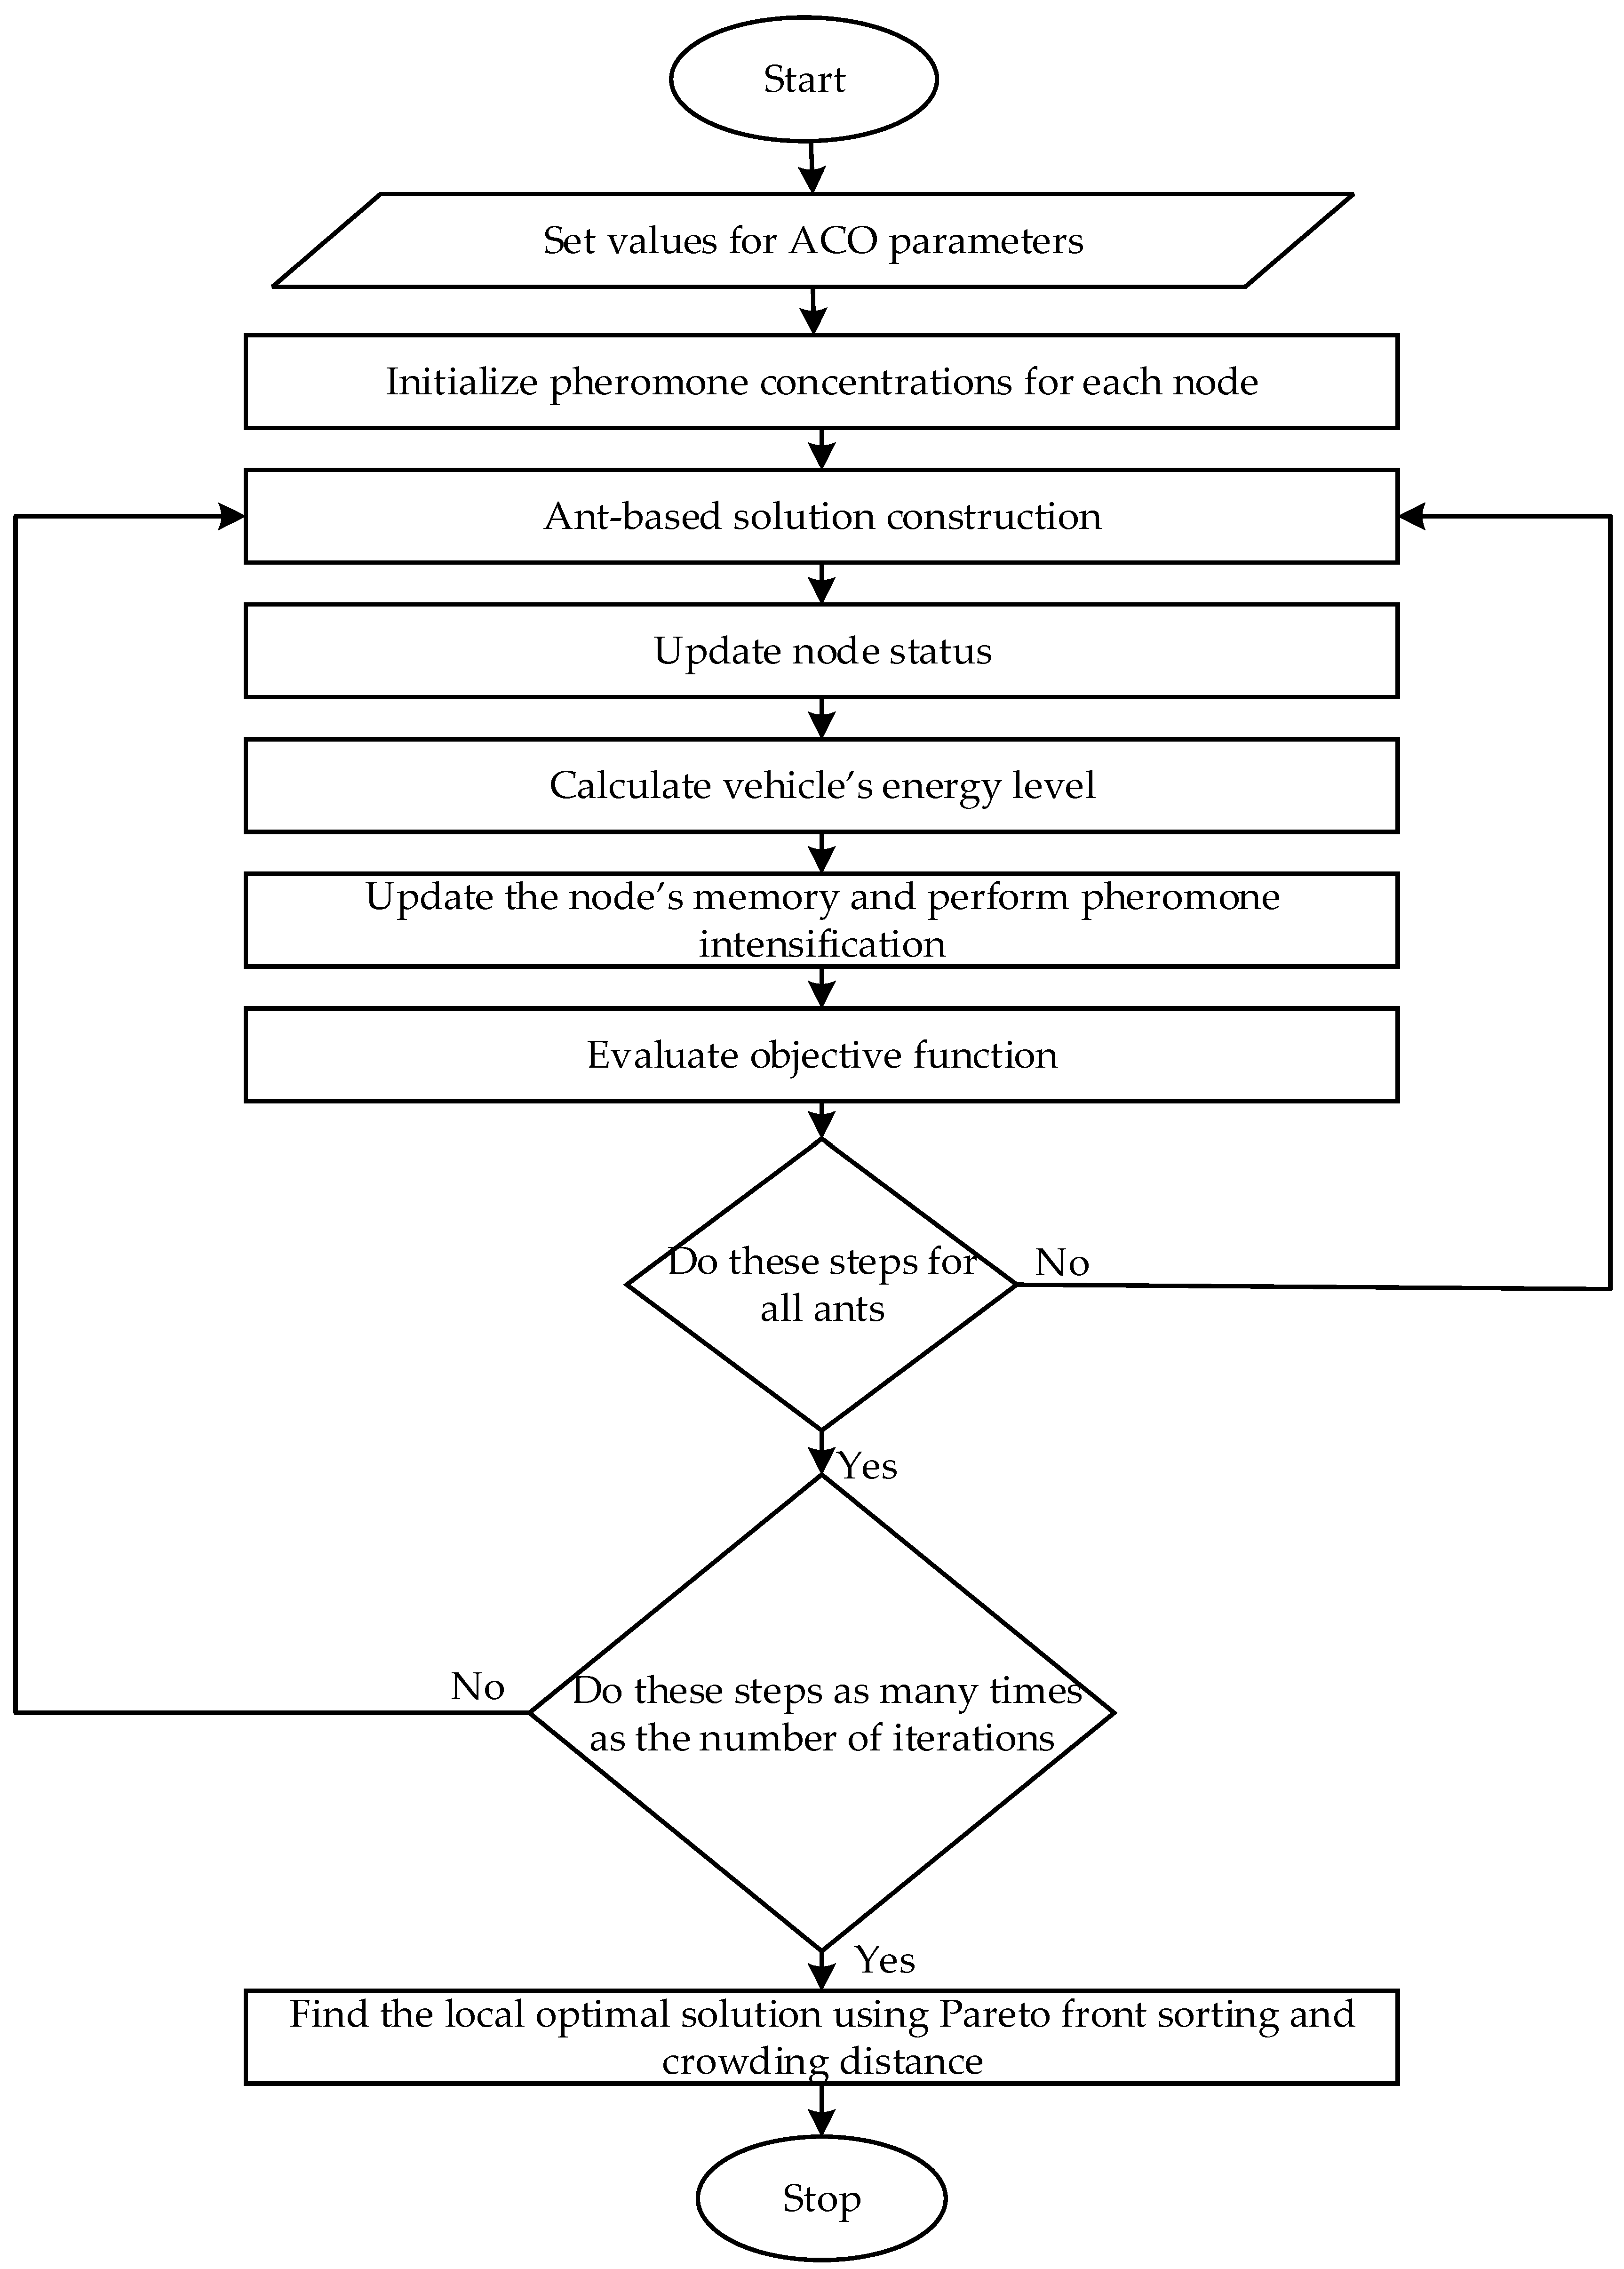
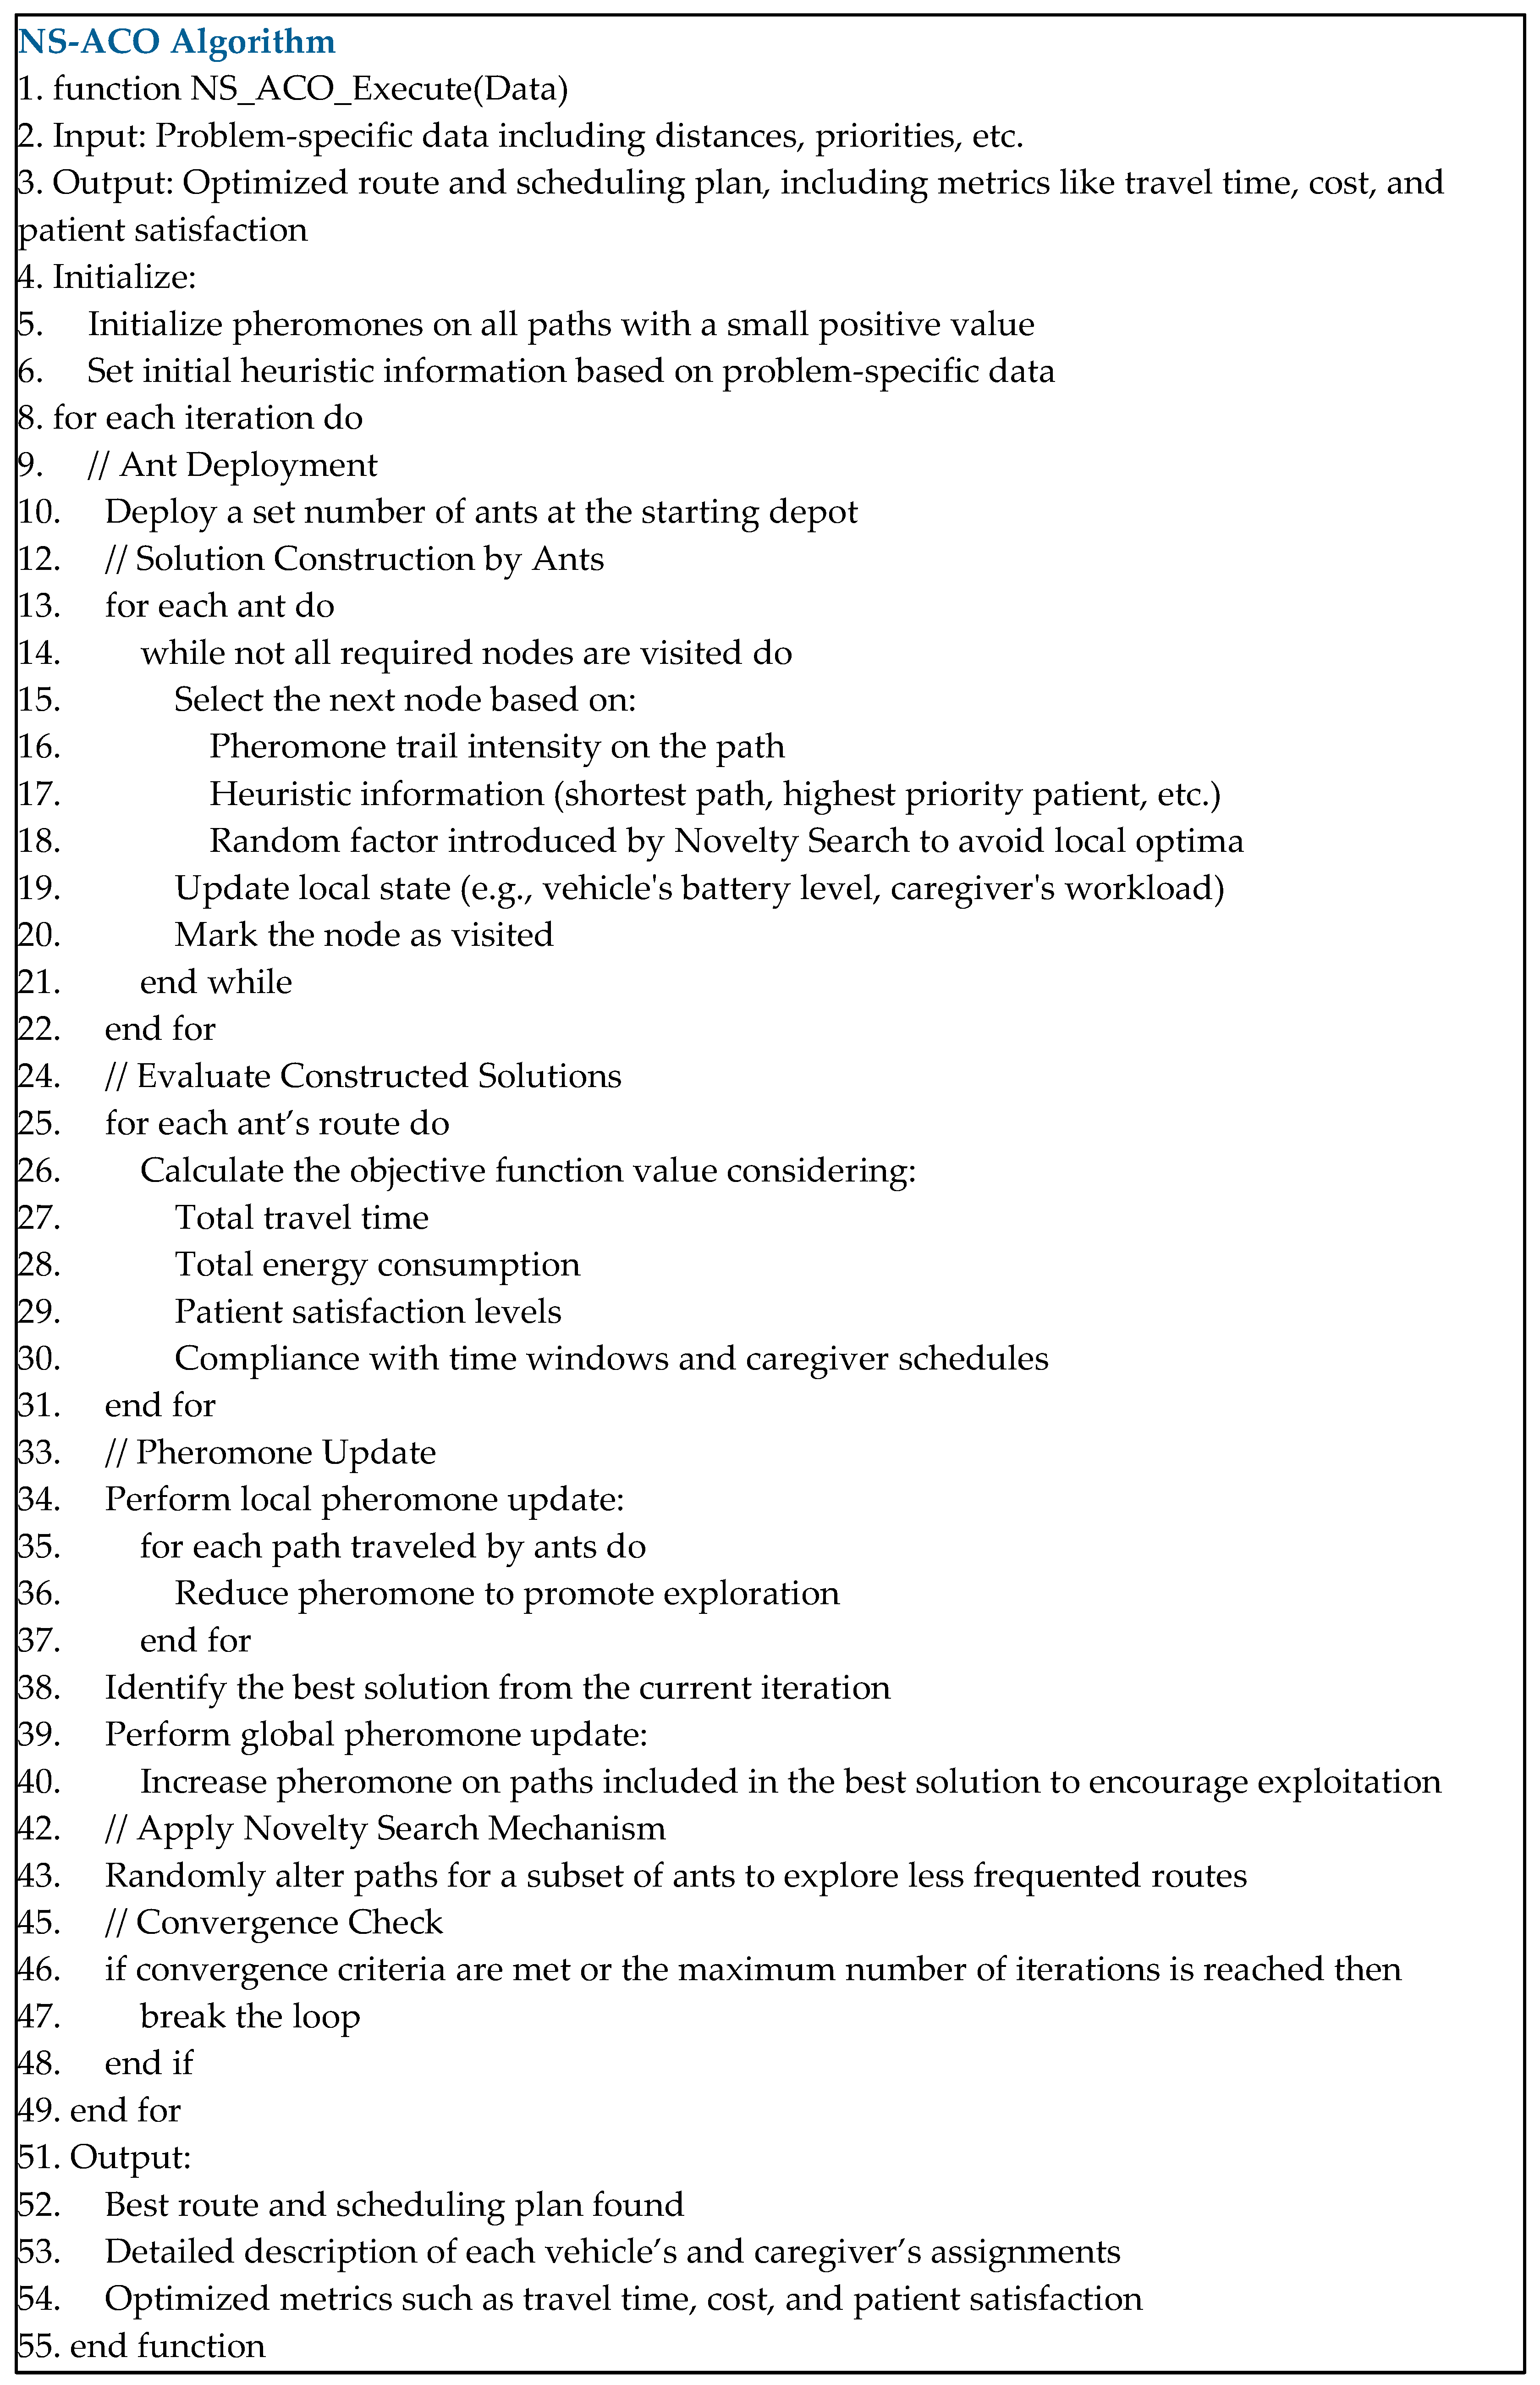
Figure 4 shows a detailed flowchart illustrating how the ACO algorithm was conducted, where sets m, N, J, and T correspond to the set of ants, node number, destination nodes, and iteration number, respectively. In addition, the patient’s condition and vehicle’s energy level are continuously updated and possess the highest priority when needed. Moreover, a process flowchart that presents the steps of conducting the proposed NS-ACO algorithm is shown in Figure 5. Figure 6 demonstrates the pseudocode for the algorithms, which clearly illustrates the techniques used.

4. Model Results

This section presents the numerical data used to solve the model, which was adopted from the literature for validation purposes, as shown in Section 4.1. In addition, random data were generated due to the lack of instances in the literature. The proposed NS-ACO algorithm was implemented using MATLAB 2014a software on a personal computer running Windows 10, with a 3.00 GHz CPU, Intel i5 processor, and 8.00 GB of RAM.

4.1. Numerical Data

In this section, the adopted data are presented to evaluate the developed model compared to previous work in the literature. Table 1 shows the numerical data used in the model. The velocity and distance follow a uniform distribution ranging from 10 to 50 km and 1 to 120 km/h, respectively, where the model decides the near-optimal velocity and distance based on the selected route to follow. Moreover, the EV consumption rate and battery capacity values are consistent with those of the Statista Research Department [51] and Younes et al. [52]. In addition, concerning battery capacity, the threshold at which a charging station must be visited was set to 50% of the total battery capacity. In addition, the cost of deviating from each caregiver’s average workload per working day was set to USD 30 per hour. Moreover, the penalty for poor service where the patient’s perception does not meet expectations was set at USD 100. The priority of service   P R i was defined to be between 1 and 5 (i.e.,   1,2 , 3,4 , 5 ), where the value of 1 shows a patient with the least priority in service, whereas 5 is the highest, as discussed in previous sections. Finally, the workload was set at 8 h per working day, whereas the maximum workload was proposed to be 10 h per working day. Table 2 summarizes the characteristics of each route type in terms of maximum allowable velocity, maximum length, and energy consumption.

4.2. Numerical Results

In this section, the results regarding the near-optimal route, parameters, decision variables, and objective functions are presented and discussed. A network of eight patients, a single depot, and two charging stations were assumed. Figure 7 reveals the optimal routes for serving a predefined number of patients. The depot and charging stations were assumed to be nodes number 1, 15, and 16, respectively, and these nodes are presented by symbols, as shown in the legend. Moreover, patients with normal conditions are presented with natural sensor signs, whereas red sensor signs distinguish critical patients. Note that at each node, the model updates the condition of patients and battery status, and the updated information is used to decide which node should be visited. As shown in Figure 7, the first caregiver started with patient two since the data transmitted from the sensors showed a critical urgent condition; after that, the route continued to serve patients 4, 6, and 14 until another critical condition arose at patient node 9. In addition, after visiting node 13, the model decided to visit a charging station (node 15) since the battery capacity dropped below the minimum predefined level, which is presented in detail later in this section.
Moreover, as shown in the route followed by EV 2, the model decided to visit patient 12 after patient 8 due to their critical condition, rather than visiting patient 11, who was closer, and visiting them would have saved time and money. However, the patient’s well-being is the priority. Additionally, able 3 highlights the arrival and departure times at each node, as well as the battery status after visiting each node. It is assumed in the proposed model that the battery capacity should not drop below 50% of total capacity; therefore, as shown in Table 3, the decision to visit a charging station was not made until after visiting patient node 13 (in route 1) and patient 11 (in route 2), where battery status was 21.24 kWh and 21.06 kWh, respectively. After visiting each node, the model updates and checks the battery status to alter the routing plan, illustrating the proposed model’s dynamism. Finally, the patient’s condition is included in the table, where one value indicates a critically conditioned patient.
Furthermore, Table 4 demonstrates the near-optimal route along with decision variables and parameters associated with each route. Specifically, it includes the near-optimal velocity, distance, route type, travel time, and energy consumption. For example, the route from patient node 8 to patient node 12 (using EV 2) was executed due to the critical condition of patient 12, and therefore, a higher service priority was given. The near-optimal velocity for this route was 78 km/h. The travel time between the two patients was 0:32 h. Also, electric vehicles consume 2.70 kWh of energy while covering a 22 km distance through this route.
Table 5 shows the arrival and departure times at each visited patient’s node to measure the assigned caregiver’s daily workload. The difference between the average and actual workload is shown in the table and multiplied by the cost of workload deviation C O h d to find the total cost of workload deviation. For instance, Table 5 presents two different trips, each executed by two different drivers (Driver 1 and Driver 2). For example, the second trip resulted in a total workload of 9 h and 5 min (9:05) for Driver 1 and a total workload of 7:38 h for Driver 2. In this trip, the deviation from the average workload for Driver 1 was 1:05 h, which resulted in USD 33 of cost due to deviating from the average workload. For Driver 2, the deviation from the average workload was 0:22 h, resulting in USD 11 in costs. Note that costs will be incurred in both situations where the total workload is more or less than the average, in order to achieve resource utilization and fairness between caregivers and HHC companies. Moreover, Table 6 presents the results of patients’ satisfaction levels at each node and the costs related to dissatisfaction with the provided service. As shown in the table, the model assumes five priority levels, with 5 being the highest priority and 1 being the lowest priority. Note that different priority levels represent patient conditions regarding needed monitoring and care and the excessive need for precision in service times. Different parameters and variables related to the arrival times at patients’ nodes and time windows of service are shown in the table. Higher priority (levels 4 and 5) urgent patients are served within restricted time windows, compared to the more flexible time windows applied to lower priority (levels 1–3) non-urgent patients. As discussed in previous sections, μ i ( t i ) shows patient satisfaction by measuring the deviation from the desired time of service using Equations (8) and (9). However, when a critical condition arises, a caregiver skips other patients (temporarily) to serve critical ones, and therefore, the satisfaction is assumed to be 100%, as shown at patient nodes 2, 9, 13, 12, and 3. On the other hand, the expected satisfaction S a t . e x p q was calculated using the relationship between the defined internal measures, the degree of fulfillment of those internal measures, and the quality dimensions. Therefore, the gap between the perceived and expected satisfaction was calculated, and the incurred costs of poor quality are shown in the last column in Table 6. In addition to serving patients with critical conditions first whenever needed, the proposed model prioritizes higher priority patients for service.

5. Sensitivity Analysis

5.1. The Effect of Using Heart Rate Sensor

To assess the effectiveness and efficiency of the developed model, four scenarios were tested and analyzed to reveal how sensitive model variables were to the employment of the proposed heart rate sensor. Scenario 1 assumes the battery capacity of the electric vehicle threshold is 20–80%, according to Kostopoulos et al. [53], and shows a situation employing heart rate sensors that transmit real-time data for route planning. Scenario 2 presents a situation where heart rate sensors were not used; in this situation, a predefined routing plan was assumed, and no real-time data were considered. Scenarios 3 and 4 assume the battery capacity of the electric vehicle threshold is 50%. Table 7 shows the results when solving the model while considering scenarios 1, 2, 3, and 4. The results shown in Table 7 are the average results after solving the model for five runs. The table shows that the first objective function Z1 value shows 31 min more travel time in scenario 1 than in scenario 2, since critical conditions require a detour from the planned near-optimal route. Thus, more travel time will be incurred. Regarding the velocity of the EV shown in Z2, the average velocity of the five tested runs was considered, where the near-optimal value was 82.3 km/h for scenario 1 and 95.6 km/h for scenario 2. Such differences in velocities are due to the availability of different route types and the presence of critical conditions, which results in following different routes in each scenario. In addition, the results related to cost functions were as follows: the workload deviation costs presented by Z3 showed a slight difference between the two scenarios, with a USD 0.9 increase in such expenses when using sensors.
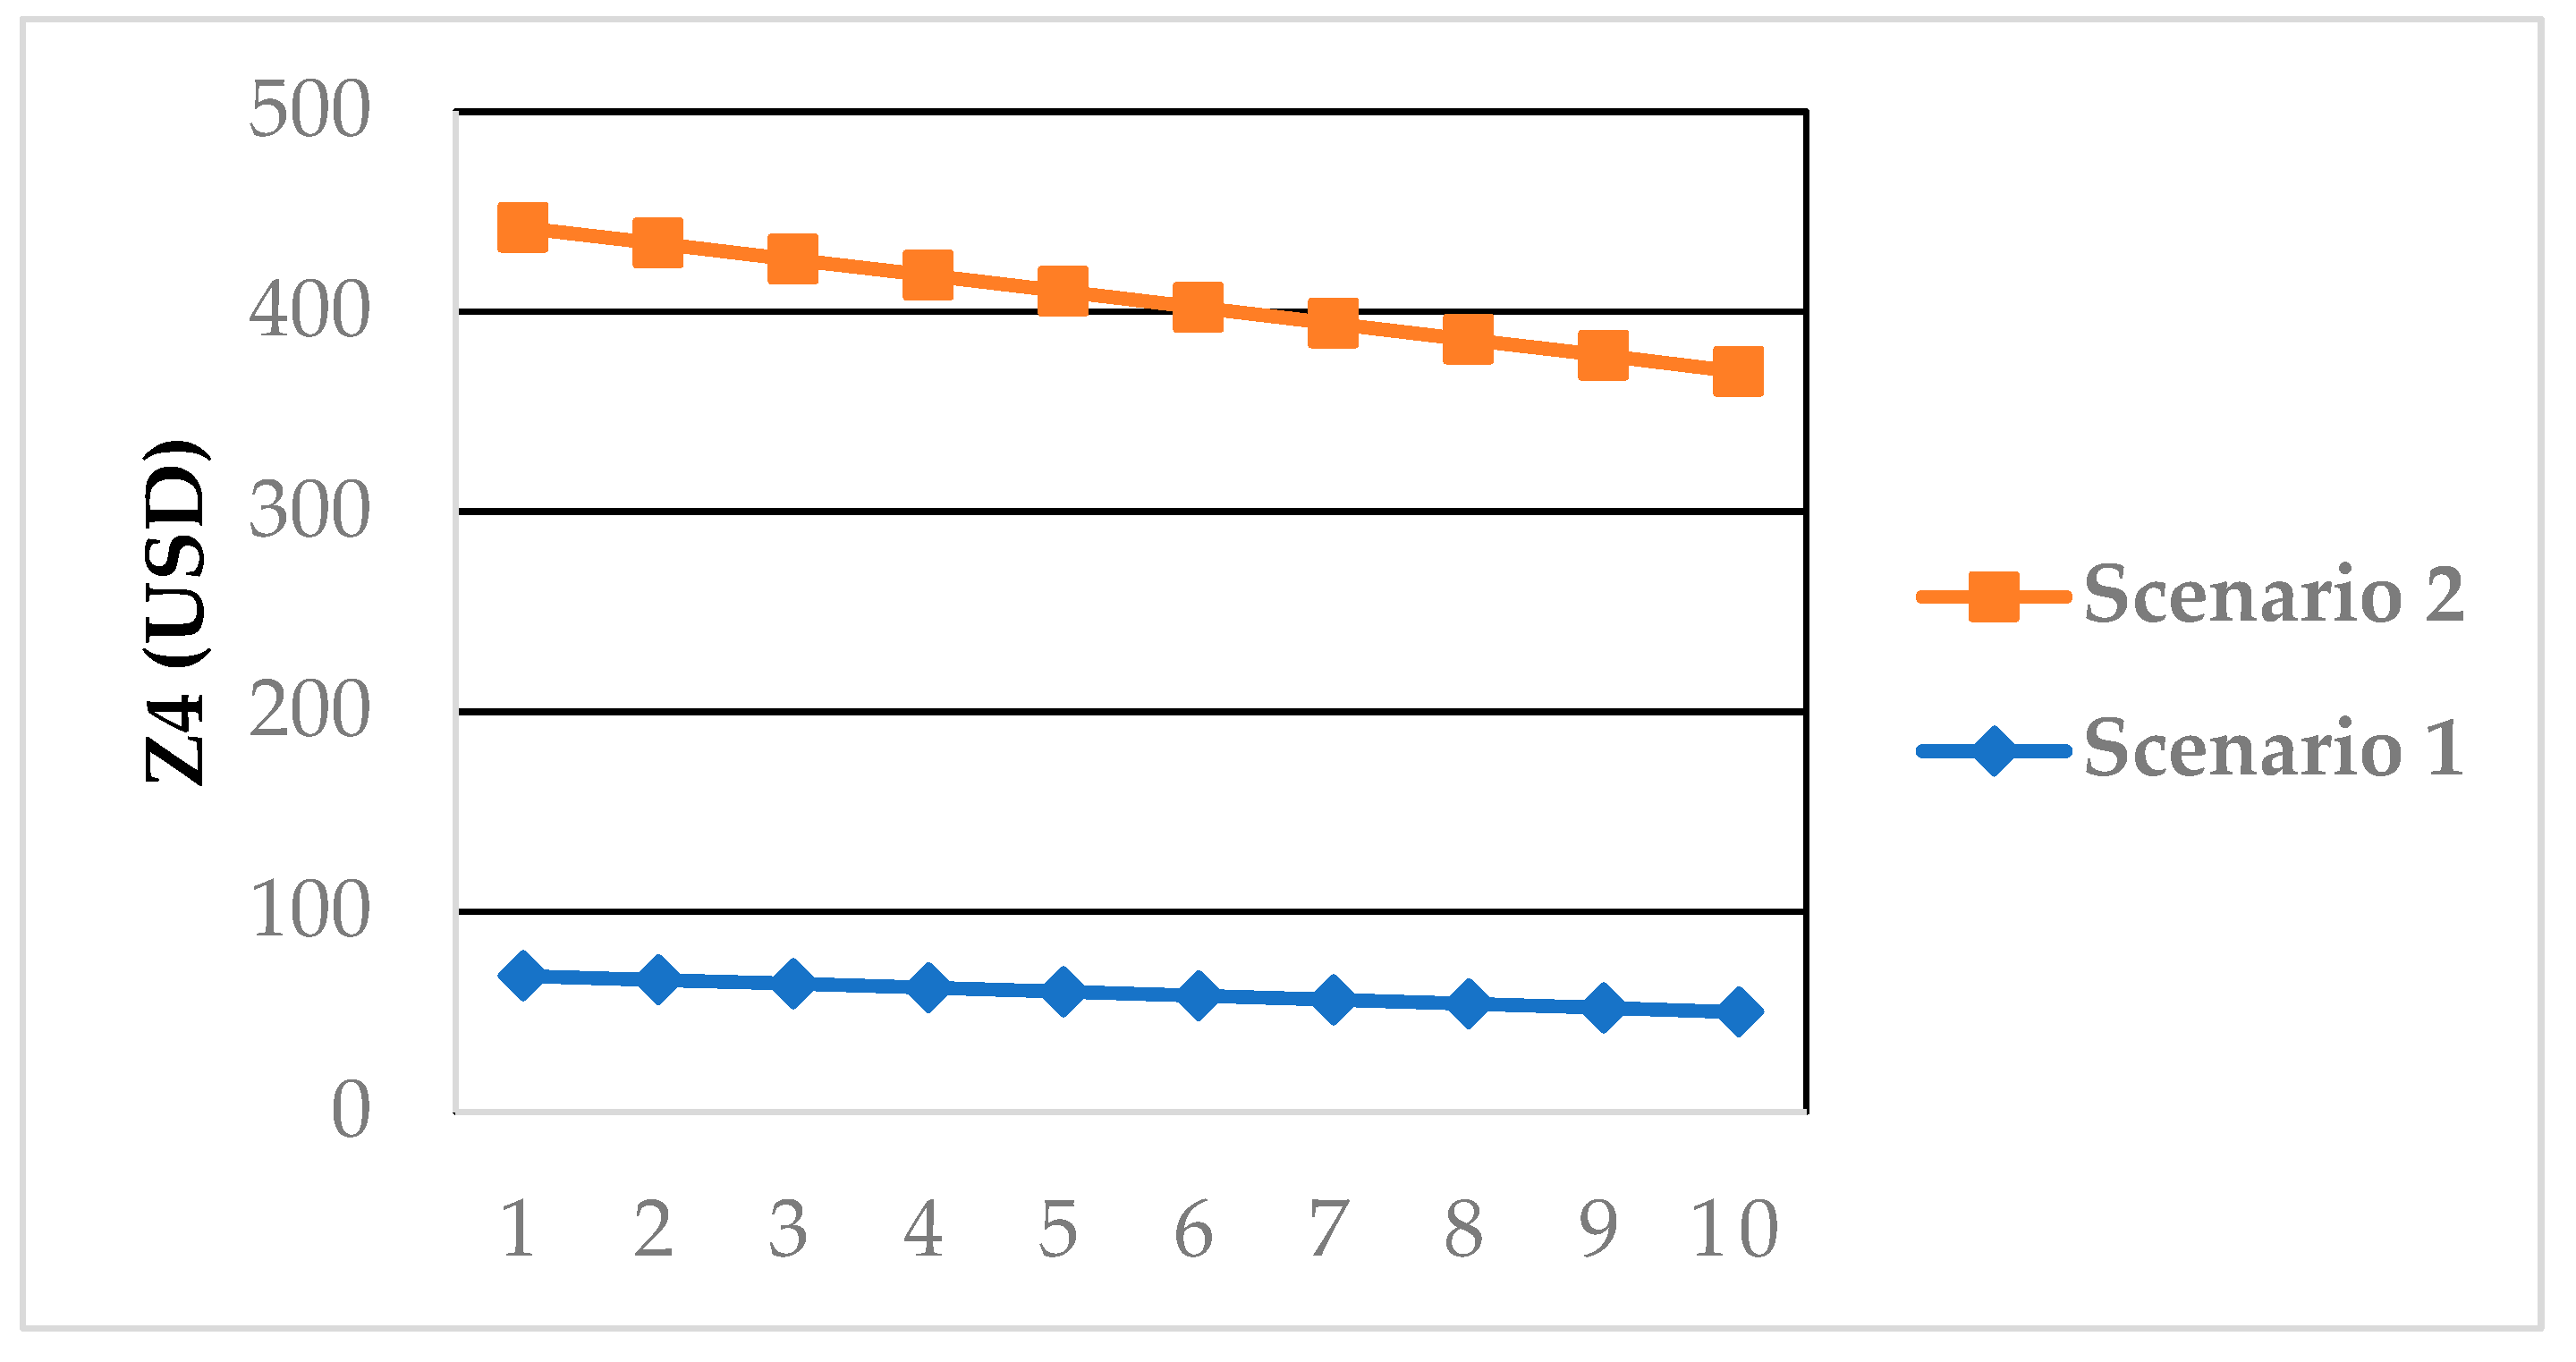
On the other hand, the quality costs shown in the fourth objective function Z4 significantly affect the employment of sensors. As shown in Table 7, in scenario 1, quality costs were USD 69.2. However, in scenario two, where sensors were not considered, quality costs significantly increased to USD 350.2. The primary difference between quality costs is justified by the advantage of using the heart rate sensor, which allows caregivers to service patients with critical conditions immediately, thereby ensuring 100% satisfaction from those patients (thus, zero poor service quality costs). Figure 8 shows the incurred quality costs in each scenario’s ten tested runs. However, the last column in Table 7 shows the energy consumed by the EV. In all scenarios, the amount of energy consumed while routing is almost the same; therefore, using sensors has no apparent effect on the energy consumed. By comparing battery capacity thresholds 50% and 20%, we can notice that the results are similar, with some minor differences because the heart rate values are generated randomly. However, reducing the battery capacity threshold to 20% might reduce the time to finish the tour because the frequency of visiting the charging stations is reduced.
Moreover, Table 8 illustrates the heart rate sensor for scenario 1, if one run is conducted. The values of the heart rates are generated randomly according to the sensor readings and the heart rates are defined as either critical or normal according to Equation (2). The results of this sensitivity analysis, especially those related to quality costs, proved the benefits of employing sensors that provide continuous data about patients’ conditions.

5.2. The Effect of Different Patient’s Priority Levels on Quality Costs

Four different scenarios were proposed to assess the impact of varying patient importance levels, which are as follows: (1) all patients have neutral importance levels, i.e., there is no priority given to any patient ( P R i = 1 ); (2) all patients possess low importance levels, i.e., priority levels are 1, 2, and 3, which correspond to non-urgent patients; (3) a combination of low and high importance levels are assumed in this scenario, where patients levels are uniformly distributed; and (4) all patients enjoy high importance levels, i.e., priority levels are 4 and 5, which correspond to urgent patients. Indeed, altering the patient’s importance levels and the priority in serving those patients will directly affect the total quality costs shown in the fourth objective function (Z4). Therefore, such a relationship must be analyzed carefully. In addition to costs, different priority levels result in different time windows of service and routing plans. As shown in Table 8, the four proposed scenarios of different patient importance (priority levels) are presented. These scenarios are presented along with the executed route, total quality cost of the route, average deviation from the desired time of service (triangular membership function), and the percentage of change between different scenarios. As expected, when relaxing the model from service priority levels, i.e.,   P R i = 1 , as shown in scenario 1, results showed the lowest quality costs compared to other scenarios (USD 127.8). Such results are justified by the absence of strict/hard time windows to service high-importance patients who will incur quality costs if not served urgently within the desired times. On the other hand, when assuming higher importance patients, the results yield quality costs of USD 372.9 as shown in scenario 2, with a 192% increase compared to the first scenario. However, in scenario three, the patients are assumed to follow a uniform distribution in terms of the priority of service, in a sense that different importance levels will be presented (i.e., 1–5), including urgent and non-urgent patients, as shown in Table 9, scenario 3 resulted in a USD 548.6 of quality costs with a 47% escalation compared to scenario 2. Finally, when all patients are assumed to enjoy high levels of importance, as shown in scenario 4, quality costs are increased by 23% compared to scenario 3, resulting in USD 677.2 in costs.
Moreover, Table 8 presents the resulting quality costs when changing the importance level. The explored relationship between patient importance levels and quality costs can be interpreted through the scheduled time windows of service, where patients of higher importance are prioritized with stricter time windows. In other words, as the time window becomes narrower, any deviation from the desired service time will incur higher costs compared to wider time windows due to the reduced margin of error. Note that the presented quality costs are strongly associated with the penalty of poor quality of service. Due to the lack of references to such parameters ( P e n q ) in the literature on the HHCVRP, it is assumed that USD 100 is the penalty for poor quality of service. Therefore, altering this value will result in different quality cost functions, possibly more realistic ones, if the above penalty is measured adequately.

6. Managerial Insights

In many countries where managing aging societies and HHC services is of great interest and concern, presenting simple HHC models with simplified objectives is neither feasible nor satisfactory. Therefore, this research developed an innovative and sustainable HHCVRP model that considers the patient’s condition and quality of service, employing technology to address the complexity of real-world applications and thus be prepared for practical implementation. Practicality requires a comprehensive model with multiple objectives and constraints that accurately simulate reality. Such a model can provide managerial insights that support decision-making. In this context, the results of the sensitivity analysis spotlight the benefits of implementing such an HHCVRP model. First and foremost, the findings demonstrate that utilizing BSNs offers significant value and advantages compared to not using these sensors. The main benefit is the significant reduction in quality costs when using heart rate sensors to monitor a patient’s health status. Indeed, serving patients immediately when an emergency occurs will improve the quality of service and result in satisfied and healthy patients.
Furthermore, no clear benefits were noticed related to other variables, such as time of travel and workload deviation costs, when using the proposed sensors. However, the trade-off between variables is inevitable in real-life practices. In addition, it is well-known that quality of service is critical, and any degradation in quality will result in many other incurred costs. Therefore, improving the quality of service associated with implementing the model is an advantage, even if it is related to extra travel time or overtime costs. Moreover, the results provide supportive suggestions for HHC companies to balance patient satisfaction and costs. Such suggestions may include allocating and grouping patients to combine different levels of importance (priority) to avoid a situation where satisfaction will cause significant costs since, in a typical HHC system, one caregiver (or more) is assigned to a group of patients. Finally, sufficient attention must be paid to the velocity of the EV due to its significant impact on the total routing solution compared to other objectives. Actions such as selecting the optimal route type to follow based on velocity and the resulting energy consumption rate of EVs will optimize the total solution further, although the use of EVs was due to its ability to save energy and protect the environment from GHGs.
Moreover, caution should be taken when implementing IoT technologies [54]. The heart rate sensor plays a significant role in the flow of the proposed model. However, it was assumed that the sensors were flawless and no risk to the functionality of these sensors was included in the model. Managers and decision-makers in the HHC sector might face several challenges, including issues related to data quality and accuracy and a lack of user awareness, fairness, accessibility, and data security [55,56]. On the other hand, this research considers patients with chronic heart conditions, since only heart rate sensors were integrated into the developed model. Note that different body sensors can incorporate additional physiological data, such as body temperature and blood pressure, which enhance the accuracy of patient status assessments. In addition, traffic volume is an essential factor in vehicle routing problems due to its impact on travel time, route efficiency, and service quality. However, we could not include these parameters in our study due to complexity and our dataset’s limitations, which might affect our findings’ generalizability. Several strategies for integrating IoT devices with the existing HHC systems have been suggested [57]. For instance, these approaches include seamless integration and interoperability, robust security and privacy measures, data analytics and real-time insights, and the ability to adapt to changing demands. Future work will aim to integrate these additional data points to improve the robustness and reliability of the patient status evaluation. According to Segura Anaya et al. [58], ethical issues arise when using wearable technology, such as privacy and security concerns. However, in this research, all ethical obligations are assumed to be met since the aim of using sensors is only measuring patients’ heart rates. In addition, it is believed that experienced medical professionals continuously monitor the algorithm’s performance.
The proposed mathematical model will help healthcare providers to develop efficient policies by integrating sustainability pillars into their strategies to obtain sustainable healthcare development in pursuit of sustainable development goal 3 (SDG3; good health and well-being). Rahat et al. [59] suggested incorporating the following practices: quality management, artificial intelligence, big data analytics, and sustainability. These essential and novel sustainability concepts need to be further investigated in healthcare performance worldwide.

7. Conclusions

In this research, an SSHHCVRP was developed to achieve the three pillars of sustainability for the well-being of patients, the environment, and profitable HHC companies. In addition, different levels of patient importance were considered and correlated with prioritizing more important patients for service. The importance of patients was determined solely based on their medical condition, where higher importance indicates a medically critical status that should be prioritized for service. Moreover, a novel approach was introduced, which includes a function that aims to measure and minimize the gap between expected and perceived quality of service. The expected part was measured using internal metrics (related to the time of service) by experts. Then, the degree to which the HHC service provider fulfilled these metrics determined the expected quality of service. The perceived quality of service was measured using a triangular membership function that calculated the deviation from the desired time of service. Despite all attempts to develop a realistic model that addresses real-life applications and complexities, some limitations may hinder its practicality. The challenges and constraints of BSNs were not considered, such as those debated by Hao and Foster [60]. For future research, this study could be extended and enhanced by adding caregivers’ driving behavior in terms of being risk-takers, risk-averse, or neutral. Such an approach was introduced into the VRP by Abu Al Hla et al. [61] and has not yet been considered in the HHCVRP. Moreover, to effectively explore the search space, introducing additional approaches such as multi-agent [62] or AI methods to incorporate certain uncertainty seems promising for future research. Future work could explore personalized healthcare solutions enabled by IoT, focusing on real-time health monitoring to improve patient outcomes.

Author Contributions

Conceptualization, A.R.A. and M.O.; methodology, M.O. and A.R.A.; software, A.R.A. and A.H.M.; validation, A.R.A.; formal analysis, A.H.M.; investigation, A.R.A. and A.A.Z.; resources, A.R.A.; data curation, A.A.Z. and A.H.M.; writing—original draft preparation, A.R.A.; writing—review and editing, M.O.; visualization, A.R.A. and M.O.; supervision, M.O.; project administration, M.O. and A.A.Z.; funding acquisition, A.A.Z. All authors have read and agreed to the published version of the manuscript.

Funding

This research received no external funding.

Data Availability Statement

Data are contained within the article.

Conflicts of Interest

The authors declare no conflicts of interest.

References

  1. Alves, F.; Costa, L.A.; Rocha, A.M.A.C.; Pereira, A.I.; Leitão, P. The Sustainable Home Health Care Process Based on Multi-Criteria Decision-Support. Mathematics 2023, 11, 6. [Google Scholar] [CrossRef]
  2. Oliveira, C.; Pereira, J.; Santos, E.; Lima, T.M.; Gaspar, P.D. Optimization of the COVID-19 vaccine distribution route using the vehicle routing problem with time windows model and capacity constraint. Appl. Syst. Innov. 2023, 6, 17. [Google Scholar] [CrossRef]
  3. Erdem, M.; Koç, Ç. Analysis of electric vehicles in home health care routing problem. J. Clean. Prod. 2019, 234, 1471–1483. [Google Scholar] [CrossRef]
  4. Fathollahi-Fard, A.M.; Hajiaghaei-Keshteli, M.; Tavakkoli-Moghaddam, R. A bi-objective green home health care routing problem. J. Clean. Prod. 2018, 200, 423–443. [Google Scholar] [CrossRef]
  5. Shi, Y.; Boudouh, T.; Grunder, O. A hybrid genetic algorithm for a home health care routing problem with time window and fuzzy demand. Expert Syst. Appl. 2017, 72, 160–176. [Google Scholar] [CrossRef]
  6. Fathollahi-Fard, A.M.; Govindan, K.; Hajiaghaei-Keshteli, M.; Ahmadi, A. A green home health care supply chain: New modified simulated annealing algorithms. J. Clean. Prod. 2019, 240, 118200. [Google Scholar] [CrossRef]
  7. Zhang, S.; Lee, C.K.M.; Choy, K.L.; Ho, W.; Ip, W.H. Design and development of a hybrid artificial bee colony algorithm for the environmental vehicle routing problem. Transp. Res. Part D Transp. Environ. 2014, 31, 85–99. [Google Scholar] [CrossRef]
  8. Gandhi, V.; Singh, J. An automated review of body sensor networks research patterns and trends. J. Ind. Inf. Integr. 2020, 18, 100132. [Google Scholar] [CrossRef]
  9. Bouleft, Y.; Elhilali Alaoui, A. Dynamic Multi-Compartment Vehicle Routing Problem for Smart Waste Collection. Appl. Syst. Innov. 2023, 6, 30. [Google Scholar] [CrossRef]
  10. Rout, R.R.; Vemireddy, S.; Raul, S.K.; Somayajulu, D.V.L.N. Fuzzy logic-based emergency vehicle routing: An IoT system development for smart city applications. Comput. Electr. Eng. 2020, 88, 106839. [Google Scholar] [CrossRef]
  11. Elkington, J. Cannibals with Forks: The Triple Bottom Line of 21st-Century Business; New Society Publishers: Gabriola Island, BC, Canada, 1998. [Google Scholar]
  12. Moghdani, R.; Salimifad, K.; Demir, E.; Benyettou, A. The green vehicle routing problem: A systematic literature review. J. Clean. Prod. 2021, 279, 123691. [Google Scholar] [CrossRef]
  13. Secundo, G.; Shams, S.M.R.; Nucci, F. Digital technologies and collective intelligence for healthcare ecosystem: Optimizing Internet of Things adoption for pandemic management. J. Bus. Res. 2021, 131, 563–572. [Google Scholar] [CrossRef] [PubMed]
  14. WCED. Report of the World Commission on Environment and Development: Our Common Future; WCED: Cape Town, South Africa, 1987. [Google Scholar]
  15. Vega-Mejía, C.A.; Montoya-Torres, J.R.; Islam, S.M.N. Consideration of triple bottom line objectives for sustainability in the optimization of vehicle routing and loading operations: A systematic literature review. Ann. Oper. Res. 2019, 273, 311–375. [Google Scholar] [CrossRef]
  16. Lin, C.; Choy, K.L.; Ho, G.T.S.; Chung, S.H.; Lam, H.Y. Survey of green vehicle routing problem: Past and future trends. Expert Syst. Appl. 2014, 41, 1118–1138. [Google Scholar] [CrossRef]
  17. Eslamipoor, R. A fuzzy multi-objective model for supplier selection to mitigate the impact of vehicle transportation gases and delivery time. J. Data Inf. Manag. 2022, 4, 231–241. [Google Scholar] [CrossRef]
  18. Bhinge, R.; Moser, R.; Moser, E.; Lanza, G.; Dornfeld, D. Sustainability optimization for global supply chain decision-making. Procedia CIRP 2015, 26, 323–328. [Google Scholar] [CrossRef]
  19. Seuring, S. A review of modeling approaches for sustainable supply chain management. Decis. Support Syst. 2013, 54, 1513–1520. [Google Scholar] [CrossRef]
  20. Yang, B.; Hu, Z.H.; Wei, C.; Li, S.Q.; Zhao, L.; Jia, S. Routing with time-windows for multiple environmental vehicle types. Comput. Ind. Eng. 2015, 89, 150–161. [Google Scholar] [CrossRef]
  21. Yan, T.; Lu, F.; Wang, S.; Wang, L.; Bi, H. A hybrid metaheuristic algorithm for the multi-objective location-routing problem in the early post-disaster stage. J. Ind. Manag. Optim. 2023, 19, 4663–4691. [Google Scholar] [CrossRef]
  22. Wang, X.; Fan, T.; Chen, M.; Deng, B.; Wu, B.; Tremont, P. Safety modeling of urban arterials in Shanghai, China. Accid. Anal. Prev. 2015, 83, 57–66. [Google Scholar] [CrossRef]
  23. Matl, P.; Hartl, R.F.; Vidal, T. Workload equity in vehicle routing problems: A survey and analysis. Transport. Sci. 2018, 52, 239–260. [Google Scholar] [CrossRef]
  24. Habibnejad-Ledari, H.; Rabbani, M.; Ghorbani-Kutenaie, N. Solving a multi-objective model toward home care staff planning considering cross-training and staff preferences by NSGA-II and NRGA. Sci. Iran. 2019, 26, 2919–2935. [Google Scholar] [CrossRef]
  25. Fernandez, A.; Gregory, G.; Hindle, A.; Lee, A.C. A Model for community nursing in a rural country. Oper. Res. Quart. 1974, 25, 231–239. [Google Scholar] [CrossRef]
  26. Ait Haddadene, S.R.; Labadie, N.; Prodhon, C. Bicriteria vehicle routing problem with preferences and timing constraints in home health care services. Algorithms 2019, 12, 152. [Google Scholar] [CrossRef]
  27. Fikar, C.; Hirsch, P. Home health care routing and scheduling: A review. Comput. Oper. Res. 2017, 77, 86–95. [Google Scholar] [CrossRef]
  28. Rest, K.D.; Hirsch, P. Daily scheduling of home health care services using time-dependent public transport. Flex. Serv. Manuf. J. 2016, 28, 495–525. [Google Scholar] [CrossRef]
  29. Shi, Y.; Boudouh, T.; Grunder, O. A robust optimization for a home health care routing and scheduling problem with consideration of uncertain travel and service times. Trasnport. Res. E-Log. 2019, 128, 52–95. [Google Scholar] [CrossRef]
  30. Doulabi, H.H.; Pesant, G.; Rousseau, L.M. Vehicle routing problems with synchronized visits and stochastic travel and service times: Applications in healthcare. Transport. Sci. 2020, 54, 1053–1072. [Google Scholar] [CrossRef]
  31. Hiermann, G.; Prandtstetter, M.; Rendl, A.; Puchinger, J.; Raidl, G.R. Metaheuristics for solving a multimodal home-healthcare scheduling problem. Cent. Eur. J. Oper. Res. 2015, 23, 89–113. [Google Scholar] [CrossRef]
  32. Expósito, A.; Brito, J.; Moreno, J.A.; Expósito-Izquierdo, C. Quality of service objectives for vehicle routing problem with time windows. Appl. Soft. Comput. 2019, 84, 105707. [Google Scholar] [CrossRef]
  33. Yang, Z.; Emmerich, M.; Bäck, T. Ant based solver for dynamic vehicle routing problem with time windows and multiple priorities. In Proceedings of the 2015 IEEE Congress on Evolutionary Computation (CEC), Sendai, Japan, 25–28 May 2015; pp. 2813–2819. [Google Scholar]
  34. Orlis, C.; Laganá, D.; Dullaert, W.; Vigo, D. Distribution with quality-of-service considerations: The capacitated routing problem with profits and service level requirements. Omega 2020, 93, 102034. [Google Scholar] [CrossRef]
  35. Khorshidi, H.A.; Hejazi, S.R. Optimising service quality translating via quantitative quality function deployment. Int. J. Serv. Stand. 2011, 7, 169–180. [Google Scholar] [CrossRef]
  36. Ghannadpour, S.F.; Zarrabi, A. Multi-objective heterogeneous vehicle routing and scheduling problem with energy minimizing. Swarm. Evol. Comput. 2019, 44, 728–747. [Google Scholar] [CrossRef]
  37. Albino, V.; Berardi, U.; Dangelico, R.M. Smart cities: Definitions, dimensions, performance, and initiatives. J. Urban Technol. 2015, 22, 3–21. [Google Scholar] [CrossRef]
  38. Mamun, M.A.A.; Hannan, M.A.; Hussain, A.; Basri, H. Theoretical model and implementation of a real time intelligent bin status monitoring system using rule-based decision algorithms. Expert Syst. Appl. 2016, 48, 76–88. [Google Scholar] [CrossRef]
  39. Hannan, M.A.; Akhtar, M.; Begum, R.A.; Basri, H.; Hussain, A.; Scavino, E. Capacitated vehicle-routing problem model for scheduled solid waste collection and route optimization using PSO algorithm. Waste Manag. 2018, 71, 31–41. [Google Scholar] [CrossRef] [PubMed]
  40. Ramos, T.R.P.; de Morais, C.S.; Barbosa-Póvoa, A.P. The smart waste collection routing problem: Alternative operational management approaches. Expert Syst. Appl. 2018, 103, 146–158. [Google Scholar] [CrossRef]
  41. Ding, Y.; Jin, M.; Li, S.; Feng, D. Smart logistics based on the internet of things technology: An overview. Int. J. Logist-Res. App. 2020, 24, 323–345. [Google Scholar] [CrossRef]
  42. Lai, X.; Liu, Q.; Wei, X.; Wang, W.; Zhou, G.; Han, G. A survey of body sensor networks. Sensors 2013, 13, 5406–5447. [Google Scholar] [CrossRef]
  43. Gope, P.; Hwang, T. BSN-Care: A secure IoT-based modern healthcare system using body sensor network. IEEE Sens. J. 2015, 16, 1368–1376. [Google Scholar] [CrossRef]
  44. Hosseini-Nasab, H.; Lotfalian, P. Green routing for trucking systems with classification of path types. J. Clean. Prod. 2017, 146, 228–233. [Google Scholar] [CrossRef]
  45. Avram, R.; Tison, G.H.; Aschbacher, K.; Kuhar, P.; Vittinghoff, E.; Butzner, M.; Runge, R.; Wu, N.; Pletcher, M.J.; Marcus, G.M.; et al. Real-world heart rate norms in the Health eHeart study. NPJ Digit. Med. 2019, 2, 58. [Google Scholar] [CrossRef]
  46. Lu, F.; Chen, W.; Feng, W.; Bi, H. 4PL Routing Problem Using Hybrid Beetle Swarm Optimization. Soft Comput. 2023, 27, 17011–17024. [Google Scholar] [CrossRef]
  47. Lu, F.; Feng, W.; Gao, M.; Bi, H.; Wang, S. The Fourth-Party Logistics Routing Problem Using Ant Colony System-Improved Grey Wolf Optimization. J. Adv. Transp. 2020, 2020, e8831746. [Google Scholar] [CrossRef]
  48. Dorigo, M.; Di Caro, G. The Ant Colony Optimization meta-heuristic, In New Ideas in Optimization; Corne, D., Dorigo, M., Glover, F., Dasgupta, D., Moscato, P., Poli, R., Price, K.V., Eds.; McGraw Hill: London, UK, 1999; pp. 11–32. [Google Scholar]
  49. Rader, D.J. Deterministic Operations Research: Models and Methods in Linear Optimization; John Wiley & Sons: Hoboken, NJ, USA, 2010. [Google Scholar]
  50. Deb, K.; Agrawal, S.; Pratap, A.; Meyarivan, T. A fast elitist non-dominated sorting genetic algorithm for multi-objective optimization: NSGA-II. In Parallel Problem Solving from Nature PPSN VI; Schoenauer, M., Deb, K., Rudolph, G., Yao, X., Lutton, E., Merelo, J.J., Schwefel, H.-P., Eds.; Springer: Berlin/Heidelberg, Germany, 2000; pp. 849–858. [Google Scholar] [CrossRef]
  51. Statista Research Department. Predicted Average Battery Capacities in EVs Worldwide 2017–2025. 2018. Available online: https://www.statista.com/statistics/309584/battery-capacity-estimates-for-electric-vehicles-worldwide/. (accessed on 10 December 2022).
  52. Younes, Z.; Boudet, L.; Suard, F.; Gérard, M.; Rioux, R. Analysis of the Main Factors Influencing the Energy Consumption of Electric Vehicles. In Proceedings of the 2013 International Electric Machines & Drives Conference, Chicago, IL, USA, 12–15 May 2013; pp. 247–253. [Google Scholar] [CrossRef]
  53. Kostopoulos, E.D.; Spyropoulos, G.C.; Kaldellis, J.K. Real-world study for the optimal charging of electric vehicles. Energy Rep. 2020, 6, 418–426. [Google Scholar] [CrossRef]
  54. Izu, L.; Scholtz, B.; Fashoro, I. Wearables and Their Potential to Transform Health Management: A Step towards Sustainable Development Goal 3. Sustainability 2024, 16, 1850. [Google Scholar] [CrossRef]
  55. Canali, S.; Schiaffonati, V.; Aliverti, A. Challenges and recommendations for wearable devices in digital health: Data quality, interoperability, health equity, fairness. PLOS Digit. Health 2022, 1, e0000104. [Google Scholar] [CrossRef]
  56. Nizetic, S.; Solic, P.; Gonzalez-de-Artaza, D.L.; Patrono, L. Internet of Things (IoT): Opportunities, issues and challenges towards a smart and sustainable future. J. Clean. Prod. 2020, 274, 122877. [Google Scholar] [CrossRef]
  57. Li, C.; Wang, J.; Wang, S.; Zhang, Y. A review of IoT applications in healthcare. Neurocomputing 2024, 565, 127017. [Google Scholar] [CrossRef]
  58. Segura Anaya, L.H.; Alsadoon, A.; Costadopoulos, N.; Prasad, P.W.C. Ethical Implications of User Perceptions of Wearable Devices. Sci. Eng. Ethics 2018, 24, 1–28. [Google Scholar] [CrossRef]
  59. Rahat, N.; Sahni, S.; Nasim, S. Mapping sustainability practices in the healthcare sector: A systematic literature review and future research agenda. Int. J. Consum. Stud. 2024, 48, e12997. [Google Scholar] [CrossRef]
  60. Hao, Y.; Foster, R. Wireless body sensor networks for health-monitoring applications. Physiol. Meas. 2008, 29, R27. [Google Scholar] [CrossRef]
  61. Abu Al Hla, Y.; Othman, M.; Saleh, Y. Optimizing an eco-friendly vehicle routing problem model using regular and occasional drivers integrated with driver behavior control. J. Clean. Prod. 2019, 234, 984–1001. [Google Scholar] [CrossRef]
  62. Di Mascolo, M.; Martinez, C.; Espinouse, M.L. Routing and scheduling in home health care: A literature survey and bibliometric analysis. Comput. Ind. Eng. 2021, 158, 107255. [Google Scholar] [CrossRef]
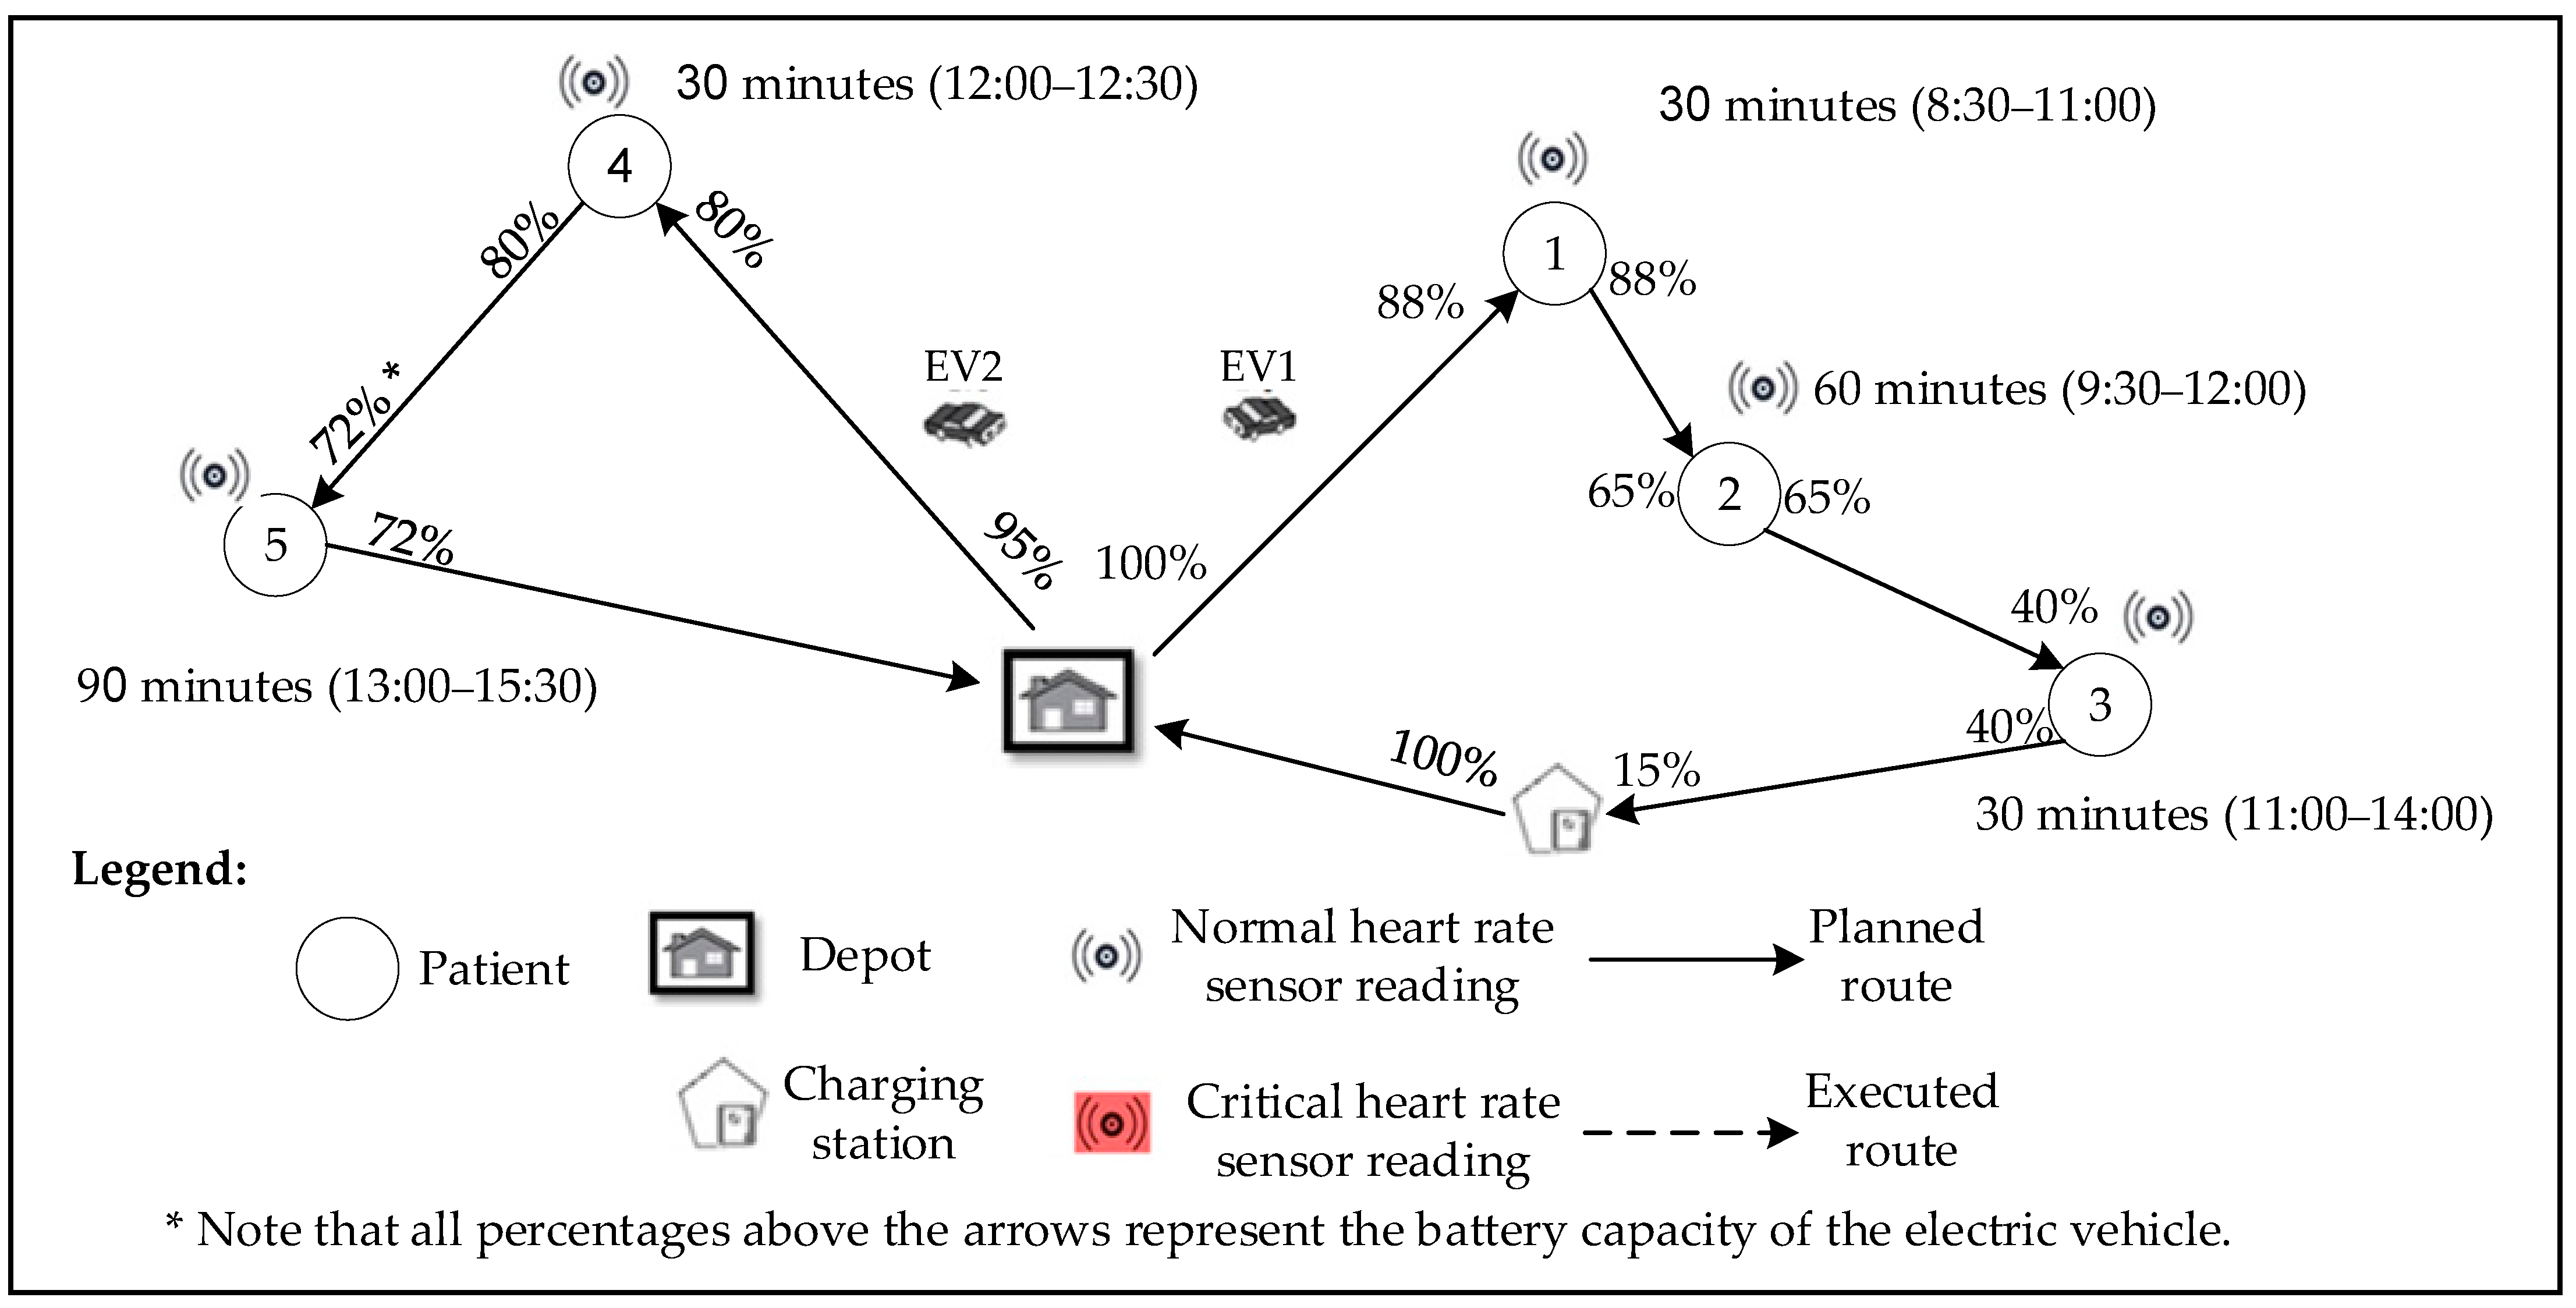
Figure 1. The proposed HHCVRP for patients with normal conditions (source: authors).
Logistics 08 00075 g001
Figure 2. The proposed HHCVRP for patients with critical conditions (source: authors).
Logistics 08 00075 g002
Figure 3. Crowding distance process [50].
Logistics 08 00075 g003
Figure 4. ACO algorithm flowchart for the proposed SSHHCVRP (source: authors).
Logistics 08 00075 g004
Figure 5. NS-ACO flowchart [48].
Logistics 08 00075 g005
Figure 6. NS-ACO algorithm in pseudo code (source: authors).
Logistics 08 00075 g006
Figure 7. Near-optimal route for the developed SSHHCVRP model (source: authors).
Logistics 08 00075 g007
Figure 8. The difference in quality costs between the two proposed scenarios (source: authors).
Logistics 08 00075 g008
Table 1. Numerical data used in the proposed SSHHCVRP model.
ParameterValue
d i s i j r U [10,50] km
V E L i j r U [1120] km/h
λ k ≥0.1
Y k 43 kWh
Y k Threshold50%
C O h d $30 per hour.
P e n q $100
P R i 1,2 , 3,4 , 5
l o a d h d 8 h
O h d ≤10 h
Table 2. Characteristics of each route.
Route Type r = 1 r = 2 r = 3 r = 4
V r (km/h) [44]305580120
Maximum d i s i j r (km) [44]10203050
λ k (kWh/km) [52]0.140.120.100.13
Table 3. Near-optimal route results with arrival/departure times and battery status.
Source NodeDestination Node Patient s   Condition   H R Arrival   Time   a t i (h) Departure   Time   b i (h) Battery   Status   y i k (kWh)
1218:519:0334.30
24-9:139:5332.62
46-10:2210:5230.22
614-11:4012:1224.76
149112:3412:4623.64
913113:2014:3021.24
1315-15:0415:3443.00
151-16:08-38.45
15-8:408:5238.32
510-9:149:2637.62
108-10:1910:3131.77
812111:0911:3329.07
123112:0512:1726.91
311-13:0113:1921.06
1116-13:5314:2543.00
167-15:0215:1738.71
71-15:48-33.51
Table 4. Near-optimal values of the model parameters and variables.
Source NodeDestination NodeEnergy Consumption (kWh) Route   Type   ( r ) V E L i j r (Km/h) s i j r (h)
122.703730:20
241.682670:29
462.402560:56
6145.4641030:22
1491.121220:34
9132.403720:30
13152.603900:32
1514.5541020:39
151.681270:22
5100.702590:54
1085.854950:38
8122.703780:32
1232.163810:44
3115.854960:34
11165.241000:36
1674.2941080:34
715.24900:28
Table 5. Workload deviation results and costs.
Driver 1Route124614913151-Deviation from avg. workload (h)0:08
Arrival time-8:519:1310:2211:4012:3413:2015:0416:08-Total cost (USD)4
Departure time8:129:039:5310:5212:1212:4614:3015:34--Total working hours (h)8:08
Driver 2Route15108123111671Deviation from avg. workload (h)0:12
Arrival time-8:409:1410:1911:0912:0513:0113:5315:0215:48Total cost (USD)6
Departure time8:128:529:2610:3111:3312:1713:1914:2515:17-Total working hours (h)7:48
Driver 1Route187941115351Deviation from avg. workload (h)1:05
Arrival time-8:399:0110:4711:1412:3713:4015:2016:0517:05Total cost (USD)33
Departure time8:128:5110:2710:5912:0513:0214:1515:4516:33-Total working hours (h)9:05
Driver 2Route11012214613161-Deviation from avg. workload (h)0:22
Arrival time-8:309:1010:0210:4712:0813:4014:4015:38-Total cost (USD)11
Departure time8:128:499:3710:2711:4013:1014:1015:10--Total working hours (h)7:38
Table 6. Patient satisfaction and quality costs.
Patient’s NodeUrgent/Non-Urgent H R P R i a t i ω i u ' i e i l i μ i ( t i ) S a t . e x p q Quality Costs
2Urgent148:510:068:458:309:00100%80%0
4Urgent049:130:019:159:009:3093%86%0
6Non-urgent0310:220.0910:3010:0010:4573%85%36
14Urgent0411:400.0211:4511:3012:0080%75%0
9Non-urgent1212:340:0312:3012:1513:00100%86%0
13Non-urgent1313:200:0613:3013:0013:45100%84%0
5Non-urgent028:400:038:458:309:1586%80%0
10Non-urgent029:140:089:159:009:4577%86%18
8Urgent0510:190:0610:3010:1510:3067%75%40
12Non-urgent1211:090:0511:1510:4511:30100%84%0
3Urgent1412:050:0412:0011:4512:15100%70%0
11Non-urgent0313:010:0313:0012:3013:1573%90%51
7Non-urgent0115:020:0115:0014:4515:3090%75%0
Table 7. Sensitivity analysis on the employment of heart rate sensor.
Y k ThresholdSenserZ1 (h)Z2 (km/h)Z3 (USD)Z4 (USD)Energy Consumption (kWh/km)
Scenario 1 (20–80%) [53]Yes8:3982.316.869.248.6
Scenario 2 (20–80%) [53]No8:0895.615.9350.248.9
Scenario 3 (50%) Yes9:1378.319.969.248.2
Scenario 4 (50%)No8:5193.716.9375.249.8
Table 8. Heart rate sensor detailed data for scenario 1.
PatientE (BPM) (20–80%)HR
1700
21151
3830
4620
5990
61051
7680
8401
9760
101181
Table 9. The effect of different patient’s importance levels on the quality cost function.
Experiment NumberPatient’s Importance LevelRouteZ4 (USD) Avg .   μ i ( t i ) Percentage of Change in Z4 (%)
Scenario 11EV1: 25497615
EV2: 31310812161411
127.886%-
Scenario 21,2,3EV1: 531241015
EV2: 147913681611
372.983%192%
Scenario 31,2,3,4,5EV1: 2531241015
EV2: 147913681611
548.681%47%
Scenario 44,5EV1: 2125391513
EV2: 104117815614
677.280%23%
Disclaimer/Publisher’s Note: The statements, opinions and data contained in all publications are solely those of the individual author(s) and contributor(s) and not of MDPI and/or the editor(s). MDPI and/or the editor(s) disclaim responsibility for any injury to people or property resulting from any ideas, methods, instructions or products referred to in the content.