
Quick-Response Model for Pre- and Post-Disaster Evacuation and Aid Distribution: The Case of the Tula River Flood Event

 ,
,  ,
, 

Abstract
1. Introduction
1.1. Problem Statement
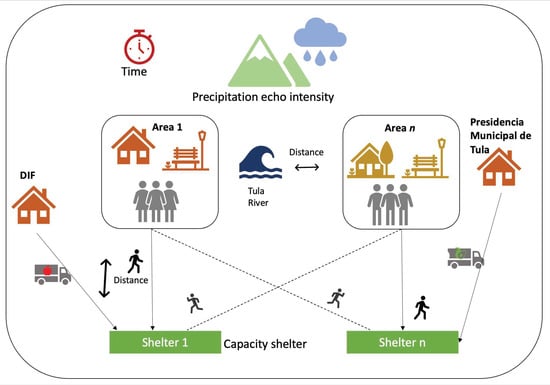
1.2. Problem Description
- A simple decision-making model is proposed.
- Real demographic and social data are employed.
- Consideration is given to the most vulnerable individuals, specifically those over 60 years of age and people with physical disabilities.
- Both the pre- and post-disaster stages are taken into account.
2. Literature Review
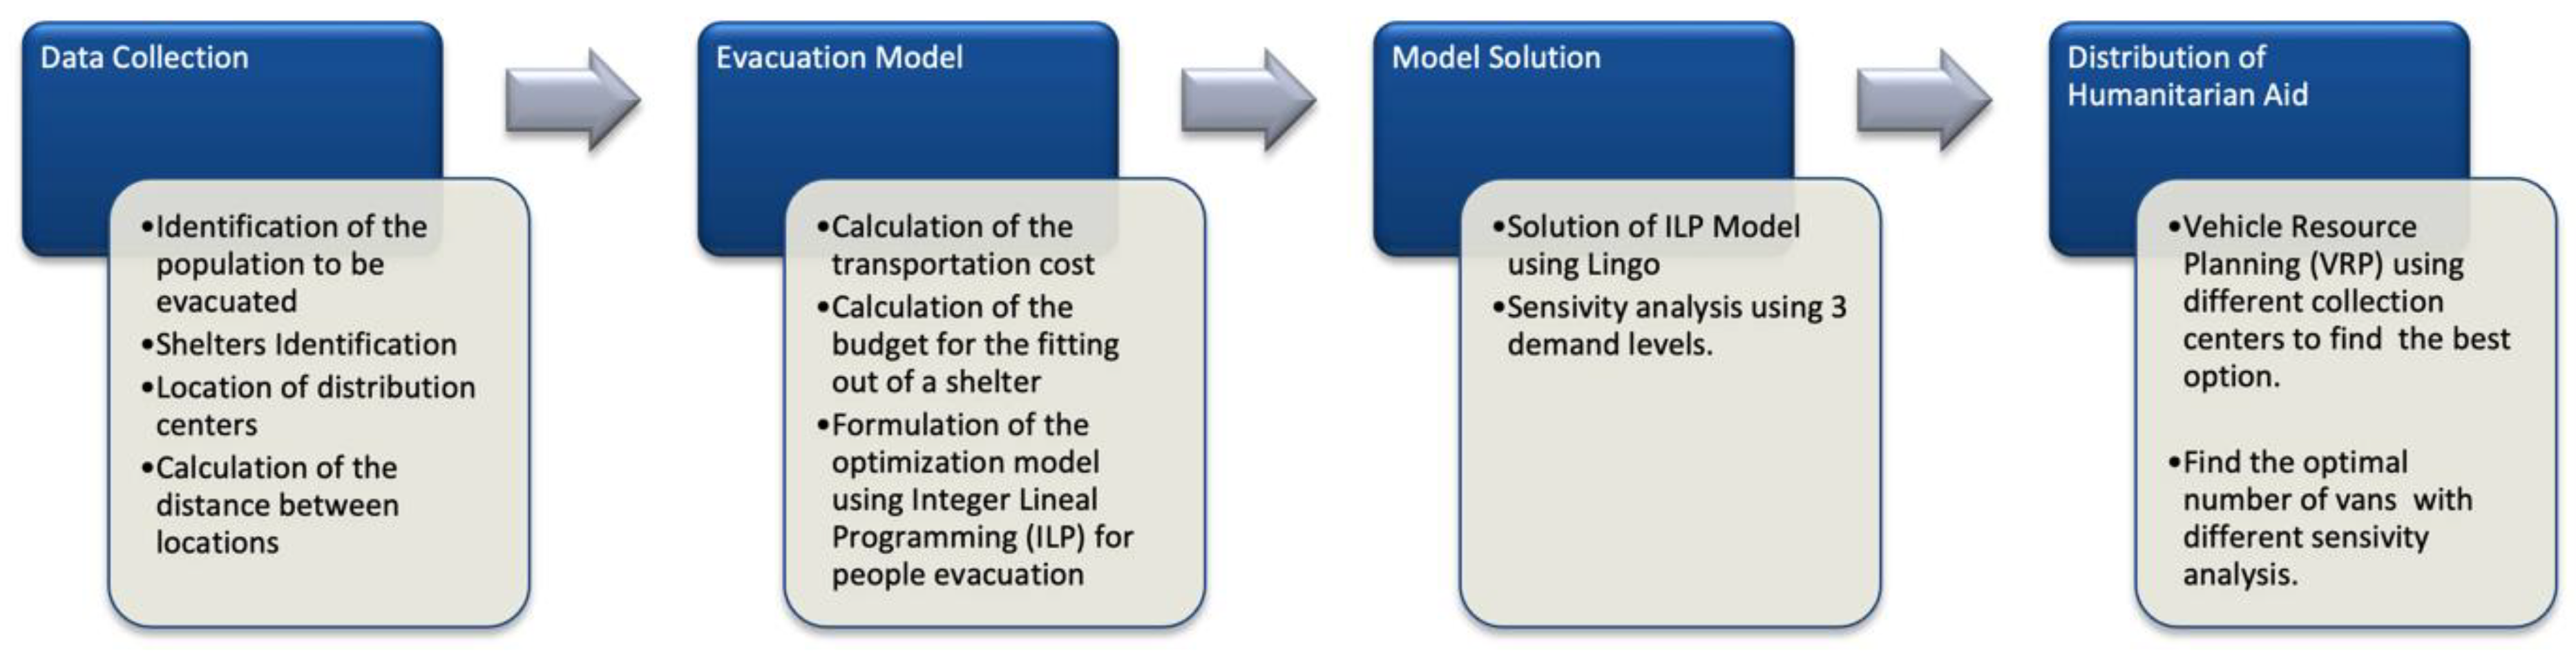
3. Research Methodology
3.1. Data Collection
3.2. Evacuation Model
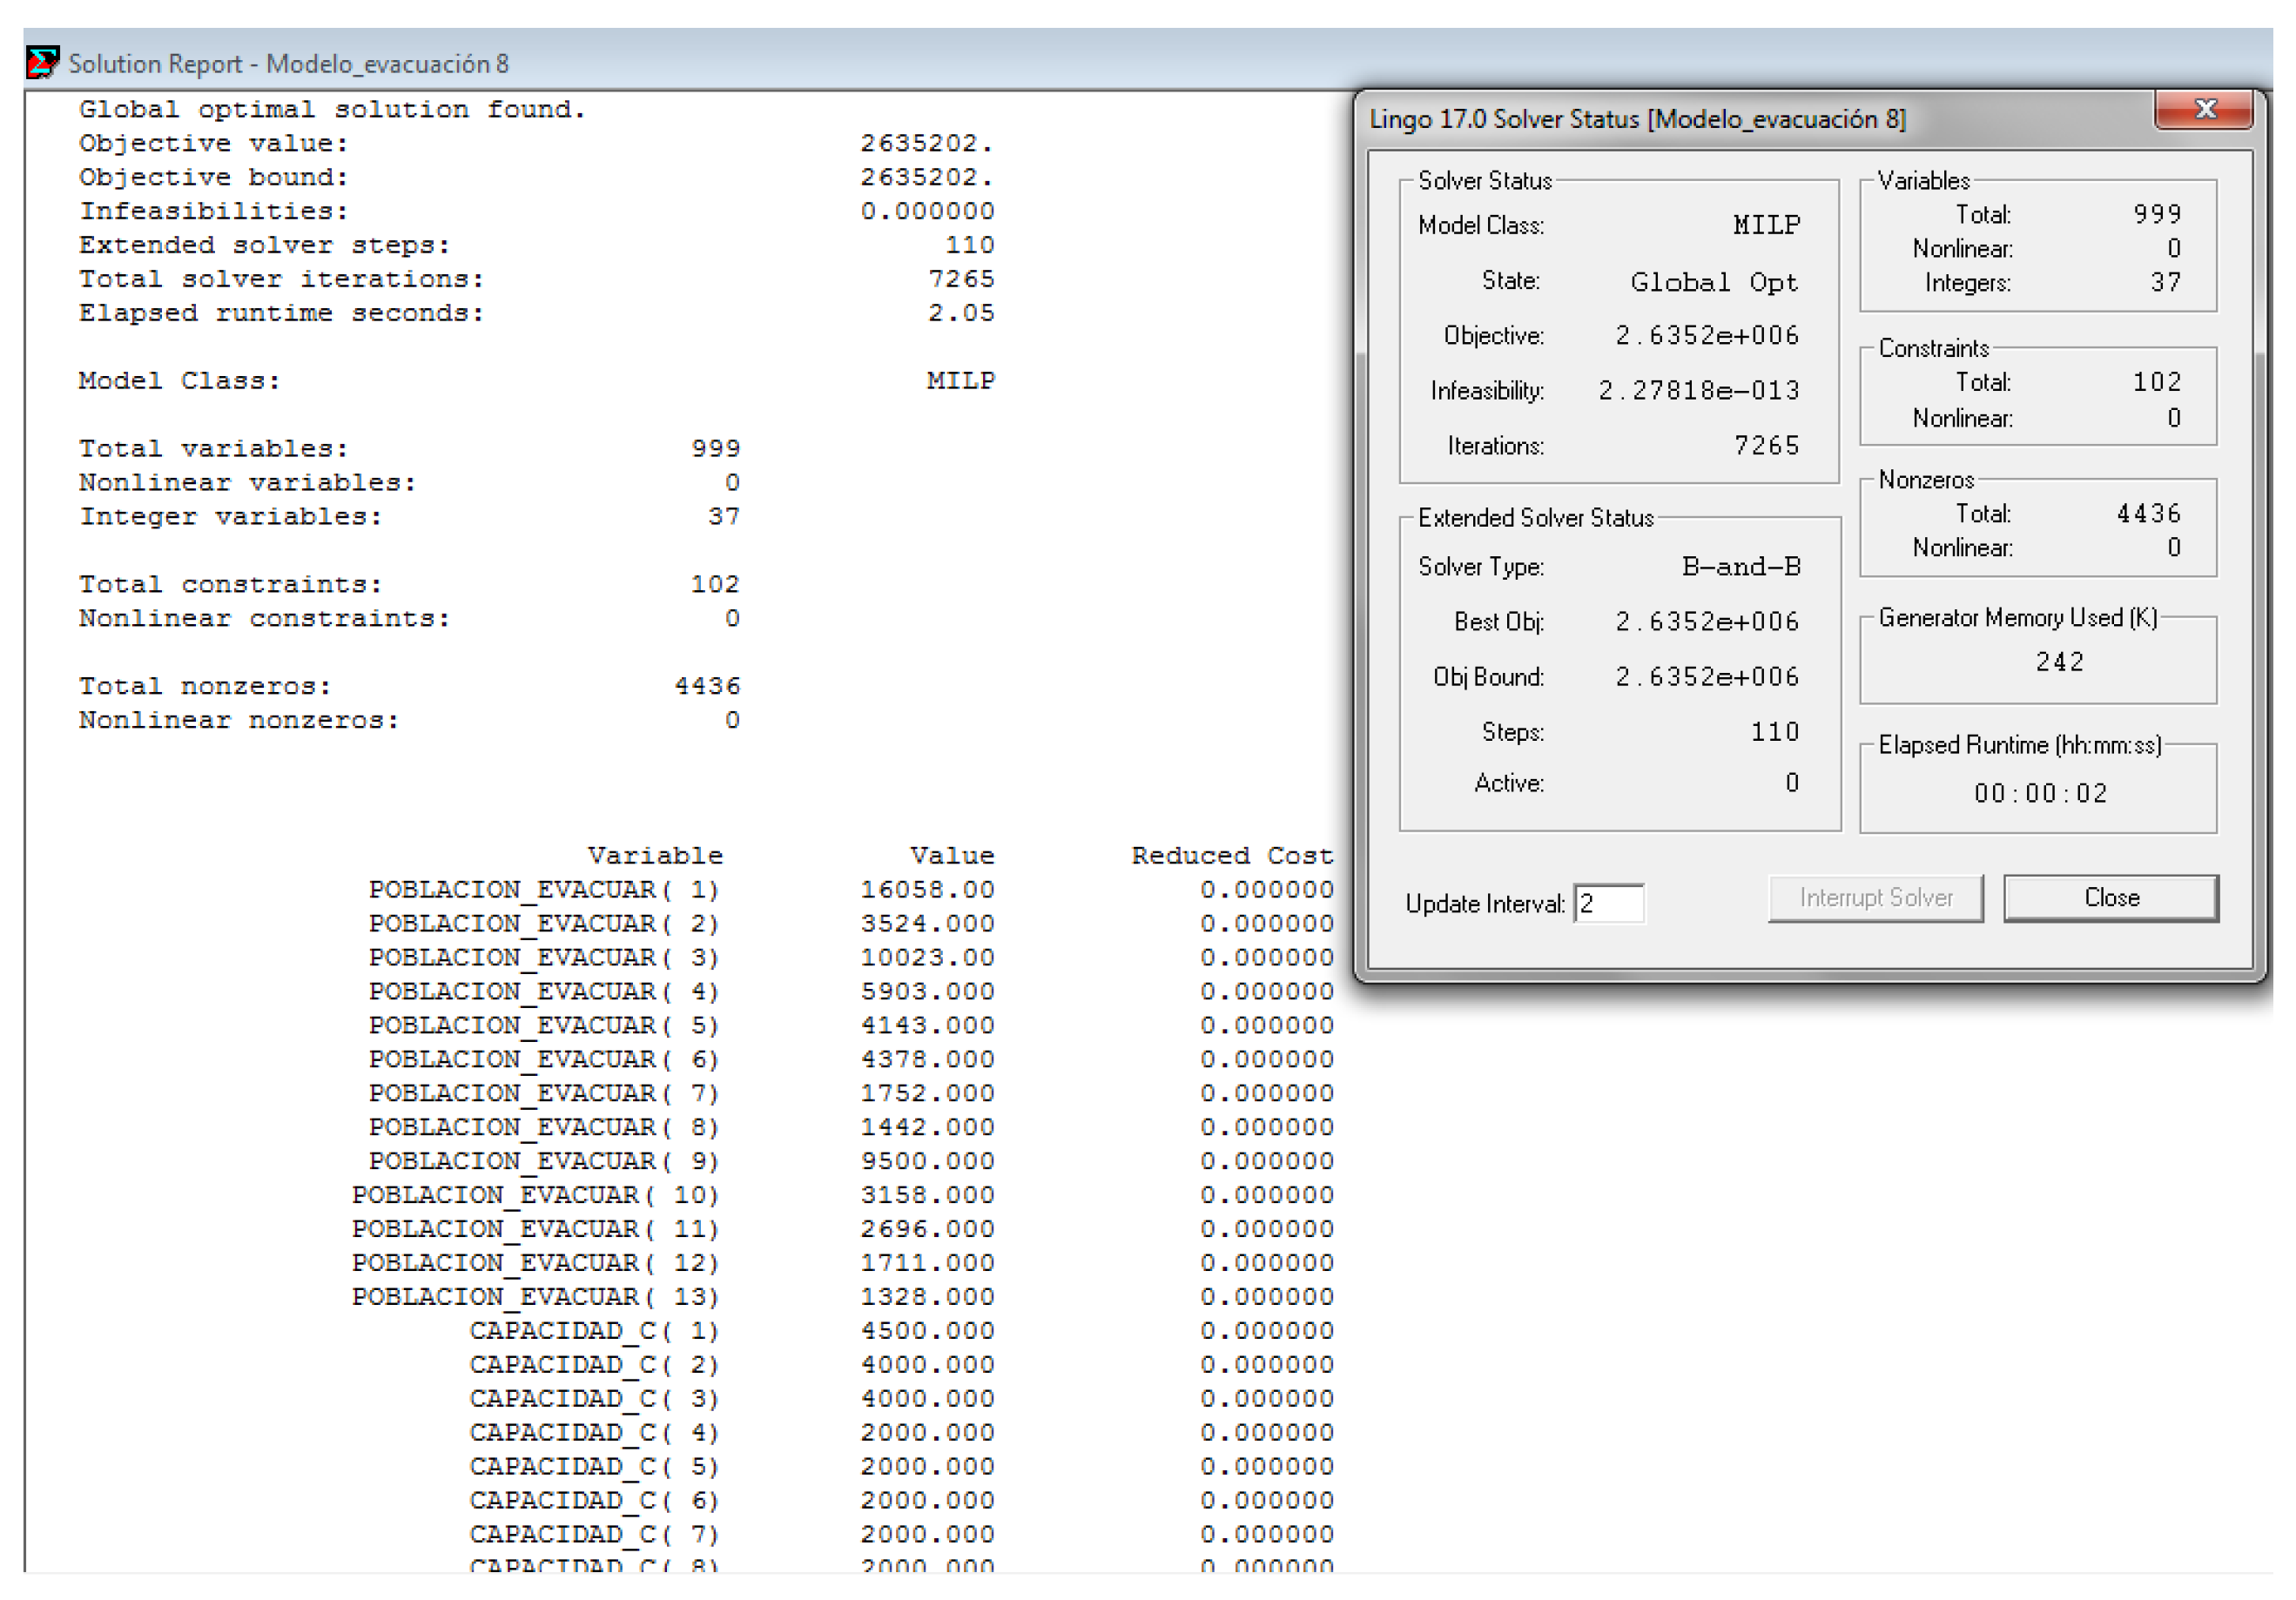
3.3. Model Solution
3.4. Distribution of Humanitarian Aid
4. Results
4.1. Evacuation Model
4.2. Evacuation Time and Vans Required
5. Conclusions
Author Contributions
Funding
Data Availability Statement
Conflicts of Interest
Appendix A

| Municipality | Property Name | Occupant Capacity |
|---|---|---|
| Alfajayucan | Bachillerato Alfajayucan TES | 2000 |
| Apaxco | Escuela Primaria Lázaro Cárdenas del Rio | 2000 |
| Escuela Angel Gabriel | 2000 | |
| Atitalaquia | Escuela Primaria Urbana General Ma. Anaya | 2000 |
| Escuela Primaria Amado Nervo | 2000 | |
| Atotonilco de Tula | Escuela Primaria General Primero de Mayo | 2000 |
| Escuela Secundaria General Felipe Ángeles | 2000 | |
| Escuela Secundaria Técnica No. 58 | 2000 | |
| Colegio de Bachillerato del Estado de Hidalgo | 2000 | |
| Ixmiquilpan | Escuela Primaria Miguel Hidalgo Loma Hidalgo México | 2000 |
| Escuela Primaria General Ignacio Zaragoza | 2000 | |
| Escuela Primaria Francisco I. Madero | 2000 | |
| Escuela Secundaria General Libertadores de America | 2000 | |
| Escuela Primaria “Teniente Juan de la Barrera” | 2000 | |
| Mixquiahuala | Escuela Primaria Urbana General Ma. Anaya | 2000 |
| Escuela Primaria Amado Nervo | 2000 | |
| Tasquillo | Escuela Primaria Alvaro Obregón | 2000 |
| Tepeji del Río | Escuela Primaria Maria Angeles | 2000 |
| Escuela Melchor Ocampo (Morelos) | 2000 | |
| Escuela Melchor Ocampo (Tlaxinacalpan) | 2000 | |
| Escuela Primaria Lázaro Cárdenas | 2000 | |
| Colegio Simón Bolívar | 2000 | |
| Iglesia Cristiana Maranatha | 2000 | |
| Tezontepec | Escuela Secundaria General Niños Heroes | 2000 |
| Tlahuelilpan | Escuela Primaria Urbana General Ford 72 | 2000 |
| Tlaxcoapan | Escuela Primaria Pedro Ma. Anaya | 2000 |
| Tula | Unidad Deportiva de Tula | 4500 |
| Auditorio Municipal de Tula | 4000 | |
| Auditorio Infonavit San Marcos | 4000 | |
| Escuela Primaria Francisco Sarabia | 2000 | |
| Capilla Parroquia Sagrado Corazón de Jesús | 2000 | |
| Catedral de Tula (San José) | 2000 | |
| Escuela Primaria Benito Juarez | 2000 | |
| Escuela Primaria Miguel Hidalgo y Costilla | 2000 | |
| Zimapán | Escuela Primaria Club de leones | 2000 |
| Escuela Secundaria General Joséfa Bustamante | 2000 |
| Item | Unit Price | Amount | Total |
|---|---|---|---|
| Portable toilets | MXN 2500.00 | 2 | MXN 5000.00 |
| Portable sink | MXN 800.00 | 3 | MXN 2400.00 |
| Semi-industrial kitchen | MXN 1600.00 | 1 | MXN 1600.00 |
| Aluminum saucepan | MXN 1200.00 | 3 | MXN 3600.00 |
| Aluminum pot | MXN 900.00 | 2 | MXN 1800.00 |
| Basic utensils | MXN 500.00 | 1 | MXN 500.00 |
| Plastic sink | MXN 1200.00 | 3 | MXN 3600.00 |
| Hostel mattresses | MXN 1500.00 | 60 | MXN 90,000.00 |
| Bedspreads and blankets | MXN 150.00 | 60 | MXN 9000.00 |
| Trash bins | MXN 1400.00 | 5 | MXN 7000.00 |
| Installation of tents | MXN 6249.00 | 3 | MXN 18,747.00 |
| Tables | MXN 1300.00 | 3 | MXN 3900 |
| Total | MXN 159,147.00 |
| Presidency | 3 h | 5 h | 8 h | ||||||
|---|---|---|---|---|---|---|---|---|---|
| 10% Less | Average | 10% More | 10% Less | Average | 10% More | 10% Less | Average | 10% More | |
| Tula | 73 | 88 | 160 | 44 | 53 | 96 | 28 | 33 | 60 |
| Tezontepec | 46 | 46 | 61 | 28 | 28 | 37 | 18 | 18 | 23 |
| Tepeji | 79 | 104 | 123 | 48 | 63 | 74 | 30 | 39 | 46 |
| Atotonilco de Tula | 41 | 52 | 55 | 25 | 31 | 33 | 16 | 20 | 21 |
| Atitalaquia | 52 | 44 | 50 | 31 | 27 | 30 | 20 | 17 | 19 |
| Mixquiahuala | 59 | 74 | 87 | 35 | 45 | 53 | 22 | 28 | 33 |
| Tlaxcoapan | 37 | 37 | 37 | 22 | 22 | 22 | 14 | 14 | 14 |
| Tlahuelilpan | 7 | 16 | 36 | 5 | 10 | 22 | 3 | 6 | 14 |
| Ixmiquilpan | 170 | 202 | 223 | 102 | 121 | 134 | 64 | 76 | 84 |
| Apaxco | 24 | 30 | 32 | 14 | 18 | 20 | 9 | 12 | 12 |
| Zimapán | 28 | 0 | 0 | 17 | 0 | 0 | 11 | 0 | 0 |
| Tasquillo | 0 | 0 | 3 | 0 | 0 | 2 | 0 | 0 | 2 |
| Alfajayucan | 0 | 0 | 0 | 0 | 0 | 0 | 0 | 0 | 0 |
| Total vans | 616 | 693 | 867 | 371 | 418 | 523 | 235 | 263 | 328 |
| Difference with average | −11.1% | +25.11% | −11.24% | +25.12% | −10.65% | +24.71% | |||
| Vehicle: | V1 | Stops: | 12 | Net Profit: | −6607.80 | |||
|---|---|---|---|---|---|---|---|---|
| Stop Count | Location Name | Distance Travelled | Driving Time | Arrival Time | Departure Time | Working Time | Profit Collected | Load |
| 0 | Gobierno del Estado | 0.00 | 0.00 | 08:00 | 0.00 | 0 | 24,500 | |
| 1 | Escuela Primaria Pedro Ma. Anaya | 74.33 | 1:02 | 9:02 | 09:02 | 1:02 | 0 | 22,500 |
| 2 | Prepa Fray Diego de Rodríguez | 79.13 | 1:14 | 9:14 | 09:14 | 1:14 | 0 | 20,500 |
| 3 | Escuela Primaria Adolfo López Mateos | 80.14 | 1:17 | 9:17 | 09:17 | 1:17 | 0 | 18,500 |
| 4 | Escuela Primaria Francisco Sarabia | 82.49 | 1:24 | 9:24 | 09:24 | 1:24 | 0 | 16,500 |
| 5 | Catedral de Tula | 97.02 | 1:49 | 9:49 | 09:49 | 1:49 | 0 | 14,500 |
| 6 | Unidad Deportiva de Tula | 98.62 | 1:54 | 9:54 | 09:54 | 1:54 | 0 | 10,000 |
| 7 | Escuela Primaria General 1ro de Mayo | 115.28 | 2:18 | 10:18 | 10:18 | 2:18 | 0 | 8000 |
| 8 | Colegio de Bachilleres del Estado de Hidalgo | 117.32 | 2:24 | 10:24 | 10:24 | 2:24 | 0 | 6000 |
| 9 | Escuela Secundaria General Felipe Ángeles | 118.10 | 2:27 | 10:27 | 10:27 | 2:27 | 0 | 4000 |
| 10 | Escuela Secundaria Técnica No.58 | 120.39 | 2:34 | 10:34 | 10:34 | 2:34 | 0 | 2000 |
| 11 | Escuela Primaria Lázaro Cárdenas del Rio | 127.41 | 2:50 | 10:50 | 10:50 | 2:50 | 0 | 0 |
| 12 | Gobierno del Estado | 194.18 | 4:03 | 12:03 | 4:03 | 0 | 0 |
| Vehicle: | V2 | Stops: | 14 | Net Profit: | −7652.10 | |||
|---|---|---|---|---|---|---|---|---|
| Stop Count | Location Name | Distance Travelled | Driving Time | Arrival Time | Departure Time | Working Time | Profit Collected | Load |
| 0 | DIF Hidalgo | 0.00 | 0:00 | 08:00 | 0:00 | 0 | 24,927 | |
| 1 | Escuela Primaria Amado Nervo | 63.41 | 1:15 | 09:15 | 09:15 | 1:15 | 0 | 22,927 |
| 2 | Escuela Primaria Urbana General Ma. Anaya | 67.67 | 1:25 | 09:25 | 09:25 | 1:25 | 0 | 20,927 |
| 3 | Escuela Secundaria General Niños Héroes | 79.84 | 1:45 | 09:45 | 09:45 | 1:45 | 0 | 18,927 |
| 4 | Escuela Primaria Urbana General Ford 72 | 81.76 | 1:51 | 09:51 | 09:51 | 1:51 | 0 | 16,927 |
| 5 | Bachillerato Alfajayucan TES | 128.09 | 3:01 | 11:01 | 11:01 | 3:01 | 0 | 14,995 |
| 6 | Escuela Primaria Álvaro Obregón | 144.88 | 3:36 | 11:36 | 11:36 | 3:36 | 0 | 12,995 |
| 7 | Escuela Secundaria General Josefa Bustamante | 177.57 | 4:20 | 12:20 | 12:20 | 4:20 | 0 | 10,995 |
| 8 | Escuela Primaria Club de Leones | 178.06 | 4:22 | 12:22 | 12:22 | 4:22 | 0 | 10,000 |
| 9 | Escuela Primaria Francisco I. Madero | 226.92 | 5:28 | 13:28 | 13:28 | 5:28 | 0 | 8000 |
| 10 | Escuela Primaria Teniente Juan de la Barrera | 228.03 | 5:31 | 13:31 | 13:31 | 5:31 | 0 | 6000 |
| 11 | Escuela Primaria Miguel Hidalgo Loma México | 228.05 | 5:31 | 13:31 | 13:31 | 5:31 | 0 | 4000 |
| 12 | Escuela Secundaria General Libertadores de América | 231.17 | 5:40 | 13:40 | 13:40 | 5:40 | 0 | 2000 |
| 13 | Escuela Primaria General Ignacio Zaragoza | 240.45 | 6:03 | 14:03 | 14:03 | 6:03 | 0 | 0 |
| 14 | DIF Hidalgo | 320.30 | 7:40 | 15:40 | 7:40 | 0 | 0 |
| Vehicle: | V3 | Stops: | 11 | Net Profit: | −5386.58 | |||
|---|---|---|---|---|---|---|---|---|
| Stop Count | Location Name | Distance Travelled | Driving Time | Arrival Time | Departure Time | Working Time | Profit Collected | Load |
| 0 | Presidencia de Tula | 0.00 | 0:00 | 08:00 | 0:00 | 0 | 23,478 | |
| 1 | Auditorio Municipal de Tula | 1.45 | 0:05 | 08:05 | 08:05 | 0:05 | 0 | 19,478 |
| 2 | Escuela Primaria Miguel Hidalgo y Costilla | 2.46 | 0:09 | 08:09 | 08:09 | 0:09 | 0 | 17,478 |
| 3 | Escuela Primaria Benito Juárez | 3.85 | 0:14 | 08:14 | 08:14 | 0:14 | 0 | 15,478 |
| 4 | Colegio Simón Bolivar | 22.16 | 0:49 | 08:49 | 08:49 | 0:49 | 0 | 13,478 |
| 5 | Escuela Primaria Lázaro Cárdenas | 22.90 | 0:52 | 08:52 | 08:52 | 0:52 | 0 | 11,478 |
| 6 | Escuela Primaria María Ángeles | 23.56 | 0:54 | 08:54 | 08:54 | 0:54 | 0 | 9478 |
| 7 | Iglesia Cristiana Maranatha | 25.66 | 1:00 | 09:00 | 09:00 | 1:00 | 0 | 7478 |
| 8 | Escuela Melchor Ocampo | 28.36 | 1:08 | 09:08 | 09:08 | 1:08 | 0 | 5478 |
| 9 | Escuela Primaria Francisco Sarabia, Pueblo Nuevo | 37.69 | 1:24 | 09:24 | 09:24 | 1:24 | 0 | 4000 |
| 10 | Auditorio Infonavit San Marcos | 43.51 | 1:39 | 09:39 | 09:39 | 1:39 | 0 | 0 |
| 11 | Presidencia de Tula | 46.69 | 1:49 | 09:49 | 1:49 | 0 | 0 |
| Vehicle: | V1 | Stops: | 14 | Net Profit: | −7652.10 | |||
|---|---|---|---|---|---|---|---|---|
| Stop Count | Location Name | Distance Travelled | Driving Time | Arrival Time | Departure Time | Working Time | Profit Collected | Load |
| 0 | DIF Hidalgo | 0.00 | 0:00 | 08:00 | 0:00 | 0 | 24,927 | |
| 1 | Escuela Primaria Amado Nervo | 63.41 | 1:15 | 9:15 | 09:15 | 1:15 | 0 | 22,927 |
| 2 | Escuela Primaria Urbana General Ma. Anaya | 67.67 | 1:25 | 9:25 | 09:25 | 1:25 | 0 | 20,927 |
| 3 | Escuela Secundaria General Niños Héroes | 79.84 | 1:45 | 09:45 | 09:45 | 1:45 | 0 | 18,927 |
| 4 | Escuela Primaria Urbana General Ford 72 | 81.76 | 1:51 | 09:51 | 09:51 | 1:51 | 0 | 16,927 |
| 5 | Bachillerato Alfajayucan TES | 128.09 | 3:01 | 11:01 | 11:01 | 3:01 | 0 | 14,995 |
| 6 | Escuela Primaria Álvaro Obregón | 144.88 | 3:36 | 11:36 | 11:36 | 3:36 | 0 | 12,995 |
| 7 | Escuela Secundaria General Josefa Bustamante | 177.57 | 4:20 | 12:20 | 12:20 | 4:20 | 0 | 10,995 |
| 8 | Escuela Primaria Club de Leones | 178.06 | 4:22 | 12:22 | 12:22 | 4:22 | 0 | 10,000 |
| 9 | Escuela Primaria Francisco I. Madero | 226.92 | 5:28 | 13:28 | 13:28 | 5:28 | 0 | 8000 |
| 10 | Escuela Primaria Teniente Juan de la Barrera | 228.03 | 5:31 | 13:31 | 13:31 | 5:31 | 0 | 6000 |
| 11 | Escuela Primaria Miguel Hidalgo Loma México | 228.05 | 5:31 | 13:31 | 13:31 | 5:31 | 0 | 4000 |
| 12 | Escuela Secundaria General Libertadores de América | 231.17 | 5:40 | 13:40 | 13:40 | 5:40 | 0 | 2000 |
| 13 | Escuela Primaria General Ignacio Zaragoza | 240.45 | 6:03 | 14:03 | 14:03 | 6:03 | 0 | 0 |
| 14 | DIF Hidalgo | 320.30 | 7:40 | 15:40 | 7:40 | 0 | 0 |
| Vehicle: | V2 | Stops: | 11 | Net Profit: | −5399.32 | |||
|---|---|---|---|---|---|---|---|---|
| Stop Count | Location Name | Distance Travelled | Driving Time | Arrival Time | Departure Time | Working Time | Profit Collected | Load |
| 0 | Presidencia de Tula | 0.00 | 0:00 | 08:00 | 0:00 | 0 | 23,978 | |
| 1 | Auditorio Infonavit San Marcos | 3.08 | 0:09 | 08:09 | 08:09 | 0:09 | 0 | 19,978 |
| 2 | Escuela Primaria Francisco Sarabia, Pueblo Nuevo | 8.82 | 0:25 | 08:25 | 08:25 | 0:25 | 0 | 18,500 |
| 3 | Colegio Simón Bolivar | 20.78 | 0:46 | 08:46 | 08:46 | 0:46 | 0 | 16,500 |
| 4 | Escuela Primaria Lázaro Cárdenas | 21.52 | 0:49 | 08:49 | 08:49 | 0:49 | 0 | 14,500 |
| 5 | Escuela Primaria María Ángeles | 22.17 | 0:51 | 08:51 | 08:51 | 0:51 | 0 | 12,500 |
| 6 | Iglesia Cristiana Maranatha | 24.28 | 0:57 | 08:57 | 08:57 | 0:57 | 0 | 10,500 |
| 7 | Escuela Melchor Ocampo | 26.98 | 1:05 | 09:05 | 09:05 | 1:05 | 0 | 8500 |
| 8 | Escuela Primaria Benito Juárez | 43.43 | 1:37 | 09:37 | 09:37 | 1:37 | 0 | 6500 |
| 9 | Escuela Primaria Miguel Hidalgo y Costilla | 45.13 | 1:42 | 09:42 | 09:42 | 1:42 | 0 | 4500 |
| 10 | Unidad Deportiva de Tula | 47.45 | 1:50 | 09:50 | 09:50 | 1:50 | 0 | 0 |
| 11 | Presidencia de Tula | 48.23 | 1:54 | 09:54 | 1:54 | 0 | 0 |
| Vehicle: | V3 | Stops: | 12 | Net Profit: | −5560.40 | |||
|---|---|---|---|---|---|---|---|---|
| Stop Count | Location Name | Distance Travelled | Driving Time | Arrival Time | Departure Time | Working Time | Profit Collected | Load |
| 0 | Presidencia de Tula | 0.00 | 0:00 | 08:00 | 0:00 | 0 | 24,000 | |
| 1 | Auditorio Municipal de Tula | 1.45 | 0:05 | 08:05 | 08:05 | 0:05 | 0 | 20,000 |
| 2 | Catedral de Tula | 1.75 | 0:06 | 08:06 | 08:06 | 0:06 | 0 | 18,000 |
| 3 | Escuela Primaria Pedro Ma. Anaya | 17.52 | 0:32 | 08:32 | 08:32 | 0:32 | 0 | 16,000 |
| 4 | Prepa Fray Diego de Rodríguez | 22.32 | 0:44 | 08:44 | 08:44 | 0:44 | 0 | 14,000 |
| 5 | Escuela Primaria Adolfo López Mateos | 23.34 | 0:47 | 08:47 | 08:47 | 0:47 | 0 | 12,000 |
| 6 | Escuela Primaria Francisco Sarabia | 25.68 | 0:54 | 08:54 | 08:54 | 0:54 | 0 | 10,000 |
| 7 | Escuela Primaria General 1ro de Mayo | 31.29 | 1:08 | 09:08 | 09:08 | 1:08 | 0 | 8000 |
| 8 | Colegio de Bachilleres del Estado de Hidalgo | 33.33 | 1:14 | 09:14 | 09:14 | 1:14 | 0 | 6000 |
| 9 | Escuela Secundaria Técnica no.58 | 35.06 | 1:19 | 09:19 | 09:19 | 1:19 | 0 | 4000 |
| 10 | Escuela Primaria Lázaro Cárdenas del Rio | 42.08 | 1:35 | 09:35 | 09:35 | 1:35 | 0 | 2000 |
| 11 | Escuela Secundaria General Felipe Ángeles | 51.18 | 1:55 | 09:55 | 09:55 | 1:55 | 0 | 0 |
| 12 | Presidencia de Tula | 67.68 | 2:19 | 10:19 | 2:19 | 0 | 0 |
References
- Organización de la Naciones Unidas. Los Desastres son la Nueva Normalidad. Available online: https://news.un.org/es/interview/2019/11/1465021 (accessed on 20 October 2023).
- Statista Research Department. Annual Number of Natural Disaster Events Globally from 2007 to 2021. Available online: https://www.statista.com/statistics/510959/number-of-natural-disasters-events-globally/ (accessed on 15 September 2023).
- Statista Research Department. Countries with the Most Natural Disasters in 2021. 2022. Available online: https://www.statista.com/statistics/269652/countries-with-the-most-natural-disasters/ (accessed on 12 September 2023).
- UNOCHA. Most Common Natural Disasters in Latin America and the Caribbean from 2000 to 2019. 2023. Available online: https://0-www-statista-com.biblioteca-ils.tec.mx/statistics/1140110/number-natural-disasters-type-latin-america/ (accessed on 10 September 2023).
- Chiappetta, C.J.; Sobreiro, V.A.; de Sousa Jabbour, A.B.L.; Campos, L.M.S.; Mariano, E.B.; Renwick, D.W.S. An analysis of the literature on humanitarian logistics and supply chain management: Paving the way for future studies. Ann. Oper. Res. 2019, 283, 289–307. [Google Scholar] [CrossRef]
- Hezam, I.M.; Nayeem, M.K. A Systematic Literature Review on Mathematical Models of Humanitarian Logistics. Symmetry 2020, 13, 11. [Google Scholar] [CrossRef]
- Nunes, R.M.S.; Pereira, S.C.F. Intellectual structure and trends in the humanitarian operations field. Ann. Oper. Res. 2022, 319, 1099–1157. [Google Scholar] [CrossRef]
- Witkowski, J.; Marcinkowski, J. Initiators and motives for cooperation in humanitarian supply chains. LogForum 2022, 18, 263–274. [Google Scholar] [CrossRef]
- Repík, D.; Foltin, P. Applications of Performance Indicators for Optimization of Humanitarian Chains. LogForum 2022, 18, 495–504. [Google Scholar] [CrossRef]
- Shafiq, M.; Soratana, K. Humanitarian Logistics and Supply Chain Management-A Qualitative Study. LogForum 2019, 15, 19–38. [Google Scholar] [CrossRef]
- Habib, M.S.; Lee, Y.H.; Memon, M.S. Mathematical models in humanitarian supply chain management: A systematic literature review. Math. Probl. Eng. 2016, 2016, 3212095. [Google Scholar] [CrossRef]
- Zhang, L.; Cui, N. Humanitarian logistics and emergency relief management: Hot perspectives and its optimization approach, 5th International Conference on Advances in Energy. J. Environ. Chem. 2021, 245, 03036. [Google Scholar] [CrossRef]
- Santana-Robles, F.; Hernández-Gress, E.S.; Hernández-Gress, N.; Granillo-Macias, R. Metaheuristics in the Humanitarian Supply Chain. Algorithms 2021, 14, 364. [Google Scholar] [CrossRef]
- Baou, E.; Koutras, V.P.; Zeimpekis, V.; Minis, I. Emergency evacuation planning in natural disasters under diverse population and fleet characteristics. J. Humanit. Logist. Supply Chain Manag. 2018, 8, 447–476. [Google Scholar] [CrossRef]
- Seraji, H.; Tavakkoli-Moghaddam, R.; Soltani, R. A two-stage mathematical model for evacuation planning and relief logistics in a response phase. Int. J. Ind. Syst. 2019, 12, 129–146. Available online: https://www.jise.ir/article_76547.html#ar_info_pnl_cite (accessed on 20 October 2023).
- Zhu, L.; Gong, Y.; Xu, Y.; Gu, Y. Emergency relief routing models for injured victims considering equity and priority. Ann. Oper. 2019, 283, 1573–1606. [Google Scholar] [CrossRef]
- Nayeri, S.; Tavakkoli-Moghaddam, R.; Sazvar, Z.; Heydari, J. Solving an Emergency Resource Planning Problem with Deprivation Time by a Hybrid MetaHeuristic Algorithm. J. Qual. Eng. Prod. Optim. 2020, 5, 65–86. [Google Scholar] [CrossRef]
- Mansoori, S.; Bozorgi-Amiri, A.; Pishvaee, M.S. A robust multi-objective humanitarian relief chain network design for earthquake response, with evacuation assumption under uncertainties. Neural Comput. Appl. 2020, 32, 2183–2203. [Google Scholar] [CrossRef]
- Infobae. El Agua Sigue Subiendo: 17 Muertos en IMSS de Tula, Hidalgo Por Desbordamiento. 2022. Available online: https://www.infobae.com/america/mexico/2021/09/07/el-agua-sigue-subiendo-al-menos-10-muertos-en-imss-en-tula-hidalgo-por-lluvias-y-desbordamiento-de-rios/ (accessed on 15 March 2023).
- El Universal. Mueren 17 Hospitalizados Por Inundación en Tula, Hidalgo. Available online: https://www.eluniversal.com.mx/estados/mueren-17-hospitalizados-por-inundacion-en-tula-hidalgo (accessed on 10 April 2023).
- Infobae. MCCI: Damnificados de la Inundación en Tula Denunciaron Negligencia, Corrupción y Apoyos Insuficientes. 2022. Available online: https://www.infobae.com/america/mexico/2022/05/25/mcci-damnificados-de-la-inundacion-en-tula-denunciaron-negligencia-corrupcion-y-apoyos-insuficientes/ (accessed on 15 April 2023).
- Instituto Mexicano de Tecnología del Agua. Hacia una Gestión de las Aguas Urbanas Basada en la Naturaleza, Perspectivas IMTA. Available online: https://www.gob.mx/imta/articulos/hacia-una-gestion-de-las-aguas-urbanas-basada-en-la-naturaleza?idiom=es (accessed on 20 May 2023).
- Escobar, C. Las inundaciones en el Valle del Mezquital: Un síntoma de los límites de la ingeniería convencional. Perspect. IMTA 2021, 36, 1. [Google Scholar] [CrossRef]
- Mollah, A.K.; Sadhukhan, S.; Das, P.; Anis, M.Z. A cost optimization model and solutions for shelter allocation and relief distribution in flood scenario. IJDRR Int. J. Disaster Risk Reduct. 2018, 31, 1187–1198. [Google Scholar] [CrossRef]
- Babaei, A.; Shahanaghi, K. A Novel Algorithm for Identifying and Analyzing Humanitarian Relief Logistics Problems: Studying Uncertainty on the Basis of Interaction with the Decision Maker. Process. Integr. Optim. Sustain. 2018, 2, 27–45. [Google Scholar] [CrossRef]
- Molina, J.; López, A.; Hernández, A.; Martínez, I. A Multi-start Algorithm with Intelligent Neighborhood Selection for solving multi-objective humanitarian vehicle routing problems. J. Heuristics 2017, 24, 111–133. [Google Scholar] [CrossRef]
- Jha, A.; Acharya, D.; Tiwari, M.K. Humanitarian relief supply chain: A multi-objective model and solution. Sādhanā 2017, 42, 1167–1174. [Google Scholar] [CrossRef]
- Doodman, M.; Shokr, I.; Bozorgi-Amiri, A.; Jolai, F. Pre-positioning and dynamic operations planning in pre-and post-disaster phases with lateral transhipment under uncertainty and disruption. J. Ind. Eng. Int. 2019, 15, 53–68. [Google Scholar] [CrossRef]
- Ghasemi, P.; Khalili-Damghani, K.; Hafezalkotob, A.; Raissi, S. Stochastic optimization model for distribution and evacuation planning (A case study of Tehran earthquake). Socio-Econ. Plan. Sci. 2019, 71, 100745. [Google Scholar] [CrossRef]
- Agarwal, S.; Kant, R.; Shankar, R. Humanitarian supply chain management: Modeling the pre and post-disaster relief operations. Int. J. Disaster Resil. Built Environ. 2021, 13, 421–439. [Google Scholar] [CrossRef]
- Shehadeh, K.S.; Tucker, E.L. Stochastic Optimization Models for Location and Inventory Prepositioning of Disaster Relief Supplies. Optim. Control 2022, 144, 103871. [Google Scholar] [CrossRef]
- Seraji, H.; Tavakkoli-Moghaddam, R.; Asian, S.; Kaur, H. An integrative location-allocation model for humanitarian logistics with distributive injustice and dissatisfaction under uncertainty. Ann. Oper. Res. 2022, 319, 211–257. [Google Scholar] [CrossRef]
- Madani, S.H.; Arshadi, K.A.; Tavakkoli-Moghaddam, R. Solving a new bi-objective model for relief logistics in a humanitarian supply chain by bi-objective meta-heuristic algorithms. Sci. Iran. 2021, 28, 2948–2971. [Google Scholar] [CrossRef]
- Yazdani, M.; Haghani, M. Elderly people evacuation planning in response to extreme flood events using optimisation-based decision-making systems: A case study: Knowledge-Based Systems Western Sydney, Australia. Knowl.-Based Syst. 2023, 274, 110629. [Google Scholar] [CrossRef]
- Yazdani, M.; Haghani, M. A Dynamic Emergency Planning System for Relocating Vulnerable People to Safe Shelters in Response to Heat Waves. Expert Syst. Appl. 2023, 228, 120224. [Google Scholar] [CrossRef]
- Bayram, V. Optimization models for large scale network evacuation planning and management: A literature review. Surv. Oper. Res. Manag. Sci. 2016, 21, 63–84. [Google Scholar] [CrossRef]
- Southworth, F. Regional Evacuation Modeling: A State-of-the-Art Review; Technical Report; Oak Ridge National Laboratory: Oak Ridge, TN, USA, 1991. [Google Scholar]
- Barrett, B.; Ran, B.; Pillai, R. Developing a dynamic traffic management modeling framework for hurricane evacuation. Transp. Res. Rec. J. Transp. Res. Board 2000, 1733, 115–121. [Google Scholar] [CrossRef]
- INEGI. Panorama Sociodemográfico de Hidalgo: Censo de Población y Vivienda 2020. Available online: http://www.inegi.org.mx (accessed on 12 May 2023).
- Hernández-Gress, E.S.; Santana-Robles, F. Pre and post disaster model for a flood event: Rio Tula, Hidalgo State, Mexico. Figshare Dataset 2023. [Google Scholar] [CrossRef]
- Portal de Indicadores de Eficiencia Energética y Emisiones Vehiculares. Available online: https://ecovehiculos.inecc.gob.mx/ (accessed on 15 September 2023).
- Eksioglu, B.; Vural, A.V.; Reisman, A. The vehicle routing problem: A taxonomic review. CAIE Comput. Ind. Eng. 2009, 57, 1472–1483. [Google Scholar] [CrossRef]
- Webfleet. ¿Cuánto Combustible Consume un Camión por Kilómetro? Retrieved in 2023. Available online: https://www.webfleet.com/es_es/webfleet/blog/conoces-el-consumo-de-diesel-de-un-camion-por-km/#:~:text=Como%20es%20l%C3%B3gico%2C%20depende%20de,40%20litros%20cada%20100%20km (accessed on 10 May 2023).
| Author(s) | Problem | Phase (Pre- or Post- Disaster) | Solution Method (Approach) | Case Study |
|---|---|---|---|---|
| Babaei and Shahanaghi [25] | Multilevel location allocation and emergency routing problem in uncertain conditions | Post-disaster | Monte Carlo simulation and simulated annealing | No |
| Molina [26] | Multi-objective capacitated vehicle routing problem to deal with the lack of available vehicles and the need for quick evacuation | Post-disaster | MultiStart algorithm with intelligent neighborhood selection (NSGA-II) | No |
| Molla et al. [24] | Relief distribution during flooding and the evacuation of people | Pre- and post-disaster | Mixed-integer programming and genetic algorithms | Yes |
| Jha et al. [27] | Humanitarian relief chain that includes a relief goods supply chain and an evacuation chain in case of natural disaster | Pre- and post-disaster | Mixed-integer programming and NSGA-II | No |
| Doodman et al. [28] | Relief item prepositioning and multi-period distribution planning | Post-disaster | Multi-objective two-stage stochastic programming and TH method | No |
| Seraji et al. [32] | Location of shelters in the first phase and demands after accommodation in the second phase | Pre- and post-disaster | Two-stage stochastic programming | No |
| Zhu et al. [16] | Emergency relief routing optimization considering equity and priority issues | Post-disaster | Metaheuristic based on ant colony optimization | Yes |
| Mansoori et al. [18] | Minimize (a) the total number of people not transferred to hospitals and homeless not evacuated, and (b) total relief commodities | Post-disaster | Multi-objective mathematical model | Yes |
| Nayeri et al. [17] | Allocate and schedule rescue teams considering deprivation costs and times | Pre-disaster | Multi-objective mixed-integer programming using the LP method and a metaheuristic algorithm | No |
| Shehade and Tucker [31] | Determine where to open warehouses and how much inventory to preposition in each | Pre- and post-disaster | Two-stage stochastic programming and distributionally robust optimization (DRO) models | No |
| Madani et al. [33] | Multi-echelon and multi-objective relief network, location of hospitals, local warehouse hybrid centers, and evacuation of people | Pre- and post-disaster | Hybrid non-dominated sorting genetic algorithm and variable neighborhood search | No |
| Agarwal et al. [30] | Logistics stock prepositioning and evacuation planning | Pre- and post-disaster | Mathematical model for decision making with pattern simulated annealing and genetic algorithms | Yes |
| Seraji et al. [32] | Optimize the location of emergency shelters and coordinate the movement of relief vehicles considering distributive injustice and dissatisfaction | Pre- and post-disaster | Two stage multi-objective metaheuristics: multi-objective vibration damping and NSGA II | No |
| Municipality | Total Population | Pensioners or Retired People (%) | People with Disabilities (%) | Quantity to Evacuate |
|---|---|---|---|---|
| Alfajayucan | 19,162 | 1.13 | 6.4 | 1475 |
| Apaxco | 39,898 | 6.1 | 4.9 | 3509 |
| Atitalaquia | 31,525 | 10 | 4.6 | 4603 |
| Atotonilco de Tula | 62,470 | 5.9 | 4.6 | 5559 |
| Ixmiquilpan | 98,654 | 5.1 | 5.6 | 10,556 |
| Mixquiahuala | 47,222 | 4.7 | 5.6 | 4864 |
| Tasquillo | 17,441 | 4 | 6.9 | 1901 |
| Tepeji del Río | 90,546 | 7.7 | 4.6 | 11,137 |
| Tezontepec | 55,134 | 2.1 | 5 | 3915 |
| Tlahuelilpan | 19,067 | 3 | 5.4 | 1602 |
| Tlaxcoapan | 28,626 | 3.4 | 3.4 | 1947 |
| Tula | 115,107 | 10.3 | 5.2 | 17,842 |
| Zimapán | 39,927 | 2.4 | 5.1 | 2995 |
| Sets: | |
| Set of municipalities affected | |
| Set of temporary shelter | |
| Set of distribution centers | |
| Set of origins and destinations | |
| Set of origins and destinations | |
| Parameters: | |
| Cost of transportation from the affected municipality to shelter | |
| Transportation cost from distribution center to shelter | |
| Fixed cost of opening shelter | |
| Distance from origin to destination | |
| Distance from origin to destination | |
| Population to evacuate | |
| Fixed cost of renting a van to transport people | |
| Shelter capacity | |
| Distribution center capacity | |
| Capacity of the van to transport people | |
| r | Percentage of vans considered for rental |
| Budget available for disaster care | |
| Variables: | |
| Number of people evacuated from the affected municipality to shelter | |
| Binary variable indicating whether the camp is open or not | |
| Shelters | Address | Latitude | Longitude |
|---|---|---|---|
| Unidad Deportiva de Tula | Osa Mayor 15, El Cielito, 42803 Tula. | 20.0526796 | −99.3315105 |
| Auditorio Municipal de Tula | Centro, Tula de Allende, Hgo. | 20.0559197 | −99.3428116 |
| Auditorio Infonavit San Marcos | San Marcos, 42831 San Marcos, Hgo. | 20.0293121 | −99.3379669 |
| Escuela Primaria Franciso Sarabia, Pueblo Nuevo | Pueblo Nuevo, 42845 San Miguel Vindho, Hgo. | 19.9939747 | −99.3316803 |
| Catedral de Tula | 5 de Mayo #5, Centro, 42800 Tula de Allende, Hgo. | 20.0543701 | −99.3441306 |
| Escuela Primaria Benito Juárez | C. Sabino 37, Barrio Alto, 42800 Tula de Allende, Hgo. | 20.0471437 | −99.3560835 |
| Escuela Primaria Miguel Hidalgo y Costilla | C. Francisco Zarco 529, Barrio Alto 2da Secc, 42807 Tula de Allende, Hgo. | 20.0536890 | −99.3493398 |
| Escueal Secundaria General Niños Héroes | Emiliano Zapata 1, Centro, 42760 Tezontepec de Aldama, Hgo. | 20.1424996 | −99.2413238 |
| Escuela Primaria María Angeles | Rep Mexicana 40, Noxtongo 1ra, 42850 Tepeji del Rio de Ocampo, Hgo. | 19.9047249 | −99.3394578 |
| Escuela Melchor Ocampo | Juan Rulfo, Tlaxinacalpan, 42855 Tepeji del Rio de Ocampo, Hgo. | 19.9232103 | −99.3418594 |
| Escuela Primaria Lázaro Cárdenas | 42853, Av. Melchor Ocampo 37, San Mateo 1ra, Tepeji del Rio de Ocampo, Hgo. | 19.9004832 | −99.3418973 |
| Colegio Simón Bolivar | C. Guillermo Prieto 17, San Francisco 1ra, 42854 Tepeji del Rio de Ocampo, Hgo. | 19.9028700 | −99.3446700 |
| Iglesia Cristiana Maranatha | San Mateo 1ra, 42853 Tepeji del Rio de Ocampo, Hgo. | 19.9072718 | −99.3313870 |
| Escuela Primaria General 1ro de mayo | Bóvedas, 42982 Atotonilco de Tula, Hgo. | 20.0224432 | −99.2202657 |
| Escuela Secundaria General Felipe Ángeles | 16 de Enero S/N, Centro, 42980 Atotonilco de Tula, Hgo. | 20.0078759 | −99.2150485 |
| Escuela Secundaria Tecnica No.58 | Av. del Trabajo SN, Boxfi, 42980 Atotonilco de Tula, Hgo. | 19.9996695 | −99.2095964 |
| Colegio de Bachillerato del Estado de Hidalgo | C. República del Salvador SN, Bóvedas, 42980 Atotonilco de Tula, Hgo. | 20.0064429 | −99.2210060 |
| Escuela Primaria Francisco Sarabia | Iturbide, Dendho, 42970 Cardonal, Hgo. | 20.0572434 | −99.2279053 |
| Prepa Fray Diego de Rodríguez | Insurgentes 77, El Tablón, 42970 Atitalaquia, Hgo. | 20.0541176 | −99.2162695 |
| Escuela Primaria Adolfo López Mateos | Veracruz 4, El Tablón, 42970 Atitalaquia, Hgo. | 20.0496058 | −99.2193827 |
| Escuela Primaria Urbana General Ma. Anaya | Niños Héroes 88, 3ra Demarcación, 42700 Mixquiahuala de Juárez, Hgo. | 20.2370703 | −99.2043504 |
| Escuela Primaria Amado Nervo | Gabino Barreda 1, Centro, 1ra Demarcación Poniente, 42700 Mixquiahuala de Juárez, Hgo. | 20.2563827 | −99.1903234 |
| Escuela Primaria Pedro Ma. Anaya | Miguel Hidalgo 6, Educación, 42952 Tlaxcoapan, Hgo. | 20.0912805 | −99.2242954 |
| Escuela Primaria Urbana General Ford 72 | Fco Villa 20, Rancho Viejo, 42780 Tlahuelilpan, Hgo. | 20.1353506 | −99.2340138 |
| Escuela Primaria Miguel Hidalgo Loma México | 42325 Ixmiquilpan, Hgo. | 20.4835415 | −99.2191544 |
| Escuela Primaria General Ignacio Zaragoza | San Pedro Capula, Ixmiquilpan, Hgo. | 20.5124985 | −99.1572957 |
| Escuela Primaria Francisco I.Madero | Progreso, 42302 Ixmiquilpan, Hgo. | 20.4898208 | −99.2222736 |
| Escuela Secundaria General Libertadores de América | Libertadores de América 12, El Fithzi, 42300 Ixmiquilpan, Hgo. | 20.4658258 | −99.2092965 |
| Escuela Primaria Teniente Juan de la Barrera | Fco I Madero Sn, El Fithzi, 42300 Ixmiquilpan, Hgo. | 20.4836712 | −99.2192688 |
| Escuela Primaria Lázaro Cárdenas del Rio | C. Allende 1, El Mirador, 55660 Apaxco de Ocampo, Méx. | 19.9763946 | −99.1715745 |
| Escuela Primaria Club de Leones | Del Trabajo y, Santa Anita, 42337 Zimapán, Hgo. | 20.7356244 | −99.3867279 |
| Escuela Secundaria General Josefa Bustamante | Heroico Colegio Militar 11, Centro, 42330 Zimapán, Hgo. | 20.7365736 | −99.3834011 |
| Escuela Primaria Alvaro Obregón | Seguro Social 2, Calvario Bajo, 42381 Tasquillo, Hgo. | 20.5387707 | −99.3689880 |
| Bachillerato Alfajayucan TES | Colonia Centro, 42390 Alfajayucan, Hgo. | 20.4080620 | −99.3495331 |
| Presidency | 5 a Vans | 10 Vans | 15 Vans | 20 Vans | 3 b h | 4 h | 8 h |
|---|---|---|---|---|---|---|---|
| Tula | 52.50 c | 25.13 | 17.50 | 13.13 | 88 d | 53 | 33 |
| Tezontepec | 27.56 | 13.78 | 9.19 | 6.89 | 46 | 28 | 18 |
| Tepeji | 62.05 | 31.02 | 20.68 | 15.51 | 104 | 63 | 39 |
| Atotonilco de Tula | 30.93 | 15.47 | 10.31 | 7.73 | 52 | 31 | 20 |
| Atitalaquia | 26.02 | 13.01 | 8.67 | 6.50 | 44 | 27 | 17 |
| Mixquiahuala | 44.10 | 22.05 | 14.70 | 10.24 | 74 | 45 | 28 |
| Tlaxcoapan | 21.84 | 10.92 | 7.28 | 5.46 | 37 | 22 | 14 |
| Tlahuelilpan | 9.07 | 4.53 | 3.02 | 1.71 | 16 | 10 | 6 |
| Ixmiquilpan | 120.93 | 60.46 | 40.31 | 29.58 | 202 | 121 | 76 |
| Apaxco | 17.65 | 8.83 | 5.88 | 3.34 | 30 | 18 | 12 |
| Zimapán | 0.00 | 0.00 | 0.00 | 0.00 | 0 | 0 | 0 |
| Tasquillo | 0.00 | 0.00 | 0.00 | 0.00 | 0 | 0 | 0 |
| Alfajayucan | 0.00 | 0.00 | 0.00 | 0.00 | 0 | 0 | 0 |
| Total vans | 693 | 418 | 263 |
Disclaimer/Publisher’s Note: The statements, opinions and data contained in all publications are solely those of the individual author(s) and contributor(s) and not of MDPI and/or the editor(s). MDPI and/or the editor(s) disclaim responsibility for any injury to people or property resulting from any ideas, methods, instructions or products referred to in the content. |
© 2024 by the authors. Licensee MDPI, Basel, Switzerland. This article is an open access article distributed under the terms and conditions of the Creative Commons Attribution (CC BY) license (https://creativecommons.org/licenses/by/4.0/).
Share and Cite
Santana-Robles, F.; Hernández-Gress, E.S.; Martínez-López, R.; González-Hernández, I.J. Quick-Response Model for Pre- and Post-Disaster Evacuation and Aid Distribution: The Case of the Tula River Flood Event. Logistics 2024, 8, 8. https://doi.org/10.3390/logistics8010008
Santana-Robles F, Hernández-Gress ES, Martínez-López R, González-Hernández IJ. Quick-Response Model for Pre- and Post-Disaster Evacuation and Aid Distribution: The Case of the Tula River Flood Event. Logistics. 2024; 8(1):8. https://doi.org/10.3390/logistics8010008
Chicago/Turabian StyleSantana-Robles, Francisca, Eva Selene Hernández-Gress, Ricardo Martínez-López, and Isidro Jesús González-Hernández. 2024. "Quick-Response Model for Pre- and Post-Disaster Evacuation and Aid Distribution: The Case of the Tula River Flood Event" Logistics 8, no. 1: 8. https://doi.org/10.3390/logistics8010008
APA StyleSantana-Robles, F., Hernández-Gress, E. S., Martínez-López, R., & González-Hernández, I. J. (2024). Quick-Response Model for Pre- and Post-Disaster Evacuation and Aid Distribution: The Case of the Tula River Flood Event. Logistics, 8(1), 8. https://doi.org/10.3390/logistics8010008