Article

Examination of Logistics Simulation Demand Related to Enterprises: Focusing on a Hungarian County

1
Department of Business Information Technology, Faculty of Finance and Accountancy, Budapest Business University, H 1149 Budapest, Hungary
2
Department of Management and Entrepreneurship, Faculty of Finance and Accountancy, Budapest Business University, H 1149 Budapest, Hungary
*
Author to whom correspondence should be addressed.
Logistics 2024, 8(1), 7; https://doi.org/10.3390/logistics8010007
Submission received: 8 November 2023 / Revised: 27 December 2023 / Accepted: 29 December 2023 / Published: 4 January 2024

Abstract

:
Background: Despite the fact that some results can be found for the logistics simulation in the literature, there is a lack of an experiment based on inner company data. Therefore, the study aimed to determine the potential need for this kind of solution by Zala County enterprises. Methods: As a first step, the paper presents the existing literature with the help of a literature review. Afterwards, questionnaire sampling was conducted among local enterprises. The paper applies several statistical methods (e.g., descriptive statistics, SPSS, exploratory factor analysis, and structural equation modeling) to the sample for the validation of the reorganization demand. Results: The study obtained a total of 147 complete responses from the 1022 invitations. An overwhelming majority of the respondents indicated regular and significant delays in their logistics processes, as well as the need for a new simulation method. Based on the SEM model, it has been observed that IT solutions are being utilized in an inefficient manner, resulting in logistical system issues and operational damages. Conclusion: The paper successfully identified a research gap, the research of which can have not only theoretical but also many practical benefits. Hopefully, the results will generate other academic research in this field.

1. Introduction

In contemporary times, supply chains have achieved a notable degree of efficiency. However, it is important to acknowledge that their operational effectiveness is not without limitations. In recent years, there has been an emergence of vulnerability, which has been brought to light due to a multitude of global events that have resulted in unparalleled disruptions within supply chains. The repercussions of these disruptions have been experienced in various sectors, ranging from the automotive industry to electronics. According to Pató and Herczeg [1], the source being referenced spans from pages 1 to 11.
Moreover, it is crucial to emphasize that prior studies have consistently identified a mounting difficulty in attaining punctual delivery and procurement as a result of escalating congestion in transportation networks [2]. The congestion observed in supply chains is frequently attributed to the growth of global trade and insufficient infrastructure, thereby intensifying the susceptibility of these supply chains. The issue not only results in the postponement of the transportation of unprocessed materials but also hampers the dissemination of finalized goods, thereby causing extended lead times and diminished levels of customer contentment.
Given the challenges, there is an increasing demand for supply chains that exhibit greater resilience. This may entail the integration of more comprehensive risk management strategies, the expansion of supplier diversification, or the implementation of digital technologies to enhance visibility and responsiveness. The objective is to establish supply chains that exhibit both efficiency and resilience, enabling them to endure disruptions without causing substantial disruptions to production or delivery processes. The preliminary examination of the literature clearly showed that there are certain results in the field of supply chain simulation, but so far no one has approached the simulation from an internal company point of view, which means a strong research gap this way. The main motivation of the thesis is essentially the primary analysis of this research gap with the local testing of a possible solution (a simulation based on inner company data), which possibly induces further research. The main engineering or scientific contribution of the results lies in the fact that the model created in this way can be tested in other geographical areas (either by other research teams in an open-source manner) or even further developed. Since the current paper aims to examine the necessity of this simulation (main question—is it even needed to develop a simulation based on inner company data?), the study determined the following research questions:
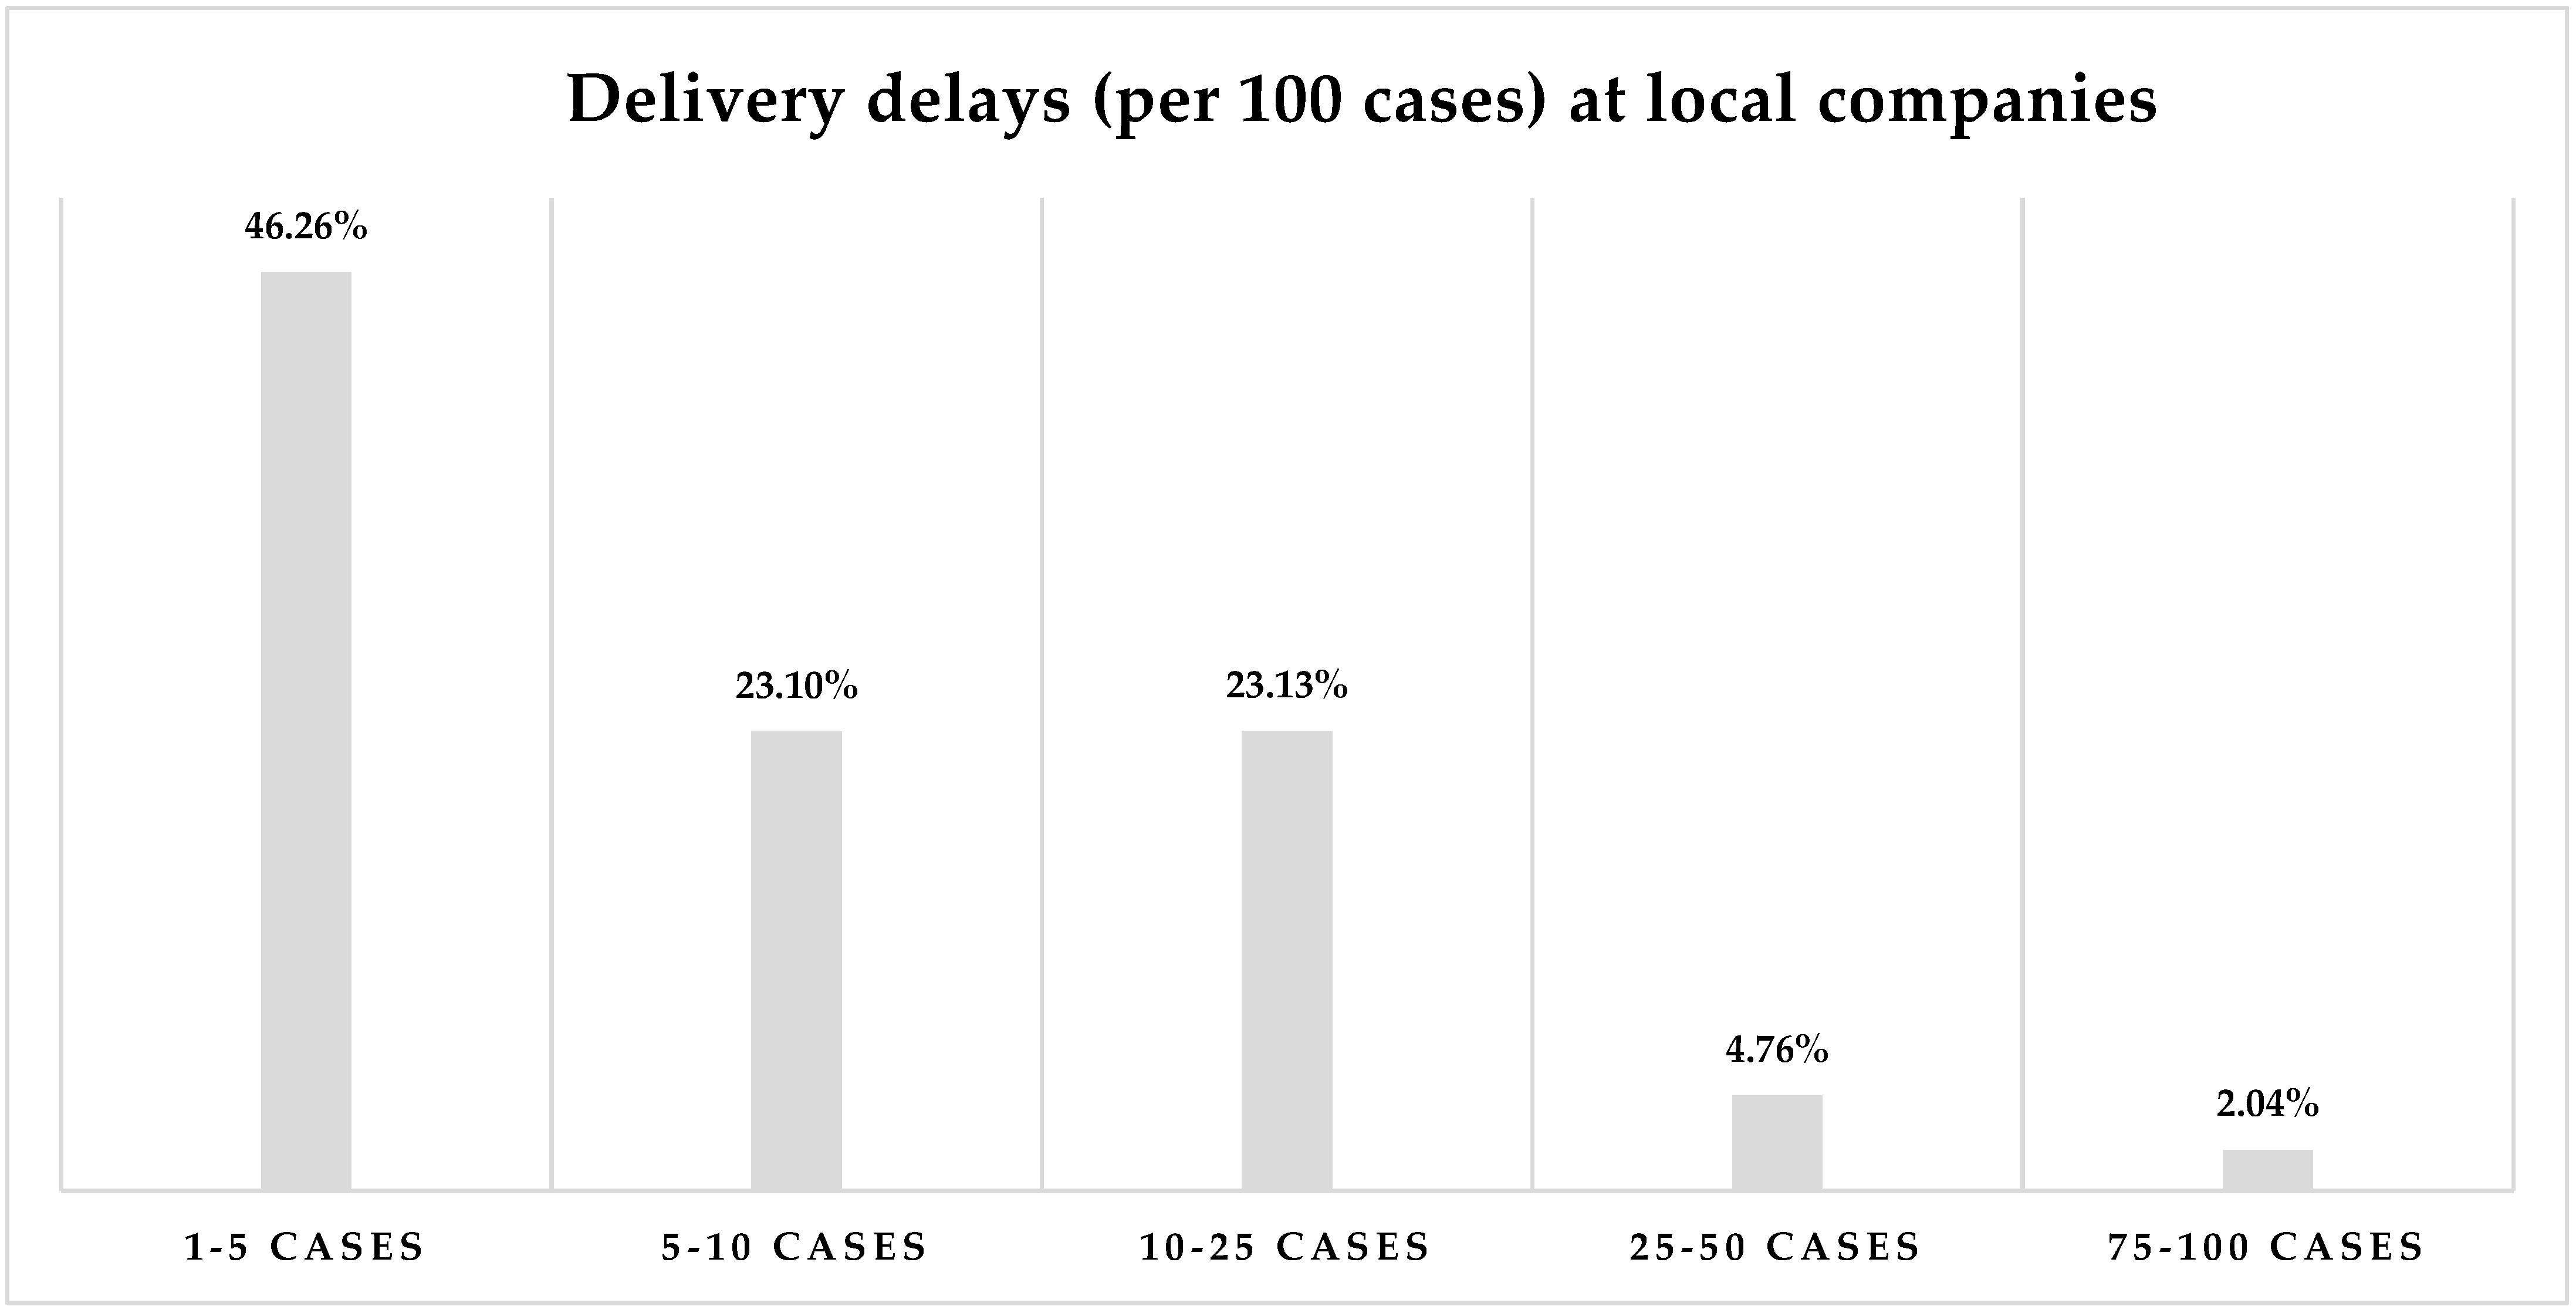
  • How satisfied are the enterprises with their logistics processes, and how often can significant delays be experienced within the current (classical) intra-company logistics processes?
  • What direct and indirect effects do the financial, market, and logistics system features of companies have on the way that company leaders view the external and internal logistics process difficulties that plague their operations?
These are the two most important questions or dimensions that have to be examined for a future reorganization implemented with a simulation tool based on inner company data. The system development and simulation results will be represented in the next research phase. In the current study, the definition of the concrete application demand and the examination of the possible reorganization possibilities were aimed at.
For the implementation of the research, Zala County was chosen (ZC in the following) in Hungary as the territory of the analysis. The choice of this area was based on its historical significance as well as its frequency in terms of logistics. However, recent investments have further enhanced its suitability for the study. These include the construction of the R76 and M70 roads, the establishment of the Zalaegerszeg test track, the planned construction of the M9 highway, and the ongoing construction of the logistics center or tank factory. These developments have significantly contributed to the county’s logistics infrastructure, making it an ideal location for our research [3,4].
The structure of this paper is as follows: the next chapter conducts a literature review on basic supply chain operations and trends. Section 3 summarizes the process of hypothesis development and the research method used. The results obtained are presented and discussed in Section 4. Lastly, the concluding section highlights the theoretical and practical contributions of the study, along with its limitations and suggestions for future research.

2. Literature Review

2.1. An Overview of the Logistical Challenges Present in Contemporary Supply Chains

The efficient movement of goods and services from manufacturers to end consumers is crucially dependent on supply chains. Notwithstanding their complexity, these networks encounter various logistical challenges that may impede the smooth delivery of goods, escalate expenses, and affect customer contentment. The present study offers an all-encompassing analysis of the primary logistical obstacles encountered by supply chains in the contemporary, dynamic commercial landscape. The challenges that have been discussed pertain to diverse facets, including but not limited to fluctuations in demand, transportation and distribution, management of inventory, sharing of information, and sustainability. The objective of the analysis outlined in this paper is to augment our comprehension of these challenges and encourage additional research and the advancement of efficacious approaches to alleviate their consequences.
Demand variability poses a significant logistical challenge for supply chains, according to research. Variations in consumer demand may cause imprecise demand predictions, which can result in excessive inventory or insufficient stock. The “bullwhip effect” is a phenomenon that can disseminate throughout the supply chain, resulting in the amplification of demand fluctuations at every level [5]. It is a result of various factors, including but not limited to order batching, price fluctuations, promotional activities, and inaccuracies in forecasting. In order to address this challenge, it is imperative for supply chain managers to utilize sophisticated forecasting methodologies, establish close partnerships with customers, and execute agile replenishment tactics [6,7].
The optimization of transportation and distribution processes is of paramount importance in guaranteeing the punctual delivery of goods to consumers [8,9,10,11]. Supply chains frequently face logistical obstacles associated with transportation networks, such as congested roadways, restricted transportation capacity, and insufficient infrastructure. The challenges have the potential to result in setbacks, escalated expenditures, and subpar customer support. In addition, the emergence of electronic commerce has brought about novel intricacies, including obstacles pertaining to final delivery stages and the process of reverse logistics [12,13,14,15]. In order to tackle the aforementioned concerns, professionals in the field of supply chain management may utilize sophisticated analytical techniques and optimization models to streamline routing processes, enhance fleet management, and elevate delivery performance [16,17,18].
Effective inventory management is crucial for achieving a harmonious equilibrium between customer demand and supply chain expenses [19,20,21,22]. Supply chains often encounter difficulties in efficiently managing inventory levels. The maintenance of an excessive inventory can lead to the immobilization of working capital and a rise in holding costs. Conversely, inadequate inventory levels can result in stockouts and missed opportunities for sales. The challenges at hand are attributed to factors such as demand forecasting accuracy [23,24], lead time variability [25,26], supplier reliability [27,28,29], and seasonality [30,31]. The implementation of sophisticated inventory management strategies, such as just-in-time (JIT) and vendor-managed inventory (VMI), in conjunction with effective demand forecasting, can effectively mitigate these obstacles and optimize inventory levels [32,33,34,35].
The sharing of information plays a crucial role in the optimization of supply chain performance by facilitating coordination among its partners [36,37]. Insufficient information sharing and inadequate visibility across the supply chain frequently give rise to logistical challenges [38]. The absence of instantaneous data, isolated information systems, and apprehensions regarding cybersecurity can impede the dissemination of information, leading to procrastination, heightened response durations, and suboptimal decision-making. The utilization of integrated information systems, such as enterprise resource planning (ERP) and supply chain management (SCM) softwares, enables the smooth exchange of information, cooperative planning, and enhanced transparency [39,40]. The utilization of blockchain technology also holds the potential to significantly transform the field of supply chain management through its ability to offer enhanced transparency, heightened security measures, improved operational efficiency, and streamlined collaboration processes [41]. Nevertheless, it is crucial to acknowledge that the integration of blockchain technology within the framework of a supply chain presents certain obstacles. These include the requirement for standardization, the intricate nature of the technical aspects involved, and concerns pertaining to privacy and safeguarding of data [42].
The concept of sustainability has also gained significant importance in the domain of supply chain operations in recent times [43,44]. The logistical hurdles associated with sustainability encompass the reduction of carbon emissions, the minimization of waste, and the assurance of ethical sourcing practices [45,46,47].
The adherence to environmental regulations [48,49], the escalation of consumer expectations for sustainable goods [50], and the imperative to embrace circular economy principles present noteworthy obstacles for supply chains [51,52]. The challenges faced by companies can be tackled through the adoption of green logistics practices, alternative transportation modes, reverse logistics programs, and supplier collaboration for sustainable sourcing [53,54].
In summary, it can be said that an increasing pressure is present in the logistics area, but the presence of these global processes in Zala County has not been investigated so far. Accordingly, the paper seeks to find an answer to the research gap about how the global challenges are realized at the local level. How satisfied are local businesses with their logistics processes in light of the growing challenges, and what problems do they face on a daily basis?

2.2. IT Support of Logistics Systems

The utilization of IT is a crucial factor in augmenting the efficacy, perceptibility, and synchronization of logistics systems. Over the course of the last half-decade, noteworthy progress has been achieved in the realm of information technology solutions specifically designed for logistics, affording entities the opportunity to enhance the efficiency of their supply chain activities. This chapter offers a comprehensive survey of contemporary literature and investigations concerning IT assistance for logistics systems, with a particular emphasis on significant domains such as digital transformation, instantaneous tracking and supervision, data analysis, artificial intelligence, and blockchain innovation. The objective of this chapter is to underscore the potential advantages of IT implementation in logistics by scrutinizing the most recent advancements in this field. Additionally, this chapter endeavors to identify nascent challenges and delineate forthcoming research avenues.
Logistics information systems refer to the software and hardware components that are responsible for facilitating transportation and storage activities, as per their established definition. The objective of these systems is to provide customers with a service of superior quality. With the assistance of software, customers can obtain the appropriate goods in the correct quantity and at the optimal time while effectively managing costs and time [55]. According to the definition, the main objective of the information background supporting logistics processes is to ensure the provision of cost-effective services for production purposes. Hence, our attention will be directed towards the software component of the information technology systems. The primary objective of our research is to enhance the efficiency and effectiveness of processes by implementing software solutions, specifically through the use of decision support systems.
To illustrate the functioning of IT systems, we can provide an example wherein a closing set is provided. In this scenario, the system utilizes the given stock and future demand to estimate the quantity to be procured. Subsequently, the system generates a forecast based on this estimation. Subsequently, utilizing the estimation, it presents a decision-support proposal regarding the order, typically emphasizing the presence of a scarcity. Indeed, it is evident that the provided illustration is a reductionist portrayal that fails to consider numerous factors. The material management function in ERP systems is primarily carried out by the MRP modules. The operational structure of material requirements planning (MRP) systems is typically categorized into three primary priority domains:
  • Production Plan: The central program that includes the periodical production plan(s) defined by the organization. The number of pieces to be produced is determined by the company’s market forecasts and market needs.
  • BOM—Bill of Materials (Installation tree)—the installation guide for the components that are required for the finished product. The BOM contains not only the order of installation of the components but also the required quantities.
  • Inventory register: Shows the tracking of raw materials over time. It also includes the lead times required for material procurement as well as the production times.
In real terms, the aforementioned principles are further elaborated to the extent that material requirements planning (MRP) systems must possess the capability to accommodate orderable item sizes, commonly referred to as policy orders, as well as orders that have already been committed within the system [56,57].
Based on the existing literature, it can be argued that the fundamental operations of the systems have remained unchanged over time. Nevertheless, it is imperative to acknowledge that various modernization processes have emerged within the subject matter. These advancements can be categorized into three distinct process lines. The three key areas of focus in this study are cloud-based solutions, customization, and artificial intelligence.
Regarding cloud-based solutions, it is noteworthy to mention that in the past, organizations predominantly relied on on-premises ERP applications and exhibited reluctance towards embracing cloud-based operations. As a result of the COVID-19 pandemic and other unforeseen circumstances, there has been a significant shift in opinion, leading to a growing preference among businesses for cloud-based enterprise resource planning (ERP) systems. This option presents a multitude of advantages, such as simplified execution, cost reduction, improved adaptability, the acquisition of novel functionalities, decreased dependence on internal IT assets, and seamless integration of supplementary capabilities [58]. The implementation of a cloud-based solution facilitated the opportunity for the subsequent development of a two-level ERP system. The utilization of cloud technology has facilitated the implementation of a Tier 1/Tier 2 ERP system, wherein the central company employs a Tier 1 full-application ERP, while subsidiaries utilize a Tier 2 ERP with additional modules integrated through cloud-based tools [59].
The second trend observed in 2023 pertains to the customization of enterprise resource planning (ERP) systems, a phenomenon closely linked to the growing adoption of artificial intelligence (AI) technologies. One notable trend that is gaining traction is the increasing prevalence of AI-driven assistive and conversational user interfaces, such as chatbots. These interfaces have the capability to comprehend user voice or text input and provide responses by leveraging customer and order data stored within the enterprise resource planning (ERP) system. Within the context of customization, it is crucial to emphasize that historically, enterprise resource planning (ERP) platforms presented challenges in terms of adapting to the unique requirements of individual businesses due to their intricate scripting languages. However, in recent times, organizations have been able to leverage cloud-based ERP platforms that are specifically designed for simplified configuration or “low-code” platforms. This further enhances the prospects of customized systems [60].
The third significant trend in the realm of enterprise resource planning (ERP) systems is the growing utilization of artificial intelligence (AI). In this current trajectory, it is evident that AI and machine learning (ML) capabilities have been incorporated into enterprise resource planning (ERP) systems primarily to function inconspicuously in order to meet the increasing need for customization and optimize various business operations. In contemporary times, there has been a notable shift in the approach of companies towards the integration of AI functionality within enterprise resource planning (ERP) systems. Previously, organizations would typically incorporate AI capabilities into specific ERP systems subsequent to their initial introduction. However, a growing trend has emerged wherein an expanding array of vendors now offer ERP softwares that inherently encompasses these integrated capabilities [61]. AI is predominantly employed in the field of data analysis. As organizations amass greater quantities of operational and customer data, they increasingly depend on AI to extract valuable business insights from this data. AI technologies have the capability to efficiently analyze extensive quantities of unstructured data, enabling the identification of patterns and the prediction of trends that would be challenging to discern through manual data analysis methods. While the analysis of ERP data has been feasible in the past, there is a growing emphasis on the ability to employ predictive analysis using these data by the year 2023, facilitated by artificial intelligence.
Software equipped with machine learning capabilities has the ability to analyze a maintenance company’s machine repair data and make predictions regarding the occurrence of future failures. This can be illustrated with an example. The optimization of the maintenance schedule by the organization enables prompt repair or replacement of problematic parts. Building upon this concept, AI plays a pivotal role in the automation and enhancement of a diverse array of processes. One notable illustration can be found in the various opportunities presented by JIT systems. The utilization of artificial intelligence and machine learning techniques has the potential to enhance the efficiency of delivery and labor scheduling processes, leading to heightened productivity levels and decreased operational costs [62].
Based on the observed patterns, it can be posited that we are currently on the cusp of a novel paradigm in the realm of logistics software support or ERP systems. However, it is important to note that a significant advancement in this domain has not yet materialized. Upon reviewing the existing literature, it becomes evident that the present study aligns well with these advancements and can be effectively integrated with the ongoing AI application. In summary, it can be observed that the concrete modelling-simulation-beta testing has not yet been implemented. Consequently, the present research remains significant due to the existing gap that needs to be addressed in this particular domain [63].
The advent of digitalization has brought about a significant transformation in logistics systems, facilitating the automation and integration of diverse processes. Contemporary literature highlights the incorporation of digital technologies, including the IoT and cloud computing, within the realm of logistics operations. The utilization of IoT devices, sensors, and RFID technology enables the prompt acquisition of data, tracking of assets, and management of inventory. According to Kalkha et al. [64] and Trappey et al. [65], cloud-based platforms offer scalable infrastructure and facilitate smooth data sharing among supply chain partners, thereby promoting collaboration and improving the overall efficiency of the system.
The utilization of real-time tracking and monitoring systems has garnered considerable interest over the last half-decade. The progression in GPS technology, wireless communication, and data analytics have facilitated instantaneous monitoring of shipments, vehicles, and assets across the entire supply chain. Recent scholarly literature investigates the amalgamation of location-based services, mobile applications, and sensor networks for the purposes of inventory tracking and monitoring, transportation route optimization, and precise delivery estimations. The implementation of real-time monitoring has been found to have positive effects on supply chain responsiveness, customer service, and issue resolution [66,67,68].
In conclusion, the field of logistics systems has experienced noteworthy progress in IT support over the last half-decade. The potential for a revolutionary transformation of logistics operations exists through the integration of digitalization, real-time tracking and monitoring, data analytics, artificial intelligence, and blockchain technology. Successful implementation of a system is contingent upon addressing various challenges, including but not limited to data privacy and security, interoperability, and organizational change management. Subsequent investigations ought to concentrate on formulating comprehensive frameworks and assessing the effects of information technology implementation [69].
In connection with the outlined IT support, the main question is how much the IT infrastructure helps to alleviate the challenges described earlier in the paper at the local level.
Within this phenomenon, the long-term goal of the research team is to test new simulation tools as a possible solution. However, it is not possible to conduct a test without learning the current situation at the local level, the daily problems, the damages in logistics, and the development demands. As the examination of these dimensions gives the answer to that really important question, does a new simulation solution even have a right to exist? Is this long-term research goal even relevant? On the basis of the current literature, it is visible that the academic field has expanded a lot with several topics in the field, like current challenges in logistics and new trends in IT support. It is also visible that these global results have not been analyzed at the local level, which forms a research gap. Accordingly, the current study aims from one side to examine the local logistics problems, damages, and development demands. From another side, the paper tries to put the answers in a cause-and-effect framework, which helps in the more complex understanding of processes. The hypothesis development is presented in the next section on the basis of these literature experiences.

3. Hypothesis Development, Sampling and Methods

As mentioned, the paper seeks to investigate the effects caused in the supply chain. This inquiry pertains to the impact experienced by local companies as a consequence of these adverse effects, as well as the existence of any demand for reengineering. The current study was preceded by previous research [70] that aimed to define the variables to be measured and outline a research framework of the possible relations based on the responses of local companies. Through the answers and the literature review of this article, the following cause-and-effect framework was determined (See Figure 1).
The paper aims to examine these aspects and the relationship between them. On the basis of the results of the previous study, the current understanding and adaptive review of the literature, and the implemented research framework, the following research questions and hypotheses were determined:
Q1: 
How satisfied are the ZC enterprises with their logistics processes within the business operations?
H1: 
ZC enterprises are mostly dissatisfied with their logistics processes, which need reengineering.
Q2: 
How often are there significant delays in the intra-company logistics processes of ZC enterprises?
H2: 
There are regular and significant (perceptible for local companies) delays in the logistics processes of ZC enterprises.
Q3: 
What direct and indirect effects do the financial, market, and logistics system features of local companies have on the way that company leaders view the external and internal logistics process difficulties that plague their operations?
H3: 
Efficiency of local businesses’ IT support and capacity directly influences their logistics processes at the system level, where low efficiency causes operative damages; to solve this problem, local companies mostly demand system reengineering solutions.
Since the primary variables were already established through the use of qualitative methods in the prior work [70], the present study relied mostly on quantitative approaches. To back up our H1, H2, and H3 ideas, a questionnaire approach made perfect sense. For the examination of the hypotheses, an online, self-fulfilling enterprise questionnaire was developed, which will be shared through a chosen research frame. The questionnaire contains a mixture of closed (dichotomous and multiple-outcome) questions and a 5-point Likert scale. All of this was accomplished through a thorough and flexible analysis of qualitative and quantitative research techniques [70,71]. The results obtained will be analyzed with descriptive statistics in the case of H1 and H2, while for H3, a more complex method was determined. After the evaluation of several methods, the SEM model was chosen, as it gives the most broad picture of the cause and effect of a given territory. Within this, the study examines the results with the following values in the framework of an SPSS analysis: KMO (Kaiser-Meier-Olkin test) assesses the proportion of variance among variables that might be common variance; TVE (total variance explained) represents the cumulative proportion of variance explained (eigenvalues) by the retained factors; F-statistic is used in analysis of variance (ANOVA) to assess whether there are statistically significant differences among group means; the p-value is the probability of observing a test statistic as extreme as the one computed from the sample, assuming that the null hypothesis is true; the significance level, “Sig.,” represents the chosen threshold for determining statistical significance. After establishing the methodology, our initial objective was to ascertain the particulars of the sampling, encompassing the research framework, query publication location, and methodology, among other factors. The questionnaire was organized in the following manner:
data of the company;
current situation of the company;
problems of logistics processes;
problems of logistics transportation;
damages due to negative logistics effects;
logistics developments.
In the vast majority of cases, the research topic also defines the target population to be selected. In this case, the “enterprise” in the title of the paper was the unit of analysis, which should be interpreted as the unit to be studied during the research. When selecting the target population, one of the most important attributes was territorial delimitation; namely, the research was conducted among ZC enterprises, the validation of which was partly explained earlier. (Number of enterprises are shown in Table 1).
As a research frame, the Zala County Foundation for Enterprise Development database was targeted, which covers the entire entrepreneurial sphere of the county. As a database, at least 100 completion feedbacks were set as a goal to be achieved. The following filters were applied to the quantity:
location in ZC;
significant material flow (min. weekly order);
having a logistics department at the operations level.
In order to evaluate the hypotheses, it is necessary to derive the factors of the model using the database variables, excluding the measured variables under consideration. In order to achieve this objective, exploratory factor analysis (EFA) was employed with Kaiser normalization and varimax rotation, as recommended in the existing literature [72,73,74]. Causal pathway models are constructed using structural equation modeling (SEM) based on the resulting factors from EFA [75]. In the context of structural equation modeling, researchers typically adhere to the overarching framework of the LISREL model. This entails constructing a causal model utilizing a causal multicausal regression approach and incorporating partial correlation techniques [76]. Pearson’s zero-order linear correlation between the independent and dependent variables is decomposed into two additive components, with the exclusion of other factors. Consequently, the analysis involves examining the direct impact of the independent variable on the ultimate dependent variable, as well as the indirect impact of the independent variable on said variable through intermediary variables. Hence, the partial relationships observed in the model also indicate a causal relationship, which differs from the conventional regression approach. The construction of the model is as follows. In order to construct the models, an initial model was created for the entire sample through the utilization of exploratory regression analysis. Within this particular model, solely noteworthy causal relationships are identified and denoted by arrows to indicate their direction. The standardized β parameters are determined by their respective weights. Subsequently, all participants were eliminated from the dataset who had missing data for the variables of interest.
The models adhere to the structure outlined in the literature [77]. The calculations were conducted utilizing IBM AMOS software (version number–27.1.1.3). In the models, the input variables that serve as causes are connected to each other through covariances, indicating that they are not necessarily independent variables. These relationships also influence the development of the explained causal variables. The model’s endogenous mediating variables are denoted by ei error terms. The standardized β parameters of the model represent the weights of the paths (links) connecting the variables. The determinant coefficients (R2) for each model represent the values assigned to the explained variables. The relationships among the models are subsequently elucidated through the utilization of the standard error (S.E.) while additionally providing the critical value (C.R.). The adequacy of the models is assessed using chi-square tests, which are deemed to be well-fitting if the p-value is less than 0.05. Furthermore, the average explanatory capability of the generated models was assessed by calculating the means of squared multiple correlations for the dependent variables. As an evaluation criteria, the study determined a minimum 0.200 correlation coefficient absolute value between the given variables on the basis of the literature on SEM modelling [77]. Above this absolute value, the given connection can be considered strong, and these connections formulate the path of the model to justify the H3 hypothesis.
The research was conducted in the ZC region, as mentioned. The selection of this area for the research was a rational decision based on the natural, geographical, and infrastructural resources available. Given the prevailing circumstances, ongoing development trends, and the abundance of available data, there is a significant opportunity to achieve precise and accurate outcomes in relation to the long-term objectives [78].

4. Results

The sample size for this research is denoted as n = 147, representing the number of fully completed questionnaires available for analysis. Given the nature of our research, which is focused on causal and explanatory relationships rather than providing a descriptive account of the situation in Hungary, representativeness was not prioritized in the sampling approach. Instead, a non-random sampling method was chosen with a smaller number of elements, as it aligns better with our research objectives [79,80].

4.1. Satisfaction of ZC Businesses with Their Logistics Processes

Based on the survey conducted among 147 companies, it was determined that a mere 20% of the respondents expressed complete satisfaction with their logistics processes. The majority of enterprises (67%) expressed partial satisfaction with the development of the daily material flow, whereas 13% of the enterprises reported complete dissatisfaction.
In addition to considering the satisfaction of enterprises, it is also important to investigate the perceived efficiency of logistics processes among the respondents. (For the present inquiry, we sought information regarding the primary determinants of the enterprise, such as market dynamics, financial condition, information technology and professional resources, competitive landscape, funding sources, availability of raw materials, and the efficacy of logistical operations).
As shown in Figure 2, 40% of respondents indicated that their logistics processes and operations are at an average level, 28% reported that these processes are below average, and 22% expressed that the logistics situation is exceptionally poor. In addition to assessing satisfaction levels pertaining to logistics processes and their operational efficacy, it is also pertinent to investigate the fundamental requirements for software support in addressing these challenges.
According to the survey data, a majority of 64.58% of the participants expressed their intention to utilize decision support software capable of facilitating logistics flows in order to restructure the logistics operations of the organization. This finding highlights a clear demand for a novel approach in the domain of logistics.
As a result, the results confirm the H1 hypothesis and establish it as a (T1) thesis. Specifically, 67% of the surveyed companies express partial satisfaction, while 13% report no satisfaction at all. Additionally, 49.66% perceive their logistics processes to be below average. Furthermore, 64.58% of respondents express a need for new decision support software to facilitate the reorganization of their logistics processes. Based on the findings of this study, it is appropriate to assert that a significant majority of the ZC enterprises express dissatisfaction with their current logistics processes, indicating a need for reengineering.

4.2. Problems of the Logistics Processes among ZC Enterprises

After the examination of basic demand and satisfaction, it was logical to explore the root causes of logistics problems. The question arose as to how significant these problems are at all. For this, the size and the risk of the delays perceived by businesses were measured.
As shown in Figure 3, the largest number of respondents (46.26%) indicated 1–5 times, but there were also such enterprises that indicated 75–100 cases. Overall, all of the companies indicated that there are at least 1–5 cases of delays. Based on this, it is visible that regular material flow level blockage is present in the case of local enterprises; only its significance is the question.
To assess the importance of the issue, the specific magnitude of the delays was surveyed. Within the participants, a notable proportion of 48.98% expressed that the delays encountered had a negligible impact. Conversely, the remaining 51% acknowledged that these delays exert a tangible influence on production processes and customer satisfaction. Out of the total number of enterprises, 14 of them, accounting for 9.5% of the sample, have been affected by significant delays. Based on the findings, it was observed that a significant majority of enterprises encounter frequent delays, averaging between 5 and 25 occurrences per 100 cases. Furthermore, it was determined that these delays have a notable impact in the majority of cases, accounting for 51% of instances. Consequently, the H2 hypothesis, which posits the existence of regular and significant delays in the logistics processes of businesses, was supported and subsequently transformed into a thesis (T2). It is important to highlight that these delays are caused by several problems, so the local companies could not find one definite cause of the result. Therefore, the main aim of the next section is partly to implement a cause-and-effect model to map the potential reasons.

4.3. Mapping the Logistics Processes of ZC Enterprises

In the second stage of the research, an examination to identify variables that exhibited a robust correlation was conducted, subsequently generating factors based on these variables. The database obtained through quantitative sampling was rendered more manageable through the implementation of factors. Additionally, given the successful validation of the H3 hypothesis, it became crucial to minimize the number of dimensions within the measured set of variables. Thirteen groups were created based on the correlation of observed variables and an a priori research framework. These groups are outlined in Table 2. The factors contain the answers from the questionnaire by grouping. The individual groups were combined during the SPSS analysis, according to which variables showed a strong correlation.
In the next part of the research, these groups of measurement variables were listed, then complex factors were created with the help of factor analysis, applying the principal component method, Kaiser normalization, and Varimax rotation. The obtained factors of the 5 EFA models are shown in Table 2.
On the basis of the variance analysis, the most important lesson was that we must pay close attention to the following factors in order of importance for the operation of a completely optimal logistics system:
  • building adequate production/service capacity—adequate infrastructure;
  • supply of specialists—the existence of a sufficient number of qualified workers;
  • IT supply—software support for company management is optimal.
The table presents the average disparities in the factors, categorized by the level of satisfaction that companies have with their logistical processes. The computation of significance values has been performed using ANOVA, and asterisks are used to indicate the locations where statistically significant differences exist.
Regarding the economic context, companies that expressed dissatisfaction with their logistics operations demonstrated a noteworthy negative mean (−0.665), whereas companies that reported partial satisfaction displayed a modest positive mean (0.169). This observation implies that there is potential for enhancement in this aspect. The observed difference between the groups was found to be statistically significant (F = 6.339, p = 0.002).
It is noteworthy that companies with higher levels of satisfaction with IT support and capacity exhibited a significantly positive mean value (0.564), indicating a favorable level of satisfaction. Conversely, companies with lower levels of satisfaction reported a negative mean value (−0.427), suggesting a less favorable level of satisfaction. The obtained results were found to be statistically significant (F = 7.254, p = 0.001), indicating a significant relationship between information technology (IT) and satisfaction with logistics.
The companies that expressed higher levels of satisfaction generally exhibited higher positive means, suggesting a lower occurrence of logistical problems. Conversely, the companies that expressed lower levels of satisfaction exhibited negative means, indicating a notable presence of significant problems. The observed disparities exhibited statistical significance in various areas, such as logistics system problems (F = 29.171, p < 0.001) and organizational problems (F = 12.824, p < 0.001).
Nevertheless, the levels of satisfaction did not exhibit a statistically significant disparity concerning matters pertaining to suppliers and labor shortages (F = 0.764, p = 0.468), indicating that this particular domain may pose challenges universally. The results indicate that there was a substantial and statistically significant disparity in operational issues (F = 67.593, p < 0.001). It was observed that companies with the highest level of satisfaction exhibited the most positive average (1.276), underscoring the significance of efficient operations in relation to overall satisfaction. In the ‘Developments’ category, companies that expressed lower levels of satisfaction with their logistics operations generally indicated positive averages, indicating a higher level of involvement in actively pursuing enhancements. The observed disparities in planning developments were found to be statistically significant (F = 15.178, p < 0.001).
The aforementioned findings emphasize the intricate relationship between different facets of logistics and satisfaction, serving as a strong foundation for enhancing logistics management. (Table 3 shows the concrete relationships values and results.)
As mentioned, the factors (e.g., economic situation) were implemented on the basis of the SPSS results. By this, the given factors contain everything valuable, connecting to the given topic, like the economic situation, the financial possibilities, the basic income, and the market situation, while the administrative problems the filing, track n’ trace, and update problems. On the basis of these factors, the SEM model (with the method of structural equation modeling) of the logistics processes of ZC enterprises (see the Figure 4 below) was implemented for the examination of the H3 hypothesis.
If we study the model closer (in Figure 4), it is clearly visible that the model includes a wide range of logical cause-and-effect relationships, many of which were unknown before the research. The model has four vertical dimensions, which are the following:
  • the current situation,
  • the problem types,
  • the caused damages
  • and the needed developments for solving the problems.
The analysis reveals several discernible connections, such as the correlation between supplier and labor force issues and the prevailing economic conditions. In the event that we encounter notable challenges in the realm of suppliers and the labor force that surpass the average, it becomes apparent that our economic condition will concurrently undergo a decline. In the realm of border crossing, there exists a consistent negative correlation whereby companies experience heightened difficulties in crossing borders when faced with unfavorable economic conditions and inadequate IT support. (This outcome was also anticipated).
The model exhibited unexpected values and relationships. In this analysis, it is imperative to emphasize the correlation between IT support and external environmental issues, as well as the link between the economic situation and operational damages. Based on fundamental logic and empirical evidence, it was anticipated that a negative correlation would exist, implying that an improvement in the economic situation would result in reduced operational damages. Specifically, this expectation was particularly applicable to IT support, as it was hypothesized that higher levels of IT support would correspond to a decrease in external environmental issues. As observed in the present context, it is evident that a plausible rationale for the perceived economic advantage of larger companies lies in their greater financial resources. However, it is important to note that at this level, specifically beyond the small and medium-sized enterprise (SME) level, operational losses assume a considerably greater magnitude, if they occur. Despite the improved economic conditions, instances of operational destruction are perceived to be more significant in comparison to the majority of small and medium-sized enterprises (SMEs). This theory was partially validated through the reevaluation of the sample, however; further investigation is required to thoroughly understand the phenomenon over an extended period of time.
Another aspect of the relationship pertained to the efficiency of IT support. Within the context of this section, the outcomes obtained unequivocally validated our hypotheses, as there was a robust positive correlation observed between the level of IT support and both logistics system issues and organizational challenges. Despite the availability of extensive IT support, a significant number of local companies fail to effectively utilize these resources. Consequently, despite the increased level of support, there is a corresponding increase in organizational or logistics system issues within the supply chain. This phenomenon is primarily manifested in companies characterized by intricate logistical operations yet lacking in sufficiently developed logistics software support. This practice was commonly observed in small and medium-sized enterprises (SMEs) and, to a lesser extent, in certain multinational corporations.
It is imperative to acknowledge that administrative problems constitute a distinct and autonomous factor within the model. The absence of a cause-and-effect relationship between these factors suggests that administrative problems can arise independently of the economic situation and IT support.
Additionally, it is crucial to emphasize the resultant consequences of these issues. Upon closer examination of the model, it becomes evident that this issue has both strategic and operational ramifications. The relationship between the second dimension, namely problems, and the third dimension, namely damages, exhibits a positive correlation. This implies that an increase in the magnitude of a problem is associated with a corresponding increase in the magnitude of the resulting damages. The relationship between the logistics system and operative damage is the most robust, thereby providing additional support for our hypothesis.
In terms of the dimension of damage, it is observed that four of the problems give rise to strategic damages. Anticipated challenges in the areas of organization, administration, and the external environment were expected due to the historical inclusion of these territories in strategic plans. In addition to the points, a noteworthy aspect of consideration was the issue surrounding border crossing difficulties. In terms of elucidation, it has been observed that this particular issue has exhibited a consistent recurrence within each designated timeframe. Owing to its regular manifestation, the resultant impact is perceived to be less immediate in nature, primarily lacking operational consequences but rather possessing a more profound strategic significance.
As evident from the preceding figure, it is observed that approximately fifty percent of the issues result in direct operational damages. The immediate occurrence of operational issues can be attributed to the logical consequences of both labor force shortages and supplier difficulties. Administrative issues can give rise to both operational and strategic challenges. The primary and most robust correlation identified earlier was the association between logistical system issues and operational impairments. At this stage of the study, a “relation route” was effectively identified within the model that provides support for hypothesis H3 (refer to the Figure 5 presented below).
In order to analyze this route (shown in Figure 5 with grey colour), it can be posited that the effectiveness of IT support and capacity within local businesses has a direct impact on their logistical processes at a systemic level. It is observed that inadequate efficiency in this regard leads to operational disruptions in practice. Based on the analysis of the sample, a significant portion of the hypotheses were validated, with the exception of the inquiry regarding the demand for a solution.
In order to comprehensively analyze the subject matter, it is imperative to investigate the correlation between operational damages and the process of planning development. Prior to conducting the research, it was hypothesized that a significant positive correlation would exist between the two variables. However, the obtained results revealed a contrary relationship. This implies that in cases where the damages incurred by the operative are substantial among the majority of respondents, there is a diminished requirement for planning development. Indeed, it is worth noting that the converse holds true as well, whereby a high demand for planning development corresponds to low damages.
Initially, we were taken aback by the direction of the relationship. However, upon conducting a thorough examination of the responses, we were able to formulate several plausible explanations for this phenomenon. One potential factor is that when a company experiences significant success, it is able to allocate greater resources towards strategic and operational planning. This leads to a paradox in which the company, despite minimizing operational costs, places considerable emphasis on planning. Simultaneously, the company actively seeks out novel approaches to enhance operational efficiency.
Indeed, the converse holds true in this scenario as well, indicating that in other types of companies, when the damages incurred are substantial, there is a lack of inclination towards seeking new avenues for development tools. Based on the responses, it is evident that these companies primarily experience operational losses due to their inability to allocate resources towards operational and strategic planning. The individuals’ perception also exhibited a profound sense of despondency, which can be most accurately characterized as a morale marked by the belief that no solutions or interventions are effective. This implies that the efficiency of IT support is lacking, there are significant issues with the logistics system, and operational damages are prevalent. Consequently, under these circumstances, the need for planning becomes superfluous. Another subset of respondents in this study does not exhibit symptoms of depression. Instead, they lack knowledge about planning techniques or do not recognize or acknowledge their significance in crisis management. In both instances, the outcome is identical.
No causal relationship was observed between strategic damages and solution demand in the model. The primary explanation for this phenomenon lies in the fact that the responses provided by the companies predominantly reflect their perceptions of the presented issues, the extent of the damages incurred, and the appropriate course of action to be taken. The central concept under consideration in this instance is perception, which consequently leads to the logical inference that participants predominantly perceive practical (daily) consequences and prioritize them as their primary focus. Although the participants occupy decision-making positions, they tend to approach the questionnaire by primarily considering their daily business operations. However, this does not imply that they lack an understanding of strategic fit. Rather, they tend to have a clearer perception of these outcomes and processes when assessed through year-end or period results. A significant takeaway from this is that local companies should allocate greater resources towards the dissemination of their strategy during the implementation of routine processes.
To provide a concise overview of the model and its correlation, the local companies can be delineated based on the following characteristics:
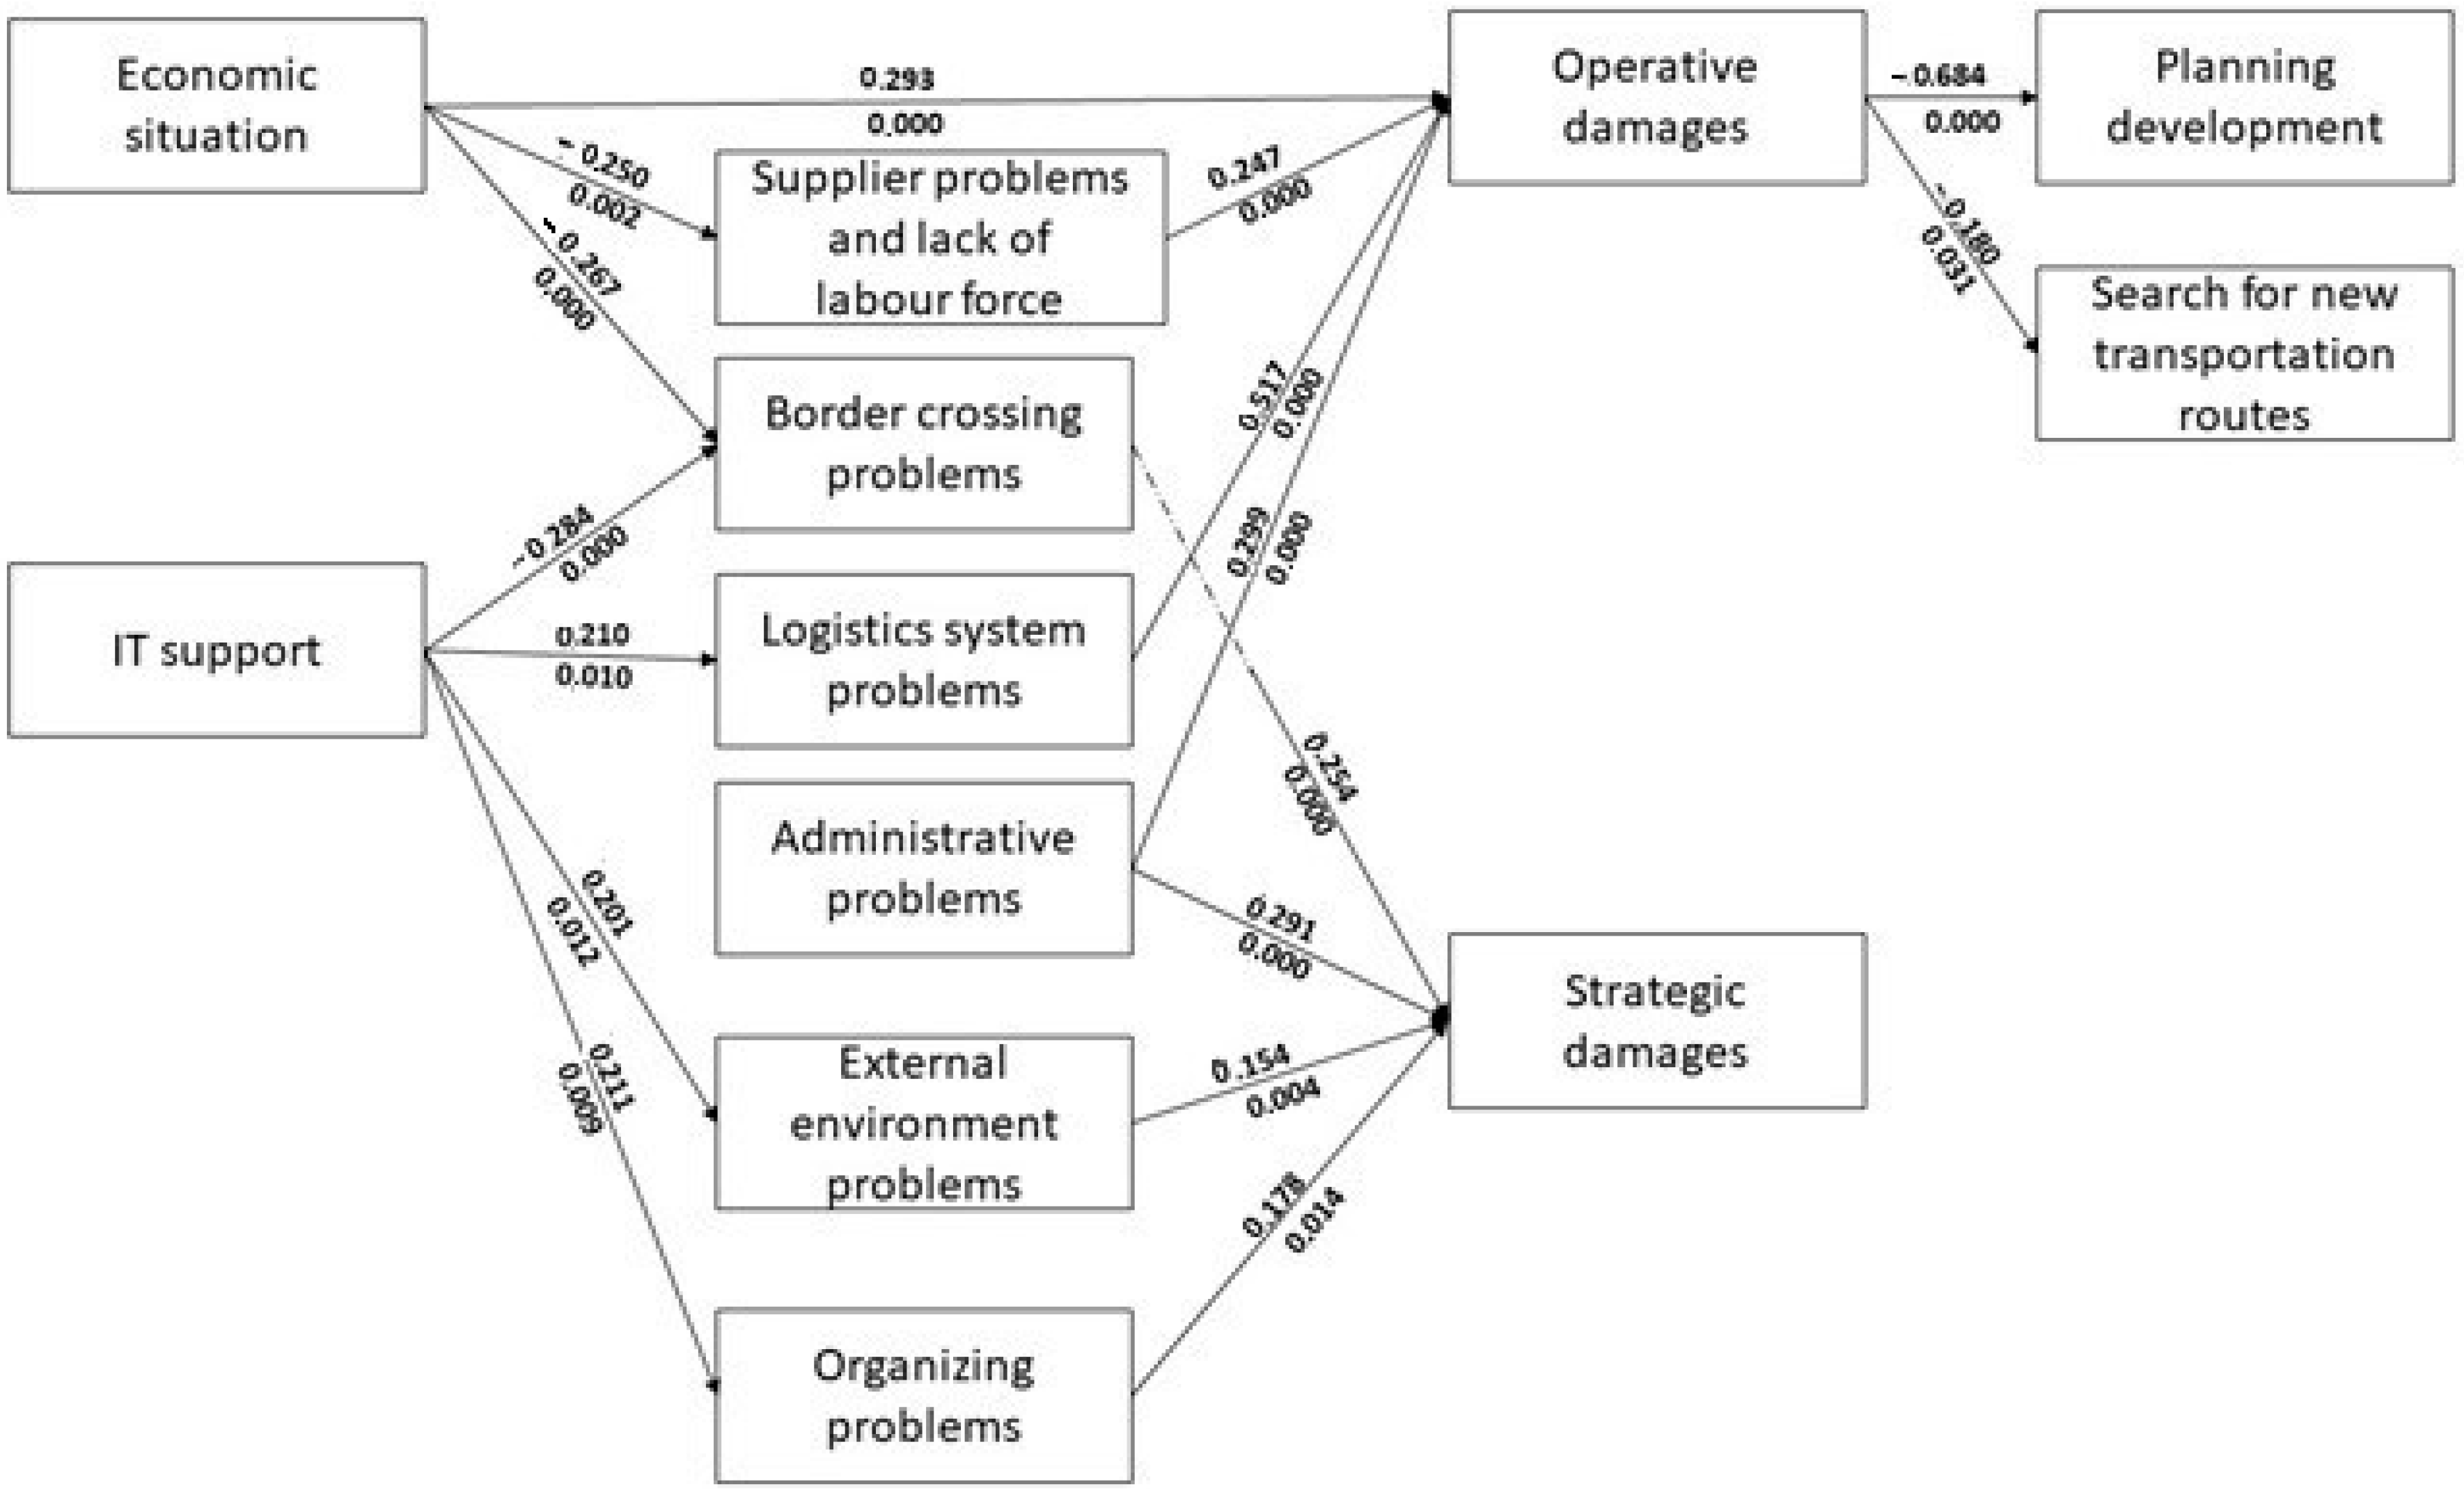
  • Companies have a given level of IT support and capacity in logistics, but they use the facilities in an inefficient way;
  • This causes serious logistics problems at the system level;
  • From these barriers to the everyday material flow, instant and direct operative damages are created;
  • Well-prospered companies with proper planning (e.g., the PDCA approach) can handle these problems and keep the damages low.
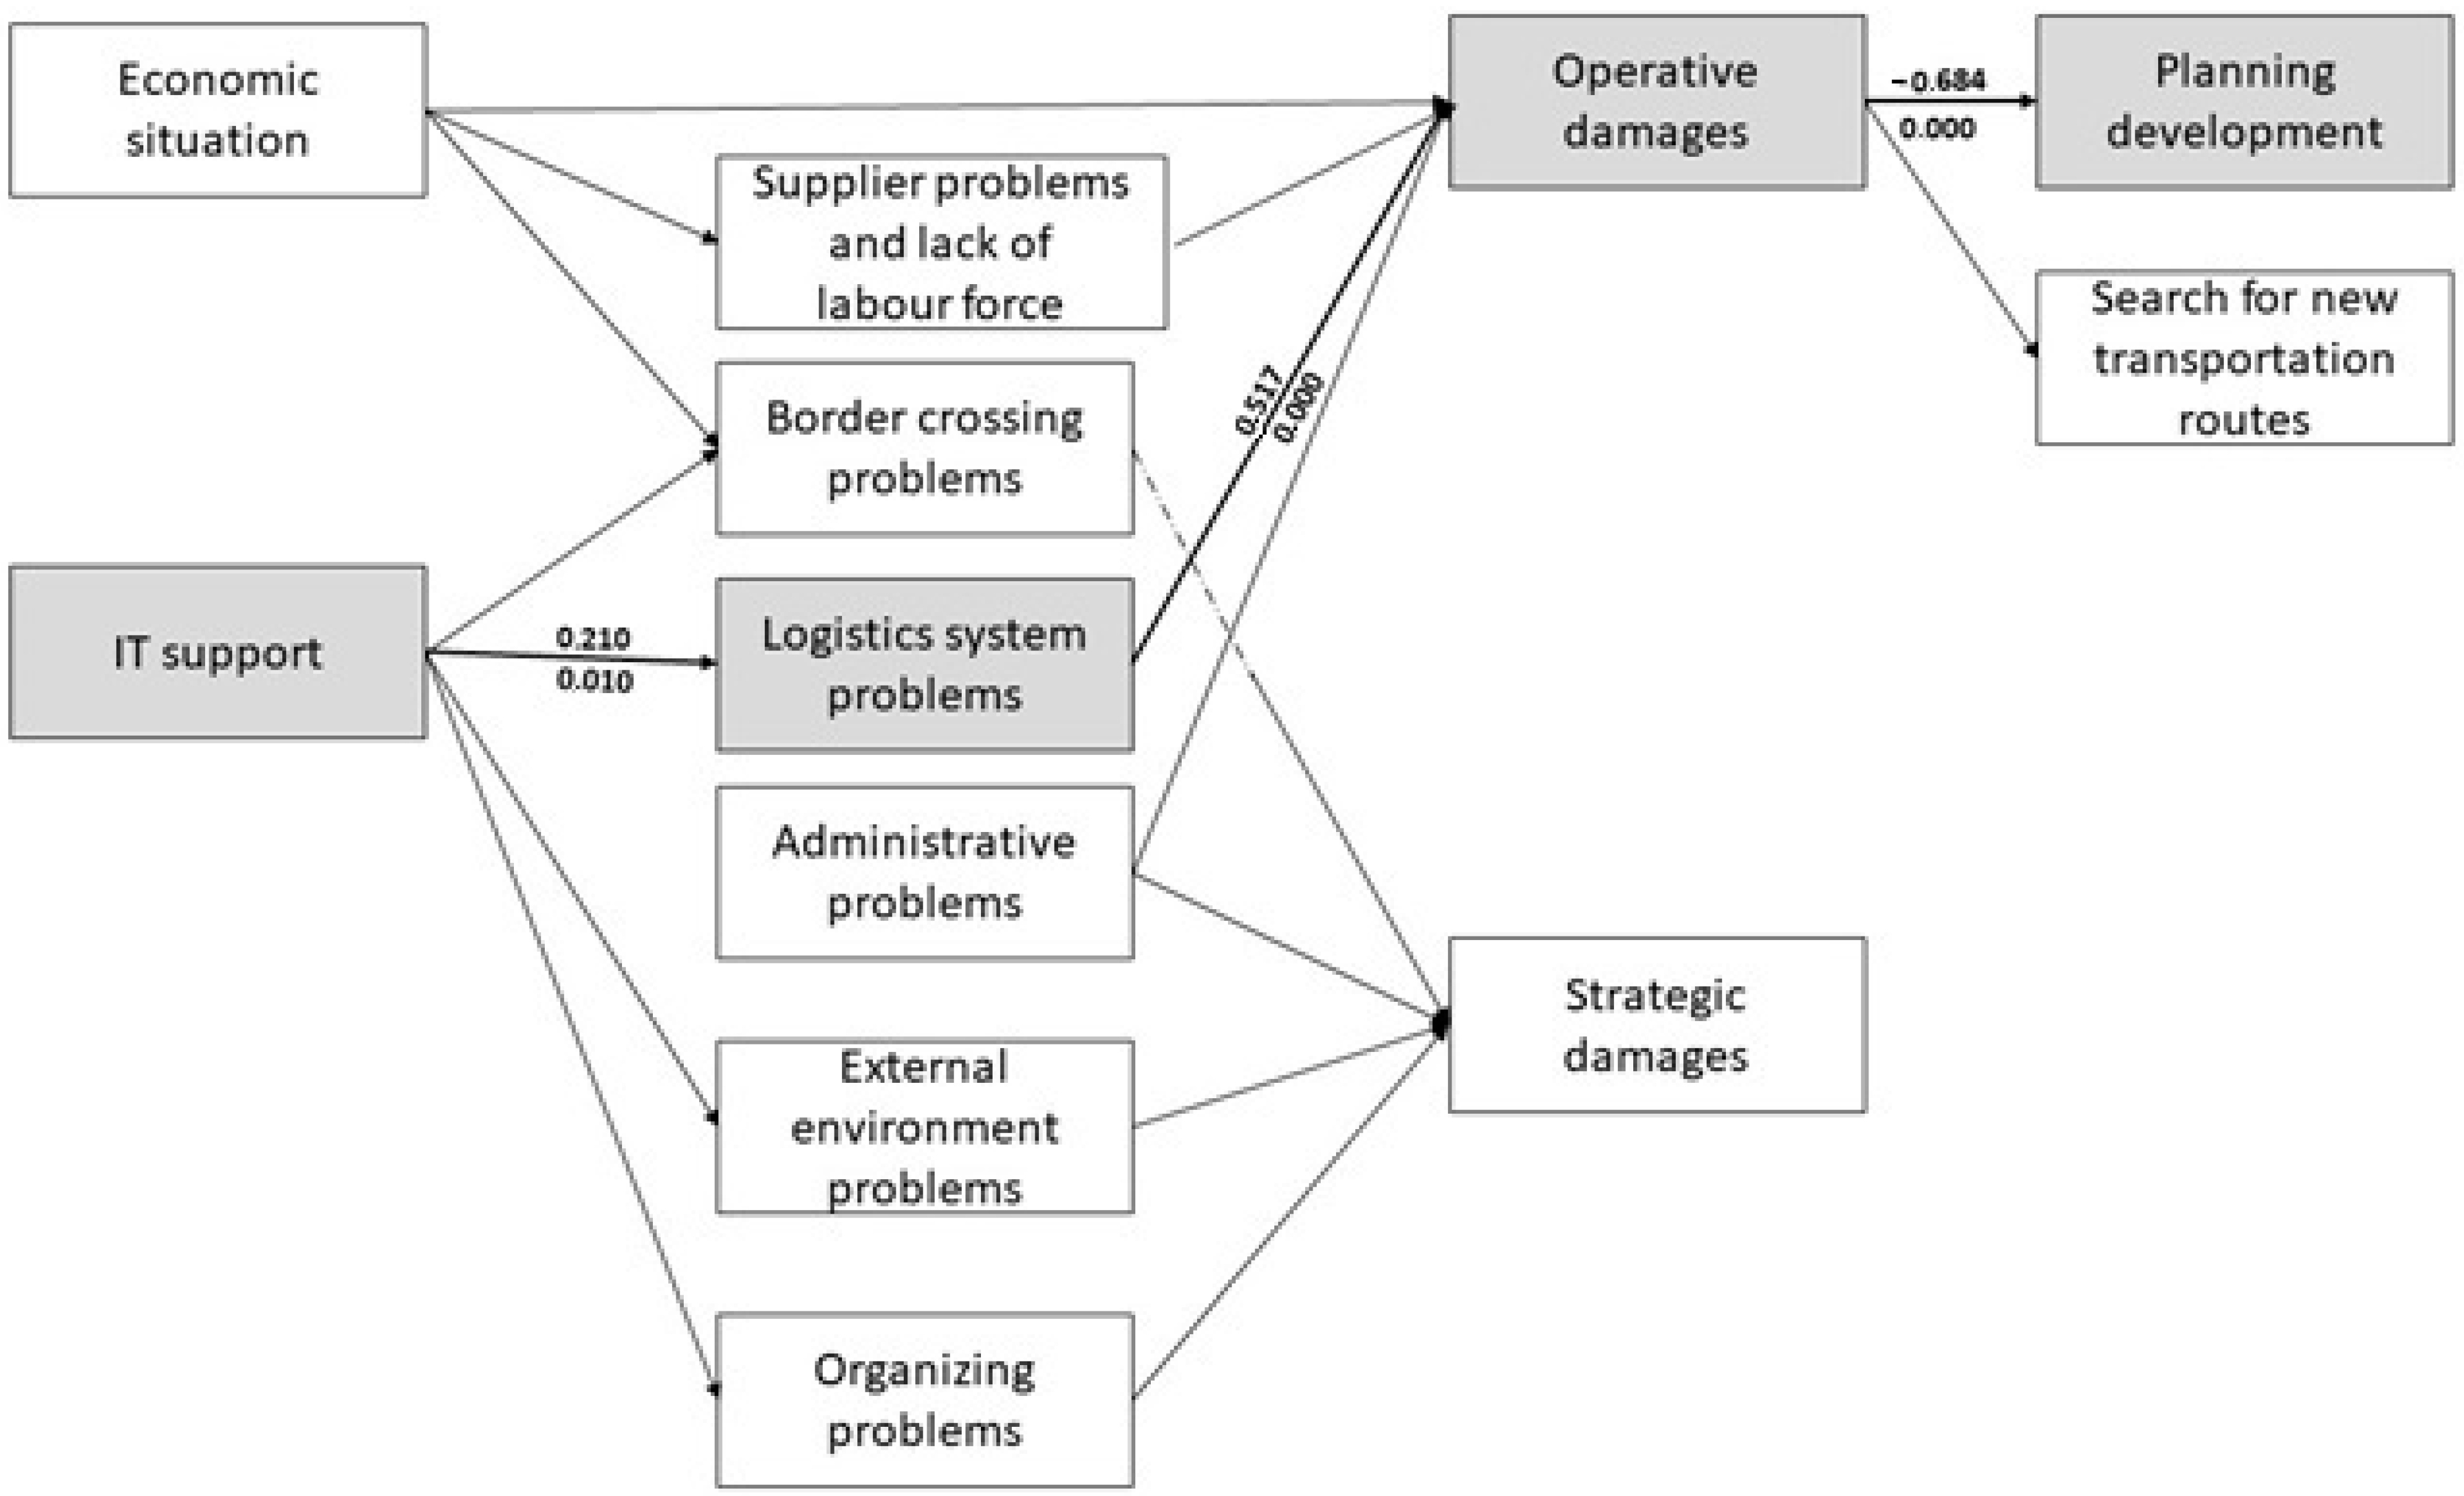
  • Despite this, these enterprises show a strong demand for planning and new approaches;
  • The type of the company suffers from serious system problems and operative damages resulting from it but they do not pay attention to the planning and introduction of new tools.
Based on the findings acquired, it can be concluded that the utilization of the IT system is not optimized, resulting in logistical challenges and subsequent operational issues. The H3 hypothesis was partially supported, leading to its elevation to the status of a thesis (T3). The complete acceptance of the solution was contingent upon the confirmation of the demand, which was not definitively established. The investigation of this relationship will constitute a forthcoming undertaking within the context of our extensive research agenda.

5. Conclusions, Limitations and Future Research Direction

The primary objective of this study was to assess the fundamental demand for a new simulation tool based on internal company data. Within this, the paper examined the satisfaction levels of ZC companies with their logistics processes, determined the significance of any issues within these processes, and gained a general understanding of the utilization of IT tools, associated problems, damages, and potential solutions. The findings provide compelling evidence that there exists a notable level of dissatisfaction within the local logistics processes, while there is a strong need for new decision support software capable of facilitating the reorganization of logistics processes. As the SEM was implemented, it has been observed that the fundamental IT solutions are being utilized in an inefficient manner by the local companies, resulting in logistical system issues and operational damages. However, the solution sought for addressing this phenomenon lacks clarity, as it was anticipated that an alternative approach would be taken in this regard. The most important academic contribution of the results is that a new simulation research territory was validated on the local level. On the other hand, the current paper has some limitations. The most obvious one is the location. The research was conducted in Zala County, so a rightful question is: how do these processes develop in other areas? This can limit the generalizability of the results. Another limitation is the question of service logistics. In the study, we only dealt with hard-logistics processes, but an interesting question is: is it possible to implement the research in the field of information flow only? The third limitation is the resulting effects of logistics problems and risk management. These topics need a deeper analysis, as many of the respondents could not answer these aspects properly. The future research direction involves the expansion of the current survey on the national level as well as the acquisition of data and the implementation of sampling techniques for the simulation model (based on inner company data). After successful sampling, the next undertaking is to solve the model through simulation. It is anticipated that, over an extended period of time, the outcomes obtained will serve as the foundation for the development of a decision support system.

Author Contributions

Conceptualization, K.S. and R.K.; methodology, K.S. and R.K.; software, R.K.; validation, L.S and K.S.; formal analysis, K.S.; investigation, K.S., resources K.S. and L.S., data curation, K.S.; writing—original draft preparation, K.S.; writing—review and editing, K.S.; visualization, L.S.; supervision, L.S. All authors have read and agreed to the published version of the manuscript.

Funding

This research received no external funding.

Data Availability Statement

Data are contained within the article.

Conflicts of Interest

The authors declare no conflicts of interest.

References

  1. Pató, B.S.G.; Herczeg, M. The Effect of the COVID-19 on the Automotive Supply Chains. Stud. Univ. Babes-Bolyai Oeconomica 2020, 65, 1–11. [Google Scholar] [CrossRef]
  2. Gubán, M.; Kovács, G.; Kot, S. Simulation of Complex Logistical Service Processes. Manag. Prod. Eng. Rev. 2017, 8, 19–29. [Google Scholar] [CrossRef]
  3. Szabó, L.; Szabó, K.; Gubán, M. Territorial examination of the logistics processes of enterprises. Prosperitas 2020, 7, 66–77. [Google Scholar] [CrossRef]
  4. Szabó, K.; Szabó, L. Measurement of logistics processes for potential optimization purposes at enterprises based in a Hungarian county. Prosperitas 2023, 10, 4. [Google Scholar] [CrossRef]
  5. Scukanec, A.; Rogic, K.; Babic, D. Bullwhip effect in supply chains. Promet-Traffic Transp. 2007, 19, 289–293. [Google Scholar]
  6. Moon, K.L.K.; Lee, J.Y.; Lai, S.Y.C. Key drivers of an agile, collaborative fast fashion supply chain Dongdaemun fashion market. J. Fash. Mark. Manag. 2017, 21, 278–297. [Google Scholar] [CrossRef]
  7. Shu, T.; Chen, S.; Lai, K.K.; Xie, C.; Wang, S.Y. A study of collaborative planning forecasting replenishment mechanism of agile virtual enterprises. In Proceedings of the 2006 IEEE International Conference on Management of Innovation and Technology, Singapore, 21–23 June 2006; Volume 1–2. [Google Scholar]
  8. Arango, M.D.; Zapata, J.A. Multiobjective Model for The Simultaneous Optimization of Transportation Costs, Inventory Costs and Service Level in Goods Distribution. IEEE Lat. Am. Trans. 2017, 15, 129–136. [Google Scholar] [CrossRef]
  9. Forgerini, F.L.; de Sousa, O.F. Flow optimization process in a transportation network. Mod. Phys. Lett. B 2021, 35, 2150113. [Google Scholar] [CrossRef]
  10. Szentesi, S.; Illes, B.; Cservenak, A.; Skapinyecz, R.; Tamas, P. Multi-Level Optimization Process for Rationalizing the Distribution Logistics Process of Companies Selling Dietary Supplements. Processes 2021, 9, 1480. [Google Scholar] [CrossRef]
  11. Tarapata, Z.; Nowicki, T.; Antkiewicz, R.; Dudzinski, J.; Janik, K. Data-Driven Machine Learning System for Optimization of Processes Supporting the Distribution of Goods Services—A case study. Procedia Manuf. 2020, 44, 60–67. [Google Scholar] [CrossRef]
  12. Ekren, B.Y.; Stylos, N.; Zwiegelaar, J.; Kumar, V.; Turhanlar, E.E. Additive manufacturing integration in E-commerce supply chain network to improve resilience and competitiveness. Simul. Model. Pract. Theory 2023, 122, 102676. [Google Scholar] [CrossRef]
  13. Jiang, Y.; Zhao, X.M.; Zhai, L.Y. Digital empowerment to improve the operational profitability in e-commerce supply chain. Electron. Commer. Res. Appl. 2023, 58, 101253. [Google Scholar] [CrossRef]
  14. Sodhi, M.S.; Tang, C.S. Supply Chain Management for Extreme Conditions: Research Opportunities. J. Supply Chain. Manag. 2021, 57, 7–16. [Google Scholar] [CrossRef]
  15. Wang, W.X.; Wang, S.Z.; Su, J.F. Integrated Production and Transportation Scheduling in E-Commerce Supply Chain with Carbon Emission Constraints. J. Theor. Appl. Electron. Commer. Res. 2021, 16, 2554–2570. [Google Scholar] [CrossRef]
  16. Garcia, D.J.; You, F.Q. Supply chain design and optimization: Challenges and opportunities. Comput. Chem. Eng. 2015, 81, 153–170. [Google Scholar] [CrossRef]
  17. Kassmann, D.; Allgor, R. Supply Chain Design, Management and Optimization. Comput. Aided Chem. Eng. 2006, 21, 101–106. [Google Scholar]
  18. Sun, O.; Fan, N. A Review on Optimization Methods for Biomass Supply Chain: Models and Algorithms, Sustainable Issues, and Challenges and Opportunities. Process Integr. Optim. Sustain. 2020, 4, 203–226. [Google Scholar] [CrossRef]
  19. Chen, Y.P.; Iyengar, G.; Wang, C. Robust Inventory Management: A Cycle-Based Approach. M SOM-Manuf. Serv. Oper. Manag. 2022, 25, 371–810. [Google Scholar] [CrossRef]
  20. De Moor, B.J.; Gijsbrechts, J.; Boute, R.N. Reward shaping to improve the performance of deep reinforcement learning in perishable inventory management. Eur. J. Oper. Res. 2022, 301, 535–545. [Google Scholar] [CrossRef]
  21. Khan, M.; Alshahrani, A.N.; Jacquemod, J. Digital Platforms and Supply Chain Traceability for Robust Information and Effective Inventory Management: The Mediating Role of Transparency. Logistics 2023, 7, 25. [Google Scholar] [CrossRef]
  22. Panigrahi, R.R.; Mishra, P.C.; Samantaray, A.; Jena, D. Management of inventory for firms’ efficiency—A study on steel manufacturing industry. J. Adv. Manag. Res. 2022, 19, 443–463. [Google Scholar] [CrossRef]
  23. Nagashima, M.; Wehrle, F.T.; Kerbache, L.; Lassagne, M. Impacts of adaptive collaboration on demand forecasting accuracy of different product categories throughout the product life cycle. Supply Chain. Manag.-Int. J. 2015, 20, 415–433. [Google Scholar] [CrossRef]
  24. Yani LP, E.; Aamer, A. Demand forecasting accuracy in the pharmaceutical supply chain: A machine learning approach. Int. J. Pharm. Healthc. Mark. 2023, 17, 1–23. [Google Scholar] [CrossRef]
  25. Bandaly, D.; Satir, A.; Shanker, L. Impact of lead time variability in supply chain risk management. Int. J. Prod. Econ. 2016, 180, 88–100. [Google Scholar] [CrossRef]
  26. Dominguez, R.; Cannella, S.; Ponte, B.; Framinan, J.M. On the dynamics of closed-loop supply chains under remanufacturing lead time variability. Omega-Int. J. Manag. Sci. 2020, 97, 102106. [Google Scholar] [CrossRef]
  27. Islam, T.; Azeem, A.; Jabir, M.; Paul, A.; Paul, S.K. An inventory model for a three-stage supply chain with random capacities considering disruptions and supplier reliability. Ann. Oper. Res. 2022, 315, 1703–1728. [Google Scholar] [CrossRef] [PubMed]
  28. Kamalahmadi, M.; Mellat-Parast, M. Developing a resilient supply chain through supplier flexibility and reliability assessment. Int. J. Prod. Res. 2016, 54, 302–321. [Google Scholar] [CrossRef]
  29. Wang, C.; Li, M.C.; Cui, N.F. Improving reliability of assembly supply chains with disruption risk: Stakeholders’ subsidy interplay. Int. J. Prod. Res. 2023. [Google Scholar] [CrossRef]
  30. Shukla, V.; Naim, M.M. Sensing endogenous seasonality in the case of a coffee supply chain. Int. J. Logist.-Res. Appl. 2018, 21, 279–299. [Google Scholar] [CrossRef]
  31. Shukla, V.; Naim, M.M.; Thornhill, N.F. Rogue seasonality detection in supply chains. Int. J. Prod. Econ. 2012, 138, 254–272. [Google Scholar] [CrossRef]
  32. Ganesan, S.; Wicaksono, H.; Valilai, O.F. Enhancing Vendor Managed Inventory with the Application of Blockchain Technology. In Advances in System-Integrated Intelligence, SYSINT 2022; Valle, M., Lehmhus, D., Gianoglio, C., Ragusa, E., Seminara, L., Bosse, S., Thoben, K.D., Eds.; Springer: Cham, Switzerland, 2023. [Google Scholar] [CrossRef]
  33. Hong, X.P.; Wang, C.Y.; Xu, L.; Diabat, A. Multiple-vendor, multiple-retailer based vendor-managed inventory. Ann. Oper. Res. 2016, 238, 277–297. [Google Scholar] [CrossRef]
  34. Lin, H.J. Investing in lead-time variability reduction in a collaborative vendor-buyer supply chain model with stochastic lead time. Comput. Oper. Res. 2016, 72, 43–49. [Google Scholar] [CrossRef]
  35. Wen, C.L.; Wee, H.M.; Wu, S.M. Revisiting Lean Manufacturing Process with Vendor Managed Inventory System. In Proceedings of the 5th International Asia Conference on Industrial Engineering and Management Innovation (IEMI2014), Xi’an, China, 21–22 July 2014. [Google Scholar] [CrossRef]
  36. Guan, Z.L.; Zhang, X.M.; Zhou, M.S.; Dan, Y.R. Demand information sharing in competing supply chains with manufacturer-provided service. Int. J. Prod. Econ. 2020, 220, 107450. [Google Scholar] [CrossRef]
  37. Lee, T.S.; Zhou, Q. The Effect of Supply Information Sharing in a Supply Chain. In Proceedings of the Fourth International Conference on Operations and Supply Chain Management (ICOSCM 2010), Hong Kong and Guiangzhou, China, 25–31 July 2010. [Google Scholar]
  38. Baah, C.; Agyeman, D.O.; Acquah, I.S.K.; Agyabeng-Mensah, Y.; Afum, E.; Issau, K.; Ofori, D.; Faibil, D. Effect of information sharing in supply chains: Understanding the roles of supply chain visibility, agility, collaboration on supply chain performance. Benchmarking-Int. J. 2022, 29, 434–455. [Google Scholar] [CrossRef]
  39. Manavalan, E.; Jayakrishna, K. A review of Internet of Things (IoT) embedded sustainable supply chain for industry 4.0 requirements. Comput. Ind. Eng. 2019, 127, 925–953. [Google Scholar] [CrossRef]
  40. Qureshi, M. Evaluating Enterprise Resource Planning (ERP) Implementation for Sustainable Supply Chain Management. Sustainability 2022, 14, 14779. [Google Scholar] [CrossRef]
  41. Hsiao, S.J.; Sung, W.T. Blockchain-Based Supply Chain Information Sharing Mechanism. IEEE Access 2022, 10, 78875–78886. [Google Scholar] [CrossRef]
  42. Xue, X.F.; Dou, J.P.; Shang, Y. Blockchain-driven supply chain decentralized operations—Information sharing perspective. Bus. Process Manag. J. 2021, 27, 184–203. [Google Scholar] [CrossRef]
  43. Bratt, C.; Sroufe, R.; Broman, G. Implementing Strategic Sustainable Supply Chain Management. Sustainability 2021, 13, 8132. [Google Scholar] [CrossRef]
  44. Nieuwenhuis, P.; Touboulic, A.; Matthews, L. Is Sustainable Supply Chain Management Sustainable? In Sustainable Development Goals and Sustainable Supply Chains in the Post-Global Economy; Yakovleva, N., Frei, R., Murthy, S.R., Eds.; Springer: Cham, Switzerland, 2019; Volume 7. [Google Scholar] [CrossRef]
  45. Mridha, B.; Pareek, S.; Goswami, A.; Sarkar, B. Joint effects of production quality improvement of biofuel and carbon emissions towards a smart sustainable supply chain management. J. Clean. Prod. 2023, 386, 135629. [Google Scholar] [CrossRef]
  46. Sarkar, B.; Sarkar, M.; Ganguly, B.; Cardenas-Barron, L.E. Combined effects of carbon emission and production quality improvement for fixed lifetime products in a sustainable supply chain management. Int. J. Prod. Econ. 2021, 231, 107867. [Google Scholar] [CrossRef]
  47. Yadav, D.; Kumari, R.; Kumar, N.; Sarkar, B. Reduction of waste and carbon emission through the selection of items with cross-price elasticity of demand to form a sustainable supply chain with preservation technology. J. Clean. Prod. 2021, 297, 126298. [Google Scholar] [CrossRef]
  48. Kalkha, H.; Khiat, A.; Bahnasse, A.; Ouajji, H. The Rising Trends of Smart E-Commerce Logistics. IEEE Access 2023, 11, 33839–33857. [Google Scholar] [CrossRef]
  49. Wang, S.L.; Zhang, X. Influence of Environmental Regulation on Corporate Green Supply Chain Management: The Regulating Effect of Environmental Dynamism. Front. Environ. Sci. 2022, 10, 947022. [Google Scholar] [CrossRef]
  50. Jaegler, A.; Goessling, T. Sustainability concerns in luxury supply chains: European brand strategies and French consumer expectations. Bus. Strategy Environ. 2020, 29, 2715–2733. [Google Scholar] [CrossRef]
  51. Le, T.T. Linking big data, sustainable supply chain management and corporate performance: The moderating role of circular economy thinking. Int. J. Logist. Manag. 2023, 34, 744–771. [Google Scholar] [CrossRef]
  52. Gkountani, V.A.; Tsoulfas, G.T.; Mouzakitis, Y. Mapping sustainability assessment methods in agri-food supply chains: A circular economy perspective. Sci. Pap.-Ser. Manag. Econ. Eng. Agric. Rural. Dev. 2022, 22, 361–368. [Google Scholar]
  53. Shahparvari, S.; Soleimani, H.; Govindan, K.; Bodaghi, B.; Fard, M.T.; Jafari, H. Closing the loop: Redesigning sustainable reverse logistics network in uncertain supply chains. Comput. Ind. Eng. 2021, 157, 107093. [Google Scholar] [CrossRef]
  54. Tavana, M.; Shaabani, A.; Santos-Arteaga, F.J.; Valaei, N. An integrated fuzzy sustainable supplier evaluation and selection framework for green supply chains in reverse logistics. Environ. Sci. Pollut. Res. 2021, 28, 53953–53982. [Google Scholar] [CrossRef]
  55. Bikfalvi, P.; Dudás, L.; Hornyák, O.; Kulcsár, G.; Nehéz, K.; Tóth, T. Logisztikai Informatika; Nemzeti Tankönyvkiadó: Budapest, Hungary, 2009. [Google Scholar]
  56. Goldston, J. The Evolution of ERP Systems: A Literature Review. Int. J. Innov. Sci. Res. Technol. 2020, 5, 9–17. [Google Scholar] [CrossRef]
  57. Schubert, A. Az Ellátási Lánc Információs Folyamatai/Information Processes of the Supply Chain (Műhelytanulmányok No. 85); Budapesti Corvinus Egyetem: Budapest, Hungary, 2007. [Google Scholar]
  58. Elbahri, F.M.; Ismael Al-Sanjary, O.; Ali, M.A.M.; Ali Naif, Z.; Ibrahim, O.A.; Mohammed, M.N. Difference Comparison of SAP, Oracle, and Microsoft Solutions Based on Cloud ERP Systems: A Review. In Proceedings of the 2019 IEEE 15th International Colloquium on Signal Processing & Its Applications (CSPA), Penang, Malaysia, 8–9 March 2019; pp. 65–70. [Google Scholar] [CrossRef]
  59. Liebetrau, F.; Mockel, A. Anomaly investigation of electric drive systems using big scattered test stand data on the example of a PMSM traction drive. In Proceedings of the 2021 IEEE 13th International Symposium on Diagnostics for Electrical Machines, Power Electronics and Drives (SDEMPED), Dallas, TX, USA, 22–25 August 2021; pp. 422–426. [Google Scholar] [CrossRef]
  60. Monroy, C.; Domínguez-Martínez, E.; Taylor, B.; Marin, O.P.; Parise, E.; Reid, V.M. Understanding the causes and consequences of variability in infant ERP editing practices. Dev. Psychobiol. 2021, 63, e22217. [Google Scholar] [CrossRef] [PubMed]
  61. Wilson, M.; Paschen, J.; Pitt, L. The circular economy meets artificial intelligence (AI): Understanding the opportunities of AI for reverse logistics. Manag. Environ. Qual. Int. J. 2022, 33, 9–25. [Google Scholar] [CrossRef]
  62. Yathiraju, N. Investigating the use of an Artificial Intelligence Model in an ERP Cloud-Based System. Int. J. Electr. Electron. Comput. 2022, 7, 1–26. [Google Scholar] [CrossRef]
  63. Bohács, G.; Kovács, G.; Rinkács, A. Production Logistics Simulation Supported by Process Description Languages. Manag. Prod. Eng. Rev. 2016, 7, 13–20. [Google Scholar] [CrossRef]
  64. Fehér, P.; Kő, A.; Szabó, Z. Kapacitásmodellezés és az IT-architektúra-tervezés kihívásainak vizsgálata statisztikai és prediktív analitikai eszközökkel. Statisztikai Szle. 2016, 94, 1149–1164. [Google Scholar] [CrossRef]
  65. Trappey, A.; Trappey, C.V.; Hsieh, A. An intelligent patent recommender adopting machine learning approach for natural language processing: A case study for smart machinery technology mining. Technol. Forecast. Soc. Chang. 2021, 164, 120511. [Google Scholar] [CrossRef]
  66. Adelantado, F.; Ammouriova, M.; Herrera, E.; Juan, A.A.; Shinde, S.S.; Tarchi, D. Internet of Vehicles and Real-Time Optimization Algorithms: Concepts for Vehicle Networking in Smart Cities. Vehicles 2022, 4, 1223–1245. [Google Scholar] [CrossRef]
  67. Chen, Y.T.; Sun, E.W.; Chang, M.F.; Lin, Y.B. Pragmatic real-time logistics management with traffic IoT infrastructure: Big data predictive analytics of freight travel time for Logistics 4.0. Int. J. Prod. Econ. 2021, 238, 108157. [Google Scholar] [CrossRef]
  68. Fu, Y.; Ma, X.; Gao, K.; Li, Z.; Dong, H. Multi-Objective Home Health Care Routing and Scheduling with Sharing Service via a Problem-Specific Knowledge-Based Artificial Bee Colony Algorithm. IEEE Trans. Intell. Transp. Syst. 2023. [Google Scholar] [CrossRef]
  69. Wu, Z.; Zhou, R.; Goh, M.; Wang, Y.; Xu, Z.; Song, W. (DT4Smart) a digital twin-based modularized design approach for smart warehouses. Int. J. Comput. Integr. Manuf. 2023, 1–22. [Google Scholar] [CrossRef]
  70. Szabó, K.; Szabó, L.; Csanádi, Á. Strategic analysis of Zalaegerszeg Proving Ground. J. Eng. Manag. Compet. (JEMC) 2020, 10, 38–47. [Google Scholar] [CrossRef]
  71. Lewin, K. Action Research and Minority Problems. In Resolving Social Conflicts; Harper and Row: New York, NY, USA, 1946. [Google Scholar]
  72. Sajtos, L.; Mitev, A. SPSS Kutatási és Adatelemzési Kézikönyv; Alinea Kiadó: Budapest, Hungary, 2007. [Google Scholar]
  73. Freedman, D.; Pisani, R.; Purves, R. Statisztika; Typotex: Budapest, Hungary, 2005. [Google Scholar]
  74. Snedecor, G.W.; Cochran, W.G. Statistical Methods, 8th ed.; Iowa State University Press: Ames, IA, USA, 1989. [Google Scholar]
  75. Füstös, L.; Kovács, E.; Meszéna, G.; Simonné Mosolygó, N. Alakfelismerés. Sokváltozós Statisztikai Módszerek; Új Mandátum Könyvkiadó: Budapest, Hungary, 2007. [Google Scholar]
  76. In’nami, Y.; Koizumi, R. Structural Equation Modeling in Educational Research: A Primer. In Application of Structural Equation Modeling in Educational Research and Practice; Khine, M.S., Ed.; Sense Publishers: Rotterdam, The Netherlands, 2013; pp. 23–51. [Google Scholar]
  77. Sebastian, N.; S. Nair, S.; P. Joseph, D. An overview of the pathway idea and its applications in statistical and physical sciences. Axioms 2015, 4, 530–553. [Google Scholar] [CrossRef]
  78. Szabó, K.; Szabó, L. Possibilities of short supply chains in the sustainable logistics in Zala County. J. Eng. Manag. Compet. (JEMC) 2023, 13, 140–149. [Google Scholar] [CrossRef]
  79. Hunyadi, L.; Mundruczó, G.; Vita, L. Statisztika; Aula Kiadó: Budapest, Hungary, 2000. [Google Scholar]
  80. Mosteller, F.; Tukey, J.W. Data Analisys and Regression; Addison-Wesley: Reading, MA, USA, 1977. [Google Scholar]
Figure 1. Research framework.
Logistics 08 00007 g001
Figure 2. Evaluation of own logistics processes among local companies.
Logistics 08 00007 g002
Figure 3. Frequency of delivery delays at ZC enterprises.
Logistics 08 00007 g003
Figure 4. Structural equation model of the local companies’ logistics processes.
Logistics 08 00007 g004
Figure 5. Relevant relations in connection with H3 hypothesis.
Logistics 08 00007 g005
Table 1. The number of registered enterprises in ZC.
Territorial Unit NameTerritorial Unit LevelNumber of Registered Businesses (pcs)
Győr-Moson-Soproncounty76,268
Vascounty41,396
Zalacounty52,429
Western Transdanubia (Total)region170,093
Source: Own editing on the basis of the national statistics.
Table 2. Factor analysis results of local companies’ logistics processes.
GroupsFactorsNo. of Measured VariablesKMOBartlett pTVEMin. Factor Load
Current situationEconomic situation40.7730.00067.680.612
IT support and capacity20.817
Logistics problemsLogistics system problems50.6840.00070.680.650
Administrative problems20.824
Transportation problemsExternal environmental problems40.6630.00077.320.779
Border crossing problems20.917
Organizational problems20.705
Problems with suppliers and labor shortages20.688
DamagesOperative problems40.8400.00074.450.699
Strategic problems40.633
DevelopmentsPlanning developments40.7030.00075.140.767
Market developments30.641
Search for new transportation routes10.939
Table 3. Anova results.
Groups FactorsSatisfaction with Logistics Processes
Yes, CompletelyPartially, Some Processes Need ImprovementNot Satisfied at AllFSig.p
Current situationEconomic situation−0.1410.169−0.6656.3390.002**
IT support and capacity0.564−0.083−0.4277.2540.001***
Logistics problemsLogistics system problems0.983−0.134−0.80429.1710.000***
Administrative problems0.447−0.117−0.0703.7590.026*
Transportation problemsExternal environmental problems0.503−0.2050.2997.1500.001**
Border crossing problems0.239−0.1530.4313.8950.023*
Organizational problems0.1740.142−1.00512.8240.000***
Problems with suppliers and labor shortages0.1390.003−0.2260.7640.468
DamagesOperative problems1.276−0.175−1.03767.5930.000***
Strategic problems0.556−0.160−0.0166.1560.003**
DevelopmentsPlanning developments−0.8100.1460.47515.1780.000***
Market developments−0.3420.0210.4143.4580.034*
Search for new transportation routes−0.4420.0080.6337.2090.001**
***: p < 0.001; **: 0.001 ≤ p < 0.01; *: 0.01 ≤ p < 0.05.
Disclaimer/Publisher’s Note: The statements, opinions and data contained in all publications are solely those of the individual author(s) and contributor(s) and not of MDPI and/or the editor(s). MDPI and/or the editor(s) disclaim responsibility for any injury to people or property resulting from any ideas, methods, instructions or products referred to in the content.

