1. Introduction
Over the last few years, the need for high-quality warehouse services has increased due to a series of global trends such as shorter product life cycle, greater product variety, low inventory levels, higher throughput needs, the need for rapid responses, shorter lead time, and expanded competition as well as customized orders’ fulfillment [
1,
2,
3,
4]. These trends have led most logistics companies to make efforts to improve their internal logistics operations and warehouse processes with an emphasis on the order-picking process. Order-picking is considered the most vital and costly warehouse process. As a result, special emphasis is placed on its improvement by professionals, who wish to improve the overall performance and productivity of their warehouse operations [
5]. Indeed, effective order-picking processes are necessary for attaining short lead times and improved levels of customer service, whereas ineffective order-picking processes may be a substantial jeopardy in terms of operational performance and service quality [
6].
Considering the significance of this process, as well as the rapid development of the automation industry, there are many professionals and researchers who believe that full automation of warehouses and order-picking systems would be an interesting approach to address the modern challenges faced in modern logistics systems [
7,
8]. However, the high investment costs, the high standardization needs, and the low levels of flexibility are some of the most common obstacles that so far limit the rapid implementation of automation in order-picking systems [
6]. In particular, flexibility is an important aspect of order-picking systems to accommodate changes, urgent requests, and uncertainties [
5,
8]. To this end, most warehouse managers continue to rely on human order pickers and picker-to-parts systems due to their inherent flexibility and ability to adjust to continuous changes in real-time [
9]. Indeed, up to 80% of order-picking warehouses continue to operate manually [
5,
10] by increasing the use of supported order-picking technologies instead of replacing humans with semi or fully automated order-picking systems [
6,
11].
Focusing on the development of supported order-picking technologies, a significant number of digital technologies, such as Radio Frequency (RF) scanning, Radio Frequency Identification technology (RFID), Pick-by-vision, Pick-to-light, Pick-by-voice, etc., have emerged to replace paper-based picking lists, meeting the extended needs of modern customers for increased levels of efficiency and accuracy. However, despite the general impression that these supportive and substitutive technologies can manage a series of emerging challenges such as cost-effectiveness, flexibility, stability, customer service, etc., [
12], there is still a very limited amount of research concerning the advantages and disadvantages of implementing such technologies in manual picker-to-goods order-picking systems [
6]. Indeed, considering the available literature from 2015 to date, only a limited number of articles [
13,
14,
15,
16] have specifically addressed the direct comparison of pickers-to-parts order picking technologies, while at the same time, a significant number of articles have focused on the study and comparison of different parameters related to the picking layout design, depot location, picking type, picking strategy, storage allocation policies, routing policies, order batching, etc. [
17,
18].
To this end, the main scope of this paper is to examine multiple parameters that influence the operational performance of picker-to-goods order-picking technologies. Initially, this study presents an analysis of the operational factors that affect picking completion time, with a particular focus on a comparative evaluation of alternative picker-to-goods order-picking technologies, such as Pick-by-RF Scanner, Pick-to-light, and Pick-by-vision. To achieve this goal, a three-step approach was employed, which involved conducting a literature review to identify relevant parameters, performing lab tests to evaluate the comparative assessment, and using the NASA TLX tool to assess perceived workload. The latter has been assessed as one of the most suitable perceived workload measurement tools according to [
19]. The NASA Task Load Index (NASA TLX) stands out for its comprehensive assessment approach, capturing various dimensions of workload such as mental, physical, temporal demands, performance, effort, and frustration. Its versatility makes it applicable across diverse domains, providing valuable insights into the subjective experiences of individuals in tasks and activities. The simplicity of the questionnaire enhances its usability and acceptance in research and practical settings. However, the subjective nature of the assessment introduces potential variability in responses, as individuals may interpret and rate the same task differently [
19,
20].
The structure of this article is as follows.
Section 2 provides the available literature in the field of order-picking technologies.
Section 3 presents the methodology for the design and execution of a series of experiments in a laboratory environment, while in
Section 4, the results of laboratory tests are presented in terms of completion time.
Section 5 describes the implementation steps of the NASA TLX tool and presents the results of a comparative assessment among the reviewed order-picking technologies in terms of perceived workload. Finally,
Section 5 provides the conclusion of this paper and discusses potential research opportunities and managerial implications.
2. Literature Review: Order-Picking Technologies Investigation
Most articles in the field of order-picking ignore the evaluation of the effects of order-picking technology on the performance of order-picking systems [
14]. These articles continue to execute the order-picking process with no order-picking technology, thus maintaining the level of complication at a high level and, at the same time, the level of accuracy at a low level. Nevertheless, during the last few years, a small number of studies have started to consider the impact of specific order-picking technologies on the productivity of order-picking systems. Focusing on the investigated order-picking technologies in this study (Pick-by-RF Scanner, Pick-to-light, and Pick-by-vision), as well as considering the available literature, it is observed that a few articles assess the effects of these technologies on the productivity and accuracy of the order-picking process, independently.
Pick-by-RF Scanner technology can be implemented in traditional logistics facilities to improve the Pick-by-paper systems. Therefore, some researchers [
13,
14] have evaluated its impact on order-picking performance. In this technology, handheld mobile data terminals (MDT) are used by humans for the execution of the order-picking process. The MDTs have a barcode scanner and a display to guide the order-pickers to the right picking locations and to enable them to confirm the picked products as well as their quantity [
21]. The only prerequisite to applying this technology is that all the products must be tagged with a necessary barcode label to be recognized/scanned by the order-picker during the execution of the process [
13].
Another important order-picking technology is light picking. This technology has been evaluated by several authors [
13,
14,
15,
22,
23,
24,
25]. In Pick-to-light systems the order-pickers are guided by lights and small displays that are installed in picking locations or are mounted on picking carts (pick-to-cart) [
16]. Pick-to-light systems require that order-pickers must confirm the picked quantity by pressing a button which is installed near to a small display that informs the order-pickers about the required quantity of products that must be picked. The light-picking approach is characterized by high investment cost (when compared to RF scanners and vision picking) but reduces the operational cost and at the same time increases order-picking accuracy and productivity, especially for micro-picking environments [
1,
26].
The last reviewed order-picking technology is the vision-picking technology. Vision picking is a promising order-picking technology since it can provide hands-free operation, efficient order-picking time, and high levels of accuracy [
27]. This technology can be connected either with augmented reality wearables or with non-augmented reality hardware platforms such as smart glasses and different types of head-mounted displays [
21,
28]. In cases of augmented reality wearables, the performance and the abilities of this technology can be improved significantly, especially in cases of complicated industrial environments. Considering the possible benefits of this technology, several researchers [
15] have started to study the further development of this technology.
Despite the existence of some works mentioned above, which independently study these technologies, it can be argued that only a limited number of available studies deal with the comparative assessment of pickers-to-goods order-picking technologies in manual order-picking systems [
27].
More specifically, Battini et al. [
13] present a comparative analysis of the following order-picking technologies: RF-scanning with barcode labels, RF-scanning with RFID tags, voice picking, light picking, and light picking with RFID, in terms of technological and economic points of view. This analysis takes place using a method that is based on the assessment of the costs related to each order-picking technology. Guo et al. [
16] compare four different order-picking technologies in terms of completion time, accuracy, and workload. The authors investigate the performance of order-picking processes using a head-up display (HUD), a cart-mounted display (CMD), light-picking technology, and the traditional paper-based pick list. De Vries et al. [
14], by using a real-life experiment, compare RF-terminal picking technology, voice picking technology, and light picking technology by considering a series of measurements that focus on productivity and quality performance. Furthermore, the authors explore the role of the Big Five personality traits in predicting picking performance. Fager et al. [
15] present empirical evidence of how order-picking technologies (picking with a paper-picking list, light picking, voice picking, and picking with a head-up display) affect the time efficiency of kit preparation. In particular, the authors evaluate the impact of batch preparation and order-picking density on the performance of the investigated order-picking technologies.
Despite the significant emphasis on the order-picking process in recent years [
17,
18], it is evident from the available literature that there is still a limited number of articles focusing on the comparative assessment between pickers-to-parts order-picking technologies and their impact on the performance of the order-picking process. Recognizing this research gap, this study aims to develop a comparative assessment, under certain laboratory setups, among three pickers-to-goods order-picking technologies (Pick-by-RF Scanner, Pick-to-light, and Pick-by-vision) in terms of completion time and perceived workload.
3. Design of Experiments
For the comparative assessment among different order-picking technologies, we used the design of experiments method [
29]. By using this well-known methodology, we designed and executed our laboratory experimental procedure. The design of experiments methodology helps researchers to recognize the effects of a series of factors on the performance of a process or system. Furthermore, this approach assists the researchers in recognizing the best settings configuration for these factors.
3.1. Experimental Design
This work aims to estimate and compare the efficiency of three pickers-to-goods order-picking technologies, namely vision picking, pick-to-light, and RF-scanner, via a series of laboratory tests. To achieve our initial goal, a series of laboratory experiments were conducted to identify which factors significantly impact the comparative assessment.
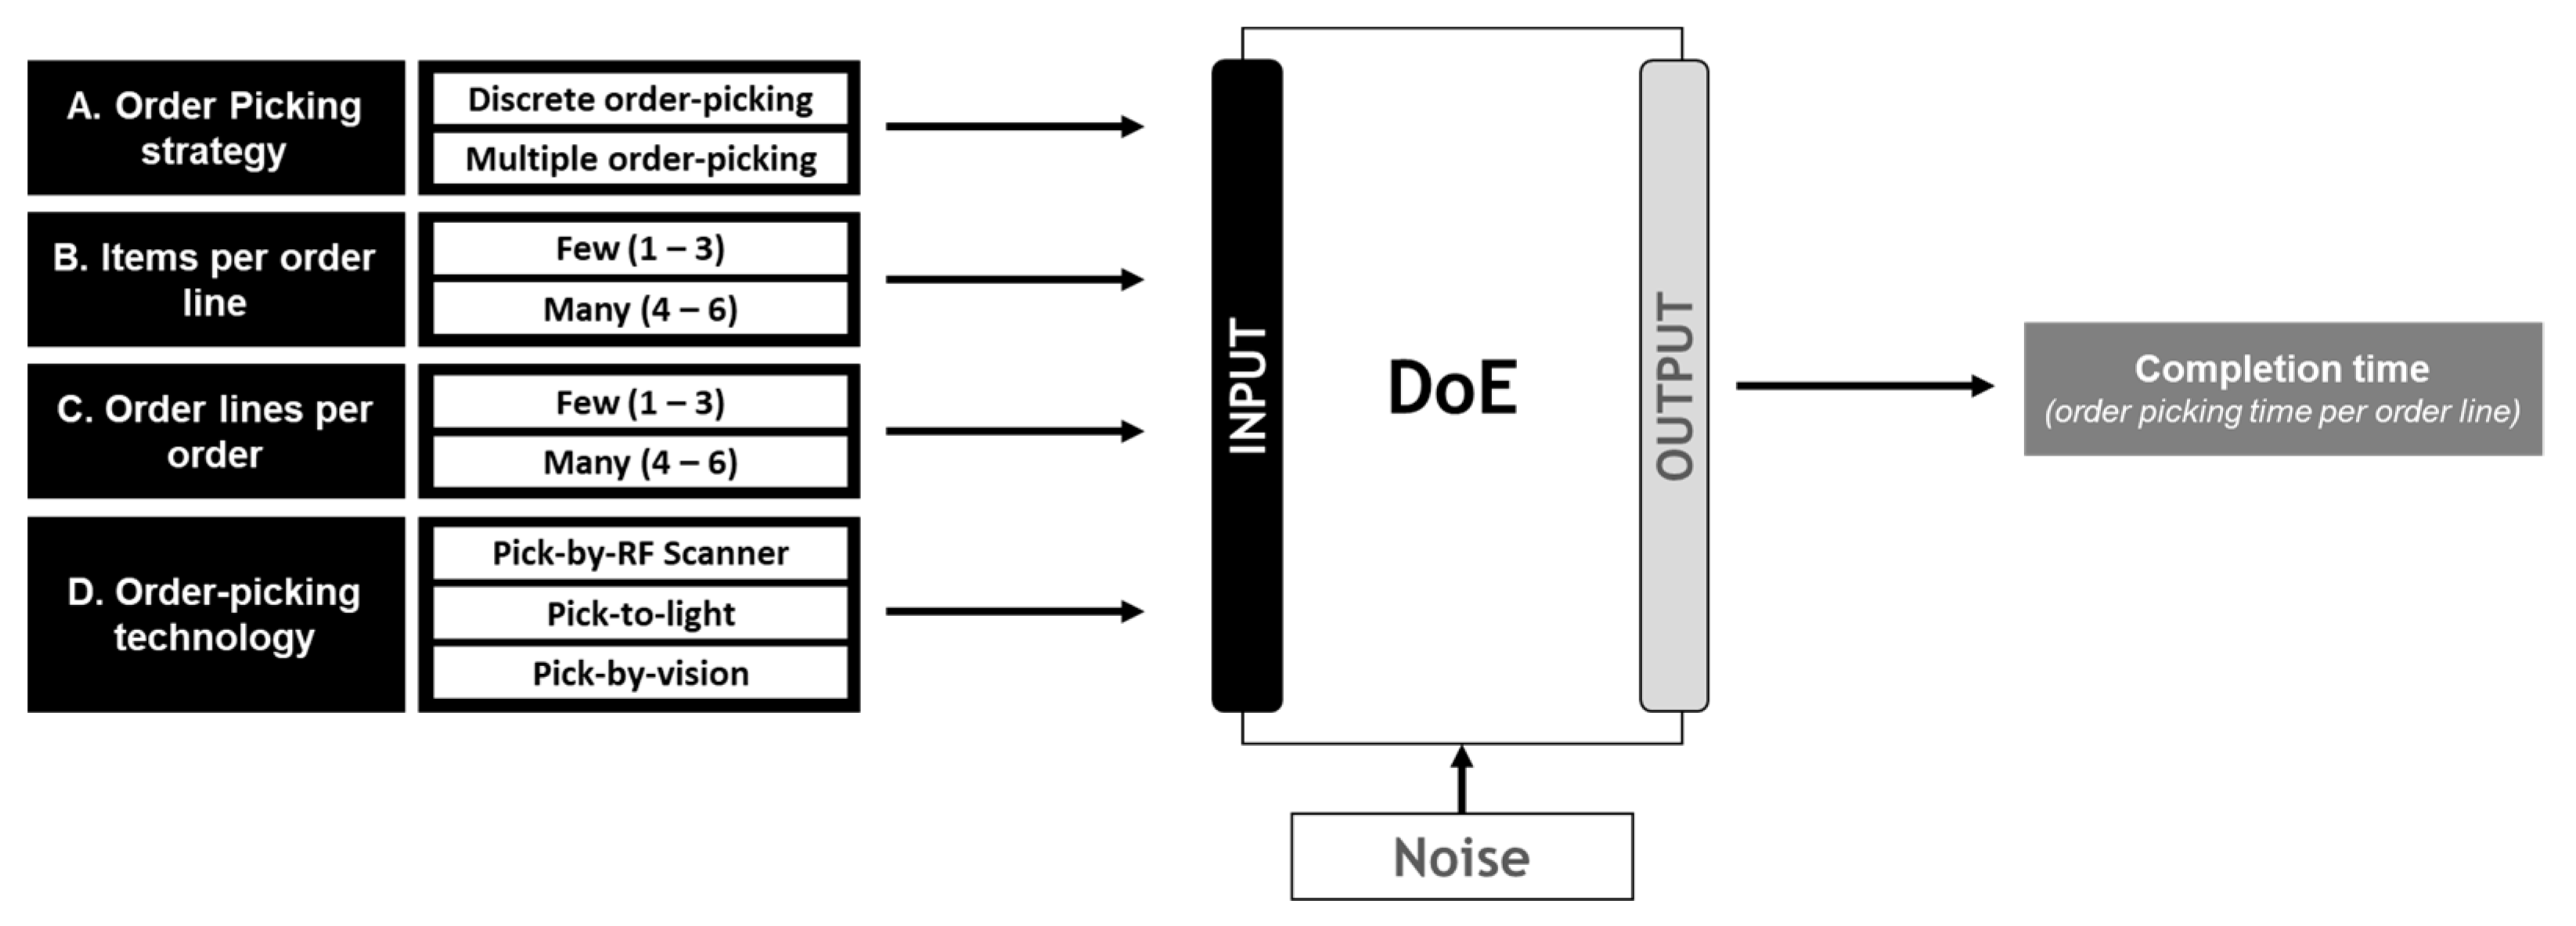
Figure 1 presents the input of the experimental procedure, which contains four factors with their levels, and one output (order-picking time per order line).
For the identification and selection of the investigated factors, similar available studies in the literature were considered. However, the final selection of factors was accomplished by considering multiple limitations of our laboratory environment. To this end, the factors to be considered are (a) order-picking strategy, (b) items per order line, (c) order lines per order, and (d) order-picking technology. Further analysis of the selected factors and their levels is presented below.
The first factor deals with the order-picking strategy. This factor encompasses two levels. The first level focuses on the strategy of discrete order picking, while the second level deals with the strategy of multiple order picking with four orders simultaneously. In the case of level 1, a single order-picker reaches every picking bay to pick all the demanded products for a single customer order [
30]. On the contrary, in the case of multiple order picking, a single order-picker walks through the warehouse to pick up many customers’ orders simultaneously [
5].
The second factor is related to the number of items included in each order line. A plain description of the term “items per order line” is the number of products, of the same stock keeping unit (SKU), that are requested for a certain customer order. For the experimental procedure, the first level (few) includes 1–3 items per order line, while the second level (many) contains 4–6 items per order line.
The third factor is the number of order lines per order. For the experimental procedure, the first level (few) deals with 1–3 order lines per order, while the second level (many) applies to orders with 4–6 order lines. Order lines per order can be described as the diversity of dissimilar products in the same order, and it reflects the workload and the distance needed to be traveled by an order picker from one picking bay to another picking bay.
The fourth factor is the type of order-picking technology. This factor includes three levels: Pick-by-RF Scanner (level 1), Pick-to-light (level 2), and Pick-by-vision (level 3). All necessary information on these technologies is provided in
Section 2.
Considering the available types of experiments [
31], as well as the selected factors, the full factorial design was selected for the design and execution of the experimental procedure. Indeed, a significant number of similar studies have adopted this experimental design type [
32,
33]. In our case, the full factorial design includes four factors, of which three have two levels and one has three levels (2
3 × 3 full factorial design = 24 tests). Additionally, our experimental procedure included five repeated runs (24 tests × 5 replicates). The results of the design of the experimental procedure are depicted in
Table 1.
It is also important to mention that every run was executed randomly as suggested by the DoE methodology. The order of the 120 runs was randomized using Minitab software (Minitab Statistical, Version 21.1.0) to eliminate potential bias.
3.2. Experimental Procedure’s Features and Equipment
The experimental procedure was executed by a total of 8 participants (five males and three females). The age of subjects ranged from 22 to 42 (average age 26.1 years old). A total of 75% of subjects were right-eye dominant, while only 25% were left-eye dominant. Additionally, 25% of the participants were using prescription glasses during the tests. The subjects had no previous experience with the order-picking process; thus, they participated in a training session, where they became familiar with the investigated order-picking technologies.
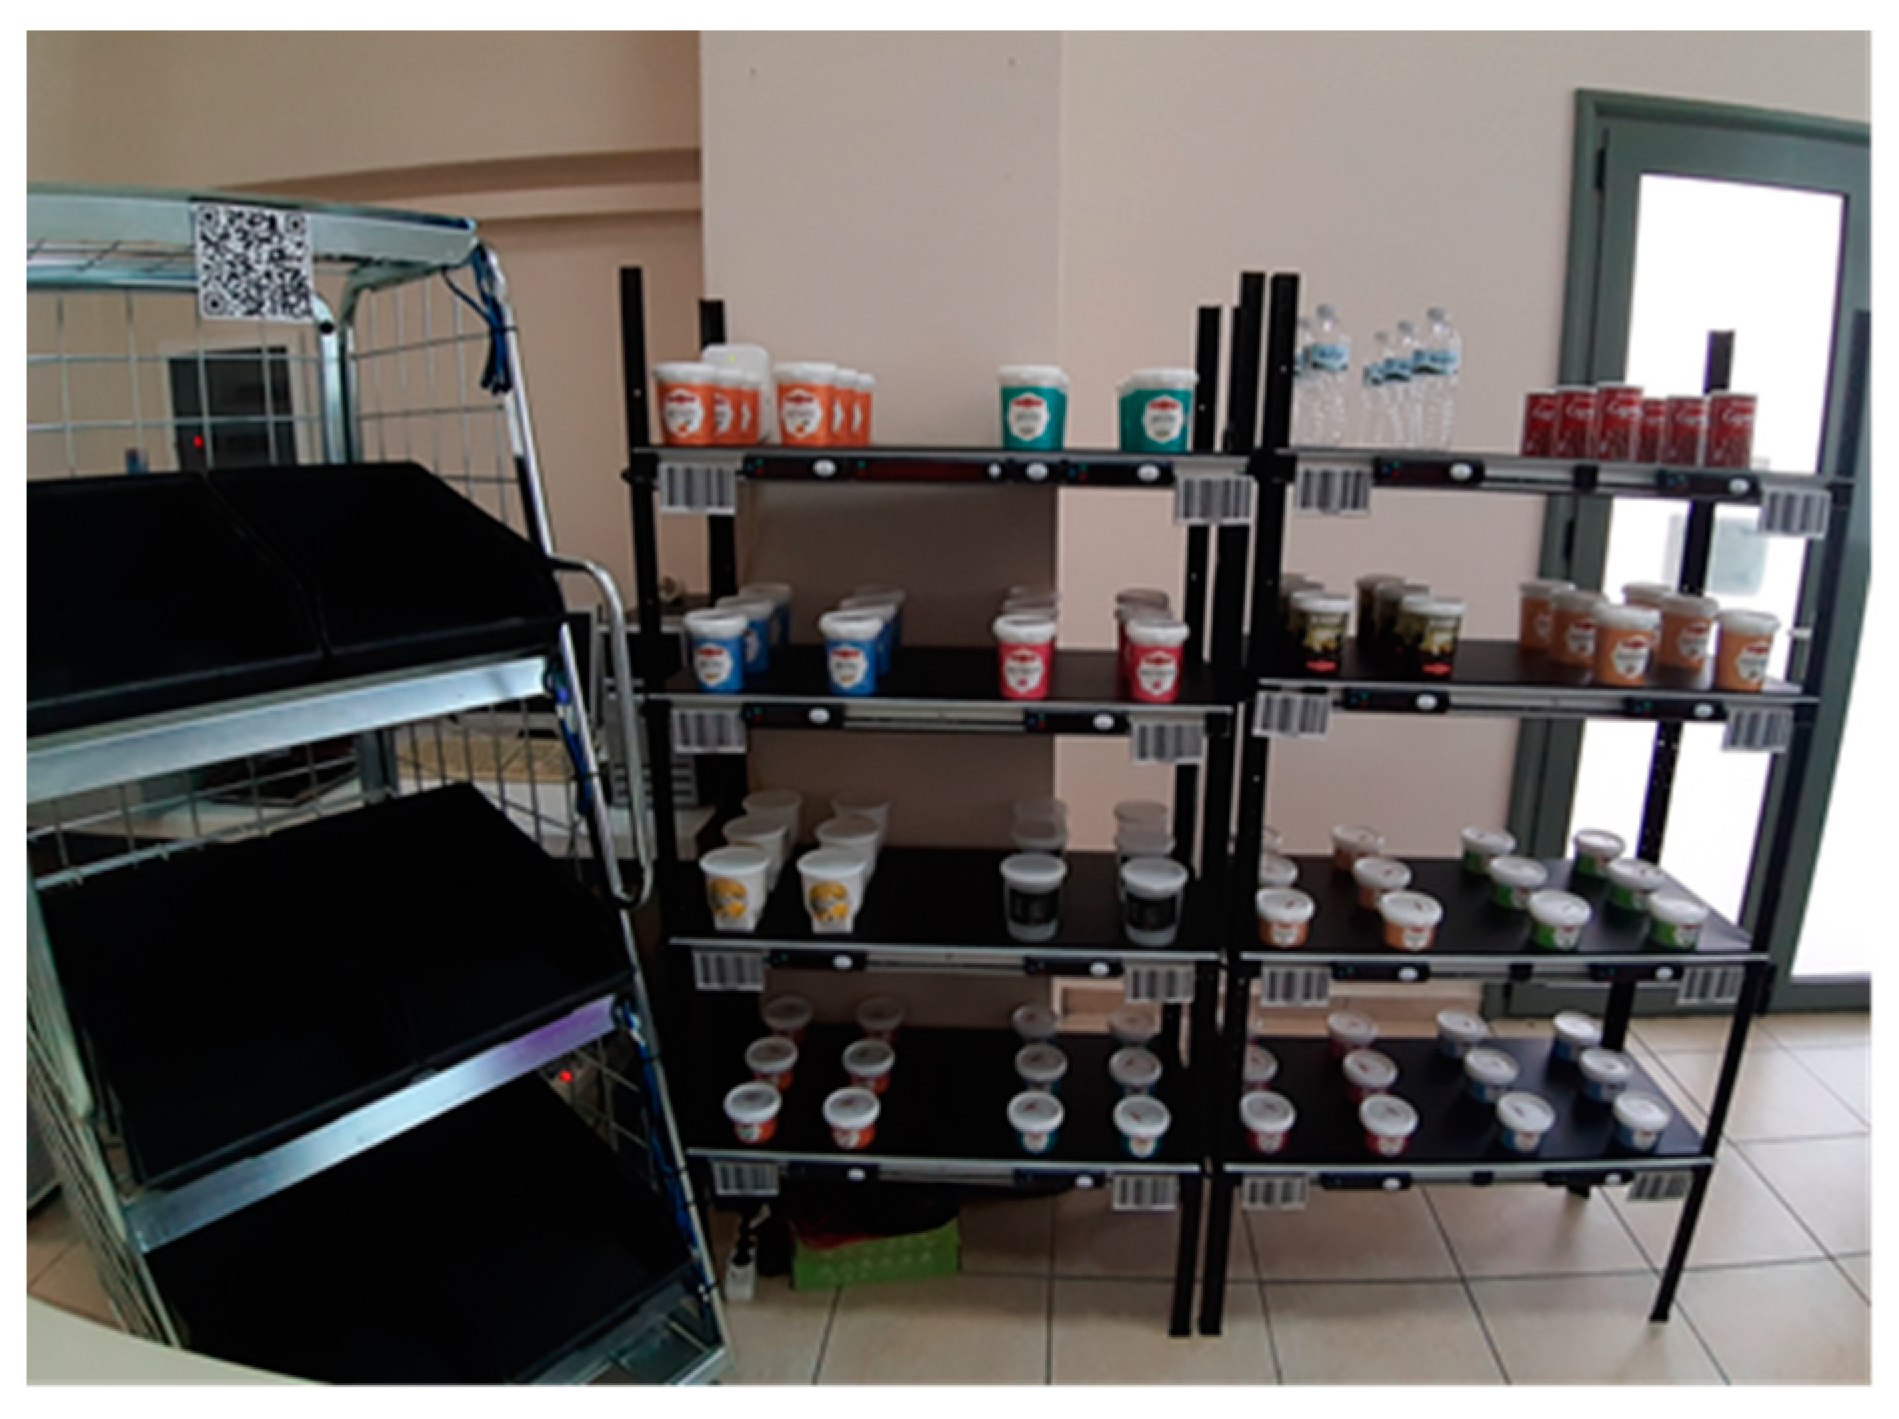
The experimental procedure for the investigation of the pickers-to-goods order-picking technologies was executed in a laboratory environment (
Figure 2). The laboratory environment consisted of two shelving units, and each unit had 8 picking locations; thus, the laboratory had a total of 16 picking locations. The capacity of each picking location was 6–10 items. For the execution of multiple order-picking, the participants used a picking cart with a total capacity of six plastic totes.
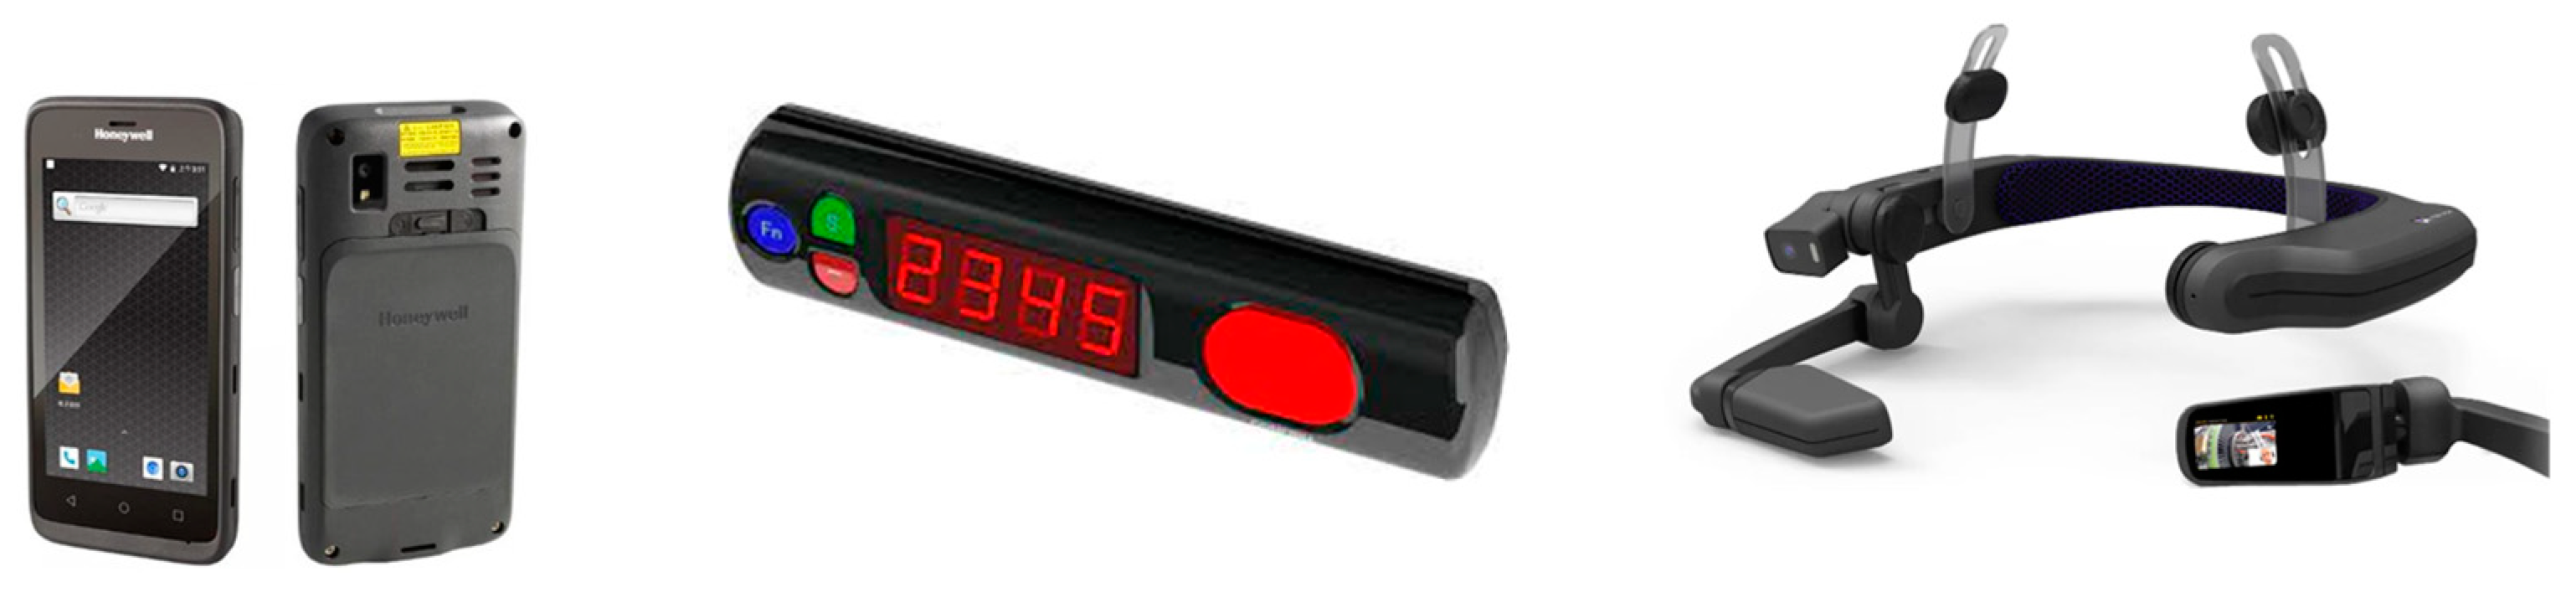
Considering the capacity of the picking cart, each participant could pick up to 6 orders in a single route in case of multiple order picking. Focusing on the equipment of the experimental procedure, for the case of the Pick-by-RF Scanner picking, a handheld computer (
Figure 3) was used. The manufacturer of the equipment for this technology is Honeywell International Inc. (Charlotte, North Carolina, USA). The RF-Scanner is Android-based and features a touchscreen interface with an ergonomic design. It is built for all-day use, as it possesses a 4000 mAh lithium-ion battery that lasts 12 h. For the case of light picking, a typical pick-to-light system (
Figure 3) was used. The manufacturer of the equipment for this technology is AIOI Systems Co., Ltd. (Tokyo, Japan). The design is simple and drip-proof with long-lasting switches. Last, for the case of vision picking, a pair of smart glasses (
Figure 3) was used. The manufacturer of the equipment for this technology is RealWear Inc. (Vancouver, BC, Canada). The device features a chipset of 2.0 GHz Qualcomm Snapdragon 626 with an Adreno 506 GPU. It provides a display of 854 × 480 resolution and HD video analysis. The 32 GB of internal storage and the 3GB of RAM are more than enough for real-life typical use. The headband embeds a 16MP camera (Barcotec, Salzburg, Germany) with 4-axis optical image stabilization and four digital microphones with active noise cancelation up to 95 dB. Additionally, its weight is 380 gr with a battery length of 9–10 h of standard use. For the execution of the experiments, all the aforementioned systems and devices were connected to the warehouse management system (WMS) of our laboratory.
The three investigated pickers-to-goods order-picking technologies were tested separately with the use of the respective equipment. Each subject executed a group of eight picking lists separated into four multiple-order pickings and four discrete-order pickings. Each order could contain from 1 to 6 order lines, while each order line could have from 1 to 6 items.
3.3. Formulation of Research Hypothesis
The completion time of the three investigated pickers-to-goods order-picking technologies was evaluated by considering the order-picking efficiency. For the measurement of order picking time during the execution of tests, a stopwatch was used for recording the time in minutes per order line. To appraise if the selected factors were statistically significant, a series of null hypotheses were used. The null hypotheses are presented below:
The first null hypothesis (H
0,1) assumes that the completion time for the execution of the order-picking process is the same for the case of “discrete order-picking” strategy and the case of “multiple order-picking” strategy:
The second null hypothesis (H
0,2) assumes that the completion time for the execution of the order-picking process is the same for the case of “few_items per order line” 1–3 items per order line and the case of “many_items per order line” 4–6 items per order line:
The third null hypothesis (H
0,3) assumes that the completion time for the execution of the order-picking process is the same for the case of “few_lines per order” 1–3 order lines per order and the case of “many_lines per order” 4–6 order lines per order:
The fourth null hypothesis (H
0,4) assumes that the completion time for the execution of the order-picking process is the same for the case of “Pick-by-RF-Scanner” order-picking technology and the case of “Pick-to-light” order-picking technology:
The fifth null hypothesis (H
0,5) assumes that the completion time for the execution of the order-picking process is the same for the case of “Pick-by-RF-Scanner” order-picking technology and the case of “Pick-by-vision” order-picking technology:
The sixth null hypothesis (H
0,6) assumes that the completion time for the execution of the order-picking process is the same for the case of “Pick-to-light” order-picking technology and the case of “Pick-by-vision” order-picking technology:
4. Results
4.1. Time-to-Completion Evaluation
Upon completion of laboratory tests, a quantitative analysis was undertaken to evaluate the order-picking time per order line (completion time) of our experiments. The results of the analysis of variance (ANOVA) are presented in
Table 2.
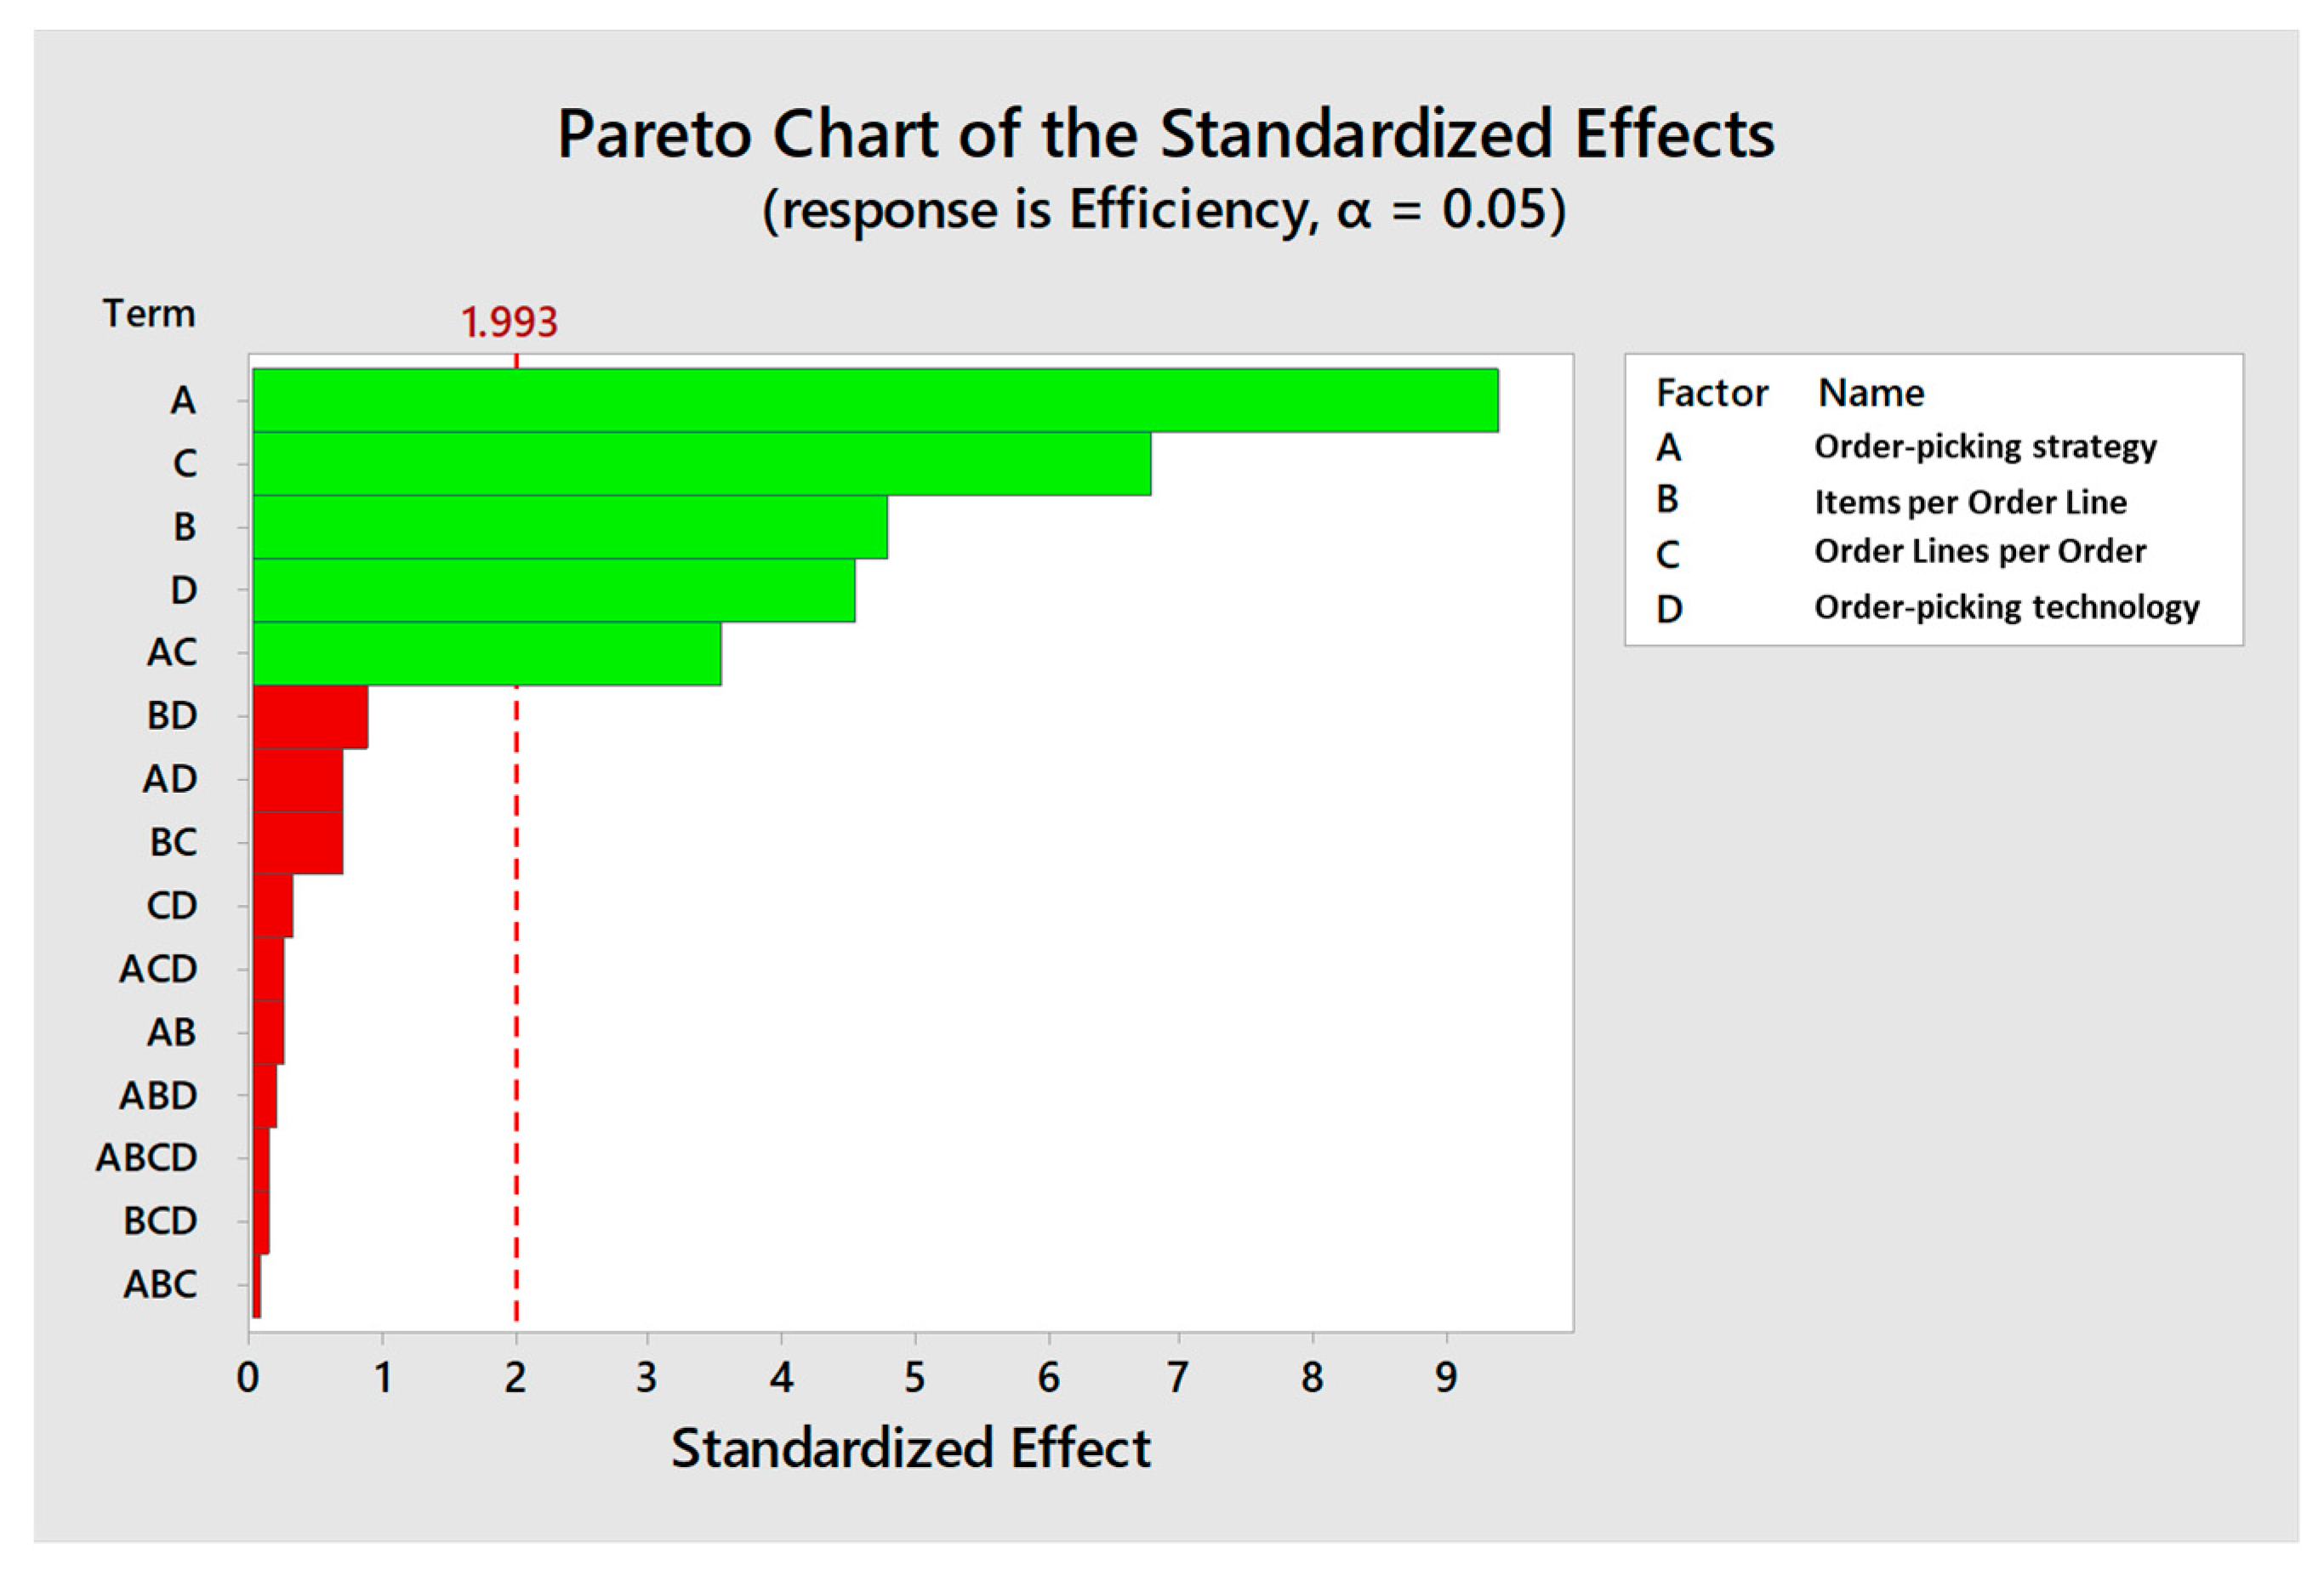
Figure 4 presents the Pareto chart which confirms the validity of the analysis of variance (ANOVA), as it brings up the statistically significant factors. Considering the results obtained during the laboratory tests, there are some cases of factors that significantly affect the completion order-picking time of the investigated process. Analyzing the figure, bars in green indicate that factors or correlations between specific factors are statistically significant, while bars in red indicate that factors or correlations between specific factors are not statistically significant. The results show that all the cases of the null hypothesis were rejected. Therefore, all the investigated factors are statistically significant and the only interaction that significantly affects the completion time of the investigated process is the “Order-picking strategy*Order Lines per Order”.
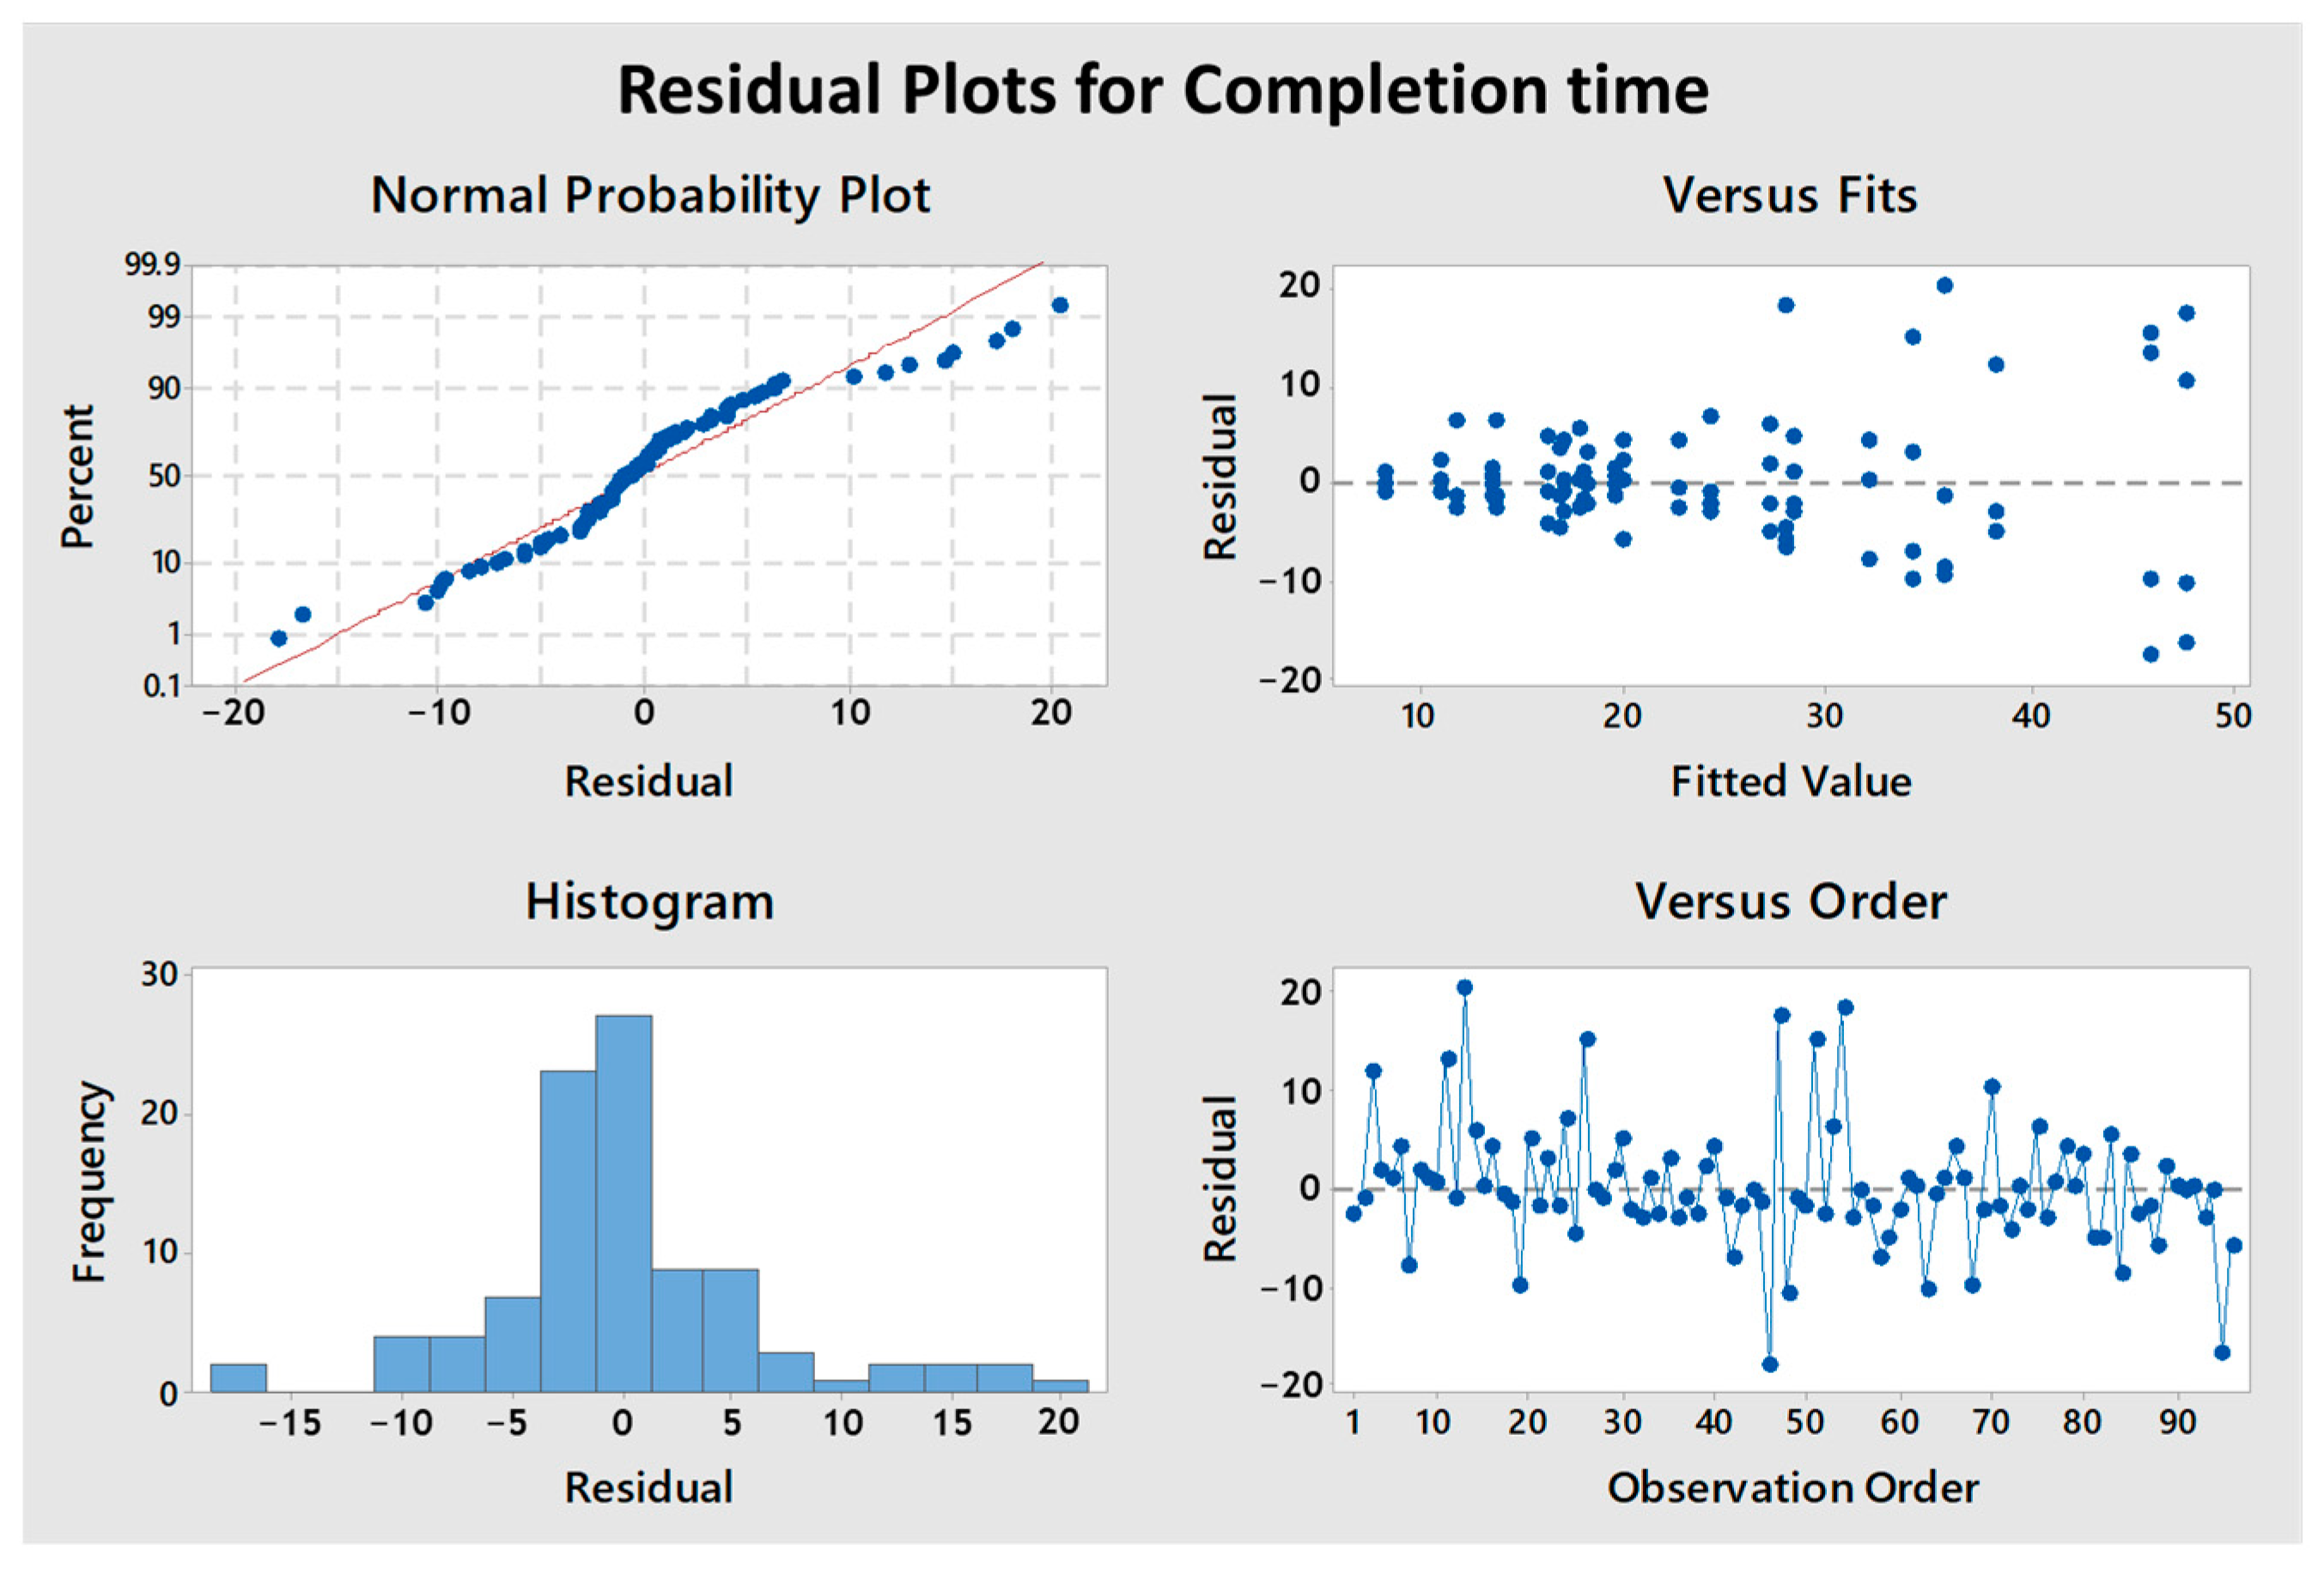
Figure 5 illustrates the residual plots. Based on the results, the normal probability plot and the histogram indicate a reasonable straight line and a normal symmetric shape (bell shape), respectively, which means that the distribution is close to normal and does not show significant deviations. Furthermore, according to the versus fits plot, it is clear that the residues are randomly distributed around line zero, which indicates homogeneity of error variation. Based on the versus order plot, the residuals do not show a specific pattern, which means that the experiments were performed in a randomized manner. To this end, it turns out that the data is reliable.
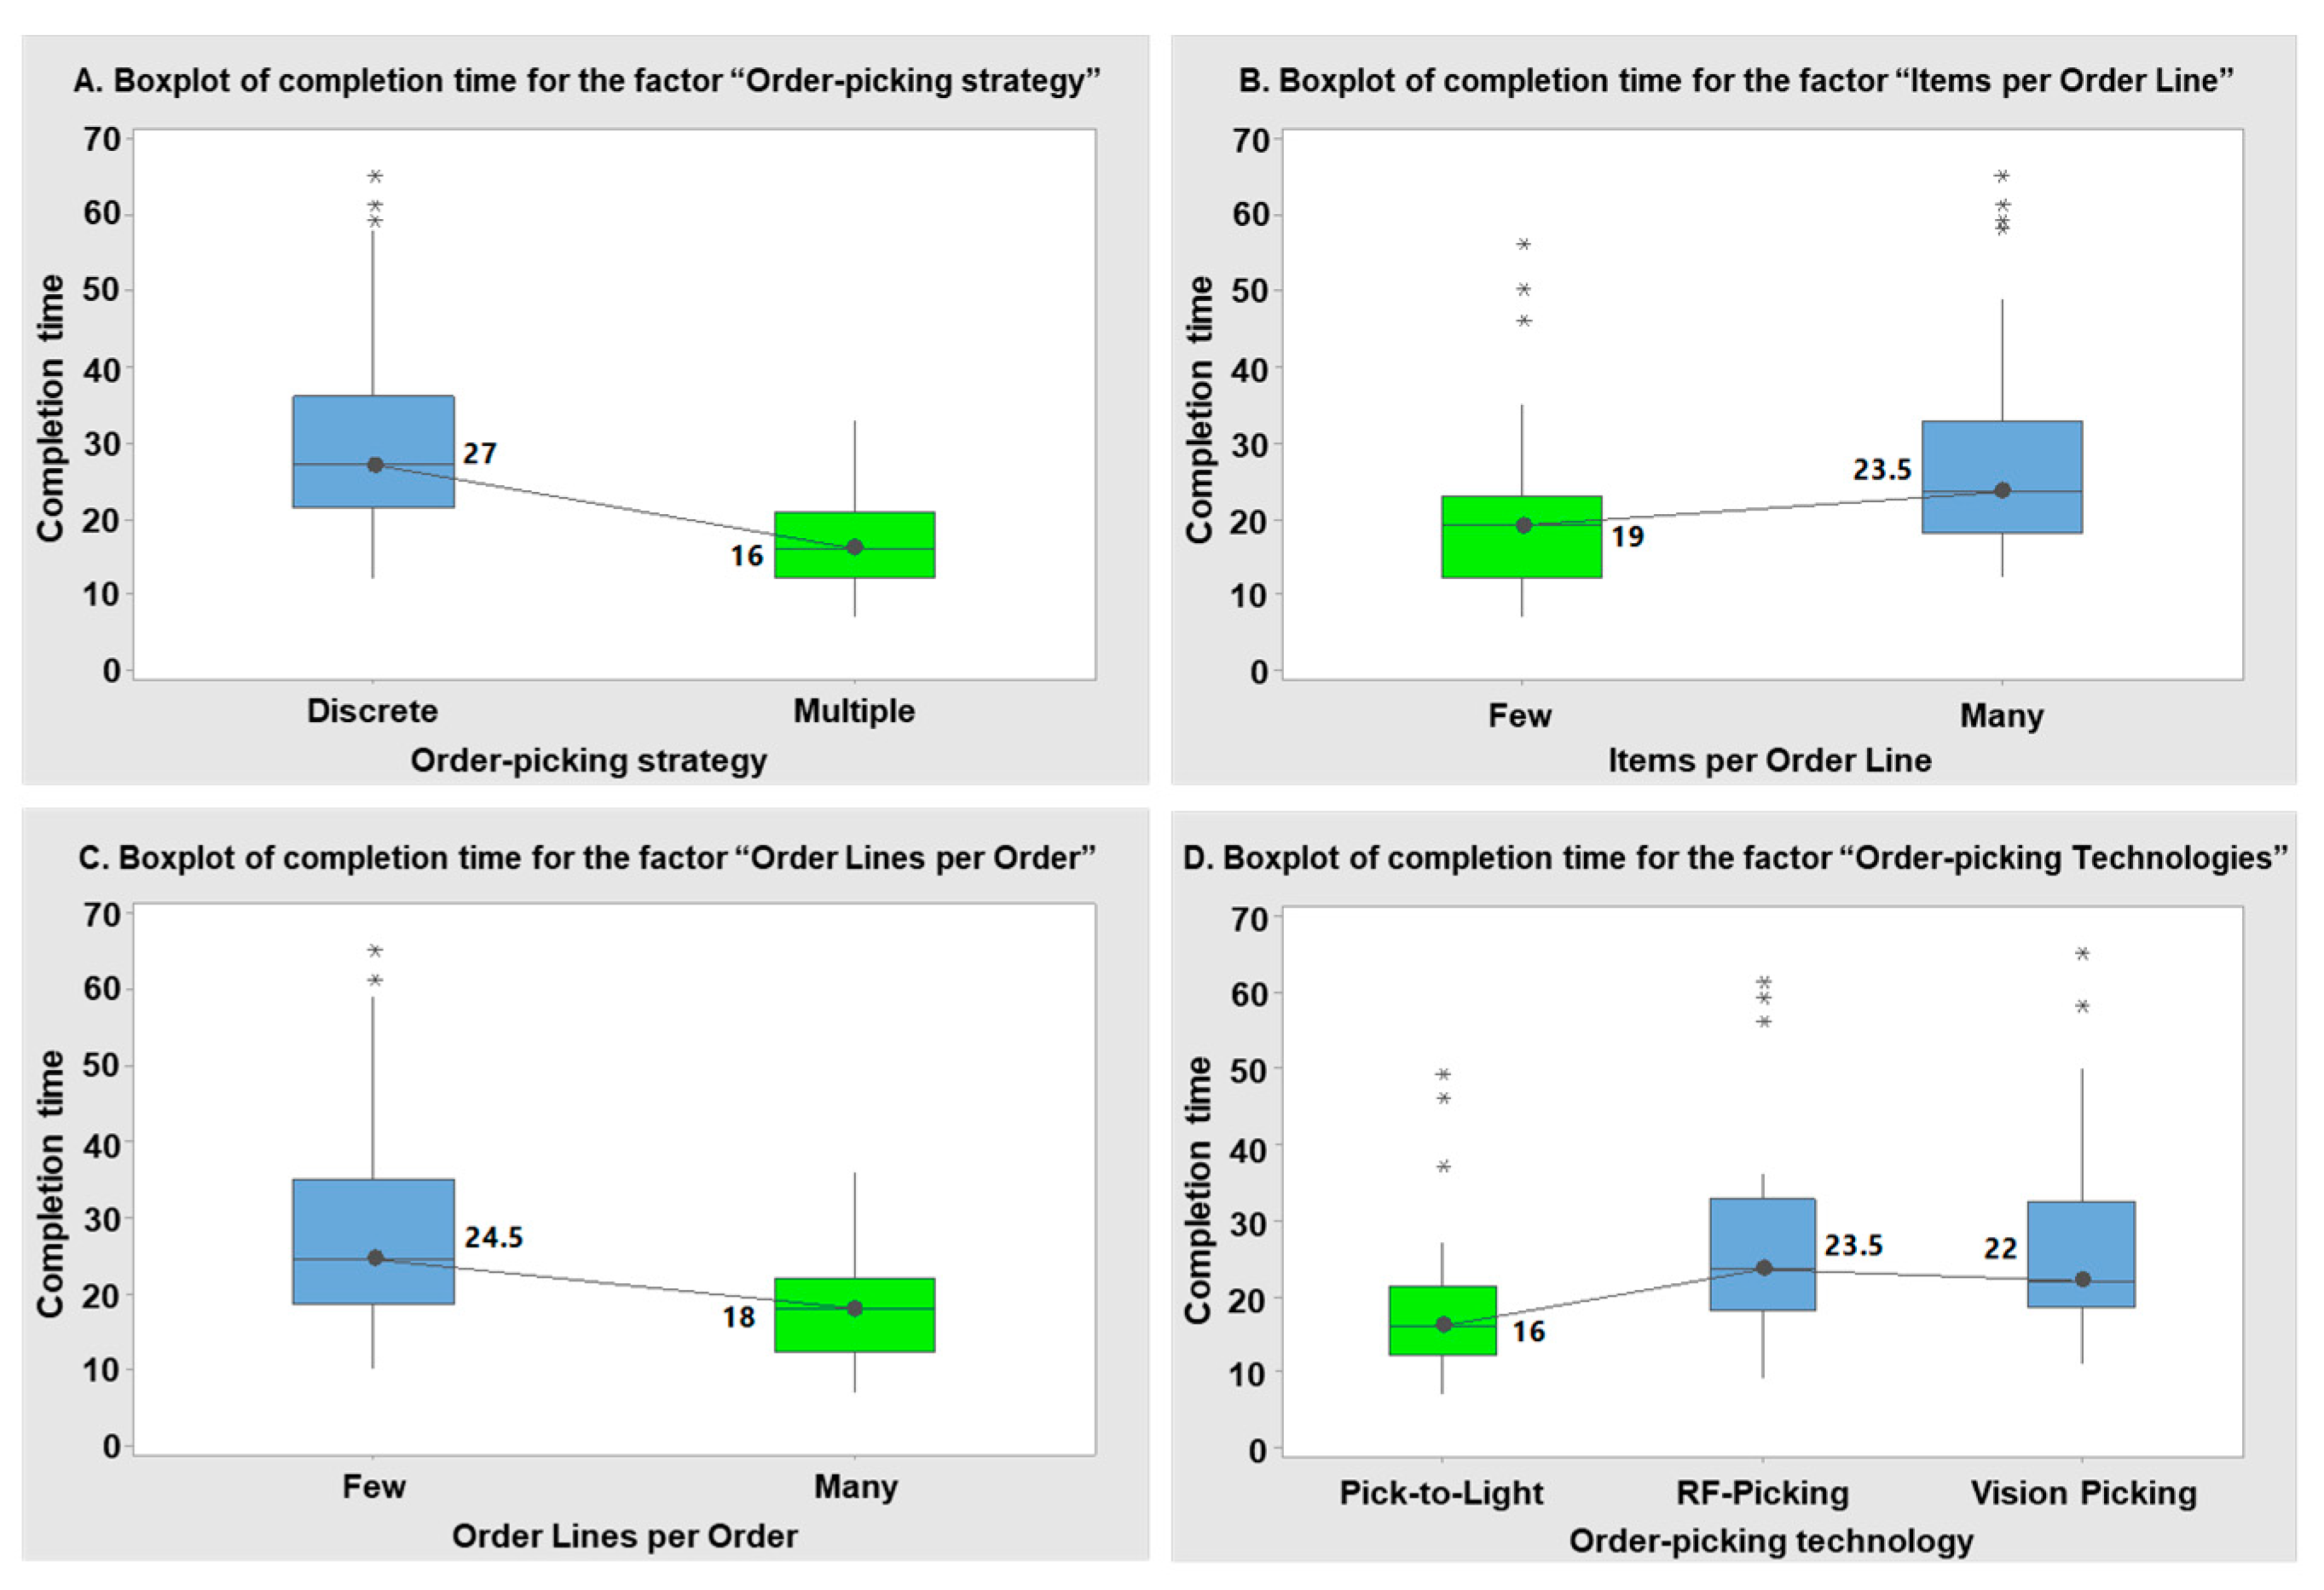
Focusing on the statistically significant factors, we tried to observe the levels of factors that lead to the lowest completion order-picking time per order line. More specifically, based on
Figure 6A, it seems that adopting the multiple order-picking strategy takes less time (11 s per order line) than using the discrete order-picking strategy.
Additionally, when the number of items per order line are 1–3 (few), the order-picking time is shorter (4.5 s per order line) compared to the case where the number of items per order line are 4–6 (many) (
Figure 6B). Moreover, when order lines per order are many, it seems that the order-picking time is shorter (6.5 s per order line) compared to the case where order lines per order are few (
Figure 6C), while in the case of order-picking technology, the Pick-to-light technology seems to provide the shortest order-picking time (7.5 s per order line when compared with Pick-by-RF-Scanner and 6 s per order lines when compared with Pick-by-vison) when compared with the rest of the investigated order-picking technologies (
Figure 6D).
Finally, it is worth mentioning that based on the results (
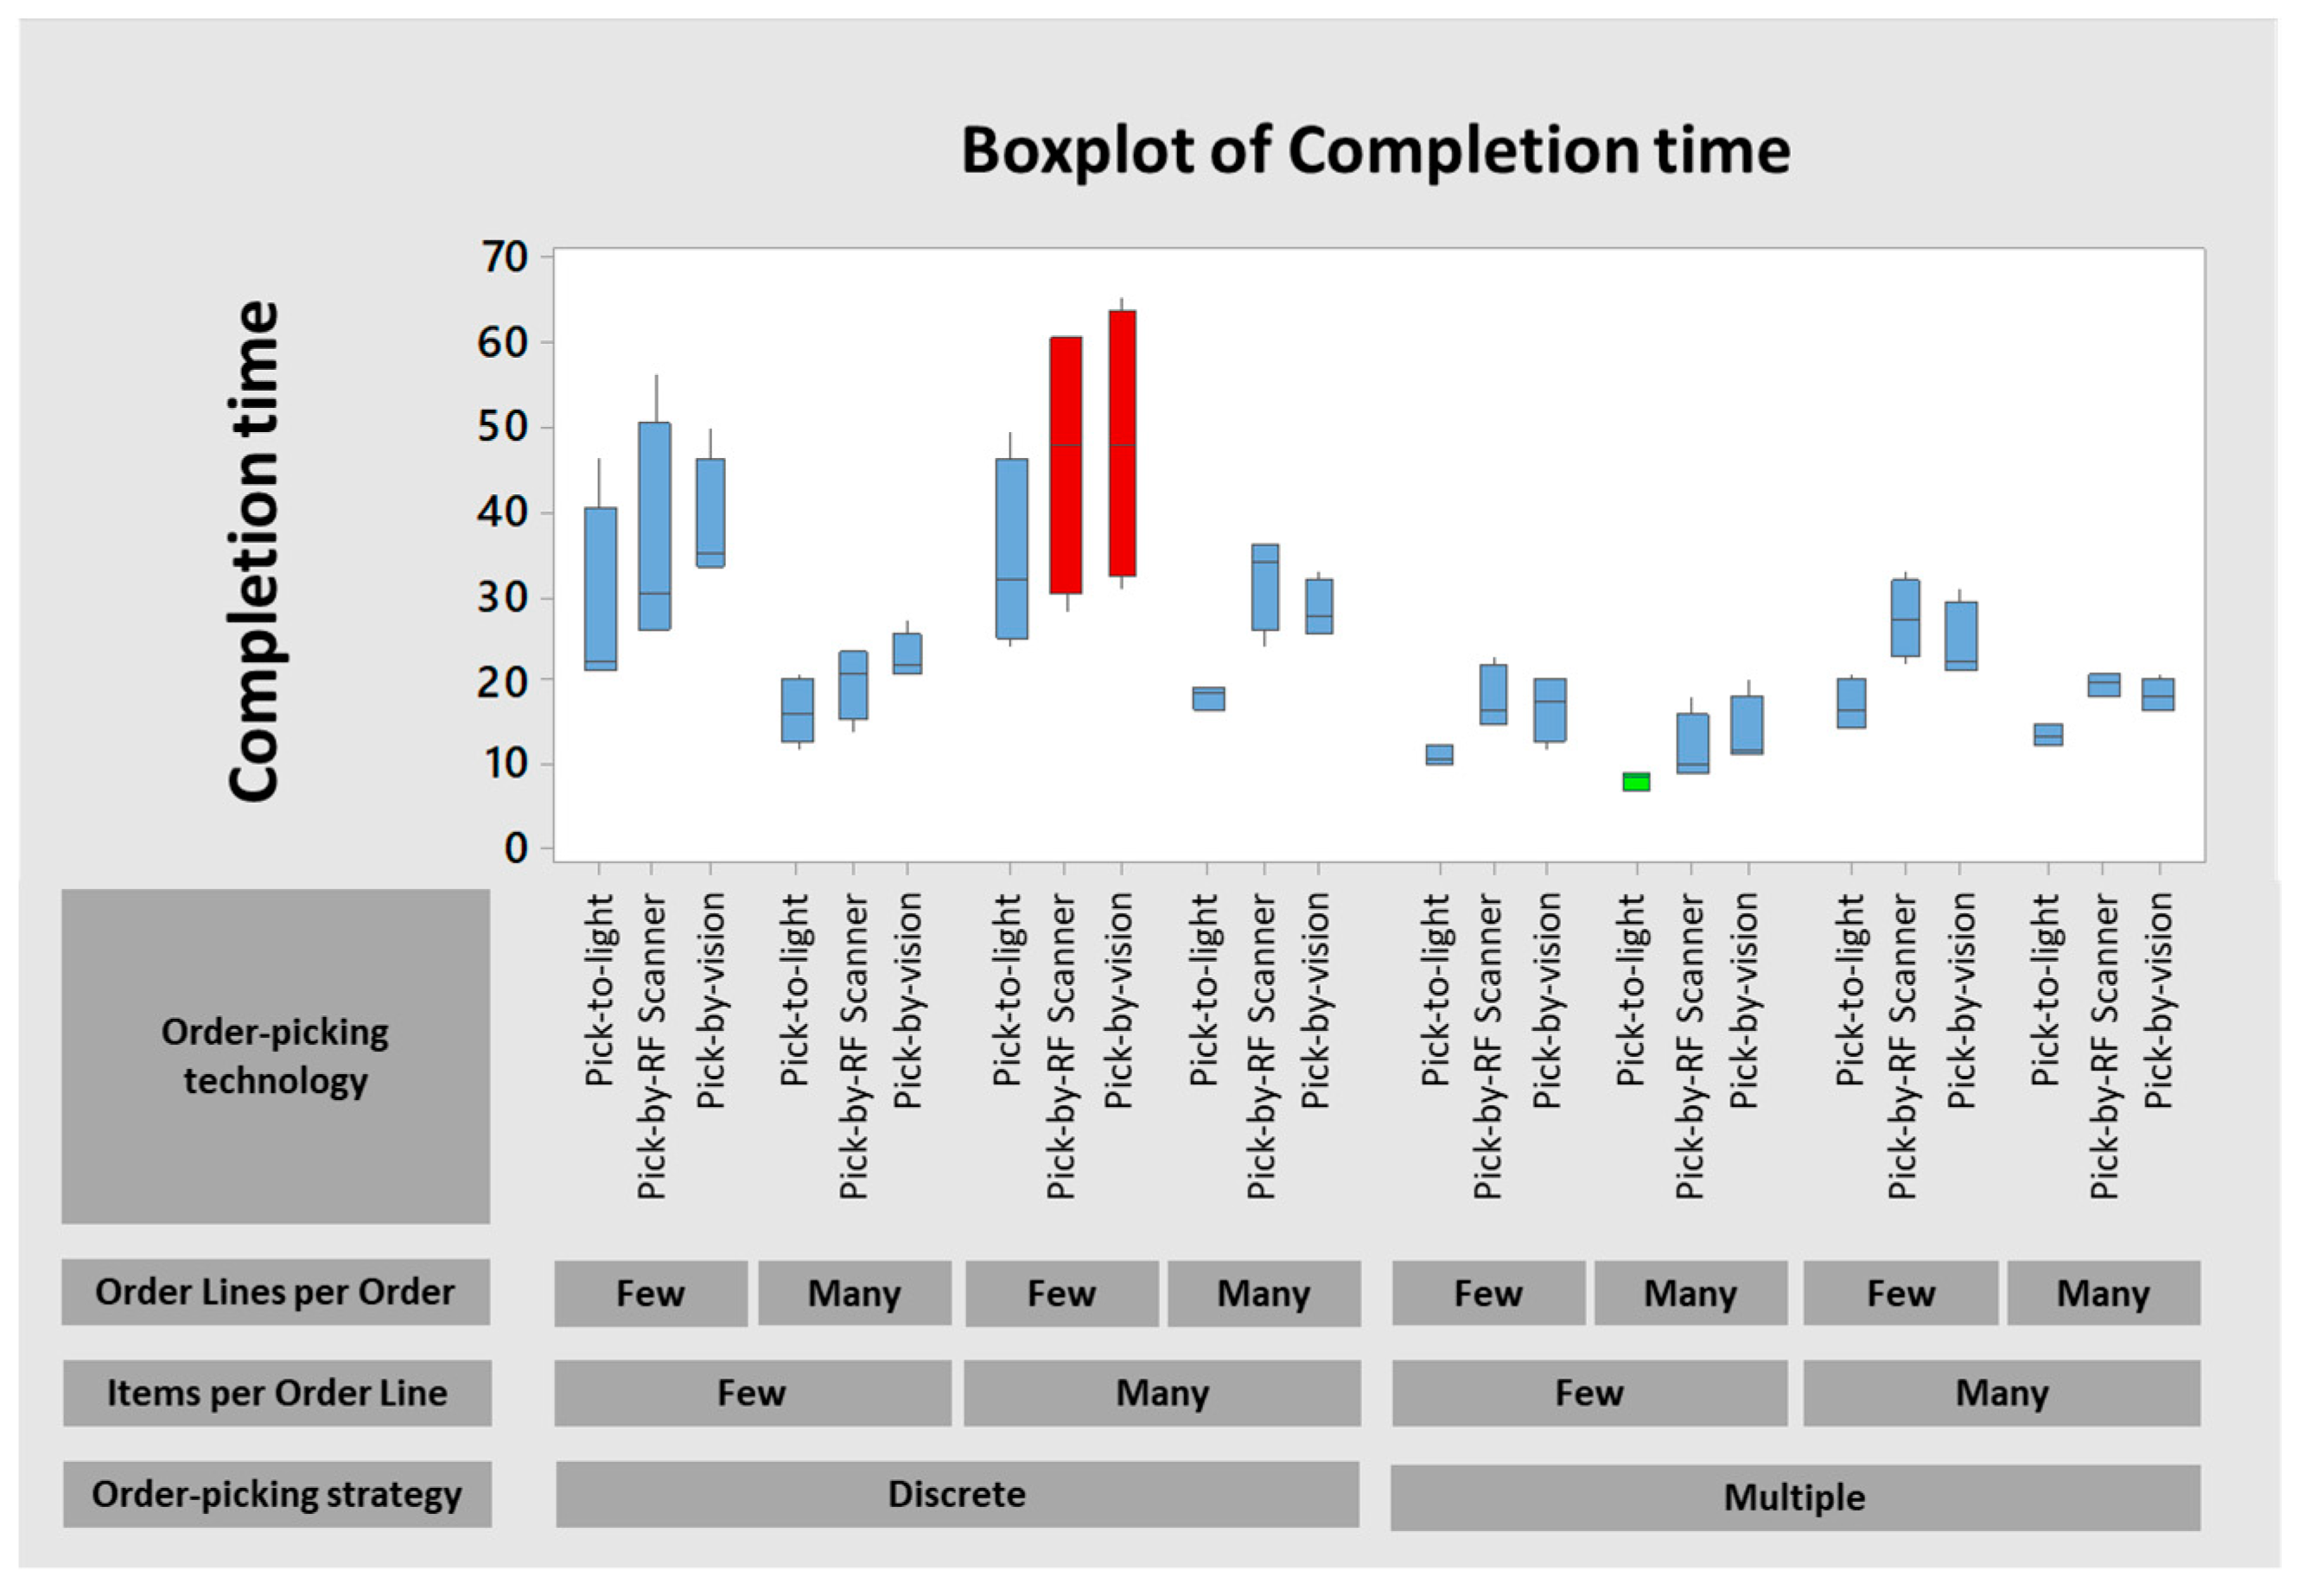
Figure 7), it can be observed that the most efficient configuration (green box) includes the following levels per factor: multiple order picking—few items per order line—many order lines per order—Pick-to-light technology (Q1 = 7.25, Median = 8.5, Q3 = 9).
On the other hand, two configurations tied as the worst configurations (red boxes), which are discrete order picking—many items per order line—few order lines per order—Pick-by-RF-Scanner technology (Q1 = 30, Median = 47.5, Q3 = 60.5) and discrete order picking—many items per order line—few order lines per order—Pick-by-vision technology (Q1 = 32.5, Median = 47.5, Q3 = 63.25). For all the other configurations (blue boxes) which are illustrated in
Figure 7, the completion time is between the best (green boxes) and worst (red boxes) combinations.
4.2. Perceived Workload Evaluation
In this study, the subjective mental workload evaluation was accomplished by using the NASA Task Load Index (NASA-TLX) methodology. Perceived workload defines the psychological and physical pressure that a worker experiences while conducting a task or a process. The NASA TLX methodology adopts a subjective multidimensional assessment tool that assesses perceived workload to evaluate a task, system, or process. This popular technique relies on a multidimensional construct to derive an overall workload score based on a weighted average of ratings on six subscales: mental demand, physical demand, temporal demand, effort, frustration, and performance [
34]. By studying the available literature [
16,
20,
21,
35,
36,
37], it follows that this methodology is the most appropriate to assess the perceived workload with great success. Considering the implementation steps of this methodology, the adoption of NASA TLX requires the source of load and the magnitude of loads [
38]. For the implementation of this technique in our case, after the conduction of an order-picking task, each subject filled out the NASA TLX questionnaire.
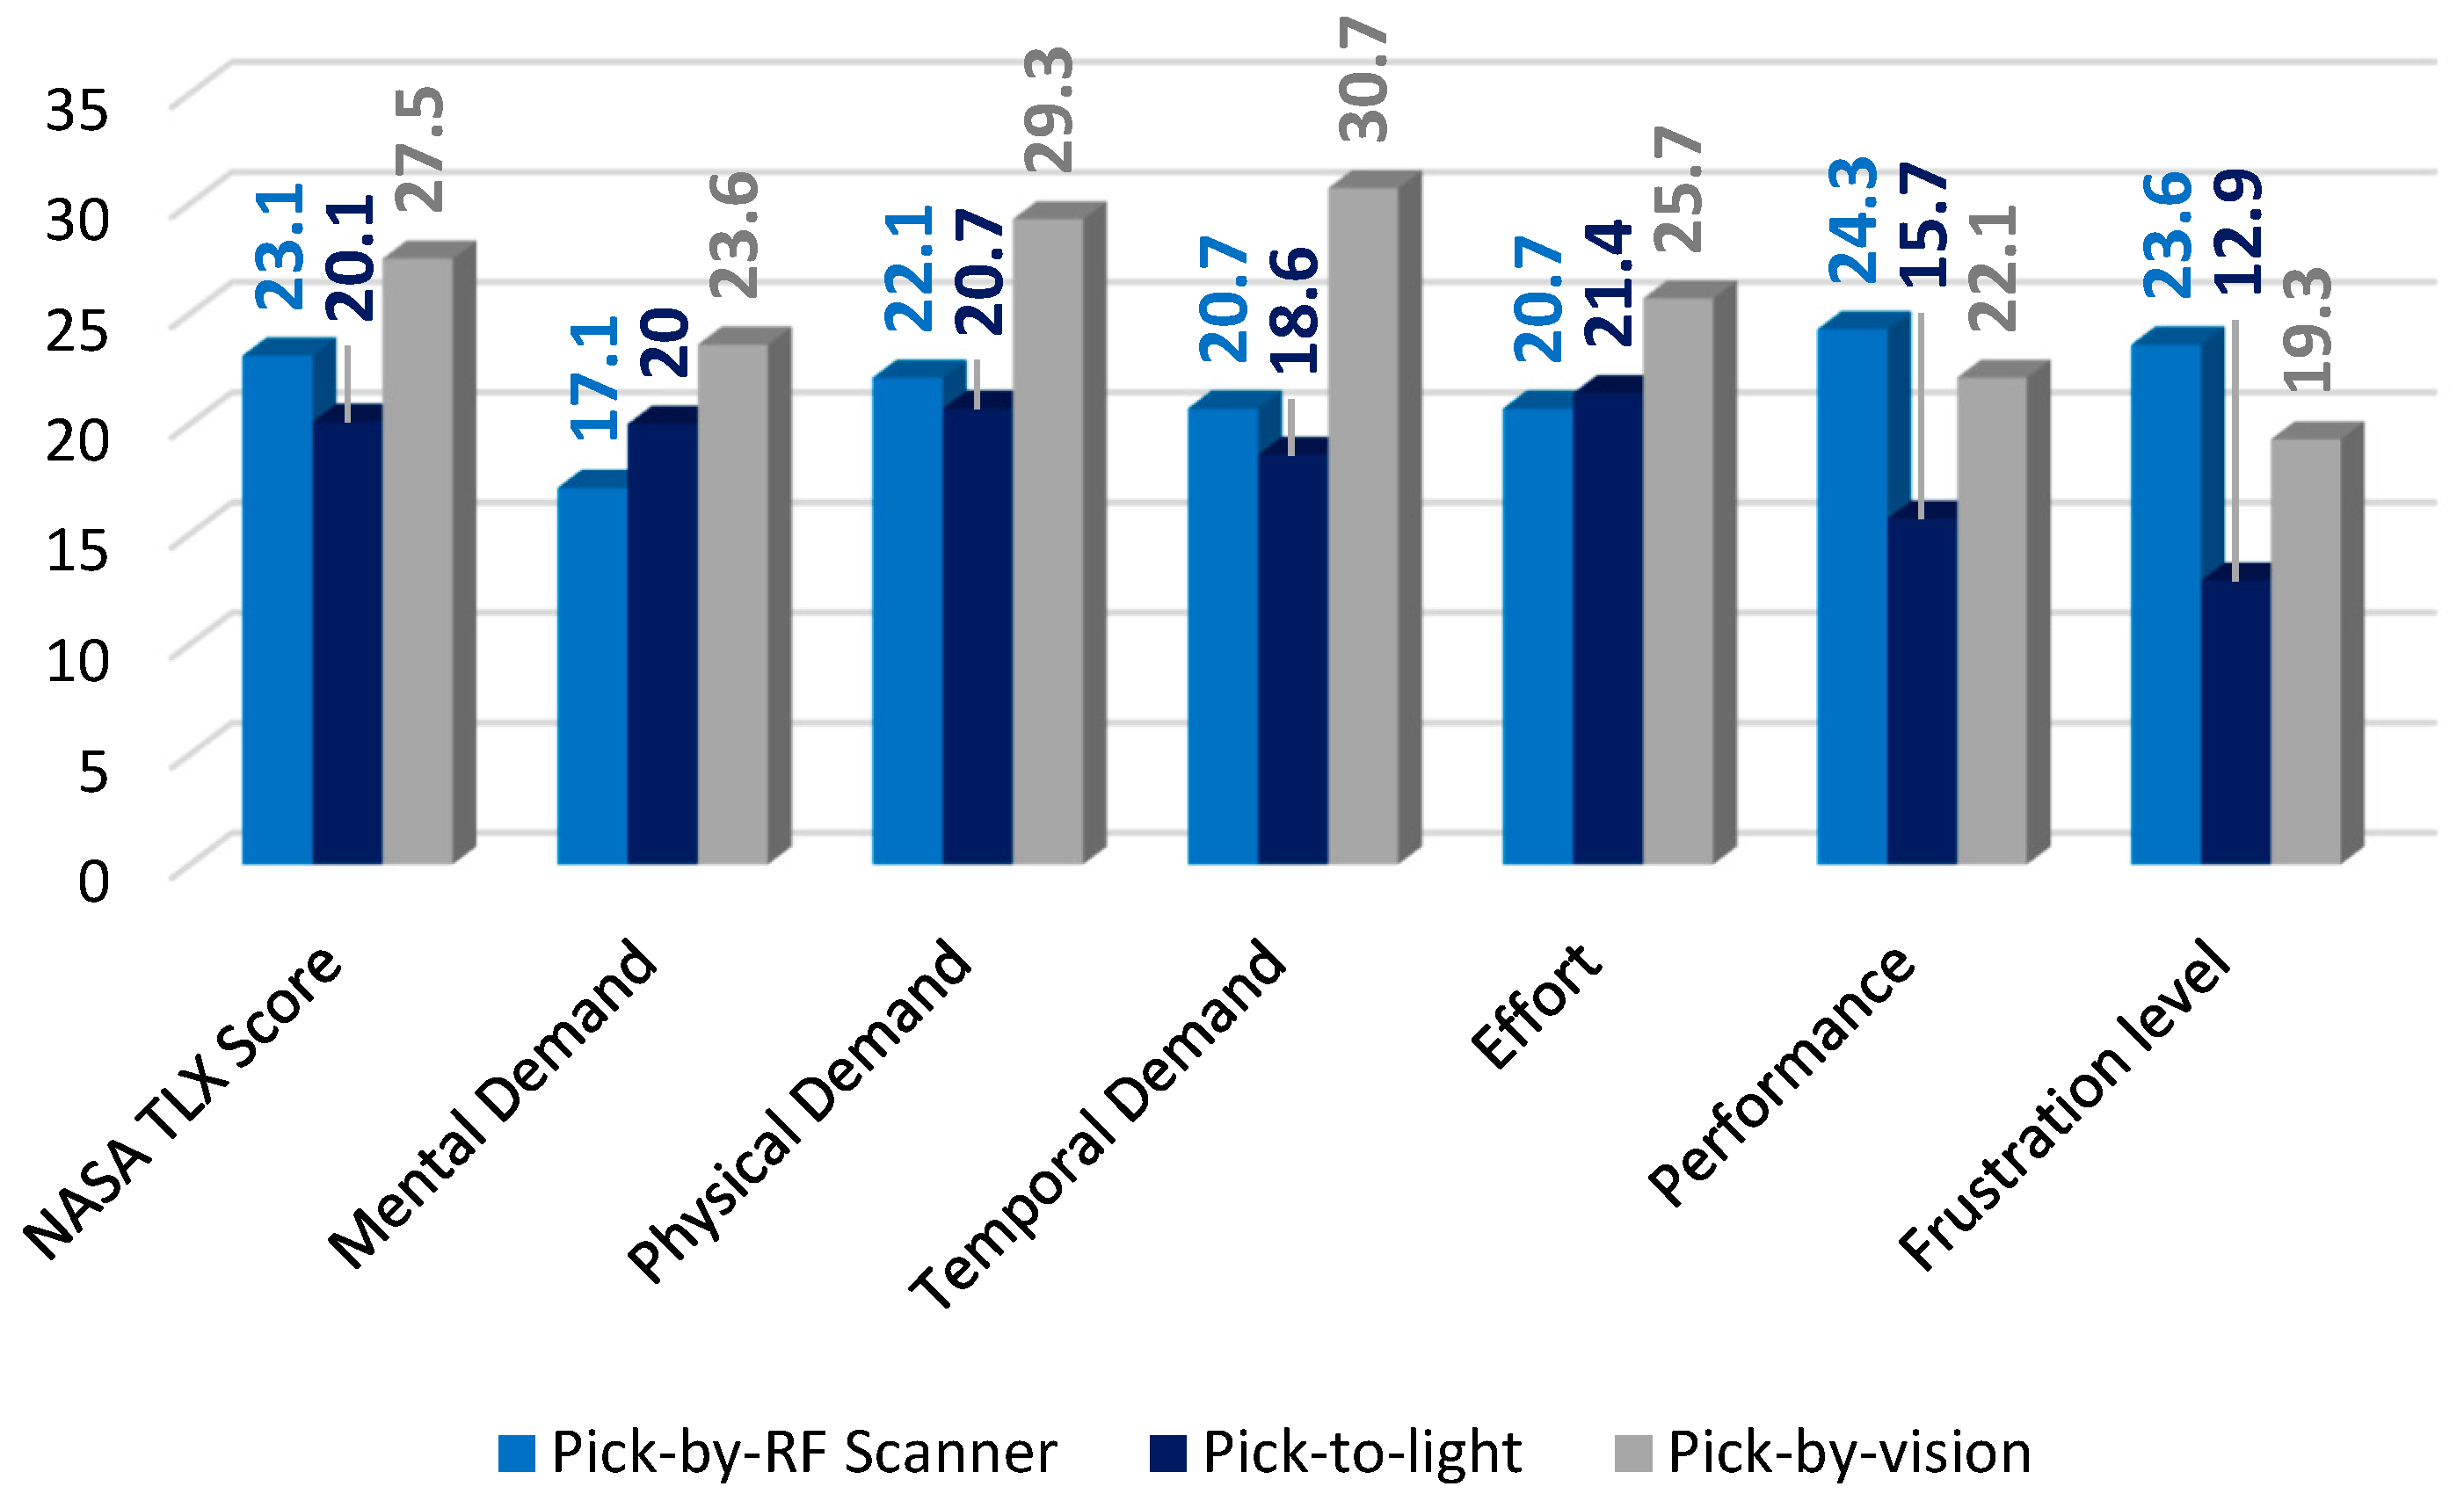
The results of the NASA TLX survey for the three investigated pickers-to-goods order-picking technologies are presented in
Figure 8. Based on the results, it seems that the Pick-to-light technology has the best (the smallest score) performance (M = 20.1) in terms of NASA TLΧ score. The second place was occupied by the Pick-by-RF Scanner technology (M = 23.1), while the last place was occupied by the Pick-by-vision technology (M = 27.5).
More specifically, it seems that the Pick-by-RF Scanner has a low level of workload, but the fact that the subscales do not present notable differences shows that there is no specific advantage or disadvantage; rather, the whole system is considered harmonically good. However, the performance subscale and the frustration level were the highest scoring dimensions, as most pickers admitted that using only one hand to conduct the order-picking process irritated them and made them slower.
Pick-to-light presents a slightly higher overall score when compared with the Pick-by-RF Scanner but different workload distribution between subscales. Frustration level and performance are the lowest-scoring subscales, due to the completely different picking approach that exists between Pick-to-light and the other two order-picking technologies. In this technology, order-pickers (subjects) valued the hands-free capability, which made their tasks much easier.
For the case of Pick-by-vision, the overall score is considered high compared to the other two order-picking technologies, while the subscales do not present notable differences between each other. Nevertheless, temporal and physical demand is the highest-scoring subscales, indicating that intensity was the biggest problem among the others. On the other hand, frustration level was the lowest scoring subscale, proving that order-pickers (subjects) were not irritated and the procedure went on smoothly.
Briefly, considering the analysis of the perceived workload for all the investigated order-picking technologies, it can be observed that in terms of benchmarking, the Pick-to-light technology requires the lowest perceived workload from the order-pickers, as opposed to Pick-by-vision technology which requires the highest perceived workload. Furthermore, it is worth mentioning that the differences in terms of the NASA TLX Score are small, and the overall scores proved that the workload is mild in every case. However, we should not overlook the fact that this study is about an experimental laboratory test. In real-life warehouses, the workload values are expected to be increased, due to bigger distances, complicated orders, and human resource capacity. Nonetheless, these NASA-TLX values are a good approach to reality.
4.3. Findings
The results have shown that in all cases, the null hypothesis was rejected. Therefore, all the investigated factors are statistically significant, as shown in
Table 3.
Furthermore,
Table 4 presents an evaluation of all 24 tests that have been conducted based on time-to-completion results obtained. As it is shown in
Table 4, the picking set-up that delivers the best results is when the type of order is via pick-to-light technology, using a multi-order picking strategy, with few items per order line and many order lines per order. On the other hand, the testing scenarios that included discrete picking with RF-scanning or vision picking technology with many items per order line and few order lines per order ranked in the last position with the highest time-to-completion time.
5. Conclusions
This article aimed to evaluate multiple factors that affect the operational performance of manual order-picking systems. In firsthand, an analysis of the operational factors that affect picking efficiency was conducted. Subsequently, a series of laboratory tests were performed to evaluate the order-picking completion time of the three-alternative order-picking technologies. Then, the NASA TLX tool was used to assess the perceived workload of the users. Based on the results, the most efficient configuration in terms of order-picking time per order line is pick-to-light technology when the following levels per factor exist: multiple order picking—few items per order line—many order lines per order. Concerning the NASA TLX results, it can be concluded that in terms of benchmarking, the Pick-to-light technology requires the lowest perceived workload from the order-pickers, as opposed to Pick-by-vision technology which requires the highest perceived workload.
It is important to mention that the adoption of such order-picking technologies implies certain managerial implications. Initially, logistics managers need to invest in training programs for employees to ensure they are proficient in using the new technologies. Furthermore, the adoption of new order-picking systems involves upfront costs for purchasing and integrating such systems. In addition, the introduction of alternative order-picking technologies may require adjustments to existing workflows.
On the other hand, some opportunities that lie in the adoption of such systems may be as follows. Using alternative order-picking technologies generates a significant amount of data that can be valuable for decision-making. More importantly, new picking technologies may be integrated with existing systems, such as inventory management and order processing software, to support better stock control. Furthermore, such technologies may significantly increase order-picking productivity and the minimization of errors during picking. Subsequently, such technologies may reduce operational costs and can support an expansion of the number of orders to be picked (i.e., during peak periods) without necessarily the use of an increased number of personnel. In any way, the adoption of such order-picking systems to affect positively the operation of a warehouse should be coupled with business process reengineering, personnel training, and a change of culture at the managerial level.
Last but not least, since the ultimate goal of implementing order-picking systems is economic benefit, is worth mentioning that although light picking provides the best performance, it is the most expensive technology to implement when compared to the other two. This is because this technology must be mounted in each bin. Vision picking ranks second, whereas RF-Scanning ranks third. The technology that is most economically feasible to use varies according to the layout of the warehouse, the type and number of products, and the number of picking phases; thus, a techno-economic analysis should be always performed to select the best technology in each case.


