
The Impact of Service Orientation and Airport Service Quality on Passenger Satisfaction and Image: Evidence from Indonesia


Abstract
:1. Introduction
2. Literature Review
2.1. Service Orientation
2.2. Airport Service Quality
2.3. Passenger Satisfaction
2.4. Airport Image
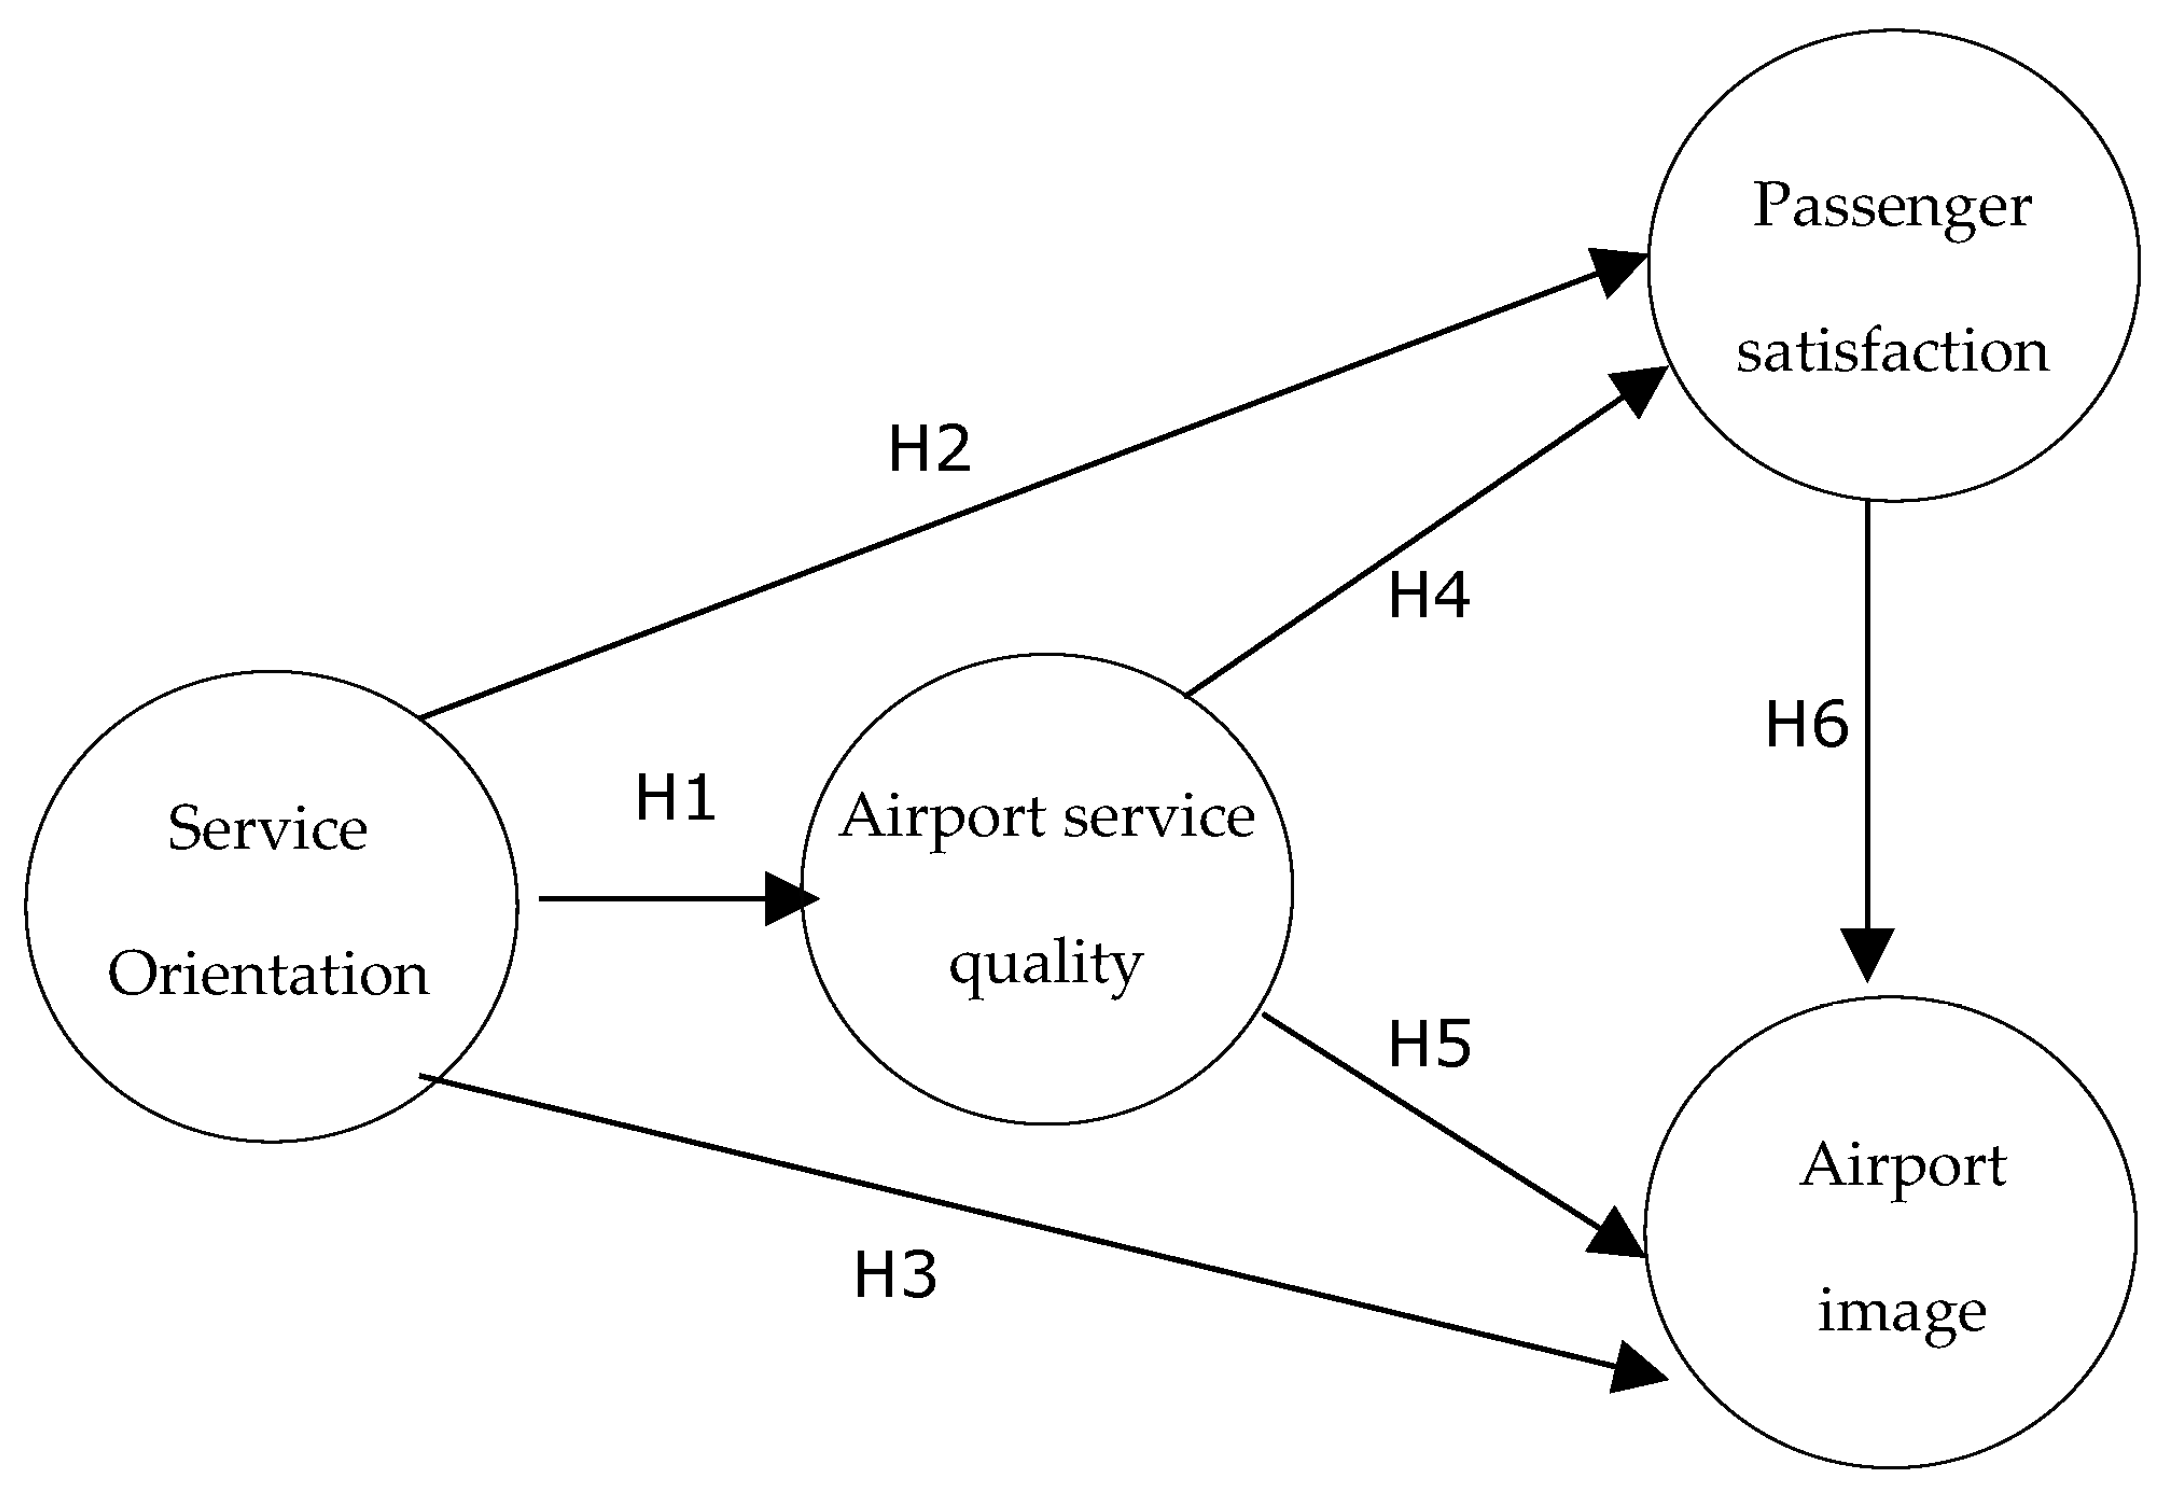
2.5. Model and Hypothesis
2.5.1. The Relationship between Service Orientation and Airport Service Quality
2.5.2. The Relationship between Service Orientation and Passenger Satisfaction
2.5.3. The Relationship between Service Orientation and Airport Image
2.5.4. The Relationship between Airport Service Quality and Passenger Satisfaction
2.5.5. The Relationship between Airport Service Quality and Airport Image
2.5.6. The Relationship between Passenger Satisfaction and Airport Image
3. Methodology
3.1. Partial Least Square Structural Equation Model
3.2. Data Collection
3.3. Measurement
4. Result
4.1. Construct Validity and Reliability Test
4.2. Structure Model (Inner Model)
4.3. Hypothesis Test
5. Discussion and Implications
6. Conclusions
Author Contributions
Funding
Institutional Review Board Statement
Informed Consent Statement
Data Availability Statement
Conflicts of Interest
Appendix A

| Items | Measurement | Sources |
|---|---|---|
| ASQ1 | Public facilities at this airport are adequate | [3,10,83] |
| ASQ2 | The airport terminal area is free from waste | |
| ASQ3 | This airport toilet is clean and dry | |
| ASQ4 | The airport terminal area has adequate lighting | |
| ASQ5 | The airport staff had a friendly and polite attitude in serving me | |
| ASQ6 | The airport staff were knowledgeable enough to answer my questions | |
| ASQ7 | The airport staff are not willing to accept any gifts from me | |
| ASQ8 | I feel comfortable when waiting in the departure area of this airport | |
| ASQ9 | I feel comfortable with the room temperature settings at this airport | |
| ASQ10 | The flight information provided at this airport is clear, accurate, and precise | |
| ASQ11 | The signs at the airport have helped me get to my destination quickly | |
| ASQ12 | This airport provides clear information before and after the flight | |
| ASQ13 | I have plenty of time to do other work at this airport | |
| SEO1 | I feel that my hopes and needs have been met by the airport management | [23,60,84] |
| SEO2 | The officers at this airport were more willing to help than I needed | |
| SEO3 | The officers at the airport quickly helped me without having to ask | |
| SEO4 | This airport management has a high commitment to passenger rights | |
| SEO5 | My ideas and suggestions were responded to quickly by the airport operators | |
| SEO6 | When I experienced problems at this airport, my complaints were quickly responded to and handled | |
| SAT1 | This airport overall provided a very satisfactory service for me | [85] |
| SAT2 | This airport has provided a memorable experience for me | |
| SAT3 | It was a wise decision for me to choose this airport for traveling | [86] |
| SAT4 | It is the right thing for me to travel using this airport | |
| AIM1 | The name of this airport has shown local attributes that are in harmony with historical heritage | [3,5,58] |
| AIM2 | This airport displays local arts and culture, bringing me closer to the local cultural heritage | |
| AIM3 | This airport makes more of an impression than any other airport I have visited | |
| AIM4 | I do not feel afraid of the threat of terrorism because at this airport there has been good prevention | |
| AIM5 | I give a positive review about this airport | |
| AIM6 | This airport has implemented health protocols to protect passengers | |
| AIM7 | This airport has a good reputation | |
| AIM8 | I always find positive reviews about this airport | |
| AIM9 | I have never heard any negative news about this airport in the media |
References
- Fodness, D.; Murray, B. Passengers’ expectations of airport service quality. J. Serv. Mark. 2007, 21, 492–506. [Google Scholar] [CrossRef]
- Harsanto, B.; Permana, C.T. Understanding Sustainability-oriented Innovation (SOI) Using Network Perspective in Asia Pacific and ASEAN: A Systematic Review. J. ASEAN Stud. 2019, 7, 1–17. [Google Scholar] [CrossRef]
- Saut, M.; Song, V. Influences of airport service quality, satisfaction, and image on behavioral intention towards destination visit. Urban Plan. Transp. Res. 2022, 10, 82–109. [Google Scholar] [CrossRef]
- Hang, N.P.T.; Linh, N.H.K.; Nghi, L.D. Examining the Effect of Airportscape on Airport Image, Tourist Revisit Intention, Considering Roles of Sense of Place and Destination Image. J. Logist. Inform. Serv. Sci. 2023, 10, 164–181. [Google Scholar] [CrossRef]
- Mainardes, E.W.; de Melo, R.F.S.; Moreira, N.C. Effects of airport service quality on the corporate image of airports. Res. Transp. Bus. Manag. 2021, 41, 100668. [Google Scholar] [CrossRef]
- Bezerra, G.C.L.; Gomes, C.F. Measuring airport service quality: A multidimensional approach. J. Air Transp. Manag. 2016, 53, 85–93. [Google Scholar] [CrossRef]
- Pantouvakis, A.; Renzi, M.F. Exploring different nationality perceptions of airport service quality. J. Air Transp. Manag. 2016, 52, 90–98. [Google Scholar] [CrossRef]
- Bellizzi, M.G.; Eboli, L.; Mazzulla, G. Air Transport Service Quality Factors: A Systematic Literature Review. Transp. Res. Procedia 2020, 45, 218–225. [Google Scholar] [CrossRef]
- Chao, C.C.; Lin, H.C.; Chen, C.Y. Enhancing Airport Service Quality: A Case Study of Kaohsiung International Airport. J. East. Asia Soc. Transp. Stud. 2013, 10, 2235–2254. [Google Scholar] [CrossRef]
- Bezerra, G.C.L.; Gomes, C.F. Antecedents and consequences of passenger satisfaction with the airport. J. Air Transp. Manag. 2020, 83, 101766. [Google Scholar] [CrossRef]
- Rendeiro Martín-Cejas, R. Tourism service quality begins at the airport. Tour. Manag. 2006, 27, 874–877. [Google Scholar] [CrossRef]
- Olorunniwo, F.; Hsu, M.K.; Udo, G.J. Service quality, customer satisfaction, and behavioral intentions in the service factory. J. Serv. Mark. 2006, 20, 59–72. [Google Scholar] [CrossRef]
- Cole, S.T.; Illum, S.F. Examining the mediating role of festival visitors’ satisfaction in the relationship between service quality and behavioral intentions. J. Vacat. Mark. 2006, 12, 160–173. [Google Scholar] [CrossRef]
- Lee, J.; Graefe, A.R.; Burns, R.C. Service Quality, Satisfaction, and Behavioral Intention Among Forest Visitors. J. Travel Tour. Mark. 2004, 17, 73–82. [Google Scholar] [CrossRef]
- Usman, A.; Azis, Y.; Harsanto, B.; Azis, A.M. Airport service quality dimension and measurement: A systematic literature review and future research agenda. Int. J. Qual. Reliab. Manag. 2022, 39, 2302–2322. [Google Scholar] [CrossRef]
- Gonu, E.; Agyei, P.M.; Richard, O.K.; Asare-Larbi, M. Customer orientation, service quality and customer satisfaction interplay in the banking sector: An emerging market perspective. Cogent Bus. Manag. 2023, 10, 2163797. [Google Scholar] [CrossRef]
- Black, S.; Briggs, S.; Keogh, W. Service quality performance measurement in public/private sectors. Manag. Audit. J. 2001, 16, 400–405. [Google Scholar] [CrossRef]
- George, B.P.; Hegde, P.G. Employee attitude towards customers and customer care challenges in banks. Int. J. Bank Mark. 2004, 22, 390–406. [Google Scholar] [CrossRef]
- Teng, C.C.; Barrows, C.W. Service orientation: Antecedents, outcomes, and implications for hospitality research and practice. Serv. Ind. J. 2009, 29, 1413–1435. [Google Scholar] [CrossRef]
- Homburg, C.; Hoyer, W.D.; Fassnacht, M. Service orientation of a retailer’s business strategy: Dimensions, antecedents, and performance outcomes. J. Mark. 2002, 66, 86–101. [Google Scholar] [CrossRef]
- Robinson, L.; Williamson, K. Organizational Service Orientation: A Short-Form Version of the SERV*OR Scale. Serv. Mark. Q. 2014, 35, 155–172. [Google Scholar] [CrossRef]
- Ivanov, S.; Webster, C. Conceptual Framework of the Use of Robots, Artifiial Intelligence and Service Automation in Travel, Tourism, and Hospitality Companies; Emerald Publishing Limited: Leeds, UK, 2019; ISBN 9781787566873. [Google Scholar]
- Solimun; Fernandes, A.A.R. The mediation effect of customer satisfaction in the relationship between service quality, service orientation, and marketing mix strategy to customer loyalty. J. Manag. Dev. 2018, 37, 76–87. [Google Scholar] [CrossRef]
- Homburg, C.; Müller, M.; Klarmann, M. When Should the Customer Really be King? On the Optimum Level of Salesperson Customer Orientation in Sales Encounters. J. Mark. 2011, 75, 55–74. [Google Scholar] [CrossRef]
- Popli, S.; Rizvi, I.A. Leadership style and service orientation: The catalytic role of employee engagement. J. Serv. Theory Pract. 2017, 27, 292–310. [Google Scholar] [CrossRef]
- Fellesson, M.; Salomonson, N. It takes two to interact—Service orientation, negative emotions and customer phubbing in retail service work. J. Retail. Consum. Serv. 2020, 54, 102050. [Google Scholar] [CrossRef]
- Beitelspacher, L.S.; Richey, R.G.; Reynolds, K.E. Exploring a new perspective on service efficiency: Service culture in retail organizations. J. Serv. Mark. 2011, 25, 215–228. [Google Scholar] [CrossRef]
- Yoon, S.J.; Choi, D.C.; Park, J.W. Service orientation: Its impact on business performance in the medical service industry. Serv. Ind. J. 2007, 27, 371–388. [Google Scholar] [CrossRef]
- Ngo, L.V.; O’Cass, A. Innovation and business success: The mediating role of customer participation. J. Bus. Res. 2013, 66, 1134–1142. [Google Scholar] [CrossRef]
- Anabila, P.; Ameyibor, L.E.K.; Allan, M.M.; Alomenu, C. Service Quality and Customer Loyalty in Ghana’s Hotel Industry: The Mediation Effects of Satisfaction and Delight. J. Qual. Assur. Hosp. Tour. 2022, 23, 748–770. [Google Scholar] [CrossRef]
- Briggs, E.; Deretti, S.; Kato, H.T. Linking organizational service orientation to retailer profitability: Insights from the service-profit chain. J. Bus. Res. 2020, 107, 271–278. [Google Scholar] [CrossRef]
- Liu, C.H.S.; Lee, T. Service quality and price perception of service: Influence on word-of-mouth and revisit intention. J. Air Transp. Manag. 2016, 52, 42–54. [Google Scholar] [CrossRef]
- Parasuraman, A.; Zeithaml, V.A.; Berry, L.L. SERVQUAL: A multiple-item scale for measuring consumer perceptions of service quality. J. Retail. 1988, 64, 12–40. [Google Scholar]
- Gronroos, C. Service Quality: The six criteria of good perceived service. Rev. Bus. 1988, 9, 10–13. [Google Scholar]
- Lehtinen, U.; Lehtinen, J.R. Two approaches to service quality dimensions. Serv. Ind. J. 1991, 11, 287–303. [Google Scholar] [CrossRef]
- De Oña, J.; De Oña, R. Quality of service in public transport based on customer satisfaction surveys: A review and assessment of methodological approaches. Transp. Sci. 2015, 49, 605–622. [Google Scholar] [CrossRef]
- Lubbe, B.; Douglas, A.; Zambellis, J. An application of the airport service quality model in South Africa. J. Air Transp. Manag. 2011, 17, 224–227. [Google Scholar] [CrossRef]
- Yeh, C.-H.; Kuo, Y.-L. Evaluating passenger services of Asia-Pacific international airports. Transp. Res. Part E Logist. Transp. Rev. 2003, 39, 35–48. [Google Scholar] [CrossRef]
- Seetanah, B.; Nunkoo, R. Destination Satisfaction and Revisit Intention of Tourists: Does the Quality of Airport Services Matter? J. Hosp. Tour. Res. 2020, 44, 134–148. [Google Scholar] [CrossRef]
- Bezerra, G.C.L.; Gomes, C.F. The effects of service quality dimensions and passenger characteristics on passenger’s overall satisfaction with an airport. J. Air Transp. Manag. 2015, 44–45, 77–81. [Google Scholar] [CrossRef]
- Park, K.; Park, J.W. The effects of the servicescape of airport transfer amenities on the behavioral intentions of transfer passengers: A case study on Incheon International Airport. J. Air Transp. Manag. 2018, 72, 68–76. [Google Scholar] [CrossRef]
- Jones, M.A.; Suh, J. Transaction-specific satisfaction and overall satisfaction: An empirical analysis. J. Serv. Mark. 2000, 14, 147–159. [Google Scholar] [CrossRef]
- Oliver, R.L. A Cognitive Model of the Antecedents and Consequences of Satisfaction Decisions. J. Mark. Res. 1980, 17, 460–469. [Google Scholar] [CrossRef]
- Cronin, J.J.; Taylor, S.A. Measuring Service Quality: A Reexamination and Extension. J. Mark. 1992, 56, 55. [Google Scholar] [CrossRef]
- Bogicevic, V.; Yang, W.; Cobanoglu, C.; Bilgihan, A.; Bujisic, M. Traveler anxiety and enjoyment: The effect of airport environment on traveler’s emotions. J. Air Transp. Manag. 2016, 57, 122–129. [Google Scholar] [CrossRef]
- Park, J.W.; Jung, S.Y. Transfer Passengers’ Perceptions of Airport Service Quality: A Case Study of Incheon International Airport. Int. Bus. Res. 2011, 4, 75–82. [Google Scholar] [CrossRef]
- Nesset, E.; Helgesen, Ø. Effects of switching costs on customer attitude loyalty to an airport in a multi-airport region. Transp. Res. Part A Policy Pract. 2014, 67, 240–253. [Google Scholar] [CrossRef]
- Chen, J.K.C.; Batchuluun, A.; Batnasan, J. Services innovation impact to customer satisfaction and customer value enhancement in airport. Technol. Soc. 2015, 43, 219–230. [Google Scholar] [CrossRef]
- Moon, H.; Yoon, H.J.; Han, H. Role of Airport Physical Environments in the Satisfaction Generation Process: Mediating the Impact of Traveller Emotion. Asia Pac. J. Tour. Res. 2016, 21, 193–211. [Google Scholar] [CrossRef]
- Baker, D.A.; Crompton, J.L. Quality, satisfaction and behavioral intentions. Ann. Tour. Res. 2000, 27, 785–804. [Google Scholar] [CrossRef]
- Baloglu, S.; Pekcan, A.; Santos, J. The Relationship Between Destination Performance, Overall Satisfaction, and Behavioral Intention for Distinct Segments. J. Qual. Assur. Hosp. Tour. 2004, 4, 149–165. [Google Scholar] [CrossRef]
- Shandy, V.M.; Mulyana, A.; Harsanto, B. Social media richness, brand equity, and business performance: An empirical analysis of food and beverage SMEs. Cogent Bus. Manag. 2023, 10, 2244211. [Google Scholar] [CrossRef]
- Gartner, W.C. Journal of Travel & Image Formation Process. J. Travel Tour. Mark. 1994, 2, 191–216. [Google Scholar]
- Gray, E.R.; Balmer, J.M.T. Managing Corporate Image and Corporate Reputation. Long Range Plan. 1998, 31, 695–702. [Google Scholar] [CrossRef]
- Azoury, N.; Daou, L.; Khoury, C. EL University image and its relationship to student satisfaction—Case of the Middle Eastern private business schools. Int. Strateg. Manag. Rev. 2014, 2, 1–8. [Google Scholar] [CrossRef]
- Madleňáková, L.; Turská, S.; Madleňák, R. The image of the postal company as a key attribute of the customer’s purchasing behaviour. Transp. Res. Procedia 2019, 40, 1088–1095. [Google Scholar] [CrossRef]
- Ariffin, A.A.M.; Yahaya, M.F. The relationship between airport image, national identity and passengers delight: A case study of the Malaysian low cost carrier terminal (LCCT). J. Air Transp. Manag. 2013, 31, 33–36. [Google Scholar] [CrossRef]
- Nghiêm-Phú, B.; Suter, J.R. Airport image: An exploratory study of McCarran International Airport. J. Air Transp. Manag. 2018, 67, 72–84. [Google Scholar] [CrossRef]
- Steinman, C.; Deshpandé, R.; Farley, J.U. Beyond market orientation: When customers and suppliers disagree. J. Acad. Mark. Sci. 2000, 28, 109–119. [Google Scholar] [CrossRef]
- Khan, M.J.; Ahmad, S.; Abdul Halim, H.; Ahmad, N.H. The Effect of Service Innovation Orientation and Open Innovation on Innovation Performance of Medium and Small Private Hospitals in India. SAGE Open 2022, 12, 21582440221116110. [Google Scholar] [CrossRef]
- Latyshova, L.; Oyner, O.; Syaglova, Y. The Customer—Oriented Approach: The Concept and Key Indicators of the Customer Driven Company. DIEM Dubrov. Int. Econ. Meet. 2015, 2, 637–645. [Google Scholar]
- Li, W.; Pomegbe, W.W.K.; Dogbe, C.S.K.; Novixoxo, J. Dela Employees’ customer orientation and customer satisfaction in the public utility sector: The mediating role of service quality. Afr. J. Econ. Manag. Stud. 2019, 10, 408–423. [Google Scholar] [CrossRef]
- Chow, Y.T.H.; Li, C.H.; Mak, S.L.; Li, S.P.; Tong, P.S.; Fan, C.K.; Keung, K.L. How Do Full-Service Carriers and Low-Cost Carriers Passengers Perceived Service Dimensions, Passengers’ Satisfaction, and Loyalty Differently? An Empirical Study. J. Ind. Eng. Manag. 2022, 15, 587–613. [Google Scholar] [CrossRef]
- Tafadzwa, M.; Olawale, F. An empirical investigation into the extent of customer satisfaction and customer loyalty at big retail stores in King Williams Town, South Africa. Afr. J. Bus. Manag. 2011, 5, 7665–7673. [Google Scholar] [CrossRef]
- Xia, Y.; Ha, H.Y. Does customer orientation matter? Direct and indirect effects in a service quality-sustainable restaurant satisfaction framework in China. Sustainability 2021, 13, 1051. [Google Scholar] [CrossRef]
- Chang, T.Z.; Chen, S.J. Market orientation, service quality and business profitability: A conceptual model and empirical evidence. J. Serv. Mark. 1998, 12, 246–264. [Google Scholar] [CrossRef]
- Antwi, C.O.; Ren, J.; Owusu-Ansah, W.; Mensah, H.K.; Aboagye, M.O. Airport self-service technologies, passenger self-concept, and behavior: An attributional view. Sustainability 2021, 13, 3134. [Google Scholar] [CrossRef]
- Keller, K.L. Conceptualizing, measuring, managing Customer-Basesd Brand Equity. J. Mark. 1993, 57, 1–22. [Google Scholar] [CrossRef]
- Nguyen, N.; Leblanc, G.; Leblanc, G. The mediating role of corporate image on customers’ retention decisions: An investigation in financial services. Int. J. Bank Mark. 1998, 16, 52–65. [Google Scholar] [CrossRef]
- Usman, A.; Azis, Y.; Harsanto, B.; Azis, A.M. The Role of Innovation and Airport Service Quality on Airport Image: Mediated Effect of Passenger Satisfaction. Afr. J. Hosp. Tour. Leis. 2023, 12, 1111–1126. [Google Scholar]
- Nguyen, N.; Leblanc, G. Corporate image and corporate reputation in customers’ retention decisions in services. J. Retail. Consum. Serv. 2001, 8, 227–236. [Google Scholar] [CrossRef]
- Andreassen, T.W.; Lindestad, B. Customer loyalty and complex services. The impact of corporate image on quality, customer satisfaction and loyalty for customers with varying degrees of service expertise. Int. J. Serv. Ind. Manag. 1998, 9, 7–23. [Google Scholar] [CrossRef]
- Hu, H.H.; Kandampully, J.; Juwaheer, D.D. Relationships and impacts of service quality, perceived value, customer satisfaction, and image: An empirical study. Serv. Ind. J. 2009, 29, 111–125. [Google Scholar] [CrossRef]
- Usakli, A.; Kucukergin, K.G. Using partial least squares structural equation modeling in hospitality and tourism: Do researchers follow practical guidelines? Int. J. Contemp. Hosp. Manag. 2018, 30, 3462–3512. [Google Scholar] [CrossRef]
- Taherdoost, H. What Is the Best Response Scale for Survey and Questionnaire Design; Review of Different Lengths of Rating Scale/Attitude Scale/Likert Scale. Int. J. Acad. Res. Manag. 2019, 8, 1–10. [Google Scholar]
- Hair, J.F.; Risher, J.J.; Sarstedt, M.; Ringle, C.M. When to use and how to report the results of PLS-SEM. Eur. Bus. Rev. 2019, 31, 2–24. [Google Scholar] [CrossRef]
- Ramayah, T.; Cheah, J.; Chuah, F.; Ting, H.; Memon, M.A. Partial Least Squares Structural Equation Modeling; Springer: Cham, Switzerland, 2018; ISBN 9783319574134. [Google Scholar]
- Hair, J.; Hollingsworth, C.L.; Randolph, A.B.; Chong, A.Y.L. An updated and expanded assessment of PLS-SEM in information systems research. Ind. Manag. Data Syst. 2017, 117, 442–458. [Google Scholar] [CrossRef]
- Henseler, J.; Hubona, G.; Ray, P.A. Using PLS path modeling in new technology research: Updated guidelines. Ind. Manag. Data Syst. 2016, 116, 2–20. [Google Scholar] [CrossRef]
- Chin, W.W. The partial least squares approach for structural equation modeling. In Modern Methods for Business Research; Lawrence Erlbaum Associates, Inc.: Mahwah, NJ, USA, 1998; pp. 295–336. [Google Scholar]
- Witell, L.; Snyder, H.; Gustafsson, A.; Fombelle, P.; Kristensson, P. Defining service innovation: A review and synthesis. J. Bus. Res. 2016, 69, 2863–2872. [Google Scholar] [CrossRef]
- Mehrabian, A.; Russell, J. An Approach to Environmental Psychology; The MIT Press: Cambridge, MA, USA, 1974. [Google Scholar]
- Hong, S.J.; Choi, D.; Chae, J. Exploring different airport users’ service quality satisfaction between service providers and air travelers. J. Retail. Consum. Serv. 2020, 52, 101917. [Google Scholar] [CrossRef]
- Yi, H.-T.; Lee, M.; Park, K. Service Orientation and Customer Performance: Triad Perspectives of Sales Managers, Sales Employees, and Customers. Behav. Sci. 2022, 12, 373. [Google Scholar] [CrossRef] [PubMed]
- Chen, A.H.; Wu, R.Y. Mediating Effect of Brand Image and Satisfaction on Loyalty through Experiential Marketing: A Case Study of a Sugar Heritage Destination. Sustainability 2022, 14, 7122. [Google Scholar] [CrossRef]
- Bogicevic, V.; Bujisic, M.; Bilgihan, A.; Yang, W.; Cobanoglu, C. The impact of traveler-focused airport technology on traveler satisfaction. Technol. Forecast. Soc. Chang. 2017, 123, 351–361. [Google Scholar] [CrossRef]
| Criteria | Freq | % |
|---|---|---|
| Gender | ||
| Male | 188 | 53% |
| Female | 168 | 47% |
| Total | 356 | 100 |
| Trip purpose | ||
| Tourism travel | 169 | 47 |
| Business | 99 | 28 |
| Non-business | 65 | 18 |
| Education | 23 | 6 |
| Total | 356 | 100 |
| Type of flight | ||
| Domestic | 258 | 72 |
| International | 98 | 28 |
| Total | 356 | 100 |
| Travel frequency | ||
| 1–2 trips | 197 | 55 |
| 3–5 trips | 90 | 25 |
| >5 trips | 69 | 19 |
| Total | 356 | 100 |
| Latent Variable | Dimension | Item | Loading | Cronbach’s α | CR | AVE |
|---|---|---|---|---|---|---|
| Airport service quality | Servicescapes | ASQ1 | 0.801 | 0.940 | 0.948 | 0.626 |
| ASQ2 | 0.841 | |||||
| ASQ3 | 0.857 | |||||
| ASQ4 | 0.833 | |||||
| Interaction Quality | ASQ5 | 0.885 | ||||
| ASQ6 | 0.900 | |||||
| ASQ7 | 0.681 * | |||||
| Outcome Quality | ASQ8 | 0.897 | ||||
| ASQ9 | 0.895 | |||||
| ASQ10 | 0.869 | |||||
| Functional Quality | ASQ11 | 0.903 | ||||
| ASQ12 | 0.915 | |||||
| ASQ13 | 0.794 | |||||
| Service orientation | Passenger Focus | SEO1 | 0.897 | 0.948 | 0.959 | 0.795 |
| SEO2 | 0.929 | |||||
| SEO3 | 0.918 | |||||
| Services Failure and Recovery | SEO4 | 0.924 | ||||
| SEO5 | 0.940 | |||||
| SEO6 | 0.930 | |||||
| Passenger satisfaction | Cognitive | SAT1 | 0.794 | 0.800 | 0.871 | 0.629 |
| SAT2 | 0.871 | |||||
| Affective | SAT3 | 0.904 | ||||
| SAT4 | 0.897 | |||||
| Airport image | Airport Brand | AIM1 | 0.745 | 0.936 | 0.947 | 0.664 |
| AIM2 | 0.814 | |||||
| AIM3 | 0.767 | |||||
| Airport Credibility | AIM4 | 0.830 | ||||
| AIM5 | 0.878 | |||||
| AIM6 | 0.842 | |||||
| Airport Reputation | AIM7 | 0.759 | ||||
| AIM8 | 0.892 | |||||
| AIM9 | 0.792 | |||||
| AIM | ASQ | SAT | |
|---|---|---|---|
| Airport image (AIM) | |||
| Airport service quality (ASQ) | 0.791 | ||
| Passenger satisfaction (SAT) | 0.534 | 0.497 | |
| Service Orientation (SEO) | 0.812 | 0.761 | 0.487 |
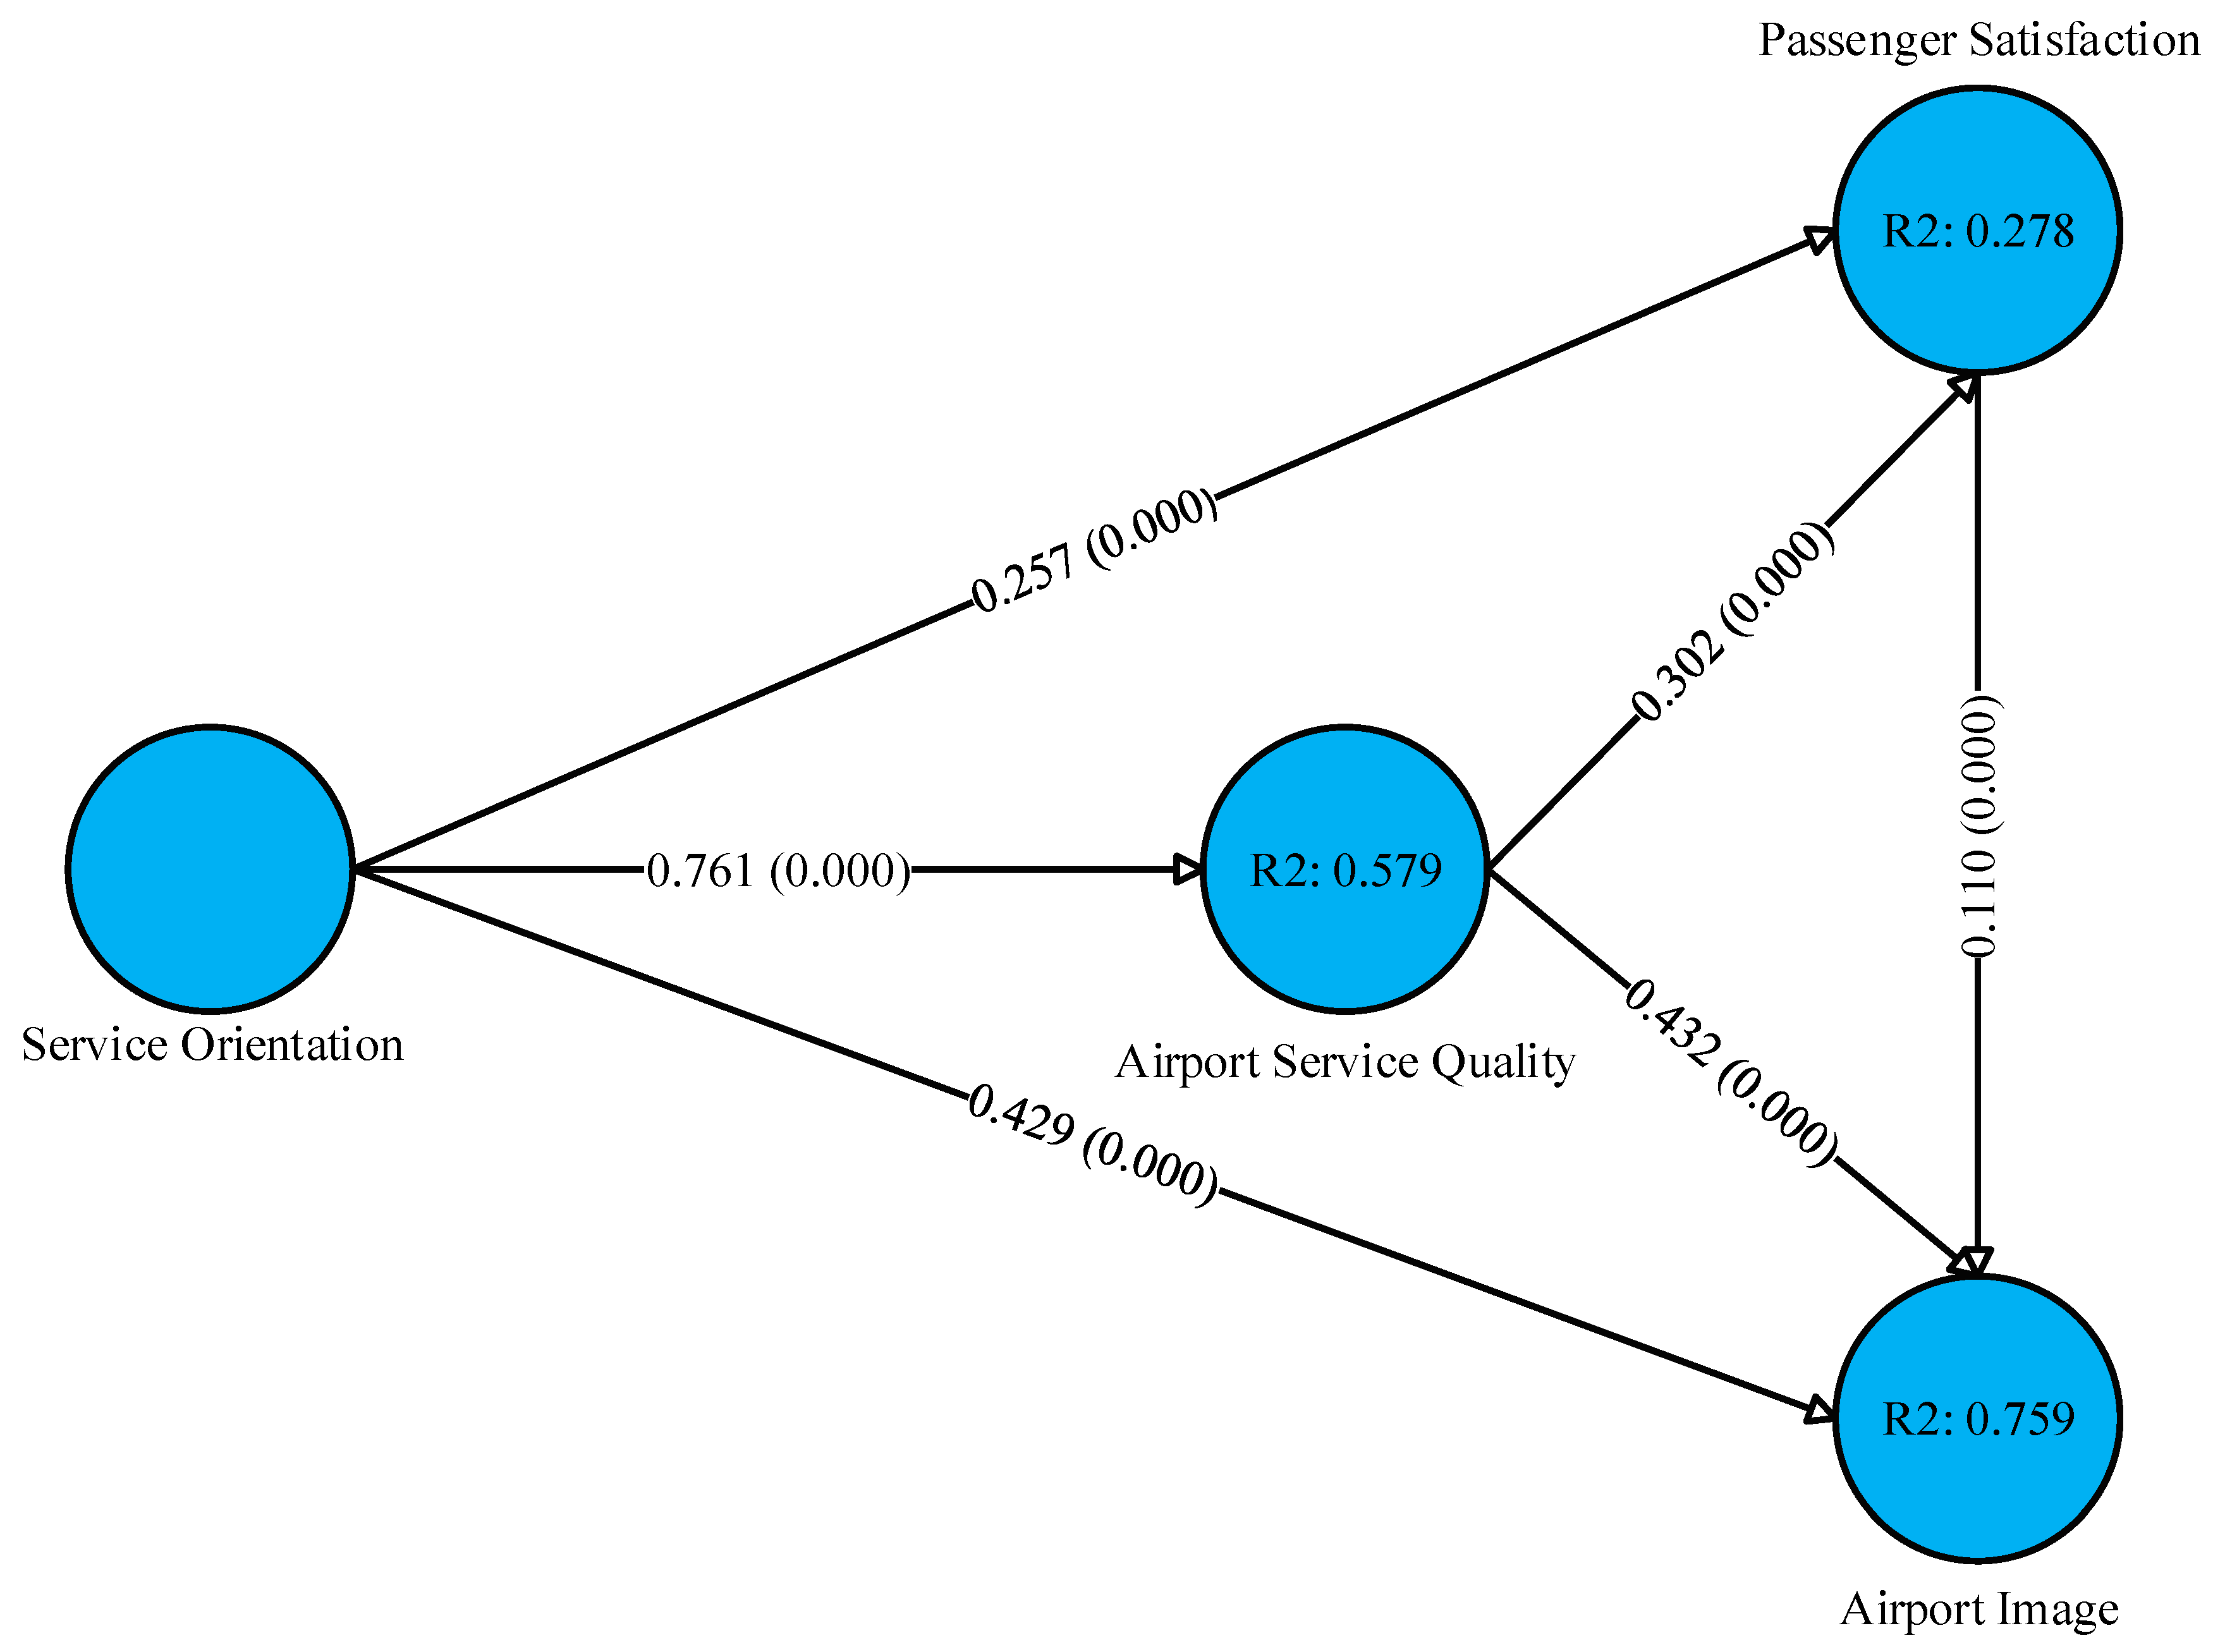
| R2 | Q2 | |
|---|---|---|
| Airport image | 0.759 | 0.498 |
| Airport service quality | 0.579 | 0.359 |
| Passenger satisfaction | 0.278 | 0.172 |
| Relations | SE | T-Statistic | Coef. | p-Value | Result | |
|---|---|---|---|---|---|---|
| Direct Hypothesis | ||||||
| H1 | SEO → ASQ | 0.032 | 23.659 | 0.761 | 0.000 | Accepted |
| H2 | SEO → SAT | 0.072 | 3.589 | 0.257 | 0.000 | Accepted |
| H3 | SEO → AIM | 0.049 | 8.699 | 0.429 | 0.000 | Accepted |
| H4 | ASQ → SAT | 0.069 | 4.353 | 0.302 | 0.000 | Accepted |
| H5 | ASQ → AIM | 0.052 | 8.258 | 0.432 | 0.000 | Accepted |
| H6 | SAT → AIM | 0.036 | 3.038 | 0.110 | 0.001 | Accepted |
| Indirect Hypothesis | ||||||
| H7 | SO → SAT → AIM | 0.013 | 2.253 | 0.028 | 0.012 | Accepted |
| H8 | ASQ → SAT → AIM | 0.013 | 2.498 | 0.033 | 0.006 | Accepted |
Disclaimer/Publisher’s Note: The statements, opinions and data contained in all publications are solely those of the individual author(s) and contributor(s) and not of MDPI and/or the editor(s). MDPI and/or the editor(s) disclaim responsibility for any injury to people or property resulting from any ideas, methods, instructions or products referred to in the content. |
© 2023 by the authors. Licensee MDPI, Basel, Switzerland. This article is an open access article distributed under the terms and conditions of the Creative Commons Attribution (CC BY) license (https://creativecommons.org/licenses/by/4.0/).
Share and Cite
Usman, A.; Azis, Y.; Harsanto, B.; Azis, A.M. The Impact of Service Orientation and Airport Service Quality on Passenger Satisfaction and Image: Evidence from Indonesia. Logistics 2023, 7, 102. https://doi.org/10.3390/logistics7040102
Usman A, Azis Y, Harsanto B, Azis AM. The Impact of Service Orientation and Airport Service Quality on Passenger Satisfaction and Image: Evidence from Indonesia. Logistics. 2023; 7(4):102. https://doi.org/10.3390/logistics7040102
Chicago/Turabian StyleUsman, Agus, Yudi Azis, Budi Harsanto, and Anton Mulyono Azis. 2023. "The Impact of Service Orientation and Airport Service Quality on Passenger Satisfaction and Image: Evidence from Indonesia" Logistics 7, no. 4: 102. https://doi.org/10.3390/logistics7040102
APA StyleUsman, A., Azis, Y., Harsanto, B., & Azis, A. M. (2023). The Impact of Service Orientation and Airport Service Quality on Passenger Satisfaction and Image: Evidence from Indonesia. Logistics, 7(4), 102. https://doi.org/10.3390/logistics7040102