Article

An Innovative Layout Design and Storage Assignment Method for Manual Order Picking with Respect to Ergonomic Criteria

School of Mechanical Engineering, National Technical University Athens, 10682 Athens, Greece
*
Author to whom correspondence should be addressed.
Logistics 2022, 6(4), 83; https://doi.org/10.3390/logistics6040083
Submission received: 29 October 2022 / Revised: 29 November 2022 / Accepted: 1 December 2022 / Published: 6 December 2022

Abstract

:
Background: This paper aims to improve the overall performance of manual warehouse Order Picking (OP) processes by proposing an innovative method for designing a picking area layout, and introducing a storage assignment strategy with respect to ergonomics and workers’ physical fatigue. Methods: The proposed method categorizes the available picking slots based on size and ABC analysis. Ιt takes into consideration a set of ergonomic constraints pertinent to the rack heights and travel distance restrictions for each slot type, leading to the assignment of a location to each slot type based on its individual characteristics. In doing so, the proposed method introduces an innovative ‘flame-shape’ aisle layout. Finally, the products are assigned to their optimal locations, targeting OP time minimization, balanced workload allocation, and ergonomics optimization through a ranking system measuring the ‘difficulty’ of retrieving the products based on their weight, popularity, and slot location. Results: The proposed method led to a productivity rise of 14.9% along with a significant decrease of the ‘difficulty’ index, by 31%. Conclusions: The results prove that a prominent performance improvement can be achieved when both travel distance and manual workload minimization are targeted for determining the picking area layout and storage design.

1. Introduction

In today’s shifting competitive landscape, supply chain networks need to continuously change to accommodate ever-increasing customer expectations. Due to the evolution of e-commerce especially, customer requirements are becoming increasingly complex, demanding enhanced responsiveness, speedy deliveries, and highly customized and variable product assortments, all of which have brought new challenges and requirements for warehouse order fulfillment processes [1].
Order Picking (OP) is widely considered a core warehouse process and its efficiency is considered an important Key Performance Indicator of warehouse management [2], as it can affect delivery times and, hence, influence customer satisfaction. Although OP is an eligible process for automation, according to the works presented in [3], small and medium companies prefer to avoid high investments and maintain their agility by utilizing traditional and conventional methods. Therefore, the majority of warehouses, amounting to 80%, still rely on manual OP activities [4,5] while only 5% of them are fully automated [6]. Given the fact that OP is the most expensive process in contemporary warehouses, accounting for 50% of the total operating costs [7,8], organizations strive for efficiency and cost reduction through decreasing OP time [9]. This need has driven scientific literature to concentrate on travel time minimization, namely the time spent walking between storage locations, which takes up 50% of the total picking time, while overlooking secondary activities, such as setup, search, and pick [8,10].
Apart from efficiency aspects, OP is undoubtedly one of the most labor-intensive, repetitive, and monotonous processes in the warehouse [11]. Considering body posture during travel, setup, and search, pickers maintain either an upright walking or standing position. However, to extract an item from a rack, they might have to bend over, stretch, or twist their body while manually transferring, holding, pulling, or opening large and heavy storage units [12]. These repetitive body postures overload specific muscles due to the force exerted, especially on the back, shoulders, and knees, resulting in daily physical fatigue [13,14], severe chronic injuries, and MusculoSkeletal Disorders (MSDs) [15]. MSDs are the most reported causes for absence from work, being responsible for more than half of all work-related illnesses in the European Union [16].The financial damage caused by MSDs in pickers is equivalent to the costs associated with reduced productivity, work injury compensations, and high employee turnover rate, with the latter dictating the need for new joiners requiring intensive training all over again.
Consequently, in order to ensure increased efficiency and productivity levels, organizations need to shift their focus on the Human Factor (HF) and workers’ well-being. In doing so, it is imperative that factors pertinent to physical fatigue, work safety, discomfort, and common errors be incorporated into the OP decision-making processes [17]. Although this should be a highly prioritized issue, the extant research on that scientific field is still limited. Many prominent studies have shed light on this literature gap, starting from the works presented in [18], which analyzed the interaction between operators and the system, concluding that the research community resorts to unrealistic assumptions (e.g., deterministic time of completion, homogeneity among workers, disregard for rest allowance needs, and physical fatigue etc.) to simplify operating process modeling, thus entirely failing to properly consider the HF impact on operations efficiency and vice versa. Additionally, the authors in [19] elucidated the lack of connection between operating performance and the HF, while in [10] the existence of said gap was also confirmed a few years later, adding that OP research merely focuses on quantitative methodologies, without being able to mathematically integrate work ergonomic factors. Following that, recent studies concluded again that despite the emphasis paid on Industry 4.0 technologies, the HF, in terms of safety and health, has been superficially approached in the literature [20,21]. Moreover, modern supply demands require multi-objective approaches, considering not only travel time reduction, but also equal distribution of workload to avoid picker blocking [22,23], the optimization of staffing levels, error prevention, and successful integration of the HF. Lastly, the authors in [24] noticed that the hits for the keywords “Industry 4.0” and “Internet of Things” account for 29,521, compared to 254 hits for “Ergonomics” and “Human Factor”, revealing that scholars still pay much less attention to the human aspect in such operations.
Motivated by the aforementioned considerable literature gap in the area, this paper proposes an innovative method for integrating storage ergonomic criteria into layout and storage location assignment design models, with the aim of mitigating physical fatigue in manual OP activities. According to the authors’ knowledge, such an attempt to include and appropriately consider the HF in OP optimization has not yet been introduced in the academic literature. The proposed method is validated through a case study conducted in a high-tech retail industry. The remainder of this paper progresses as detailed below. In Section 2, a short literature review on OP methods, storage policies, and relevant research on HF in OP is provided. In Section 3, the problem description is presented, i.e., the operating weaknesses in the OP processes of the case study company. Section 4 demonstrates the proposed method and algorithm, while in Section 5 computational results are demonstrated and discussed. Finally, the paper concludes with Section 6, where the study’s findings and limitations are summarized and future research suggestions are made.

2. Literature Review

For the purposes of this study, it is highly important that OP methods be thoroughly analyzed, with an emphasis on manual OP. Additionally, the advantages and disadvantages of various Storage Policies (SP) are extensively examined. Lastly, as far as the ergonomics and HF in OP activities are concerned, relevant studies are discussed and literature gaps in this specific scientific field are highlighted.

2.1. OP Methods

Picker-to-Parts is the most common method for OP, according to which the picker, after receiving a transfer order, walks to the corresponding slot location and retrieves the demanded unit quantity, either manually or by using complementary means [25]. Two categories of picker-to-parts are identified: the low-level and high-level OP [26]. In the former case, the worker collects the goods from racks near their body height or from a bin shelving storage, while in the latter, which is also referred to as “man-aboard”, lifting order-pick tracks or cranes are used for product retrieval. In this method, picking can be achieved in various ways. First, there is the Pick-to-Box method, also referred to as Discrete Picking, where the storage area is divided into picking zones occupying specific staff positions [27]. Order retrieval is achieved via either a progressive or synchronized zone picking system. In Progressive Zone picking, also called Pick-and-Pass, an order container strictly designated for an individual order progressively passes from each zone, where the pickers place the demanded products until all required items are collected [28]. On the contrary, during Synchronized Zone method, operators from different zones simultaneously retrieve and place the products into the same order container [4]. This way, less total picking time is required, under the condition of equally distributed workload among the zones [29].
Contrary to discrete picking, Pick-and-Sort is a method used for grouped customer orders, i.e., batch picking/picking by article; in other words, having pickers collect bigger quantities of a product in one trip which are designated for more than one order [30]. Additionally, this method can be combined with the Picking Wave method, when orders with common destination or shipping time are grouped together so as to accelerate the picking process [31]. Upon retrieval completion, all goods are sorted accordingly to meet customer requests, a time-consuming procedure that is prone to miscounts and errors. Additionally, in Sort-while-Pick, a method relatively similar to Pick-and-Sort, after performing batch picking of one SKU, the picker instantly sorts the items into individual containers before moving to the next one [4]. A sub-category of this method is Put-to-Light, in which the picker moves bin after bin, each consisting of multiple items of a particular SKU (SKU bin) along a lane of sequentially arranged orders [32]. A light signal, located above each container designated for an individual customer order (order bin), turns on and informs the picker where and how many items of each SKU he/she should place in it. Put-to-Light can be particularly efficient provided that the grouped orders have common characteristics and product requirements.
Relevant to the latter method, the Parts-to-Picker strategy includes mechanized and automated retrieval means, such as AS/RS, aisle-bound cranes, mini loads, and carousels, which bring the items in front of the worker [33,34]. Although this method has started to attract research interest [4] since it results in substantial expenditure drop, limited need for human interaction, and therefore fewer mistakes, it is also associated with various operational limitations. For instance, bottlenecks due to mechanisms’ fixed order retrieving capacity can be responsible for delays, high lead times, and decreased workforce utilization rates [30].

2.2. Storage Policies

A storage policy is defined as a set of rules and parameters according to which the products are stored inside a warehouse until picked to fulfill a customer order [4]. There are two main and commonly separated stock areas inside a distribution centre. The first one, called the “pick stock”, is the area from which pickers pick items to fulfill an order, and is restricted by dimensional limitations to ensure fast product collection, while the other, called the “bulk stock”, is responsible for replenishing the “pick stock” [4]. The storage policies detailed below mostly refer to product allocation in the “pick stock”.
First, according to the Random Storage Policy, every incoming SKU is assigned to any currently available picking slot [35]. This method provides high levels of space utilization [36], while due to randomized product allocation, an equal workload distribution is commonly observed, thus eliminating worker congestion issues [22]. However, high differentiation of goods prevents pickers from familiarizing themselves with picking locations, thus impacting retrieval speed and efficiency. The exact opposite of the random is the Dedicated Storage Policy, in which every product maintains a fixed position based on its characteristics [4]. Although this method allows pickers to develop cognitive ergonomics and be instantly aware of the exact location of goods [37], space utilization drops since a slot remains unavailable to other products, even when the associated SKU is out of stock. To add insult to injury, this method cannot be efficiently applied to seasonal products, which need to change positions often.
A policy highly associated with product popularity is the Full-Turnover Storage Policy, in which products are assigned to storage locations based on their turnover, i.e., the fast-moving SKUs are assigned near the depot in order to minimize picker travel distance [36]. A predecessor strategy of that method is the Cube-per-Order (COI) Storage Policy, in which items are assigned based on the ratio of an item’s storage space requirement (cube) to its popularity (number of storage/retrieval requests for the item) [38]. Also, the Full-Turnover demonstrates similar characteristics to the Volume-Based Storage Policy, in which SKUs are assigned to locations near the pick-up/drop-off point based on their picking volume [39]. The Class-Based Storage Policy is a combination of previously detailed methods and the most commonly employed one [40], according to which products are divided into classes, i.e., A, B, C, etc., based on their popularity. Although each class covers a dedicated storage area, product allocation inside each class is random [41]. This way, this storage policy combines benefits from both the dedicated and random storage policies. The number of classes is quite important. According to the works presented in [42], by assuming an infinite number of items, the number of classes does not impact the demanded storage capacity. However, for a finite number of items, the choice of the number of classes is critical, since the bigger the number of classes, the smaller the number of items per class and, therefore, more storage space is required to store all items, which then increases the average travel time for storing/retrieving items [40]. According to [4], frequently preferred classification layouts are the “Across-aisle” or the “Within-aisle” Storage Policies (Figure 1), in which high-moving products are assigned to locations near the depot and hence, the travel distance required is minimized.
Last, according to the Correlated Storage Policy, alternatively called family grouping, the more items with demand dependence that are assigned to nearby storage locations, ideally in the same aisle or zone, the quicker the picking process will be [43,44,45]. The authors in [22] considered the correlated policy as the optimal storage method, when combined with traffic control and equal workload distribution.

2.3. Human Factor in OP

Besides accelerated technology advancement, humans still comprise a core factor in logistics operations due to their ability to remain agile and adaptable in a dynamic environment [3]. Other than that, mental capacity and analytical thinking allow humans to handle and solve complex problems, which is their main competitive advantage over machines. Although the human contribution to OP efficiency is an important field of research, only a few prior studies have examined that connection, as discussed below.
The authors in [46] created a stochastic model to optimize product layout in a manual OP warehouse, aiming at picking time minimization, while the authors in [47] developed a storage policy based on a logical, from pickers’ perspective, OP sequence, with the aim of reducing OP duration and errors. The research presented in [48] investigated the impact of handling storage units from pallets on the spine. The authors concluded that the most severe impact is observed during the manual lifting of boxes from the ground level. In [49], the authors conducted a pioneering analysis utilizing the concept of “Golden Zone” picking, as introduced in the works of [50,51] in order to improve OP performance. The authors of the latter study found a statistical difference in the pick times of SKUs in the golden zone, i.e., the area between a picker’s waist and shoulders, compared to SKUs not in the golden zone. Although the authors in [49] concluded that placing fast moving products in the golden zone can significantly reduce time and effort, they did not take into account potential congestion of warehouse operators in the aisles and assumed fixed space capacity for all SKUs regardless of their daily demands in units.
In 2011, the authors in [52] analyzed and highlighted the importance of the understudied field of human safety in storage operations, while the authors in [53] explored employees’ mental capacity, focusing on the ability of human learning in OP systems. In [54], a model for designing ergonomic OP operations was developed, taking into consideration pickers’ individual characteristics and physical stress. The numerical validation of the model concluded that 0.85 m is the optimal height for storing popular products. Following that, two notable literature reviews were conducted on human and ergonomic aspects in OP processes to evaluate how these factors could improve operators’ performance and well-being [10,55].
Additionally, the authors in [56] generated a bi-objective optimization model based on Pareto frontiers, which produced a set of trade-offs between picking time and energy expenditure based on the energy expenditure model presented in [57]. The authors suggested that future research should focus on warehouse and aisle layout design, with the aim of reducing manual effort in OP. Based on the aforementioned study, economic and ergonomic analyses were performed in [12], considering three technical design options for racks, i.e., full-pallets, half-pallets, and half-pallets equipped with a pull-out system. The authors concluded that succeeding research should assess different rack layouts, accommodating products stored in boxes, or conduct case studies using already developed models. Furthermore, the authors in [58], by utilizing the OWAS (Ovako Working Posture Analyzing System) index and the energy expenditure concept, concluded that the least ergonomic height for OP is the ground floor level, while heights at 1.4 m and 0.85 m from the floor were deemed as the most ergonomic ones. Also, the setup, travel, and search phases, which are performed in standing or upright walking positions, require relatively low energy consumption, while pick postures including twisting, stretching, and bending substantially affect body fatigue. Similar to [58], the authors in [59] used the OWAS method to propose a solution to the storage assignment problem. The authors developed a multi-objective model based on binary integer linear programing, taking into consideration OP time, energy expenditure, and health risks. The research presented in [17] also pointed out which devices should be used in industrial contexts to monitor fatigue level in OP, with to the aim of enhancing picker performance. Later on, the same authors proposed an integration model for product assignment based on both workload and cost, using both full and half pallet configurations [60]. In [61], a layout and assignment optimization was performed in a U-shaped picking area whose shelves are built from pallet cages, aiming to minimize walking distance and body strain during OP, using the model proposed in [57]. In [62], a Monte Carlo simulation model was presented, estimating the average rate of energy expenditure (Kcal/min) and fatigue allowance for female order pickers in manual OP systems with high demand rates. Finally, analyses on fatigue accumulation and rest allowance were also performed in [63,64].

3. Problem Description

The picking area of the facility studied in this paper fulfills both physical and online orders. It consists of 40 identical aisles equally divided into two mezzanine floors, where material flow is achieved via a conveyor belt. On both floors, the layout overview is designed as follows. The depot aisle and conveyor belt cross vertically each aisle from its front side. On the opposite side, the aisles lead to a back aisle as depicted in Figure 2, where bins replenish the picking slots before they become empty. It can be assumed that all aisles maintain equal distance from the depot.
Each double-sided aisle is approximately 8 m long and consists of two similar sides of static slots divided into five bays, each estimated at 1.6 m, with five racks, each with a depth of 0.5 m. The static racks have a height of 0.39 m; thus, the total bay height is roughly 2.4 m (Figure 3).
The storage area provides an additional storage type called dynamic slots. These slots consist of inclined rollers, as illustrated in Figure 4, and their depth is 2.5 m, i.e., five times the depth of a static rack. When replenishing from the backside of the bay, storage units slide to the front, from where they are retrieved during picking. The case here is that the conveyor belt progresses across the dynamic slots. Thus, a sequential number of bays are assigned to each picker, who moves in a narrow space between the conveyor belt and the dynamic storage slots to pick the required items. As a result, the required travel distance is limited to the bare minimum, since pickers already stand in front of the picking locations. Although dynamic slots will not be further analyzed in the specific study, the products stored there have been considered in the overall analysis for developing the proposed method, so they extensively affect the produced results.
The OP method chosen is Progressive Zone Picking, as the storage area under discussion is divided into eight zones. Each zone requires roughly the same number of pickers, which fluctuates throughout the day depending on the workload. In each zone, both discrete and batch picking take place. Radio Frequency (RF) picking is implemented for identifying products and receiving order information, since it ensures greater efficiency and lower error possibility than the paper based method. When an order container arrives at the pick zone, the first picker available scans its barcode to identify which SKUs and quantities are needed to be retrieved. In case the container is strictly designated for an individual order, discrete picking is applied. However, if there is a multitude of similar orders consisting of few items, they are grouped together, so that pickers can retrieve bigger quantities from each SKU in one travel. Following that stage, upon returning to the depot area, pickers transfer the SKUs into smaller boxes; each with a unique barcode for each order placed inside the order container.
As far as product assignment into picking locations is concerned, the Random Storage Policy has been chosen. Three picking slot sizes are provided; small-, medium- and large-sized slots, with the latter having twice the volume of the second, and four times the volume of the former. Upon a new arrival, the product is assigned to the smallest slot size into which its storage unit can fit. However, the location of the selected slot, i.e., floor, aisle, bay, rack, is random. Every SKU maintains the same slot, for as long as it is in stock or an upcoming arrival is scheduled. Otherwise, namely in the case an SKU becomes obsolete, a different SKU takes its place and is assigned to this particular slot.
Although this operational strategy seemed to have been working satisfactorily in previous years, the ever-growing, fast-paced business environment has led to hampered performance and productivity issues which need to be addressed. First, the storage location assignment strategy applied led to inadequate inventory in the picking slots. Consequently, replenishment needs skyrocketed during periods of high demand, and the system’s resources were unable to fulfill them on time. Second, the oversight of not conducting turnover and popularity analyses led to constant congestion of pickers in specific aisles, while others remained almost unvisited during the day. Hence, the unequal distribution of transfer orders among aisles was conducive to a significant increase in average picking time. Third, it was observed that the Random Storage Policy severely impacted pickers’ physical health, since highly popular SKUs were assigned to locations far away from the depot at inefficient heights, requiring long travel distance and forcing pickers to resort to unnecessarily intense body motions. Thus, over the course of time, workforce performance substantially dropped.
Taking into account the aforementioned operational weaknesses, the current study aims to boost productivity rates, by reducing picking time and relieving workers’ physical fatigue. To do so, it aims to redesign the aisles’ layouts by proposing an upgraded slotting policy in accordance with product characteristics and enhanced warehouse ergonomics.

4. Proposed Method

The proposed method discussed further on was developed using MATLAB software and Microsoft Excel. For the purposes of this study, a sample of 5842 SKUs was examined. After defining the new types of slots needed, a layout redesign and storage assignment method was proposed and implemented in the case study facility, with the aim of enhancing OP performance by mitigating workers’ physical fatigue through an innovative OP difficulty ranking system.

4.1. Selection of Slot Sizes

In the initial layout, products were assigned to slots based on their unit dimensions, so that the required picking storage space was minimized. However, this strategy overloaded the system with frequent replenishment demands. Therefore, the company decided to determine the slot size selection based on the demanded unit quantities of each SKU, with the aim of achieving sufficient inventory levels for seven days, with no replenishment needs in the meantime. Based on the average daily demand and number of items included in one unit, the number of boxes needed was estimated for each product. In this direction, an algorithm was developed, exploring the six degrees of freedom of a rigid body in a three-dimensional space. In such a manner, the optimal placement orientation or combination of orientations was defined for each SKU, targeting the storage of all the demanded units per product while minimizing the dead volume in the selected slot. Nevertheless, this algorithm is out of scope for the current study, and will be presented in authors’ future work.
Although all slots have the same depth and height because of the fixed rack structure, their length varies according to their size. Assuming S is the length of the medium-sized slot, S2 would be the length of the small-sized slot, equal to half the length of S, and 2S the length of the large-sized slot, equal to double the length of S.

4.2. Classification of SKUs Using ABC Analysis

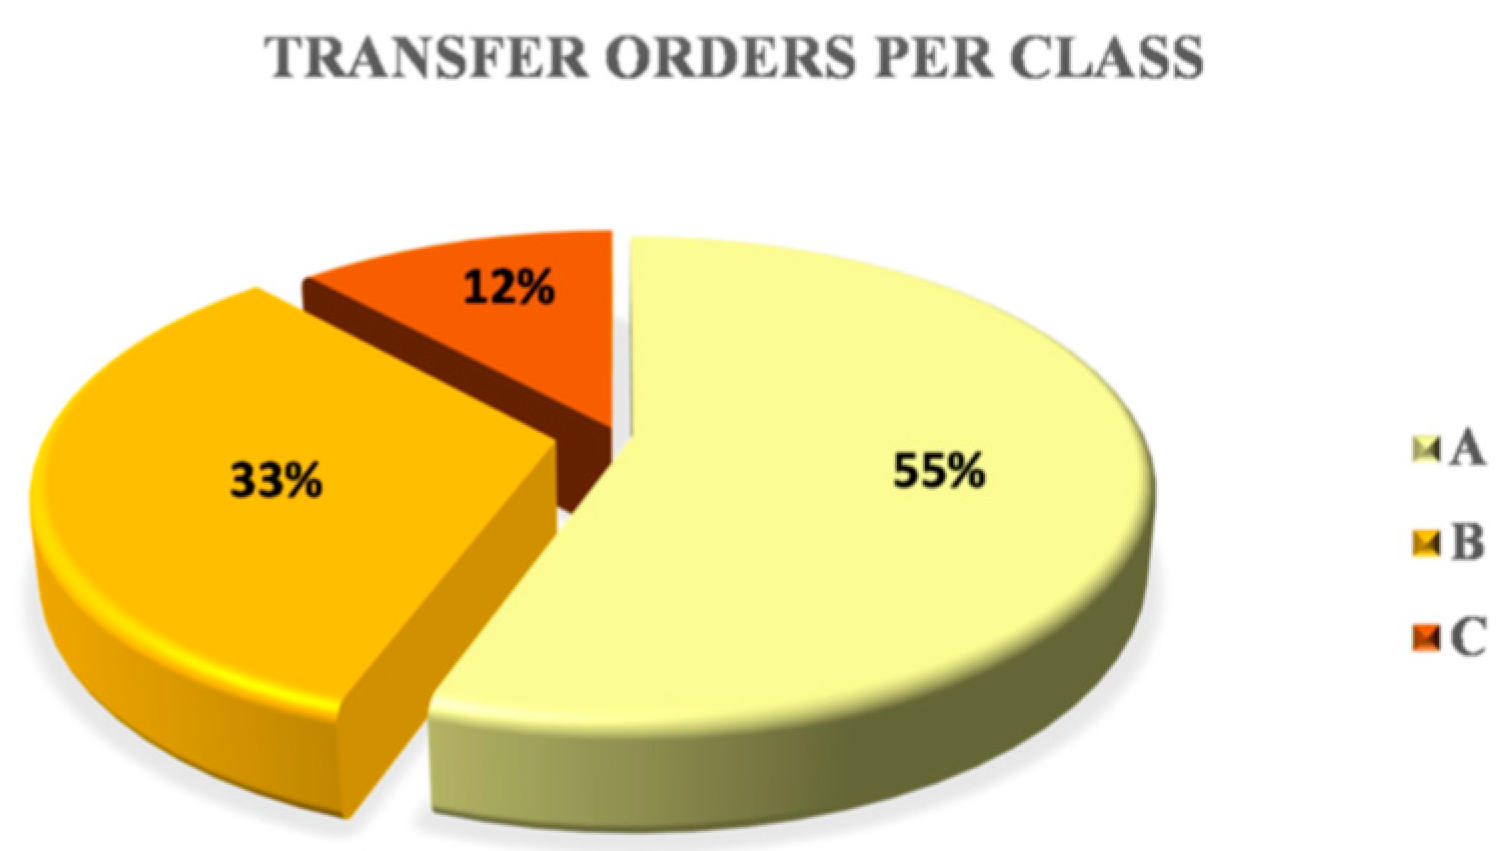
In order to decrease picking time and effort, it is imperative that a popularity analysis be conducted based on products’ turnover rates, which is defined as the daily number of times a picker needs to travel to a specific location and retrieve a demanded quantity of an SKU. By applying Pareto’s principle, products were classified into three categories. SKUs with more than five transfer orders per day were classified as “A” products, i.e., the most fast-moving ones. SKUs with less than five but more than one transfer order fell into class “B”, while the rest into class “C”. Every SKU is characterized by two factors; its popularity class and the minimum slot size in which it can fit. Thus, by having three turnover classes and three slot sizes, nine different combinations emerge; in other words, nine different slot types. The new slot types are notated as XY, with the first symbol designating the class, i.e., A, B, or C, and the second the slot size, i.e., S2, S, or 2S.

4.3. Number of Slot Types per Aisle

The main goal of the proposed method is to design an “ideal aisle” which meets the system’s needs and can be reproduced across the picking area, assuming equal travel distance from the depot to the starting point of each aisle. First, it is important to specify the exact number of slots which can fit in a rack, i.e., the space between two consecutive columns separating bays from one another.
  • Nine small-sized slots (S2)
  • Four medium-sized (S) plus one small-sized slot (S2)
  • Two large-sized (2S) plus one medium-sized (S) or two small-sized slots (S2)
As it can be easily inferred, there can be diverse combinations, given that every length type is a multiple of the others. The steps for estimating the number of slots per aisle are detailed below.
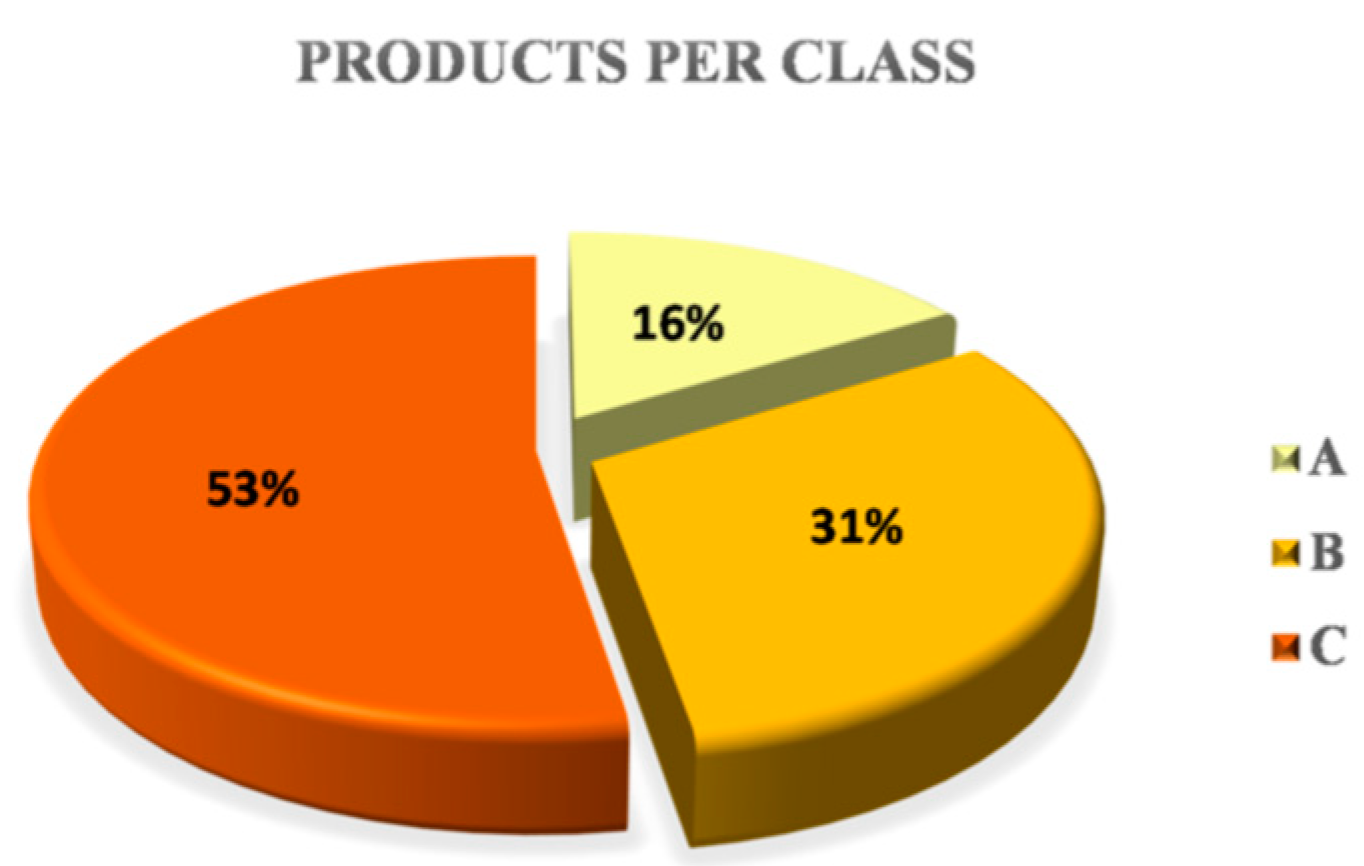
  • Calculation of the number of products classified in each category of the nine slots developed above, according to their characteristics and corresponding percentages.
  • Assuming that each aisle can accommodate 100 products in total, the percentages found in Step 1 are converted in S length according to Equation (1).
    Length   of   X Υ   Slots   per   100   Products = ( Percentage   of   products   demanding   X Υ   slots ) L XY L S
  • The total length per aisle of XY slots needed for 100 products is calculated in S length.
  • Since each rack can accommodate four S-sized slots and one S2-sized slot, the total rack length equals to 4.5 S. Therefore, for an aisle consisting of 50 racks, the total slot length equals to 225 S.
  • Knowing the length of each slot type per aisle in S level, the total rack length required for 100 products, and the total rack length per aisle, the number of each slot type per aisle is calculated according to Equation (2).
    Number   of   XY   Slots   per   Aisle = round ( ( ( Length   of   X Υ   Slots   for   100   Products ) ( Total   Rack   Length   per   Aisle ) Required   Rack   Length   per   Aisle   for   100   Products ) L S L XY )
After applying the above described methodology, the total length of the estimated number of slots resulting from the ROUND function was adjusted accordingly, so as to approach as much as possible the maximum rack length per aisle, i.e., 225 S.

4.4. Ergonomic Constraints

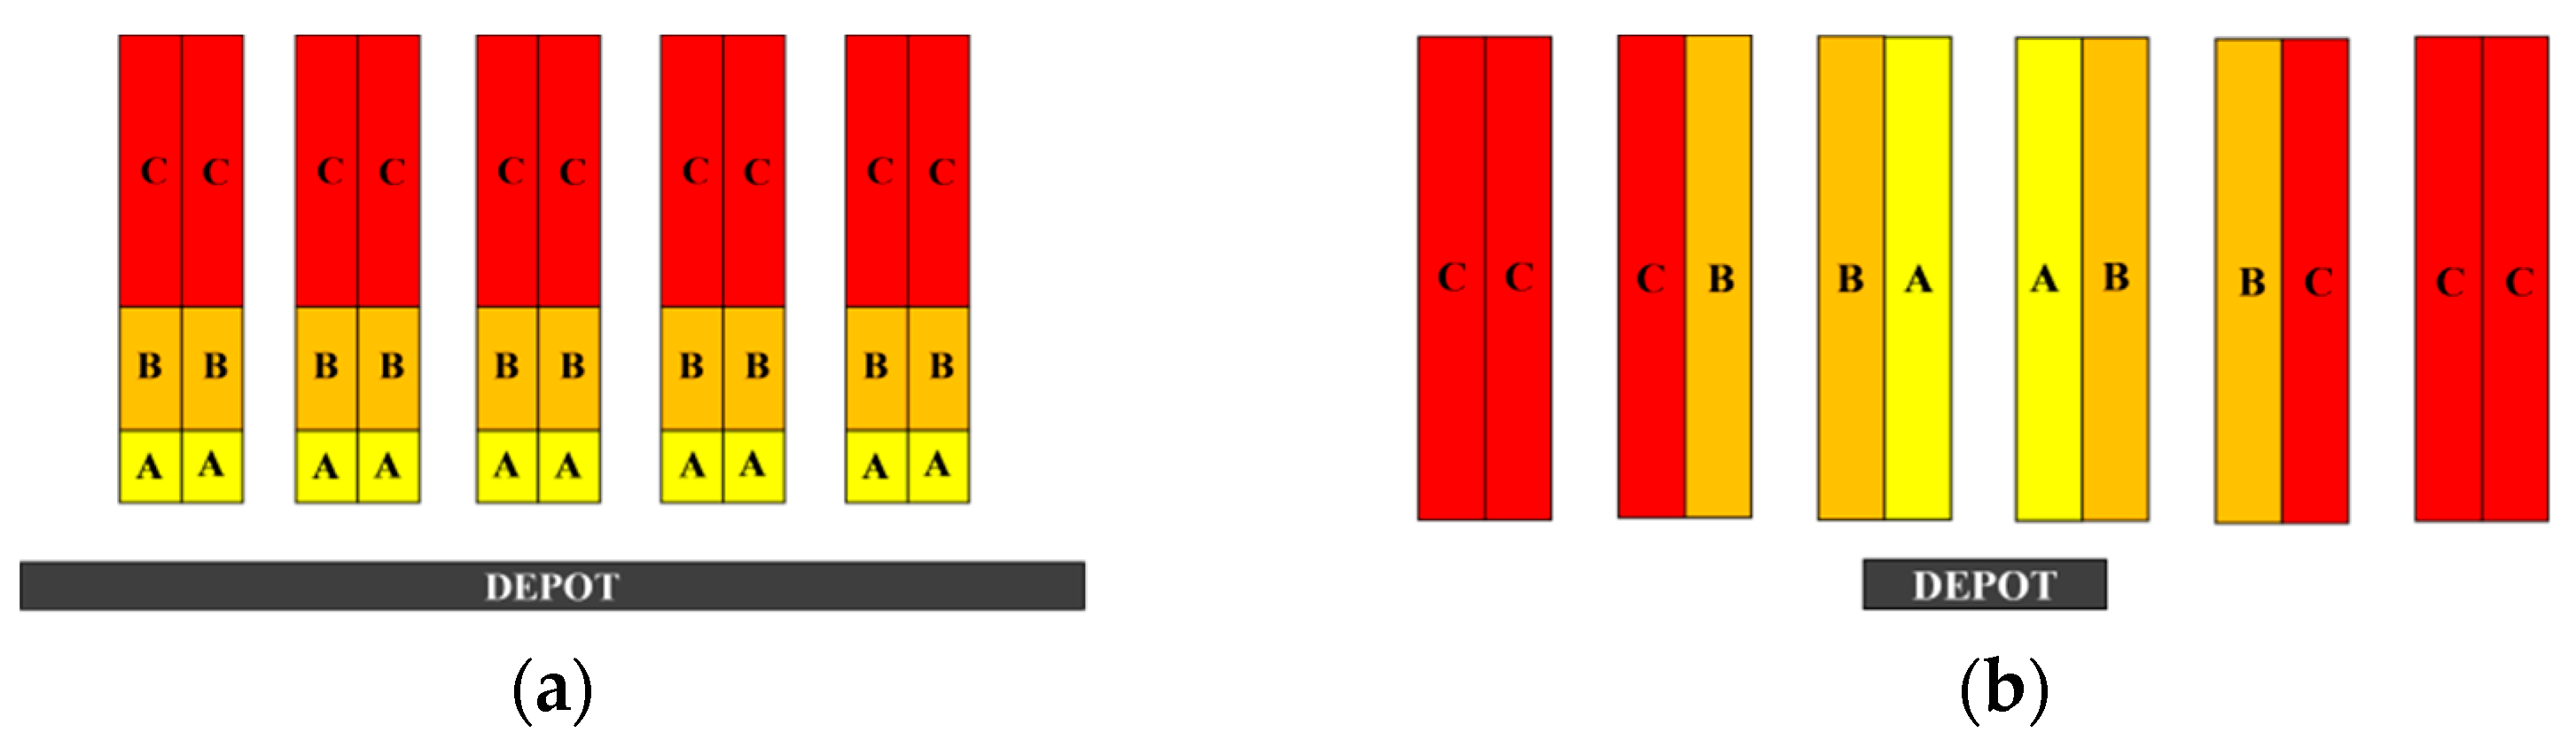
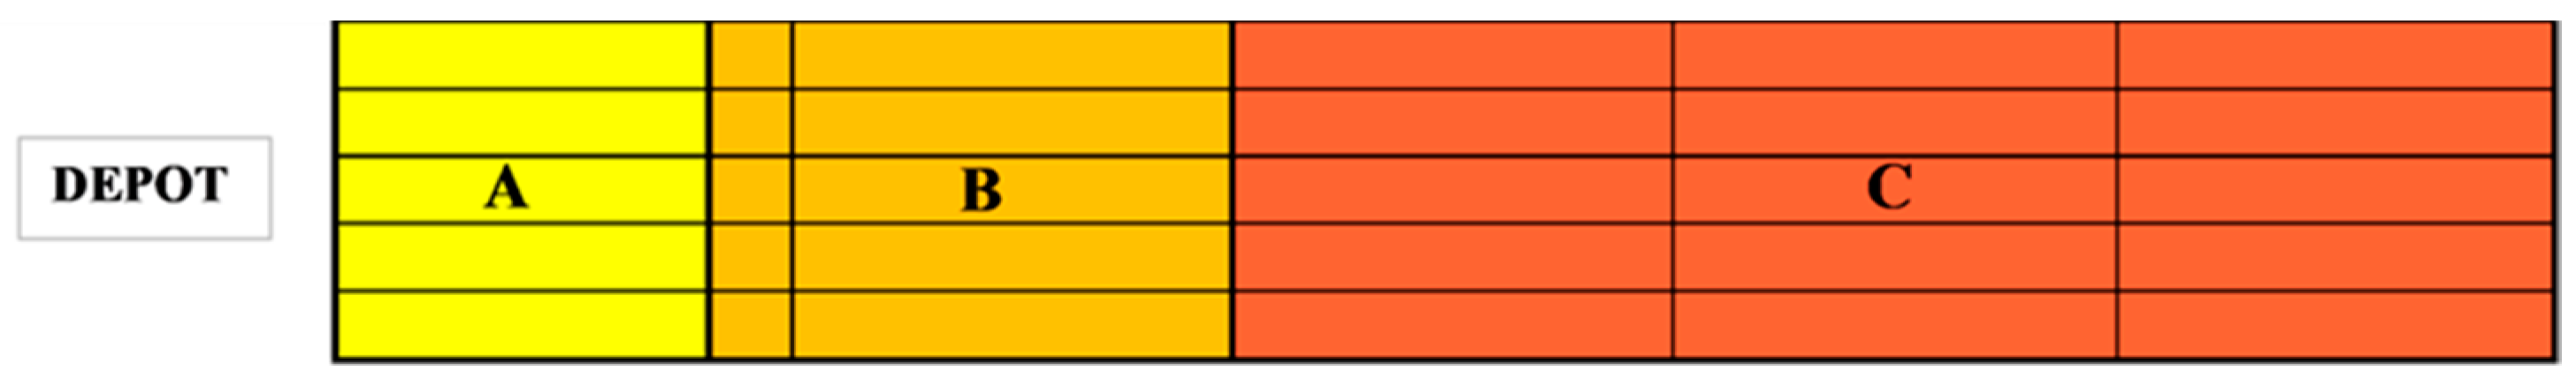
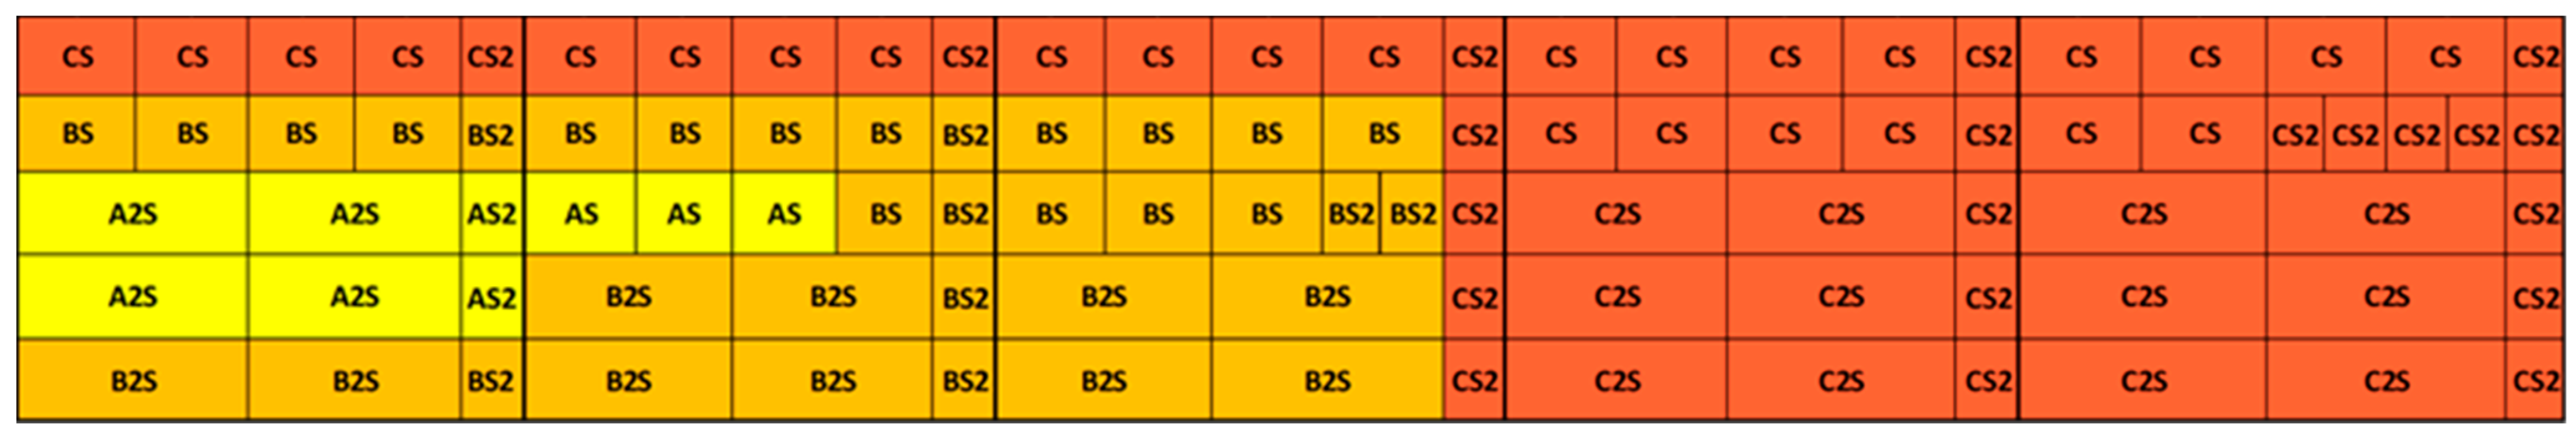
As previously mentioned, the conveyor crosses all aisles from their front side. According to literature, the classification of slots preferred in such a layout structure is the “across-aisle”, based on which a vertical separation of classes can be observed, such as the one shown in Figure 5, with “A” products occupying the bays closest to the depot, followed by “B” and “C” ones at the back.
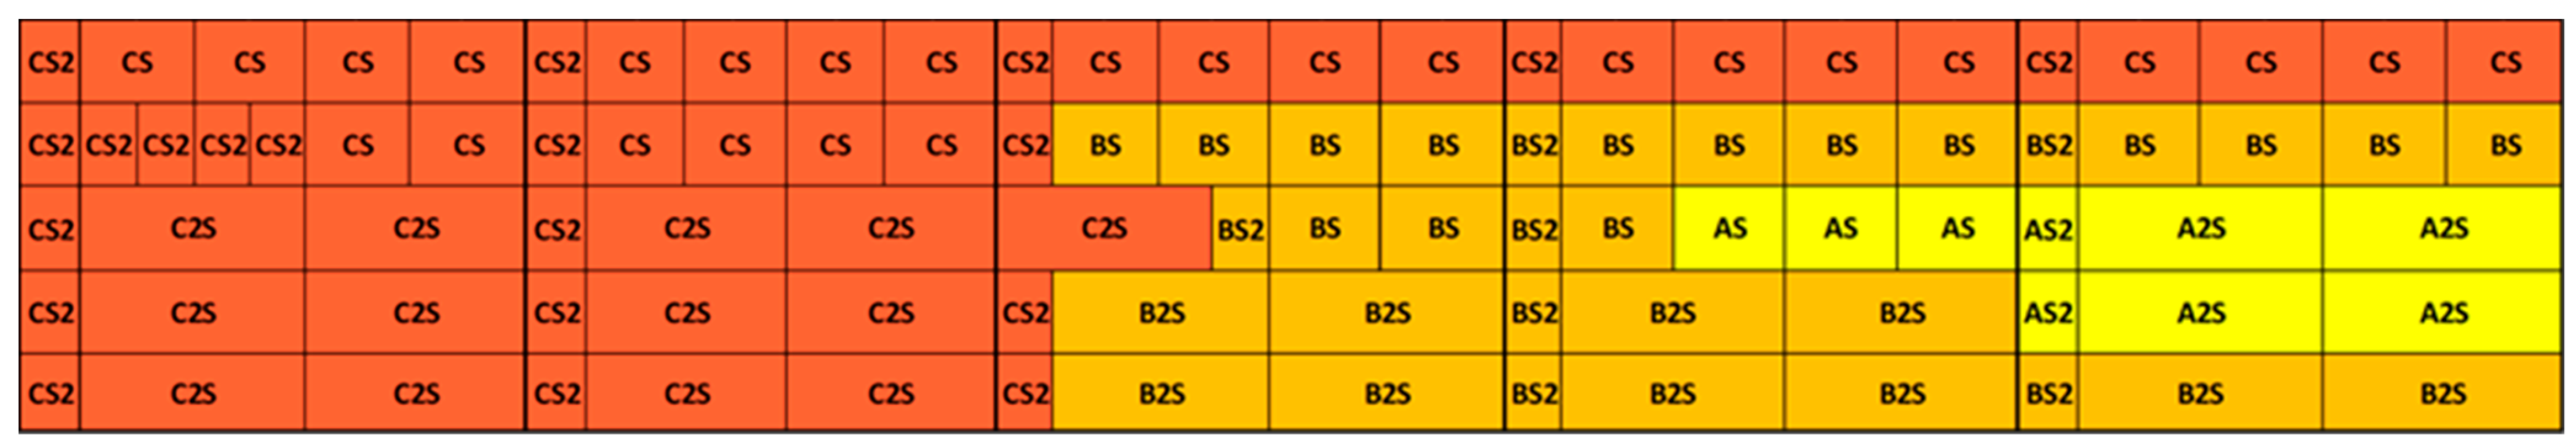
Although the aforementioned classification has considerable merit, the approach taken in this paper differs in that it introduces several ergonomic criteria, which refer not only to the travel distance but also the ergonomics of the height at which each slot is located. Considering that walking is the least intense physical activity in a warehouse, this study proposes that “A” products, which would be expected to be placed in slots close to the conveyor, should occupy positions in distant bays with one essential limitation: rack ergonomics.
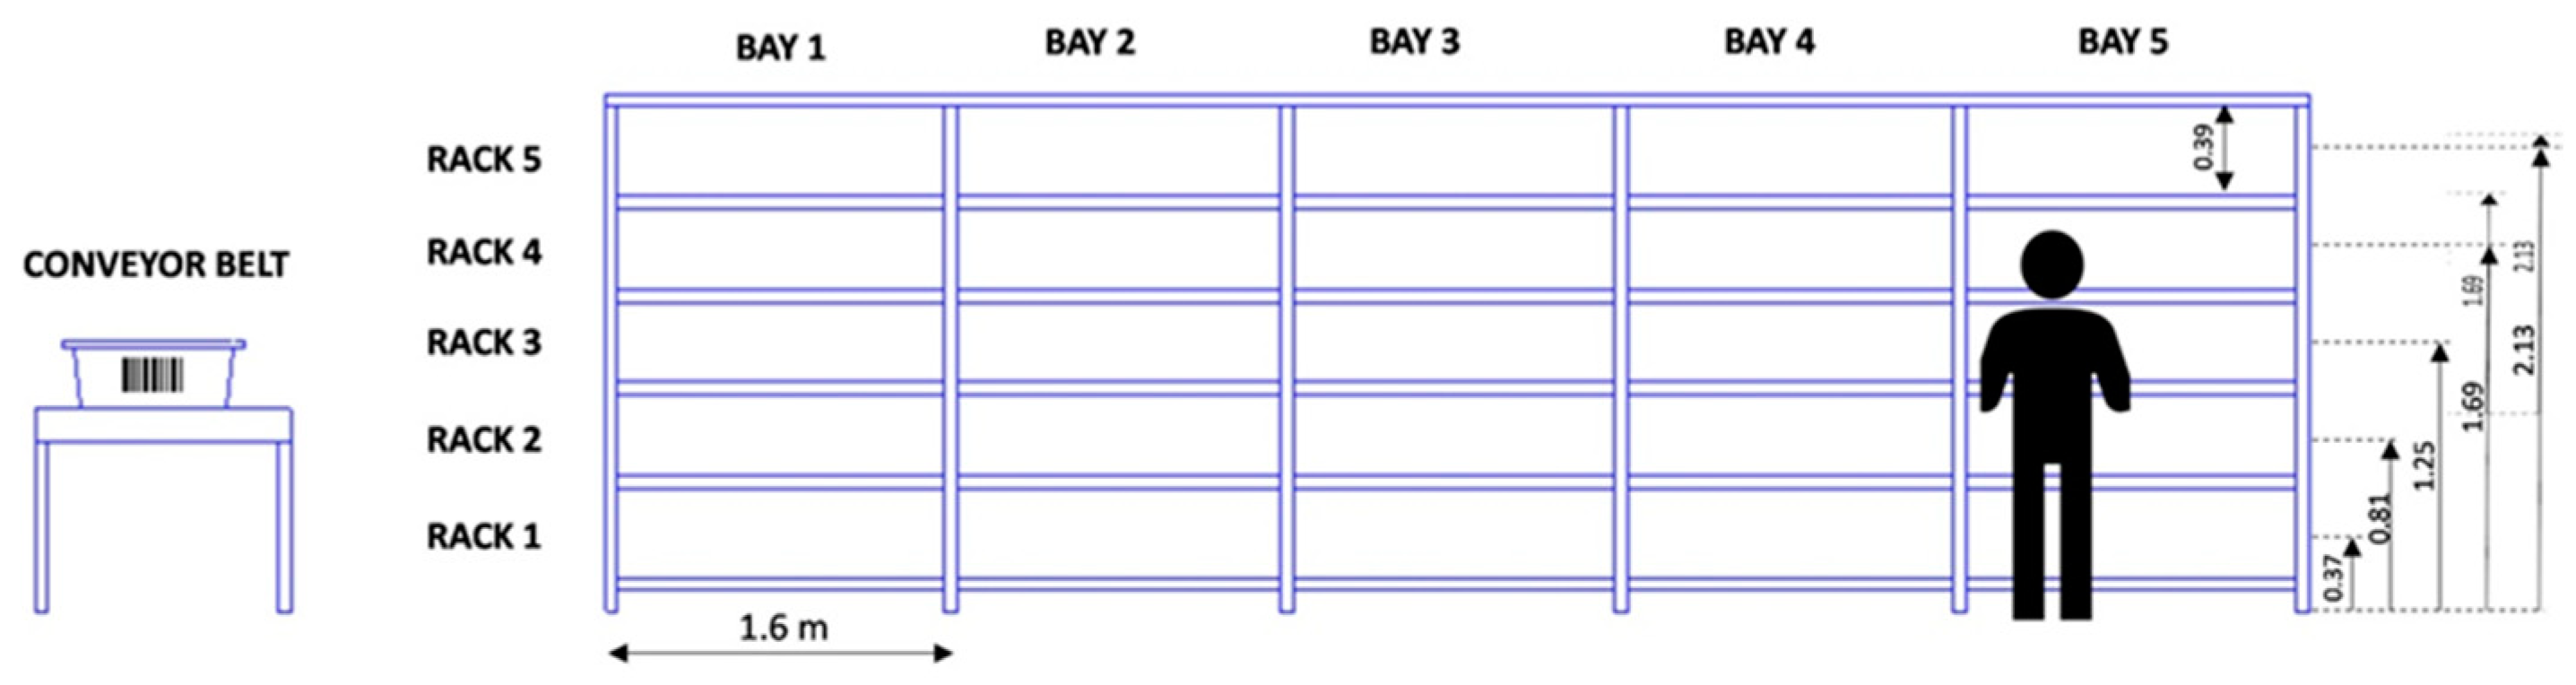
According to the concept of “Golden zone” picking, in our case the most ergonomic rack is the 3rd one, as its middle point is approximately 1.2 m from the ground, which is higher than a picker’s waist but lower than his/her shoulders (Figure 3), taking into consideration that the average picker height is around 1.73 m. The 2nd and the 4th rack are almost equally ergonomic, placed in second and third rank respectively, since their height levels are not far away from the golden zone yet they require more intense movements compared to the 3rd rack. The 4th rack, at 1.69 m, forces pickers to resort to constant arm raising, thus leading to shoulder straining and pain, while the 2nd one requires slight bending for reaching items at 0.8 m. The 1st rack, placed at the ground level, is a quite inefficient picking height since it compels workers to bend over or kneel repeatedly, thus hurting their back, waist, and knees in the long run. The 5th rack, situated at a height of 2.13 m, is indisputably the least ergonomic one since it requires the use of a step stool enabling pickers to reach for the products and endangers them of getting hit by a falling object, which can cause severe blunt force trauma and leave them out of work for a long period of time, or render them incapable of returning to work. This is why placing bulky and heavy products on high racks should be prohibited.
It goes without saying that decreasing human workload will yield substantial results in terms of performance improvement. In the short-term basis, workers will be more efficient and faster in their day-to-day OP tasks, while in the foreseeable future physical pain will substantially diminish. Thus, by investing in ergonomics and ameliorating working conditions inside their distribution centers, companies will manage to extend the productive lifespan of workers. Based on the above, Table 1, Table 2 and Table 3 present the bay and rack constraints based on each slot class and size.
It is worth underlining that the bays’ identification numbers, i.e., 1 to 5, represent the sequence of bays at each side of an aisle, starting from Bay 1 at the front side next to the depot, culminating in Bay 5 at the back. So, the bigger the identification number of the bay is, the longer the travel distance. It is worth mentioning that A-class slots may be located at more distant bays as long as they are placed in ergonomic racks. On the contrary, “C” slots can be situated at bays right next to the depot on condition that they are placed at the least ergonomic heights. Also, with regard to size, 2S slots, i.e., the large sized ones, are not allowed to be placed in racks above the 3rd one, as they are more likely to accommodate heavy and bulky products.

4.5. Layout Algorithm

An aisle is visualized as a four-dimensional matrix, notated as
SL(r,x,y,s)
  • The first dimension of the matrix (r) can take the values 1 or 2, and represents the left or right side of an aisle, as perceived by a picker looking at the aisle from the conveyor side.
  • The second dimension (x) represents the bay number and increases as the picker progresses along the aisle. Since each side of the aisle has a total of five bays, x takes values from 1 (closest to the depot) to 5 (farthest from the depot).
  • The third dimension (y) represents the rack number in each bay and can take values from 1 (lowest rack) to 5 (highest rack).
  • The fourth dimension (s) represents the ascending number of slots on each rack, starting from the point closest to the depot. Each rack can accommodate from three (two 2S and one S2) to nine (S2) slots.
The required number of slots per aisle will be equally divided between its two sides. However, because the number of some slot types per aisle is not even, the storage assignment on the two sides will be different. Table 4 summarizes the location constraints for each slot type for variables x and y in the SL matrix, i.e., bay and rack, based on the above-analyzed ergonomic factors.
The algorithm receives as input the needed number of each slot type per aisle and the ergonomic constraints specified above. The process begins with placing the slots on the left (r = 1) and then on the right side (r = 2) of the aisle.
The order in which slots will be placed is in accordance with Table 4 and, thus, class “A” will be first, “B” second, and “C” third, since assignment starts from Bay 1. As far as the slot sizes within each class are concerned, large slots, i.e., 2S slots, will be placed first followed by S, and finally S2 slots. Large sized slots have a height restriction and, thus, must be placed before the smaller ones. Also, small sized slots can be placed in the space left by large- and medium- sized slots.
For each type considered, in order to achieve as much uniformity as possible between the two sides of the aisle, the condition to be checked for an even number of slots is
N XY _ stored < N XY tot 2 = N XY _ max
while, for an odd number of slots, the condition to be checked is
N XY _ stored < N XY tot 2 + 1 = N XY _ max  
where
N XY _ stored = number   of   XY   slots   per   side  
N XY tot = total   number   of   XY   slots   per   aisle
Conditions (3) and (4) specify that for even numbers, half slots will be stored on the right and half on the left side. For odd numbers, half slots plus one will be stored on the left side for as many types as they can fit. As for the rest, one additional slot will be placed on the right side. The final number of slots per aisle side is presented in Table 5.
For each slot type, following the order above, the algorithm starts by filling all empty slots starting from the bay closest to the depot, i.e., xmin with respect to the bay and rack limitations. Then, it moves on to the next bay until it reaches the farthest bay allowed, i.e., xmax, or until all slots of the specific type, for the particular side of the aisle are placed.
As far as the racks are concerned, the placement does not necessarily start from the lowest to the highest rack. As for the large sized slots, which need to be located in low level racks, the process will be initiated from the lowest (ymin) to the highest rack (ymax). On the contrary, medium- and small-sized slots are progressively assigned from the highest to the lowest rack with regard to their respective ergonomic constraints. For this reason, variables xpr and ypr are used, indicating the bay and rack from which the placement will start.
Starting from the left side of the aisle (r = 1) for the first slot type, the starting point (xpr, ypr) is assessed. The algorithm examines if there is available length (Lxy_remain) for the slot under consideration (LSLOT) to be placed in. If there is not, the rack examined is increased or decreased by one, according to the slot type and the same condition is checked again.
L xy _ remain > L SLOT
In case the available length of a particular rack is sufficient, the slot is assigned there. The length of the slot at hand is then subtracted from the available length of the rack. Note that the initial available length for all racks is 1.6 m.
L xy _ remain =   L xy _ remain L SLOT  
The number of XY slots stored (NXY_stored) is increased by one.
N XY _ stored = N XY _ stored + 1  
Finally, the total number of slots available on the specific rack is increased by one. This step is very important for slot naming which will be conducted after the placement. The number above is fed in a matrix as
D ( r , x , y ) = D ( r , x , y ) + 1
which represents variable s in the matrix SL(r,x,y,s).
Consequently, conditions (3) or (4) are checked again for the left side of the aisle. In case the logical condition is true, the process is repeated. However, if the available length of the initial rack is not adequate, the algorithm proceeds to examine the next rack in order. If no rack of the bay under examination fulfills this condition, the next bay in sequence is assessed, starting again from the initial rack. The loop is completed either when all the slots of a particular type, for the left side, have been placed in a rack, i.e., conditions (3) or (4) have turned false, or when there is no more space left for the specific slot type, so until condition (5) turns false for all racks. In such case, the same steps are followed again for the next slot type in order. Once all nine slot types have been examined, the algorithm continues with the right side of the aisle (r = 2), initializing the available rack length and repeating the whole process for the remaining slots. This way, an “ideal aisle” is created, which can be reproduced across the picking area.
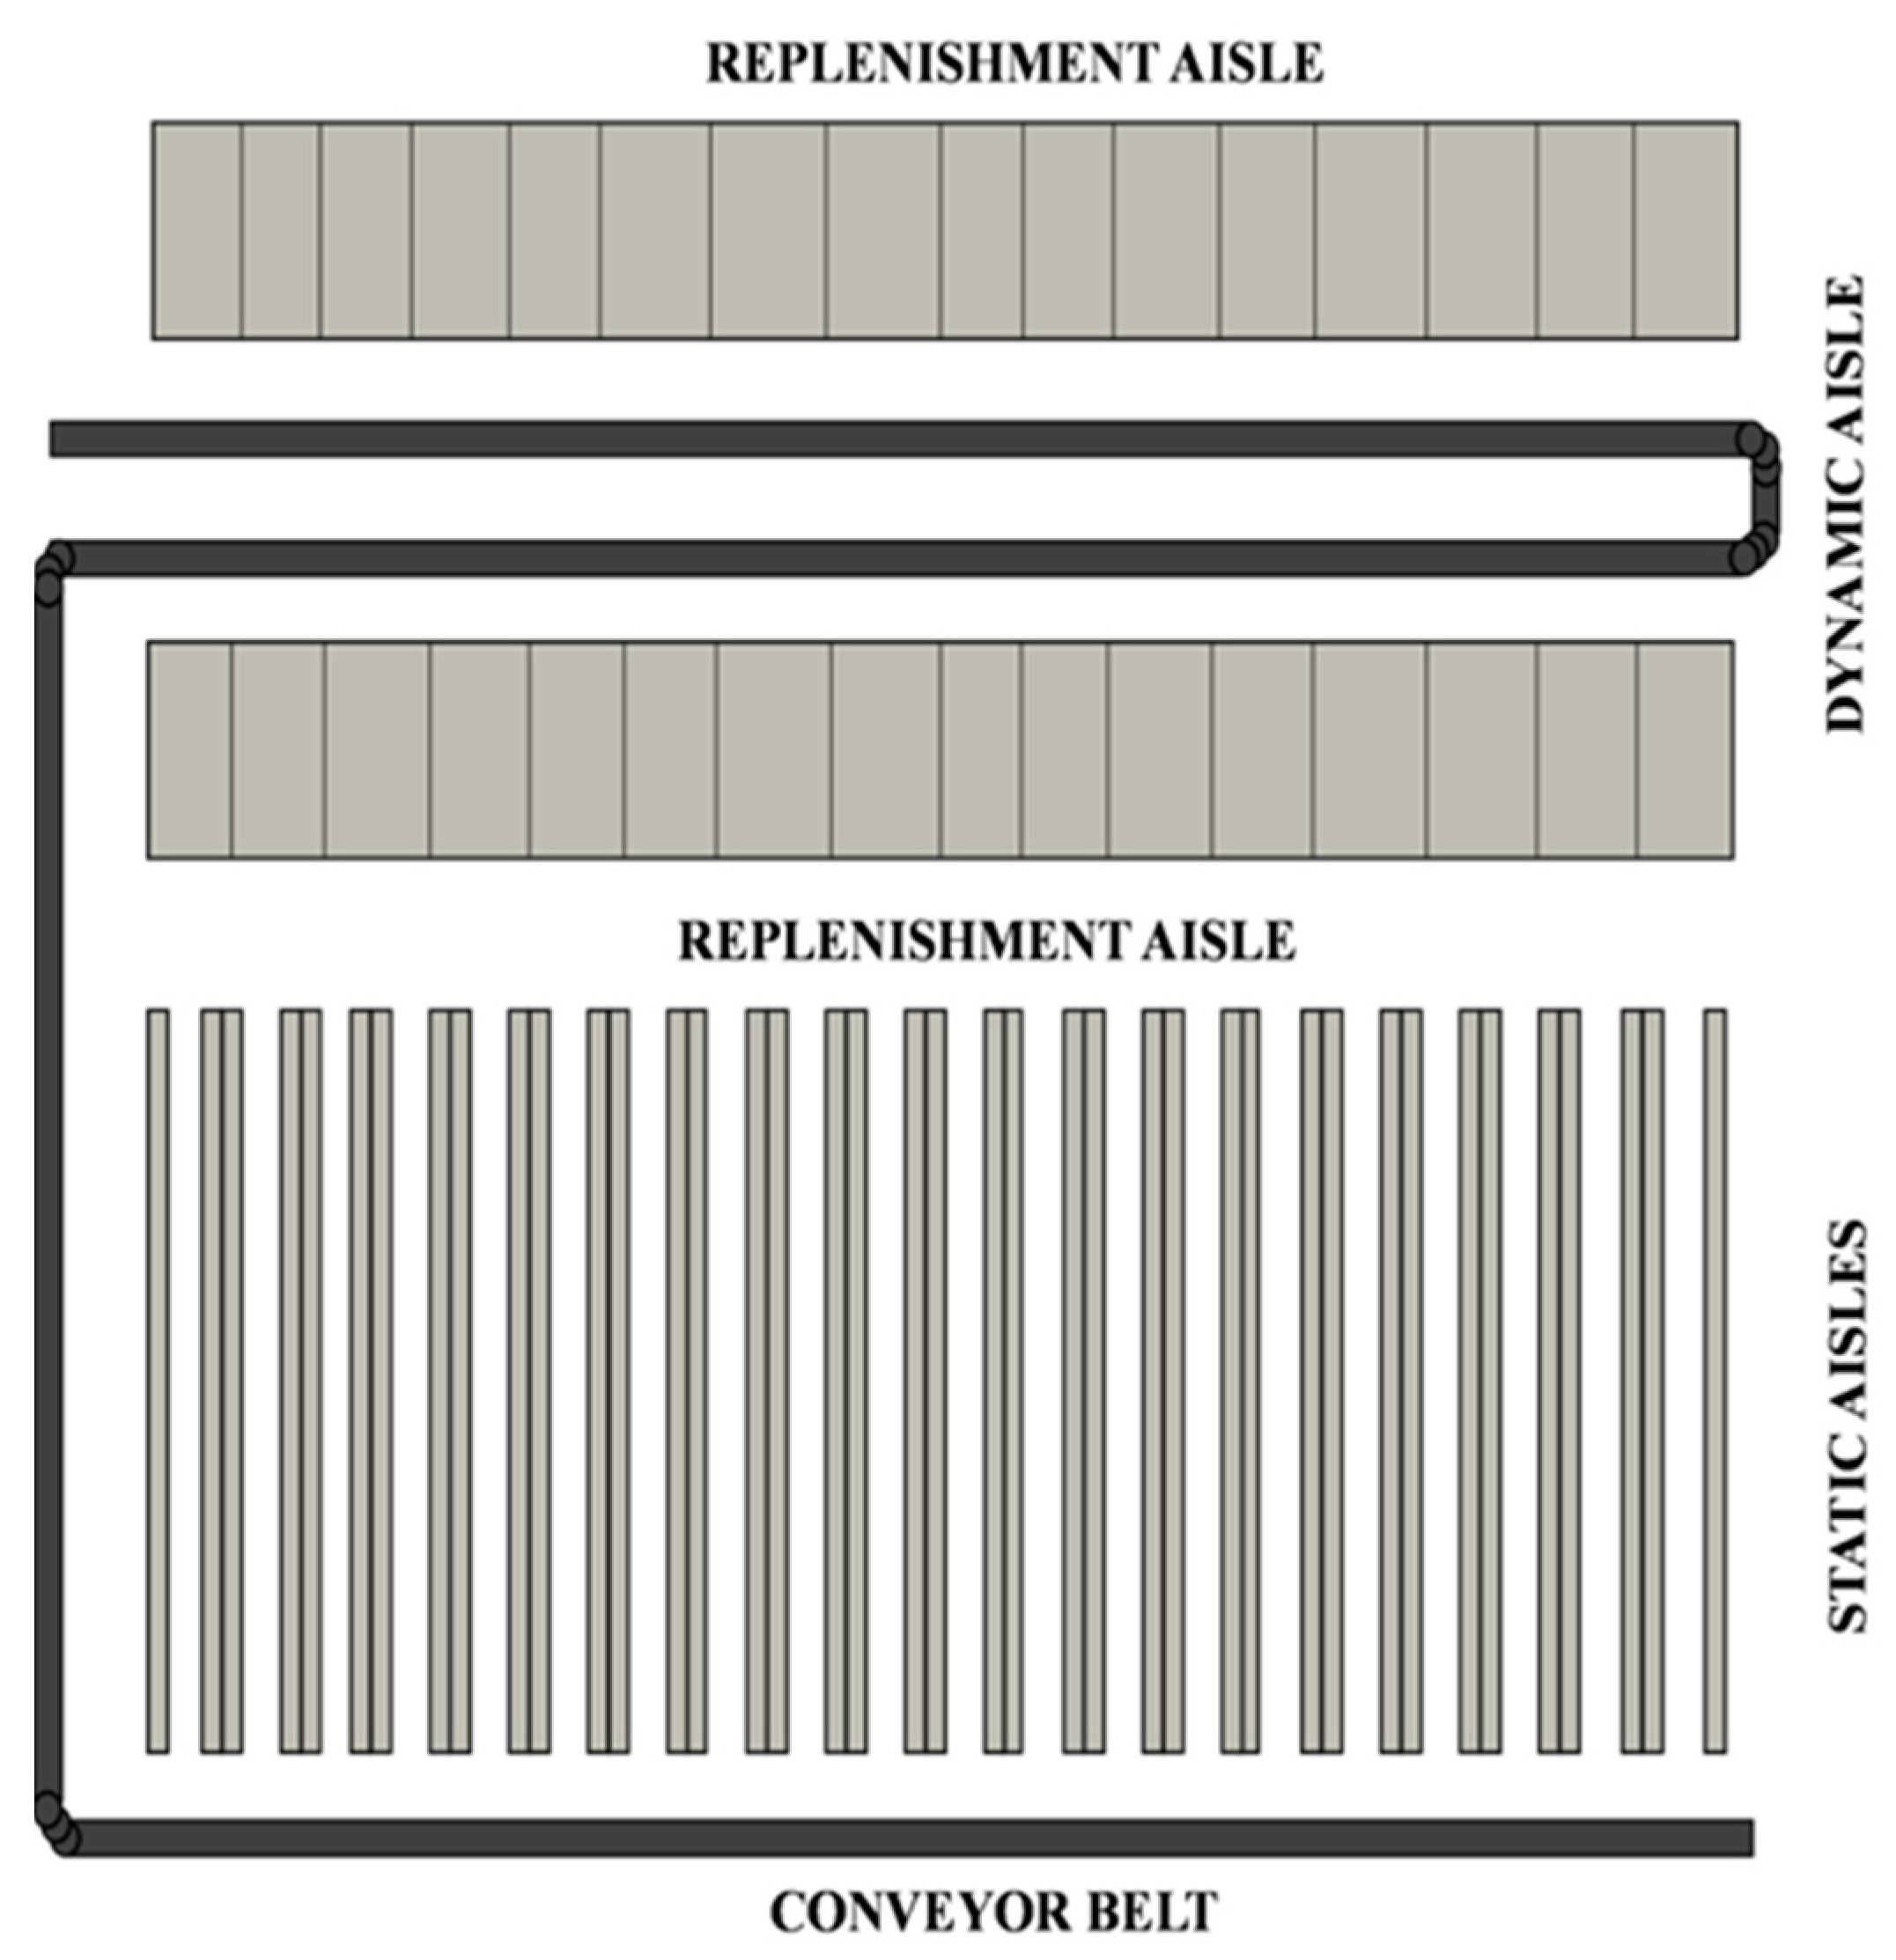
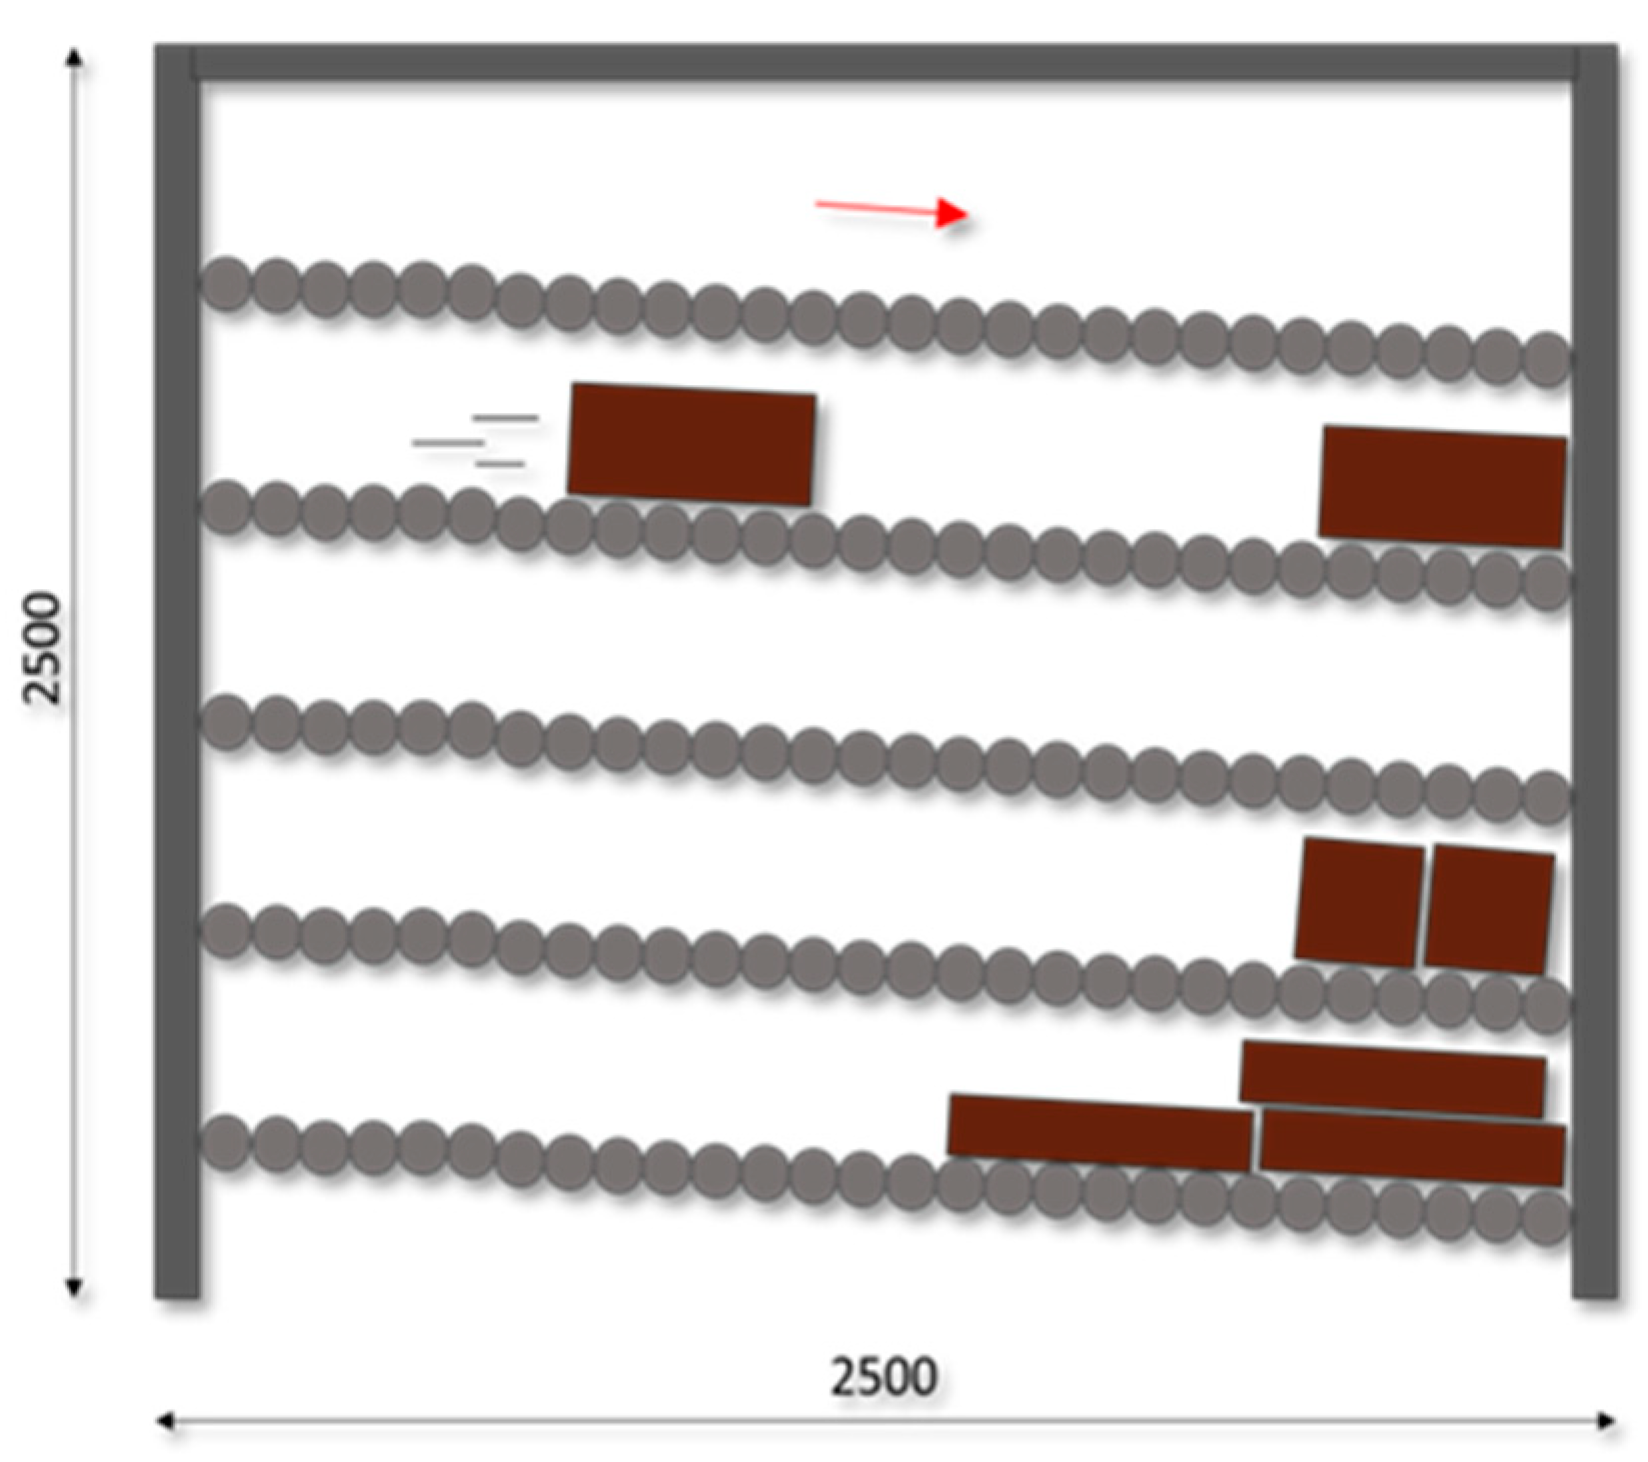
The same layout design policy was also applied for dynamic slots, where the only ergonomic factor examined is the rack height since walking is negligible in this case, as stated in Section 3. However, that configuration is out of scope for this study and is only mentioned to support the final findings that incorporate products stored in that area.
Next, new names have to be assigned to the altered slot layout. To that end, an 8-number code is used, notated as
A A   B B   C C   D D
The first two numbers represent the number of the aisle, while the second two define the number of the bay. Note that the value BB can take values between 1 and 10, since there are 10 bays per aisle and the sequence is diagonal, with Bay 1 being the first bay on the left side of the aisle, Bay 2 the first bay on the right side, Bay 3 the second bay on the left side and so on. CC represents the number of the rack, starting from the ground floor, and can receive values between 1 and 5. Finally, 
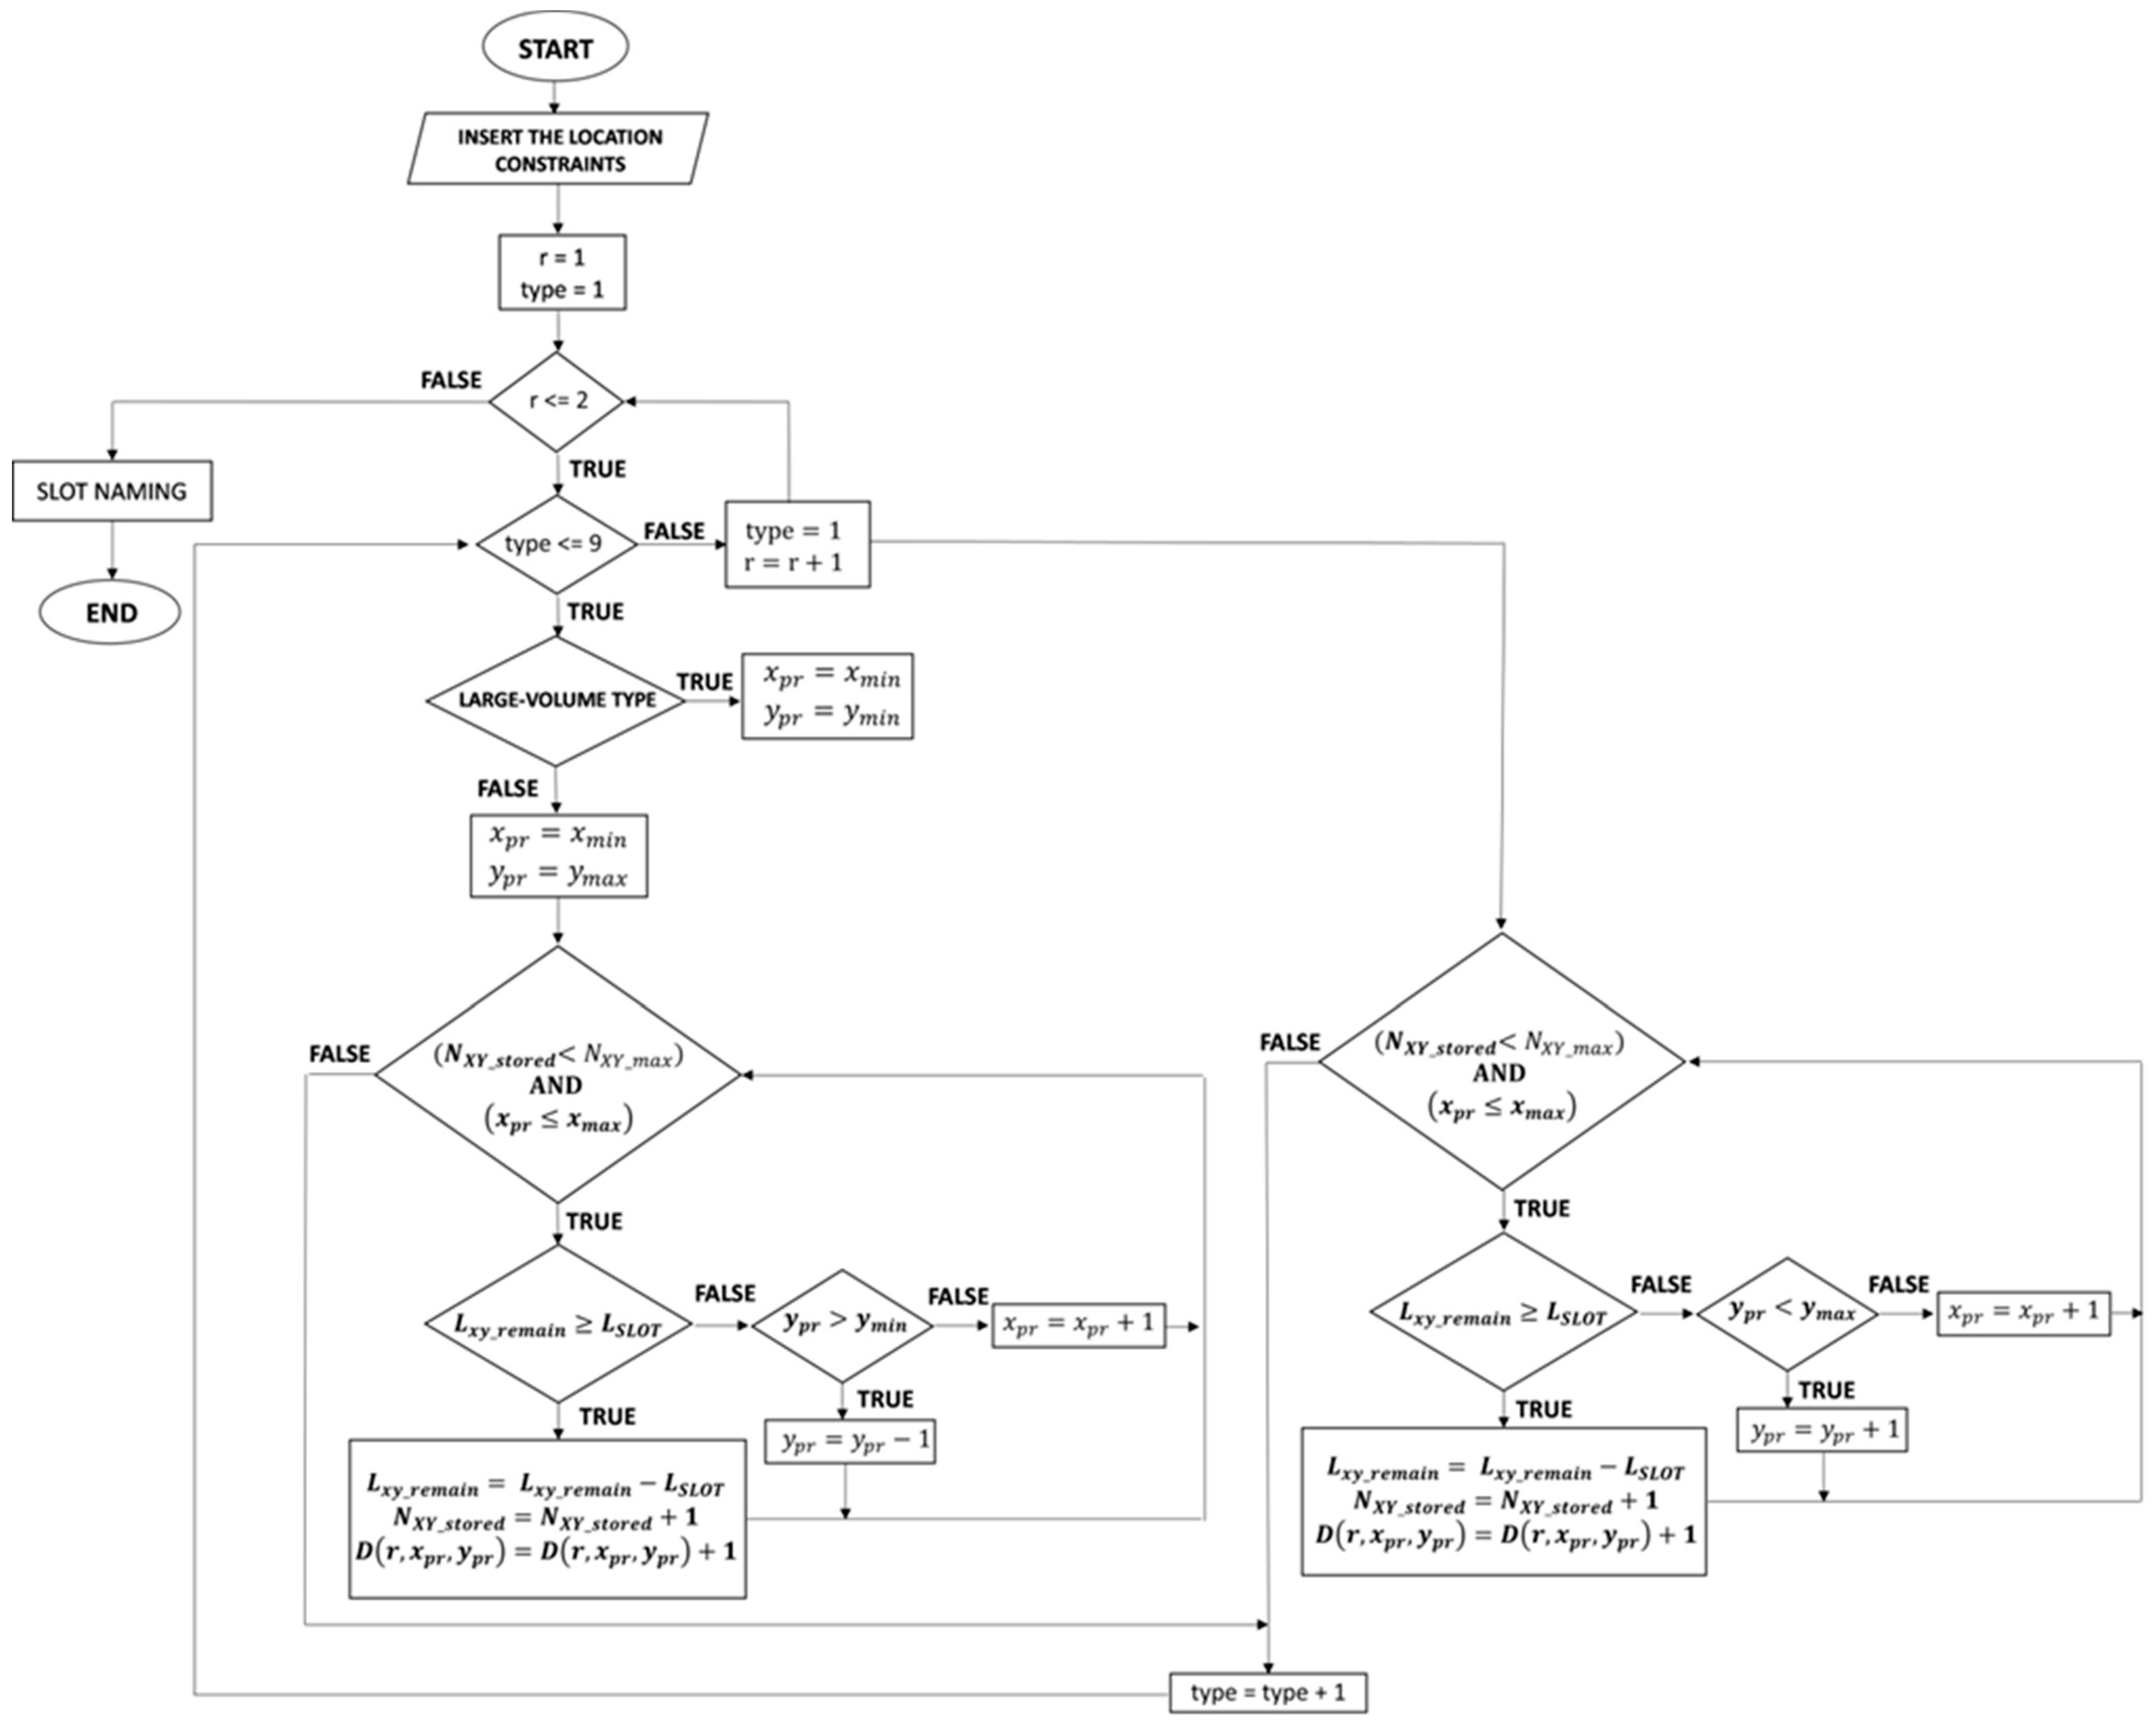
DD is a counter of the consecutive slots in each rack, starting from the point closest to the depot. The layout algorithm is demonstrated in the flowchart presented in Figure 6.

4.6. Optimal Storage Location Assignment

Following the layout redesign, products have to be assigned to their optimal locations in order to minimize OP time, improve resource allocation, and mitigate the intensity of physical workload. However, several factors require further examination, as explained below:
  • The slot type, which is defined by product popularity class and the size required to accommodate them.
  • The weight of storage units, which is an extremely important factor, since products with unit weight above 10 kg should not be assigned to racks higher than the 3rd one.
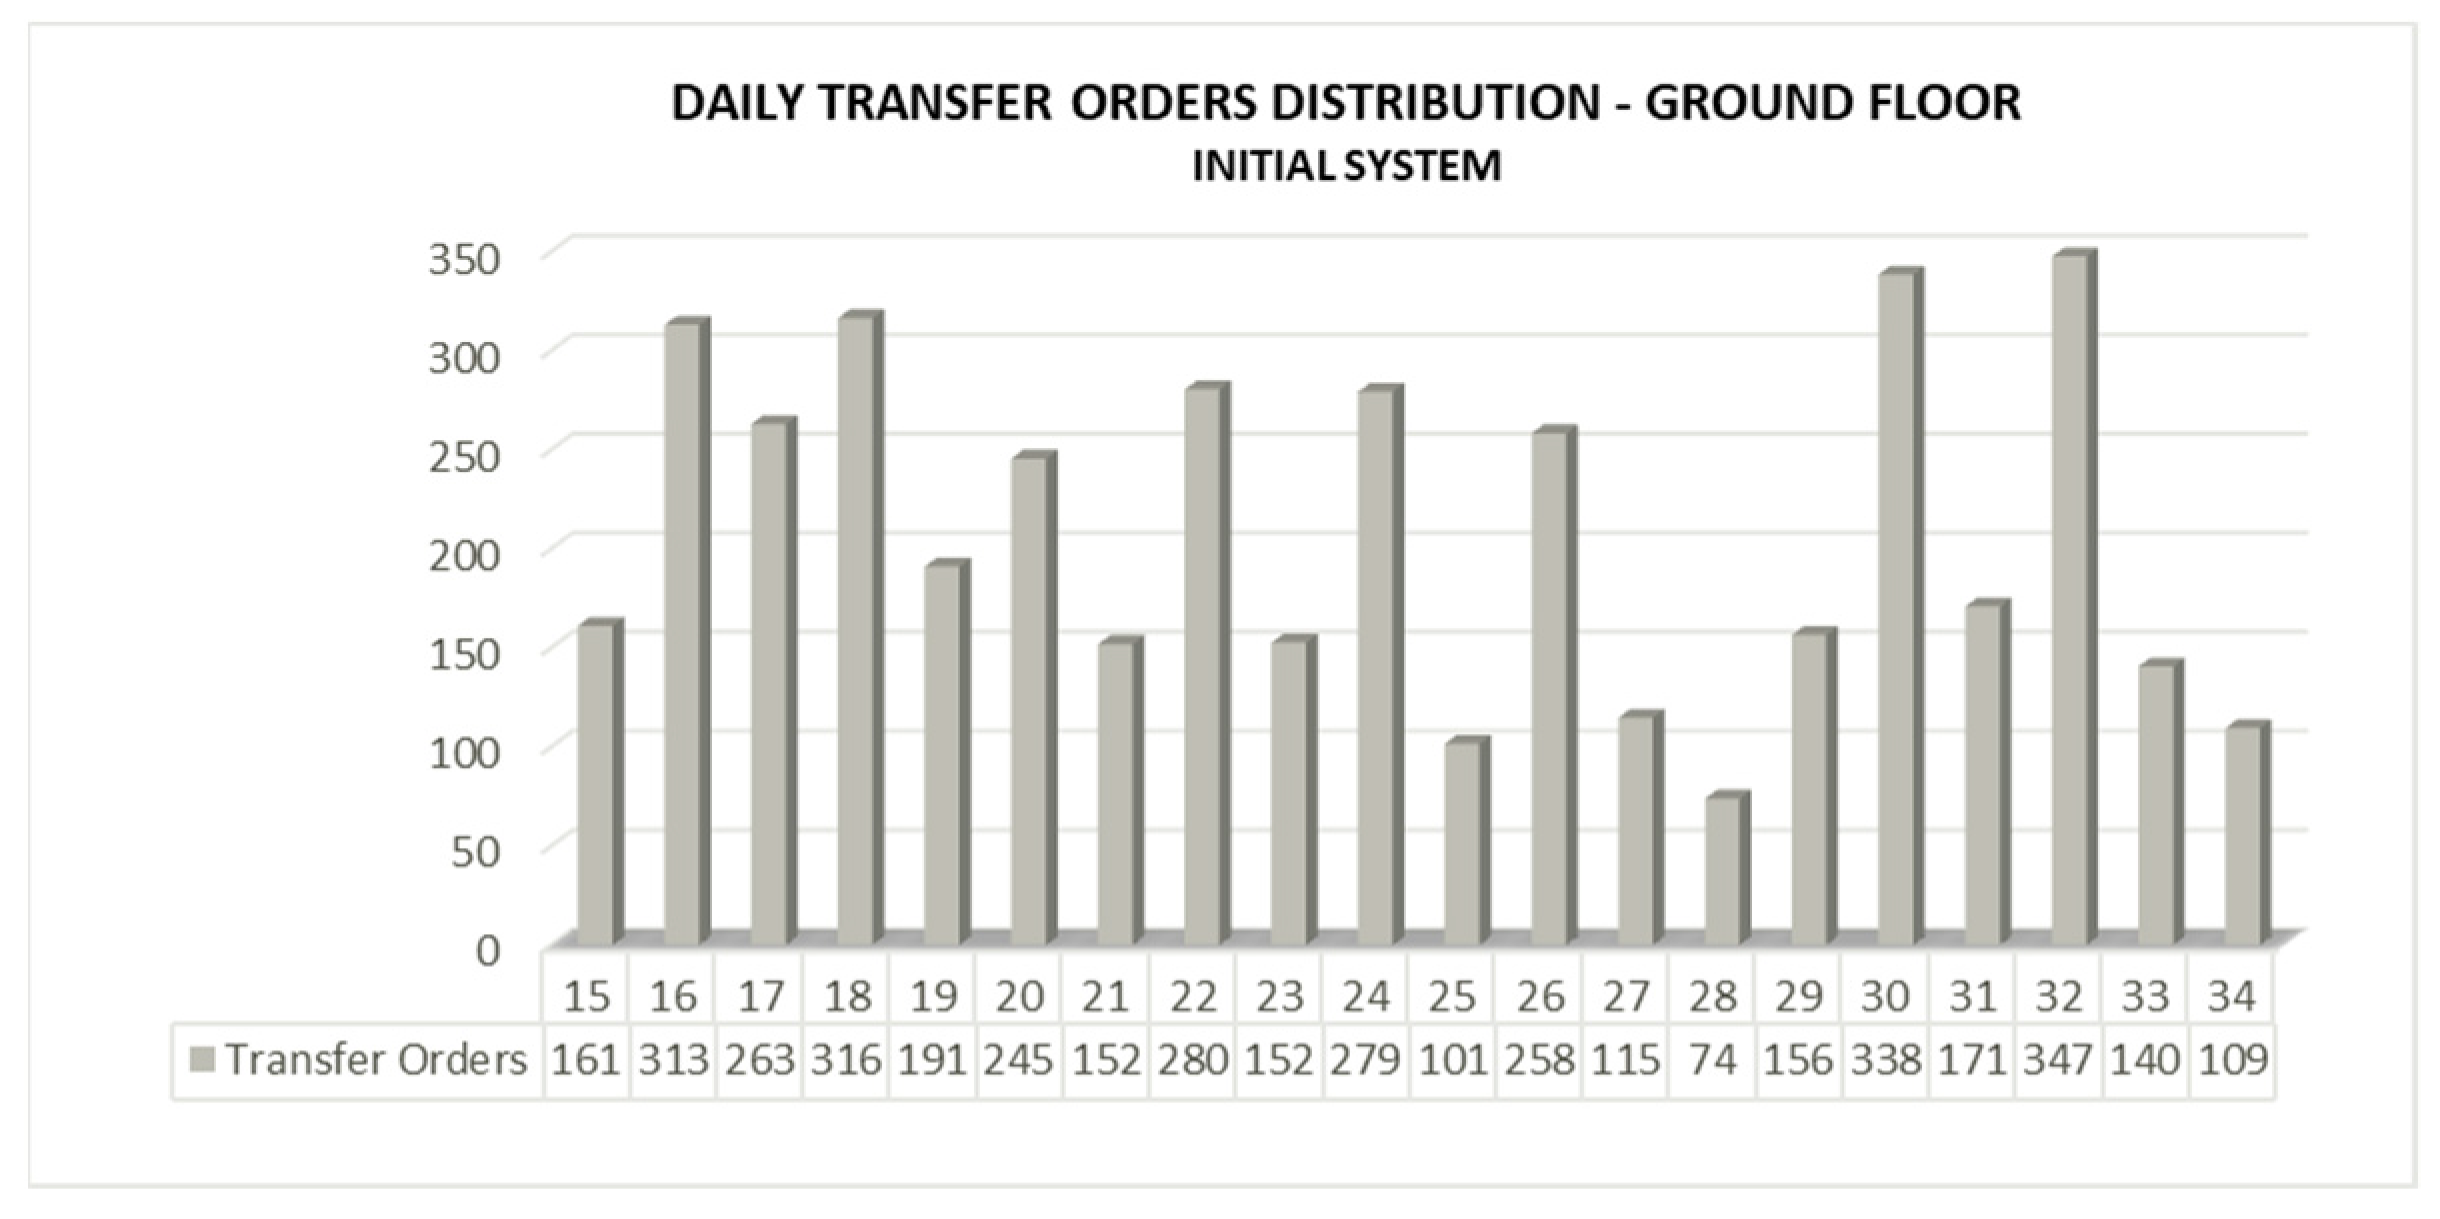
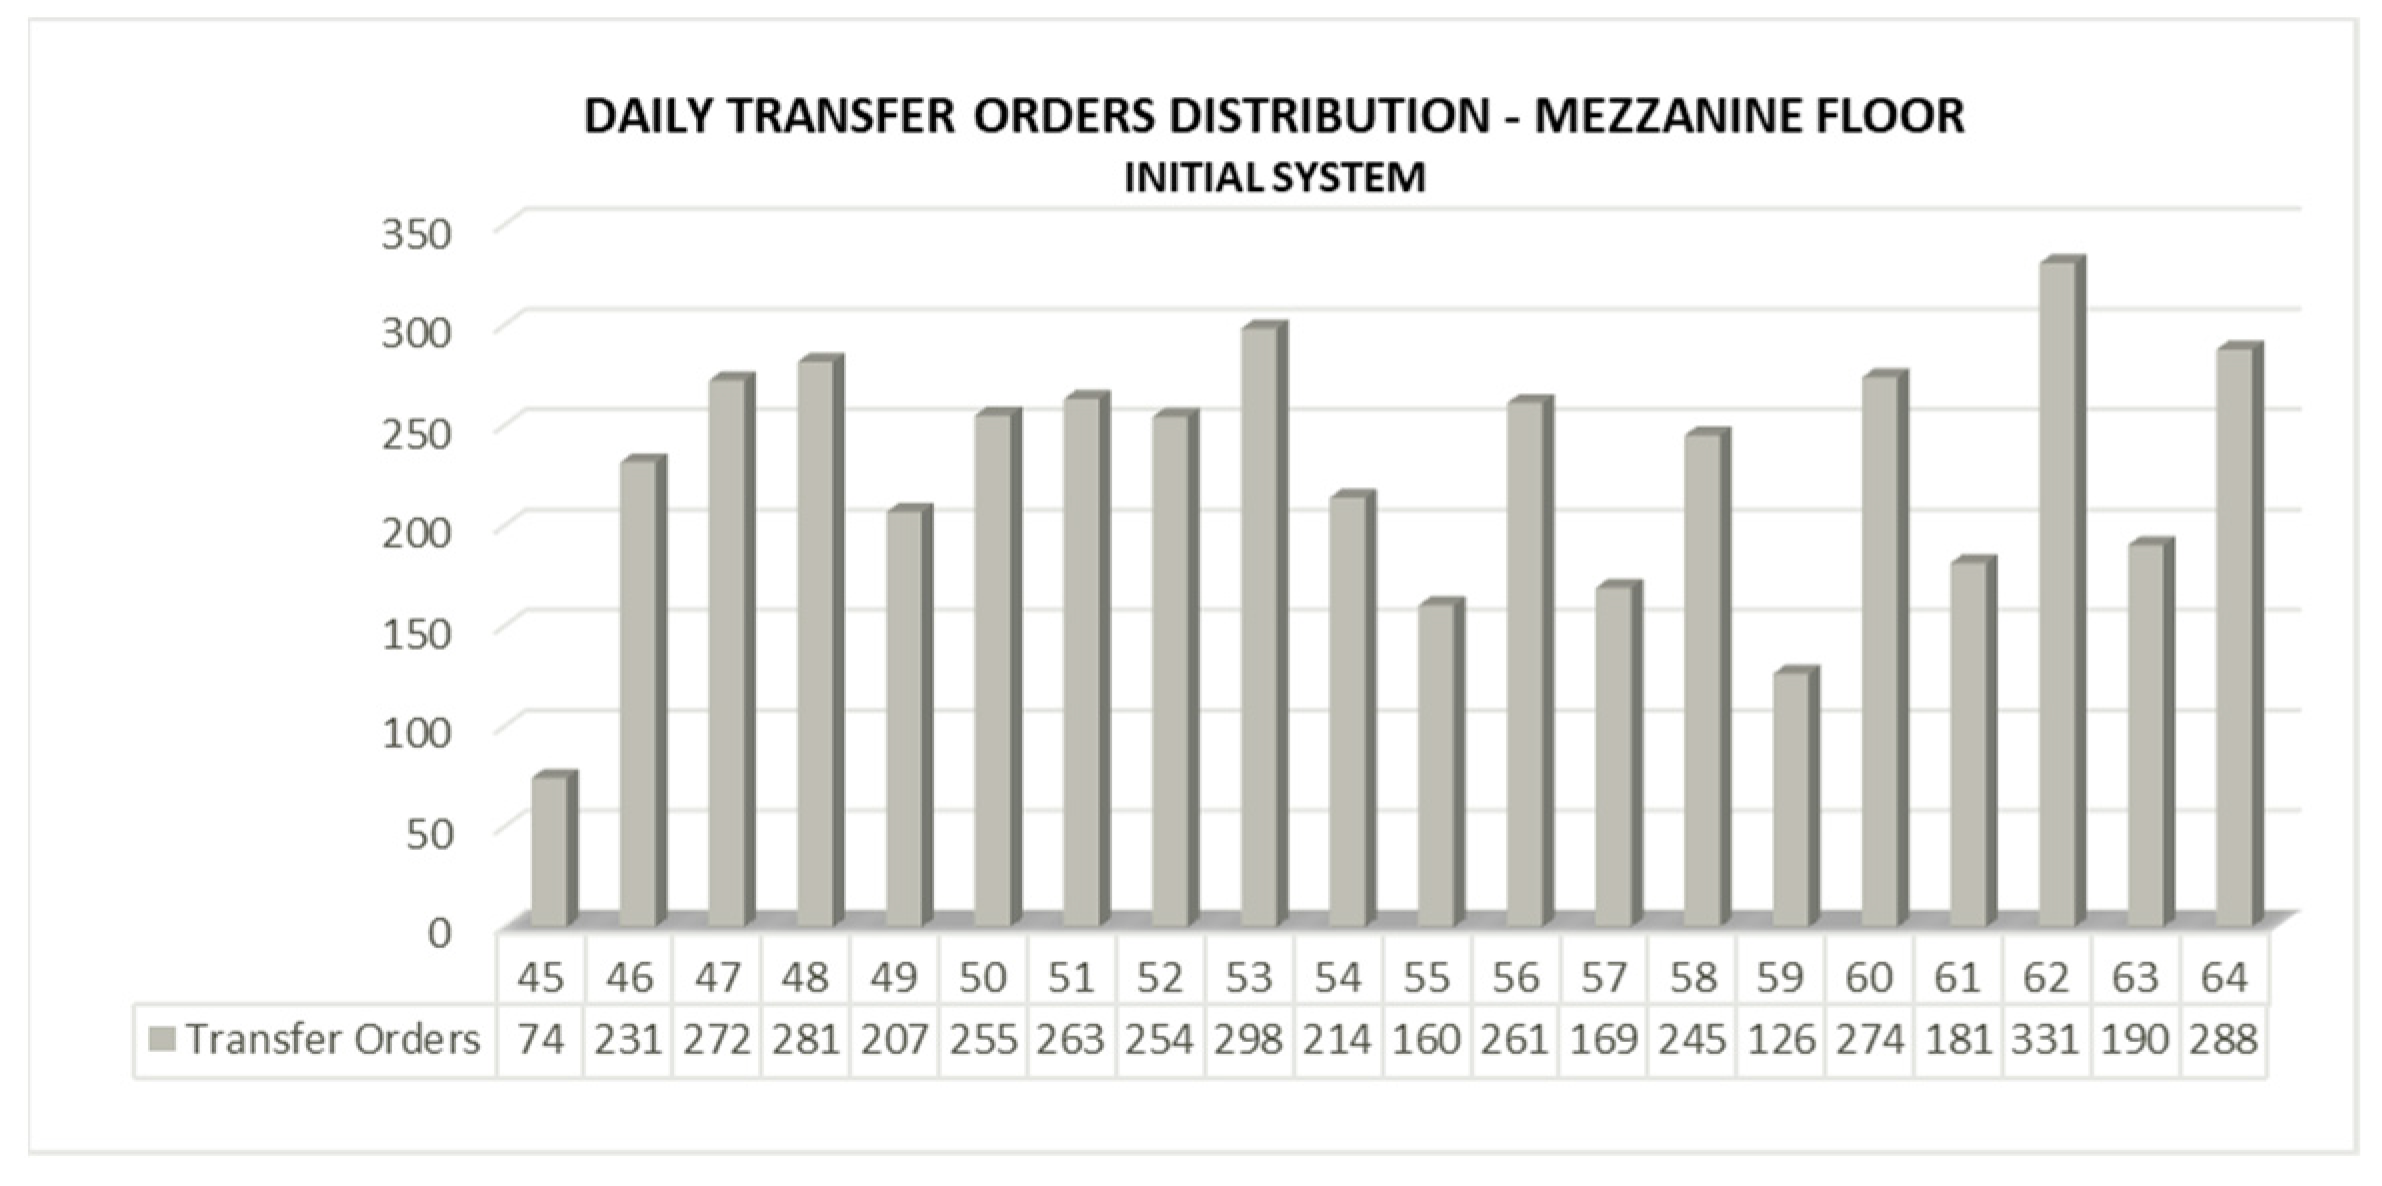
  • Equal allocation of workload and transfer orders among aisles, with to the aim of preventing picker collision.
  • The initial storage aisle of each product is the first to be examined, so that the time and movements needed for transferring the products to their new locations are limited to the bare minimum.
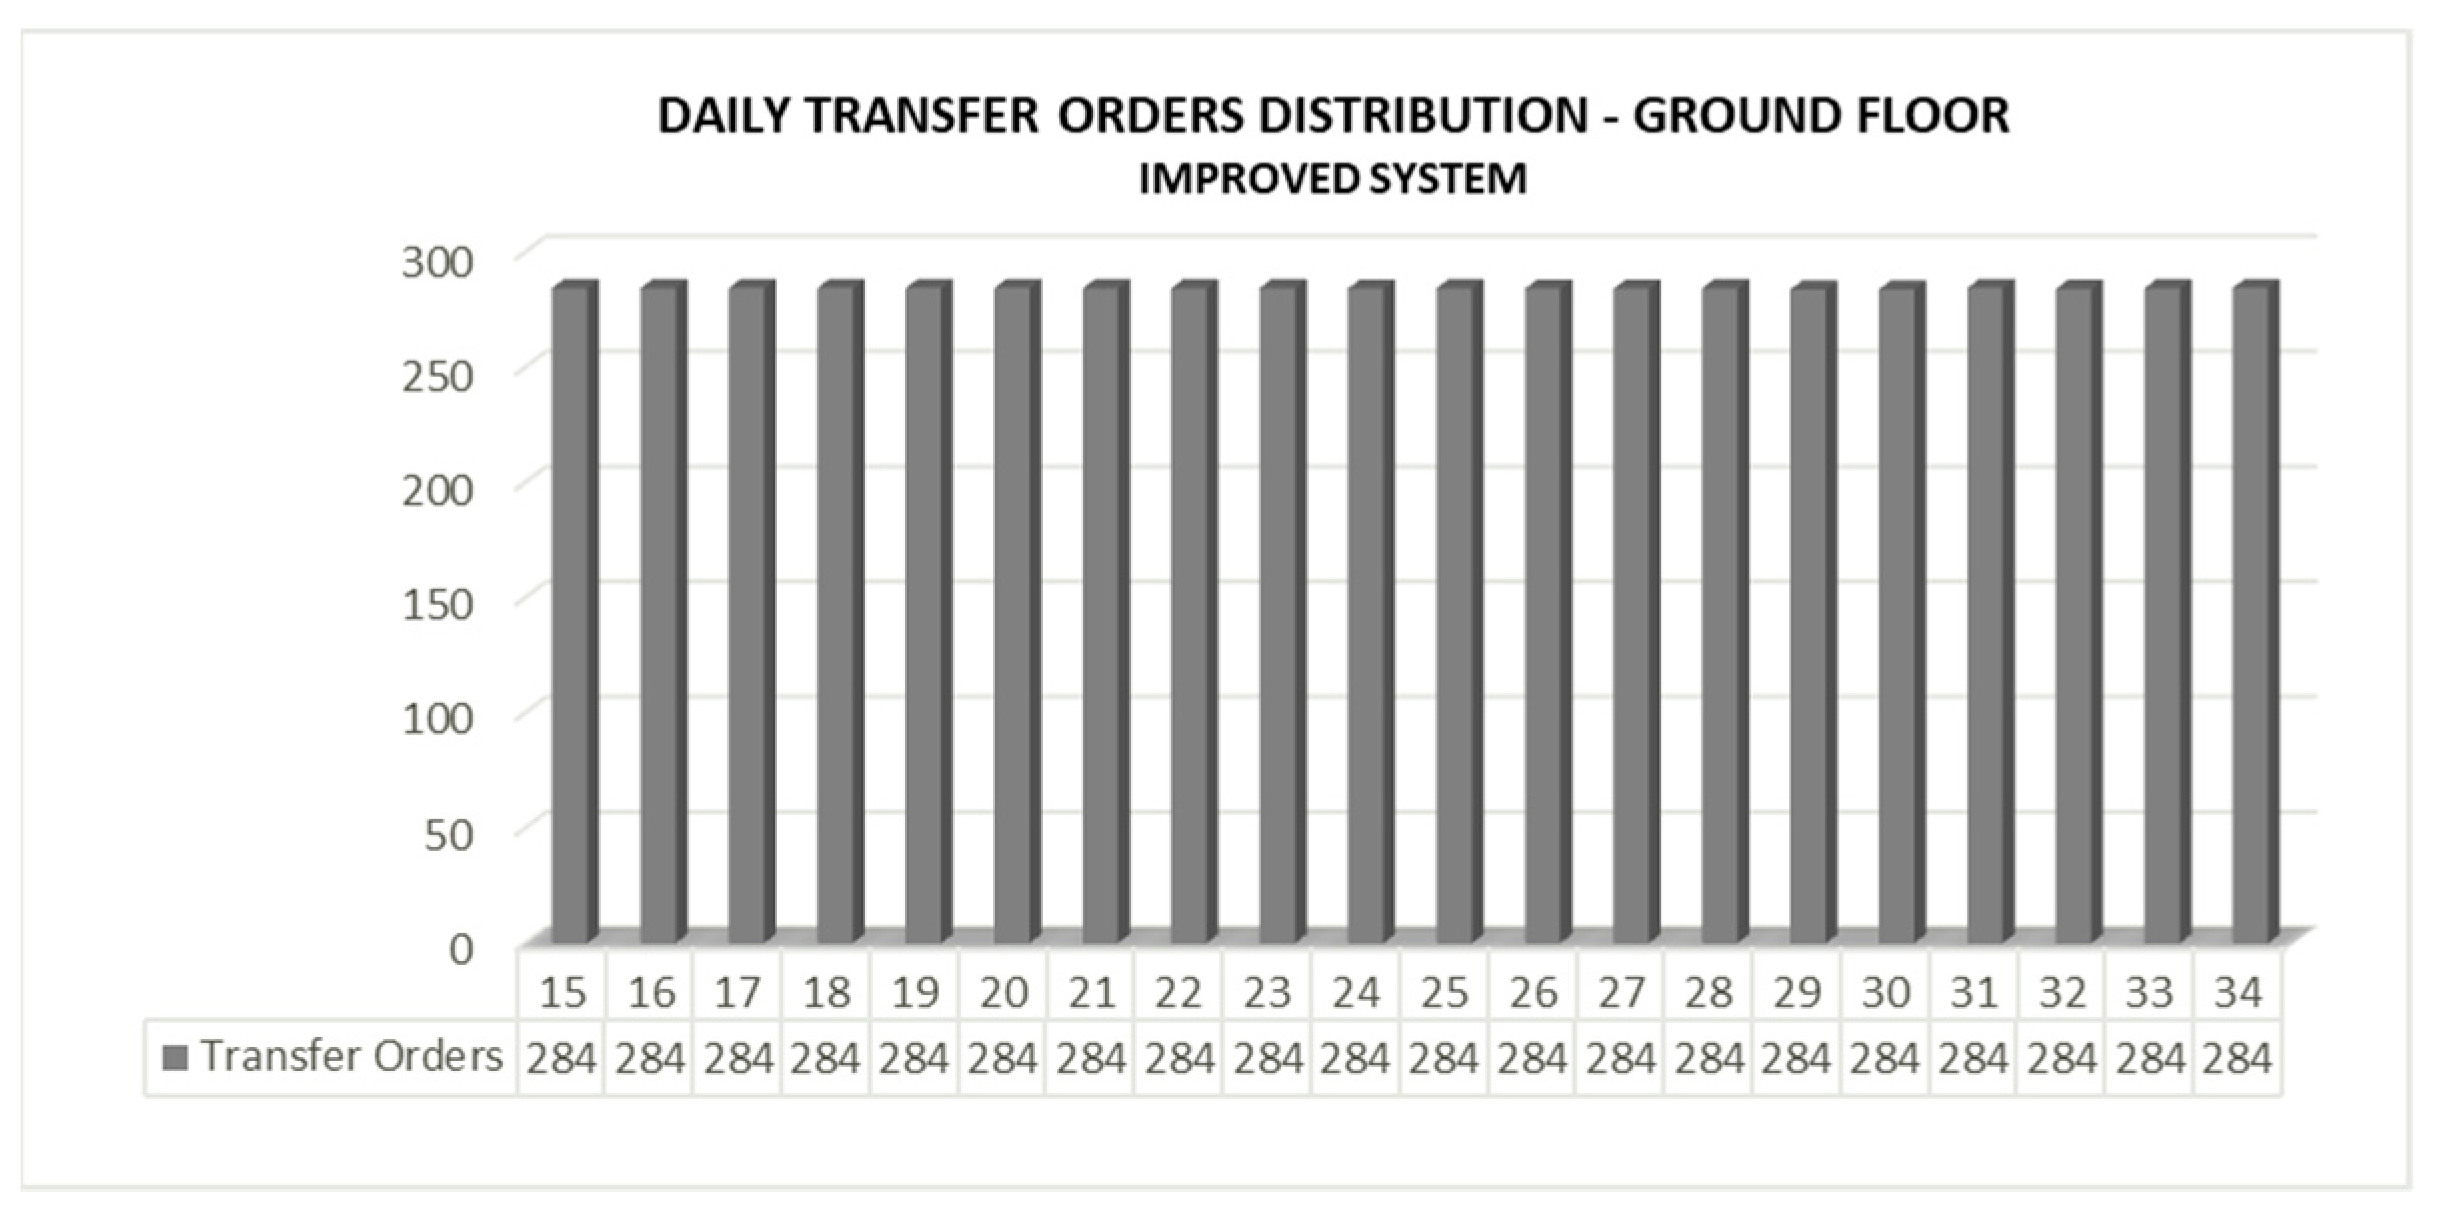
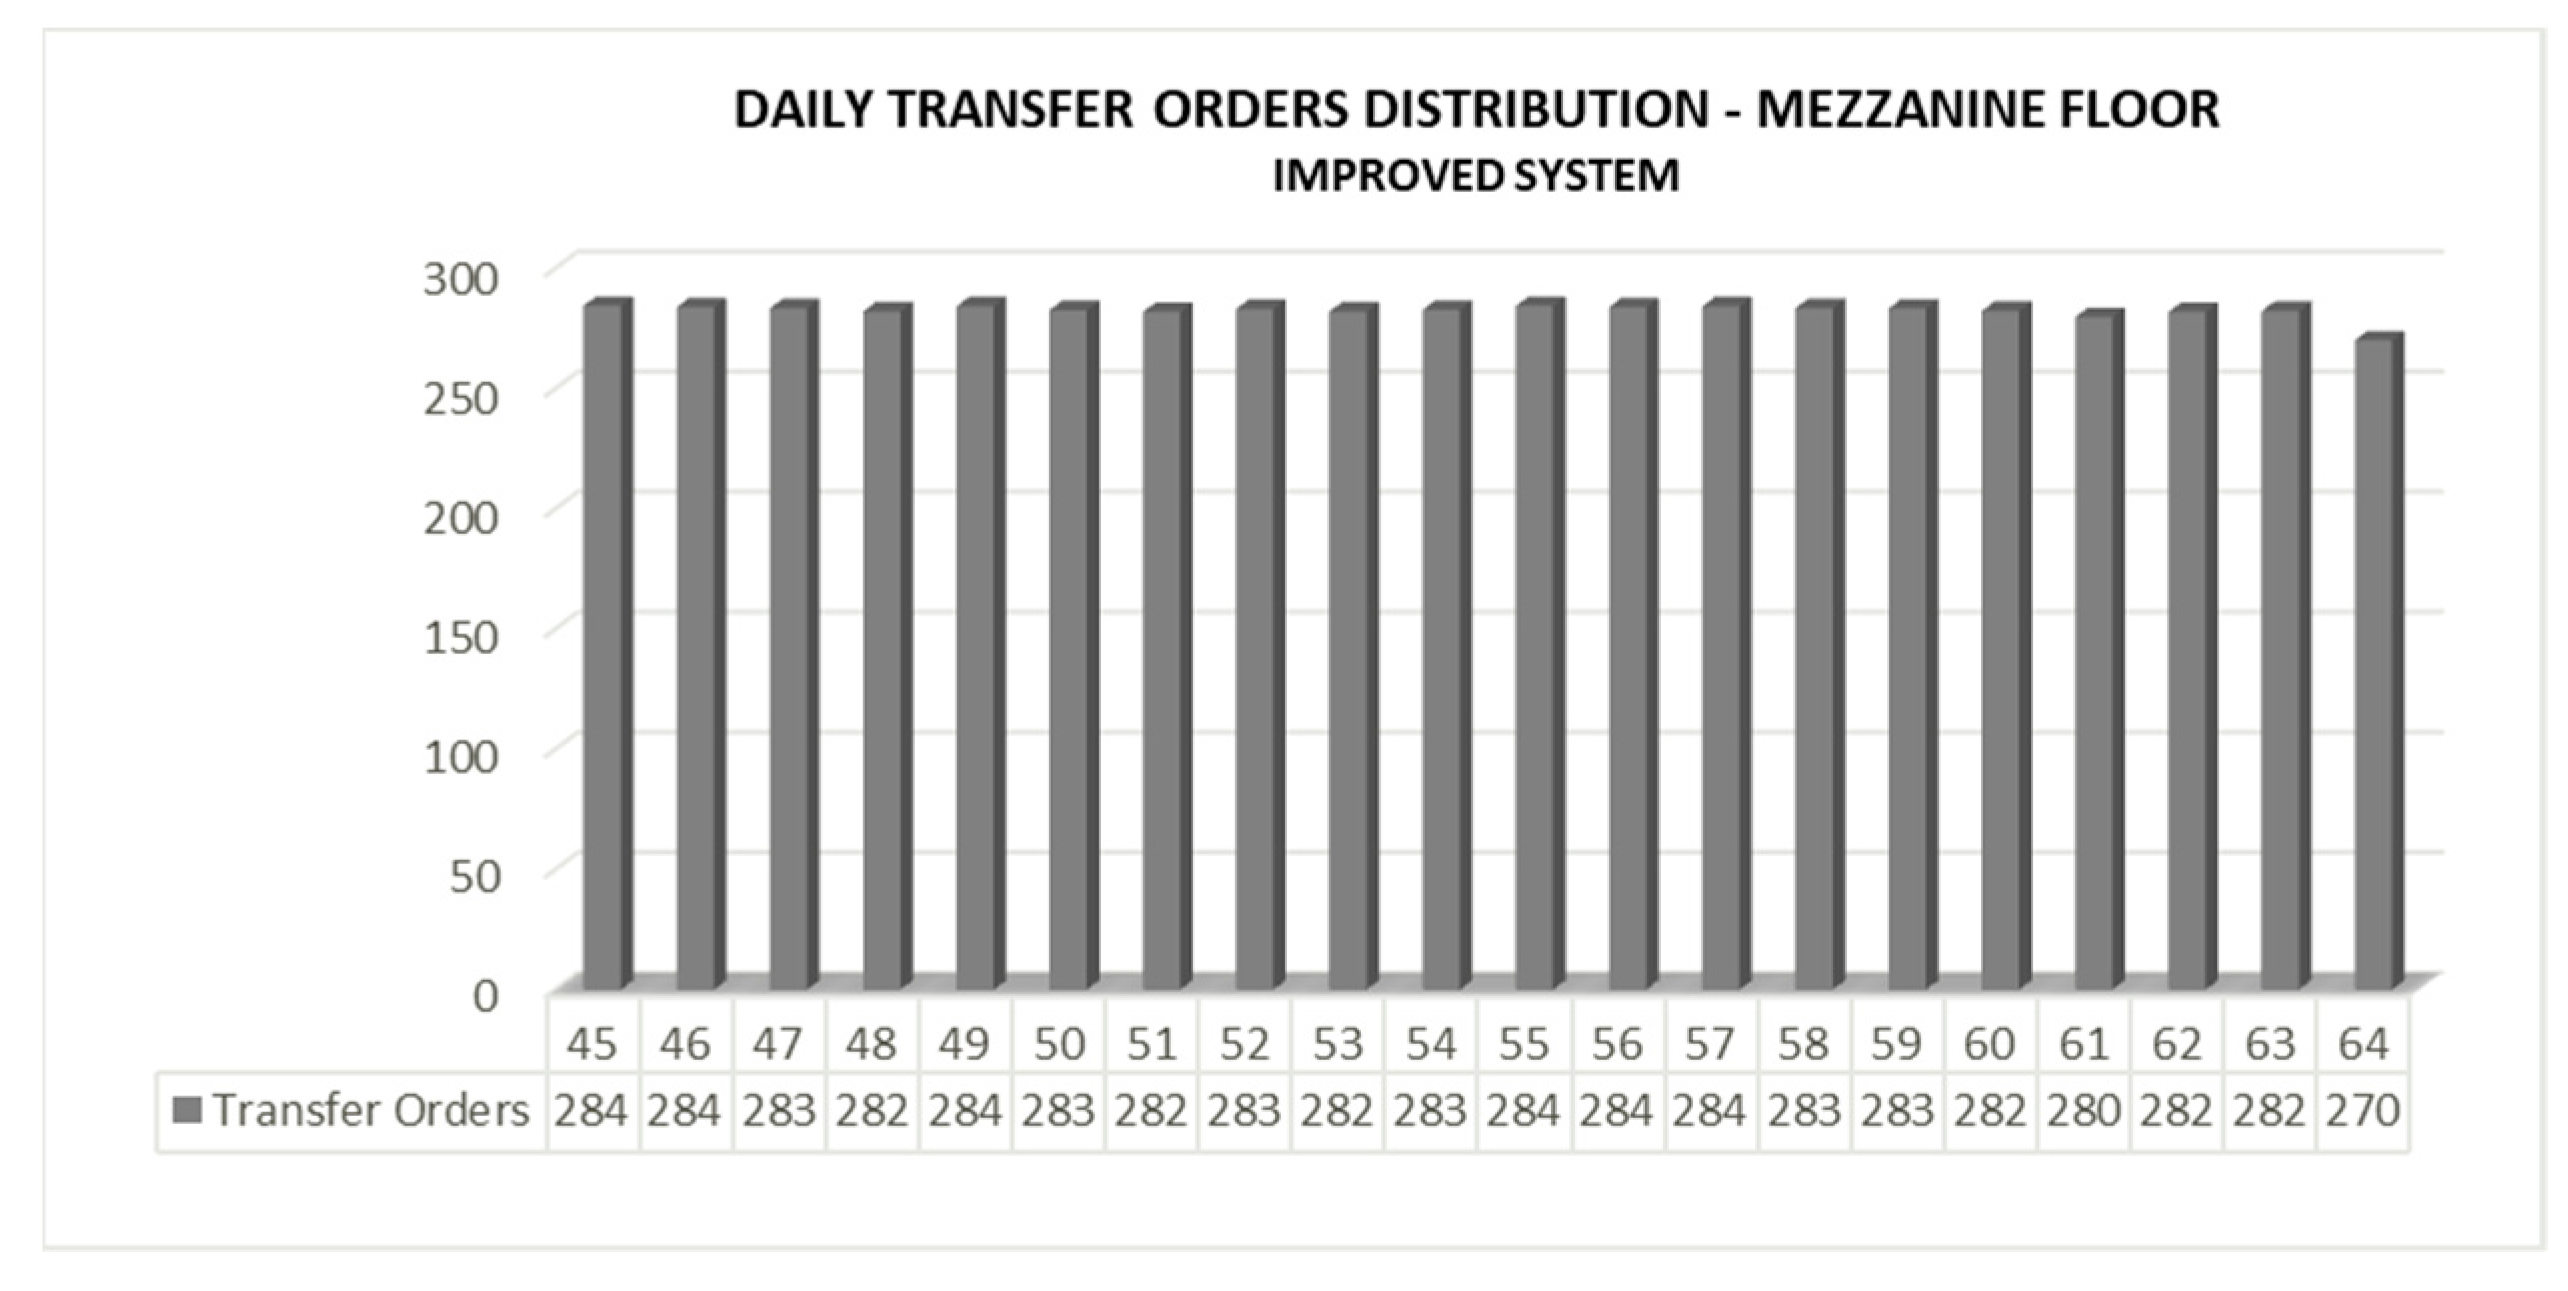
Knowing the daily turnover value of 5842 SKUs, the total daily orders can be easily calculated and divided equally among the 40 aisles, considering a maximum margin of error of 1.26%, found after trials. The maximum transfer orders per aisle are therefore defined according to the following equation:
Max   Transfer   Orders   per   Aisle   ( T max ) = 1 5842 Turnover   Product   i 40 ( 1 + 0.0126 )
Applying a random order of the given SKUs, the slot type required for the first product in line, its initial aisle, and its daily turnover are provided as inputs in the algorithm. Subsequently, the availability of the demanded slot type is examined for the initial aisle, followed by checking whether the total transfer orders of the aisle, including the turnover of the product to be assigned there, exceed the maximum limit or not. After examining these conditions, all slots are sequentially examined, starting from the first slot of Rack 1 in Bay 1, until an empty slot of the demanded type is found whereupon the product is assigned and the available number of its slot type in this specific aisle is reduced by one and registered as “full” in the system. This way, double entries are prevented and only empty slots are checked.
However, if the transfer orders of an aisle exceed the maximum limit (Equation (9)) or there is no empty slot of the demanded type, then the next or previous closest aisle of the same mezzanine floor is examined. This process continues until the product is successfully assigned to a location. After completing the loop, the next SKU in line is examined.

4.7. OP Difficulty Ranking System

Considering that ergonomics is hard to quantify, the authors suggest that in order to compare the initial and improved layout with respect to this metric, the difficulty of OP should be measured. In this vein, an innovative OP difficulty ranking system was proposed, according to which, the difficulty of handling each product is rated based on its daily transfer orders, rack, bay and weight (Table 6), as follows.
  Difficulty   Rate i = ( TO i ) [ ( D B i ) + ( D B i ) ( W U i ) ( AU i ) + ( D R i ) + ( D R i ) ( W b i ) ]
AU i = d i TO i
According to Equation (10), there are several factors impacting the difficulty in product handling. First, a “Bay Difficulty Rate” ranking system is defined (Table 7, since the location of bays in a picking area determines how difficult it will be for a picker to walk to a slot and back to the depot, while carrying the average number of units of product i retrieved per transfer order. Likewise, a “Rack Difficulty Rate” ranking system is defined (Table 8), taking into consideration the effort required to retrieve a product from a particular rack based on its storage box weight. Box handling might include replenishing, shifting, opening of cartons, moving to reach, and count products etc. Daily transfer orders of the product under examination are also included in this equation. This is essential, because the more repetitive a task is, the more difficult it becomes. Thus, the bigger the turnover, the more times a picker has to handle a particular SKU and as a consequence, the greater his/her physical fatigue will be.
As depicted, the racks have been rated according to the ergonomic constraints presented in Section 4.4, starting from a minimum value of 1 for the 3rd rack to a maximum of 5 for the 5th one. As far as the bay difficulty rating values go, it was decided by the authors for them to be exactly half of the respective rack difficulty rating values, since according to the existing literature on this topic [58], walking is the least intense activity a picker is required to perform. Hence, the closer the bay is to the deposition point, the lower the difficulty rate, starting from 0.5 for the 1st bay and reaching up to 2.5 for the 5th one.
For the SKUs stored in dynamic slots, a different formula was developed based on the same variables and rating system as Equation (10). Again, for the reasons mentioned above, only the ergonomics pertinent to racks are considered. Thus, Equation (10) is transformed into
Difficulty   Rate i = ( TO i ) [ ( D R i ) + ( D R i ) ( W b i ) ]
Considering Equations (10) and (12), the “Total Difficulty Rate” is defined as
Total   Difficulty   Rate = 1 5842 Difficulty   Rate i    

5. Results

Following the analysis presented in Section 4.2, the first metric to be examined is the categorization of products into the three classes based on their daily transfer orders. Therefore, class “A” accounts for 16% of the total SKUs and 55% of the total daily transfers. Correspondingly, the percentages referring to class “B” amount to 31% and 33%, while class “C” percentages are complementary, as depicted in Figure 7 and Figure 8.
Considering the constraints presented in Section 4.4 and the layout algorithm for developing an “ideal aisle” described in Section 4.5, the resulting storage layout is demonstrated below.
As can be clearly noticed, the produced layout, which can be rightfully described as a flame-shape, has each class encircled by the next one. Figure 9 represents the left side of the “ideal aisle”, as perceived by a picker standing between the two sides of racks. In this case, the conveyor is located at his/her left side. Respectively, Figure 10 illustrates the right side of the “ideal aisle”. With respect to the ergonomics constraints, A-class slots are located only in the 2nd and 3rd rack, occupying space up to the 2nd bay. It is worth mentioning that even though “A” slots in Bay 2 are not located right next to the depot, their rack level is significantly more ergonomic than the 1st or 4th rack of Bay 1, where they would be placed instead, according to the traditional strategy (Figure 5). “B” slots are assigned around “A” slots starting from Bay 1, where they occupy moderately ergonomic racks, and progressing up to Bay 3, where they are spread across all allowed racks. “C” slots can be found in any bay or rack, even next to the conveyor belt, at the least ergonomic height, i.e., the 5th rack. This way, the common perception which suggests that fast-moving products should always be placed near the depot and slow-moving ones at the back of the aisle, can be brought down, as it only considers travel distance while overlooking the importance of retrieving effort and physical fatigue. Finally, it is important to highlight that under no circumstances can large volume slots (2S) exceed the 3rd rack, as they can potentially contain heavy and bulky products.
This placement not only decreases picking effort, from an ergonomic point of view, but it also reduces total picking time since pickers can perform repetitive tasks faster and more efficiently throughout their daily work shift. Following the implementation of the proposed storage layout, the company’s WMS reported a notable productivity growth by 14.9%. In particular, the transfer orders performed by a picker in one hour increased from 94 to 108.
Considering the distribution of transfer orders among the aisles, the initial system presented major discrepancies, with total daily orders fluctuating between 70 and 350 (Figure 11 and Figure 12). These conditions created considerable operational problems in several aisles, where picker congestion obstructed material flow, leading to surges in picking time and effort. By applying the optimal storage location assignment strategy presented in Section 4.6, products were allocated not only based on their slot type but also the maximum number of orders allowed per aisle, hence, resulting in equally distributed workload (Figure 13 and Figure 14). It is worth noting that the increase in total orders, which can be observed in the improved system, is completely justified, since the products transferred from dynamic to static slots are also taken into consideration as a consequence of the slotting redesign.
Additionally, taking into consideration the aisle where each SKU was initially located, the needed transfers of products to new aisles were limited down to the bare minimum, as the primary aisle was the first to be examined for slot availability. Only 18% of products were assigned to new aisles, while only 1% had to change floors. Lastly, 8% of all processed SKUs were transferred from dynamic to static slots, 5% from static to dynamic ones and, hence, 87% of the products maintained their initial storage area.
Finally, as far as the ergonomics improvement goes, after comparing the “Difficulty Rate” of OP for the initial and improved system, it was observed that it plunged by 31% (Table 9).

6. Conclusions

OP is a labor intensive activity which is still conducted manually in the vast majority of contemporary warehouses. Research has been focusing on decreasing OP time by minimizing travel distance in order to reduce OP expenses, which comprise a substantial part of a warehouse’s overall operating costs. Although the need of integrating human factors into design models has been challenging scholars for many years, only a few academic studies focus on enhancing OP performance by alleviating workers’ physical fatigue. To that end, this paper aims to address the aforementioned research gap by introducing a layout design and storage assignment model for OP with respect to ergonomic criteria. The proposed method was implemented in the distribution center of a major retail corporation which offers more than 50,000 different SKUs in total. Approximately 6000 SKUs were examined in the current study, which were divided into nine storage types based on their popularity class, i.e., A, B, and C, by applying Pareto’s principal. The volume of each slot was determined based on the retailer’s decision to maintain adequate inventory levels for seven days, with no replenishment needs in the meantime. After categorizing products into classes, the layout design was developed to meet the system’s needs in terms of slot types, followed by products’ optimal assignment into slots based on their individual characteristics, i.e., daily transfer orders, demand, weight, and initial aisle while targeting equal workload distribution among aisles to avoid picker collision. Finally, by utilizing the proposed OP difficulty ranking system, the initial and improved storage layouts were compared. Based on the above, this case study introduces a new layout type, the flame-shape, according to which fast-moving products should be placed not only closer to the depot, compared to slow-moving ones, but also in efficient height levels that will not force pickers into strenuous and repetitive body movements. Vice versa, this new layout dictates that less popular goods are eligible for being assigned to slots right next to the depot, under the condition of being placed in less ergonomic racks. Following the proposed method’s implementation, a productivity rise to 14.9% was observed and equal distribution of transfer orders into aisles was achieved, with a maximum variation of 1.26%, as well as a decrease in difficulty levels by 31%.
It is beyond the shadow of a doubt that this study, in spite of its merits, has its fair share of limitations. First, the proposed method is customized based on the layout configuration, OP methods, capacity, and requirements of the particular distribution center. Thus, future research may extend its application in different storage configurations, covering broader product characteristics and dimensional restrictions. In this direction, the proposed algorithm could be adjusted accordingly to be able to take as input variables the aforementioned factors, which were constants in the current case, and, therefore, be used by any distribution center. Second, the difficulty ranking system, and, more precisely, the generated difficulty rates were defined empirically, through observation and interviews with pickers as well as academic sources. On those grounds, future studies could incorporate alternative methods for measuring physical effort, such as electromyography techniques monitoring muscular stress, the energy expenditure model proposed in [57], and devices recording heart rate or oxygen consumption. Last but not least, the correlation between SKUs could be considered in future works, for instance, by placing products that appear often in same orders near one another with the aim of maximizing OP efficiency.

Author Contributions

Conceptualization, V.K. and S.T.P.; methodology, V.K. and S.T.P.; formal analysis, V.K., S.T.P., G.P. and E.A.; writing—original draft preparation, V.K., S.T.P., G.P. and E.A.; writing—review and editing, V.K., S.T.P., G.P. and E.A.; supervision, S.T.P., G.P. and E.A.; All authors have read and agreed to the published version of the manuscript.

Funding

This research received no external funding.

Acknowledgments

The present work was supported by the European Union and Greek national funds through the Operational Program “Competitiveness, Entrepreneurship and Innovation” (EPAnEK), under the call “RESEARCH-CREATE-INNOVATE” (project code: Τ2ΕΔΚ-05051 & acronym: BLOCKFoodWaste).

Conflicts of Interest

The authors declare no conflict of interest.

References

  1. Ponis, S.T.; Plakas, G.; Agalianos, K.; Aretoulaki, E.; Gayialis, S.P.; Andrianopoulos, A. Augmented Reality and Gamification to Increase Productivity and Job Satisfaction in the Warehouse of the Future. Procedia Manuf. 2020, 51, 1621–1628. [Google Scholar] [CrossRef]
  2. Heizer, J.H.; Munson, C.; Render, B. Principles of Operations Management Sustainability and Supply Chain Management; Pearson: London, UK, 2017. [Google Scholar]
  3. Richards, G. Warehouse Management: A Complete Guide to Improving Efficiency and Minimizing Costs in the Modern Warehouse; Kogan Page Publishers: London, UK, 2017. [Google Scholar]
  4. de Koster, R.; Le-Duc, T.; Roodbergen, K.J. Design and Control of Warehouse Order Picking: A Literature Review. Eur. J. Oper. Res. 2007, 182, 481–501. [Google Scholar] [CrossRef]
  5. Napolitano, M. 2012 Warehouse/DC Operations Survey: Mixed Signals. Logist. Manag. 2002, 51, 54–63. [Google Scholar]
  6. Kudelska, I.; Pawłowski, G. Influence of Assortment Allocation Management in the Warehouse on the Human Workload. Cent. Eur. J. Oper. Res. 2020, 28, 779–795. [Google Scholar] [CrossRef] [Green Version]
  7. Frazelle, E. World-Class Warehousing and Material Handling, 1st ed.; McGraw-Hill Education: New York, NY, USA, 2001. [Google Scholar]
  8. Tompkins, J.A.; White, J.A.; Bozer, Y.A.; Tanchoco, J.M.A. Facilities Planning; John Wiley & Sons: Hoboken, NJ, USA, 2010. [Google Scholar]
  9. Battini, D.; Calzavara, M.; Persona, A.; Sgarbossa, F. A Comparative Analysis of Different Paperless Picking Systems. Ind. Manag. Data Syst. 2015, 115, 483–503. [Google Scholar] [CrossRef]
  10. Grosse, E.H.; Glock, C.H.; Jaber, M.Y.; Neumann, W.P. Incorporating Human Factors in Order Picking Planning Models: Framework and Research Opportunities. Int. J. Prod. Res. 2015, 53, 695–717. [Google Scholar] [CrossRef]
  11. Bright, A.G.; Ponis, S.T. Introducing Gamification in the AR-Enhanced Order Picking Process: A Proposed Approach. Logistics 2021, 5, 14. [Google Scholar] [CrossRef]
  12. Calzavara, M.; Glock, C.H.; Grosse, E.H.; Persona, A.; Sgarbossa, F. Analysis of Economic and Ergonomic Performance Measures of Different Rack Layouts in an Order Picking Warehouse. Comput. Ind. Eng. 2017, 111, 527–536. [Google Scholar] [CrossRef]
  13. Gawron, V.J.; French, J.; Funke, D. An Overview of Fatigue. In Stress, Workload, and Fatigue; CRC Press: Boca Raton, FL, USA, 2000. [Google Scholar]
  14. Rose, L.M.; Neumann, W.P.; Hägg, G.M.; Kenttä, G. Fatigue and Recovery during and after Static Loading. Ergonomics 2014, 57, 1696–1710. [Google Scholar] [CrossRef]
  15. Neumann, W.P.; Village, J. Ergonomics Action Research II: A Framework for Integrating HF into Work System Design. Ergonomics 2012, 55, 1140–1156. [Google Scholar] [CrossRef]
  16. Schneider, E.; Copsey, S.; Irastorza, X. OSH [Occupational Safety and Health] in Figures: Work-Related Musculoskeletal Disorders in the EU-Facts and Figures; Office for Official Publications of the European Communities: Luxembourg, 2010. [Google Scholar]
  17. Calzavara, M.; Persona, A.; Sgarbossa, F.; Visentin, V. A Device to Monitor Fatigue Level in Order-Picking. Ind. Manag. Data Syst. 2018, 118, 714–727. [Google Scholar] [CrossRef]
  18. Boudreau, J.; Hopp, W.; McClain, J.O.; Thomas, L.J. On the Interface Between Operations and Human Resources Management. Manuf. Serv. Oper. Manag. 2003, 5, 179–202. [Google Scholar] [CrossRef] [Green Version]
  19. Patrick Neumann, W.; Dul, J. Human Factors: Spanning the Gap between OM and HRM. Int. J. Oper. Prod. Manag. 2010, 30, 923–950. [Google Scholar] [CrossRef]
  20. Grosse, E.H.; Glock, C.H.; Neumann, W.P. Human Factors in Order Picking: A Content Analysis of the Literature. Int. J. Prod. Res. 2017, 55, 1260–1276. [Google Scholar] [CrossRef]
  21. Kadir, B.A.; Broberg, O.; da Conceição, C.S. Current Research and Future Perspectives on Human Factors and Ergonomics in Industry 4.0. Comput. Ind. Eng. 2019, 137, 106004. [Google Scholar] [CrossRef]
  22. Lee, I.G.; Chung, S.H.; Yoon, S.W. Two-Stage Storage Assignment to Minimize Travel Time and Congestion for Warehouse Order Picking Operations. Comput. Ind. Eng. 2020, 139, 106129. [Google Scholar] [CrossRef]
  23. Pan, J.C.-H.; Wu, M.-H. Throughput Analysis for Order Picking System with Multiple Pickers and Aisle Congestion Considerations. Comput. Oper. Res. 2012, 39, 1661–1672. [Google Scholar] [CrossRef]
  24. Neumann, W.P.; Winkelhaus, S.; Grosse, E.H.; Glock, C.H. Industry 4.0 and the Human Factor—A Systems Framework and Analysis Methodology for Successful Development. Int. J. Prod. Econ. 2021, 233, 107992. [Google Scholar] [CrossRef]
  25. de Koster, R. How to Assess a Warehouse Operation in a Single Tour; Erasmus University: Rotterdam, The Netherlands, 2004. [Google Scholar]
  26. Caron, F.; Marchet, G.; Perego, A. Optimal Layout in Low-Level Picker-to-Part Systems. Int. J. Prod. Res. 2000, 38, 101–117. [Google Scholar] [CrossRef]
  27. Ii, C.G.P. An Evaluation of Order Picking Policies for Mail Order Companies. Prod. Oper. Manag. 2000, 9, 319–335. [Google Scholar] [CrossRef]
  28. Le-Duc, T.; de Koster, M.B.M. Determining Number of Zones in a Pick-and-Pack Orderpicking System. Rochester, NY. 2005. Available online: https://papers.ssrn.com/abstract=800205 (accessed on 26 October 2022).
  29. Goetschalckx, M.; Ashayeri, J. Classification and design of order picking. Logist. World 1989, 2, 99–106. [Google Scholar] [CrossRef]
  30. Dallari, F.; Marchet, G.; Melacini, M. Design of Order Picking System. Int. J. Adv. Manuf. Technol. 2009, 42, 1–12. [Google Scholar] [CrossRef]
  31. Marchet, G.; Melacini, M.; Perotti, S. Investigating Order Picking System Adoption: A Case-Study-Based Approach. Int. J. Logist. Res. Appl. 2015, 18, 82–98. [Google Scholar] [CrossRef]
  32. Boysen, N.; Füßler, D.; Stephan, K. See the Light: Optimization of Put-to-Light Order Picking Systems. Nav. Res. Logist. NRL 2020, 67, 3–20. [Google Scholar] [CrossRef]
  33. Manzini, R.; Gamberi, M.; Regattieri, A. Design and Control of an AS/RS. Int. J. Adv. Manuf. Technol. 2006, 28, 766–774. [Google Scholar] [CrossRef]
  34. Lolli, F.; Lodi, F.; Giberti, C.; Coruzzolo, A.M.; Marinello, S. Order Picking Systems: A Queue Model for Dimensioning the Storage Capacity, the Crew of Pickers, and the AGV Fleet. Math. Probl. Eng. 2022, 2022, e6318659. [Google Scholar] [CrossRef]
  35. Petersen, C.G. An Evaluation of Order Picking Routeing Policies. Int. J. Oper. Prod. Manag. 1997, 17, 1098–1111. [Google Scholar] [CrossRef]
  36. Wang, W.; Han, P.; Peng, P.; Zhang, T.; Liu, Q.; Yuan, S.-N.; Huang, L.-Y.; Yu, H.-L.; Qiao, K.; Wang, K.-S. Friction Stir Processing of Magnesium Alloys: A Review. Acta Metall. Sin. 2020, 33, 43–57. [Google Scholar] [CrossRef] [Green Version]
  37. Adil, G.K.; Muppani, V.R.; Bandyopadhyay, A. A Review of Methodologies for Class-Based Storage Location Assignment in a Warehouse. Int. J. Adv. Oper. Manag. 2010, 2, 274. [Google Scholar] [CrossRef]
  38. Malmborg, C.J.; Bhaskaran, K. A Revised Proof of Optimality for the Cube-per-Order Index Rule for Stored Item Location. Appl. Math. Model. 1990, 14, 87–95. [Google Scholar] [CrossRef]
  39. Petersen, C.G.; Aase, G.R. Improving Order Picking Efficiency with the Use of Cross Aisles and Storage Policies. Open J. Bus. Manag. 2017, 5, 95. [Google Scholar] [CrossRef]
  40. Yu, Y.; de Koster, R.B.M.; Guo, X. Class-Based Storage with a Finite Number of Items: Using More Classes Is Not Always Better. Prod. Oper. Manag. 2015, 24, 1235–1247. [Google Scholar] [CrossRef]
  41. Graves, S.C.; Hausman, W.H.; Schwarz, L.B. Storage-Retrieval Interleaving in Automatic Warehousing Systems. Manag. Sci. 1977, 23, 935–945. [Google Scholar] [CrossRef]
  42. Hausman, W.H.; Schwarz, L.B.; Graves, S.C. Optimal Storage Assignment in Automatic Warehousing Systems. Manag. Sci. 1976, 22, 629–638. [Google Scholar] [CrossRef]
  43. Bindi, F.; Manzini, R.; Pareschi, A.; Regattieri, A. Similarity-Based Storage Allocation Rules in an Order Picking System: An Application to the Food Service Industry. Int. J. Logist. Res. Appl. 2009, 12, 233–247. [Google Scholar] [CrossRef]
  44. Zhang, Y. Correlated Storage Assignment Strategy to Reduce Travel Distance in Order Picking∗∗Zhang Thanks the Financial Support of the China Scholarship Council (CSC). IFAC Pap. 2016, 49, 30–35. [Google Scholar] [CrossRef]
  45. Frazele, E.A.; Sharp, G.P. Correlated Assignment Strategy Can Improve Any Order-Picking Operation. Ind. Eng. 1989, 21, 33–37. [Google Scholar]
  46. Jarvis, J.M.; Mcdowell, E.D. Optimal Product Layout in an Order Picking Warehouse. IIE Trans. 1991, 23, 93–102. [Google Scholar] [CrossRef]
  47. Brynzér, H.; Johansson, M.I. Storage Location Assignment: Using the Product Structure to Reduce Order Picking Times. Int. J. Prod. Econ. 1996, 46–47, 595–603. [Google Scholar] [CrossRef]
  48. Marras, W.S.; Granata, K.P.; Davis, K.G.; Allread, W.G.; Jorgensen, M.J. Effects of Box Features on Spine Loading during Warehouse Order Selecting. Ergonomics 1999, 42, 980–996. [Google Scholar] [CrossRef]
  49. Petersen, C.G.; Siu, C.; Heiser, D.R. Improving Order Picking Performance Utilizing Slotting and Golden Zone Storage. Int. J. Oper. Prod. Manag. 2005, 25, 997–1012. [Google Scholar] [CrossRef]
  50. Saccomano, A. How to Pick Picking Technologies. Traffic World 1996, 13, 39–40. [Google Scholar]
  51. Jones, E.C.; Battieste, T. Golden Retrieval: Raising Warehouse Productivity with Ergonomically Responsible Inventory Policies. Ind. Eng. 2004, 36, 37–42. [Google Scholar]
  52. de Koster, R.B.M.; Stam, D.; Balk, B.M. Accidents Happen: The Influence of Safety-Specific Transformational Leadership, Safety Consciousness, and Hazard Reducing Systems on Warehouse Accidents. J. Oper. Manag. 2011, 29, 753–765. [Google Scholar] [CrossRef]
  53. Grosse, E.H.; Glock, C.H. An Experimental Investigation of Learning Effects in Order Picking Systems. J. Manuf. Technol. Manag. 2013, 24, 850–872. [Google Scholar] [CrossRef]
  54. Weisner, K.; Deuse, J. Assessment Methodology to Design an Ergonomic and Sustainable Order Picking System Using Motion Capturing Systems. Procedia CIRP 2014, 17, 422–427. [Google Scholar] [CrossRef] [Green Version]
  55. Loos, M.J.; Merino, E.; Rodriguez, C.M.T. Mapping the State of the Art of Ergonomics within Logistics. Scientometrics 2016, 109, 85–101. [Google Scholar] [CrossRef]
  56. Battini, D.; Glock, C.H.; Grosse, E.H.; Persona, A.; Sgarbossa, F. Human Energy Expenditure in Order Picking Storage Assignment: A Bi-Objective Method. Comput. Ind. Eng. 2016, 94, 147–157. [Google Scholar] [CrossRef]
  57. GARG, A.; CHAFFIN, D.B.; HERRIN, G.D. Prediction of Metabolic Rates for Manual Materials Handling Jobs. Am. Ind. Hyg. Assoc. J. 1978, 39, 661–674. [Google Scholar] [CrossRef]
  58. Calzavara, M.; Sgarbossa, F.; Grosse, E.; Glock, C. Analytical Models for a Joint Posture and Fatigue Analysis in Order Picking. In Proceedings of the International Conference on Industrial Engineering and Systems Management, Saarbrücken, Germany, 11–13 October 2017. [Google Scholar]
  59. Gajšek, B.; Šinko, S.; Kramberger, T.; Butlewski, M.; Özceylan, E.; Đukić, G. Towards Productive and Ergonomic Order Picking: Multi-Objective Modeling Approach. Appl. Sci. 2021, 11, 4179. [Google Scholar] [CrossRef]
  60. Calzavara, M.; Persona, A.; Sgarbossa, F.; Visentin, V. A Model for Rest Allowance Estimation to Improve Tasks Assignment to Operators. Int. J. Prod. Res. 2019, 57, 948–962. [Google Scholar] [CrossRef]
  61. Diefenbach, H.; Glock, C.H. Ergonomic and Economic Optimization of Layout and Item Assignment of a U-Shaped Order Picking Zone. Comput. Ind. Eng. 2019, 138, 106094. [Google Scholar] [CrossRef]
  62. Al-Araidah, O.; Okudan-Kremer, G.; Gunay, E.E.; Chu, C.-Y. A Monte Carlo Simulation to Estimate Fatigue Allowance for Female Order Pickers in High Traffic Manual Picking Systems. Int. J. Prod. Res. 2021, 59, 4711–4722. [Google Scholar] [CrossRef]
  63. Daria, B.; Martina, C.; Alessandro, P.; Fabio, S. Linking Human Availability and Ergonomics Parameters in Order-Picking Systems. IFAC Pap. 2015, 48, 345–350. [Google Scholar] [CrossRef]
  64. Visentin, V. Human Factors in Industrial Contexts: Fatigue and Recovery Modelling for Manual Material Handling Activities, Universita’ Degli Studi di Padova Department of Management and Engineering. 2018. Available online: https://www.research.unipd.it/handle/11577/3425388 (accessed on 26 October 2022).
Figure 1. (a) Across-aisle Storage Policy; (b) Within-aisle Storage Policy.
Logistics 06 00083 g001
Figure 2. Mezzanine Floor Overview.
Logistics 06 00083 g002
Figure 3. Aisle’s Left Side.
Logistics 06 00083 g003
Figure 4. Dynamic Slotting.
Logistics 06 00083 g004
Figure 5. Across-aisle storage policy of the left side of an aisle implementing ABC Classification.
Logistics 06 00083 g005
Figure 6. Flowchart of the Layout Algorithm.
Logistics 06 00083 g006
Figure 7. Products per Popularity Class.
Logistics 06 00083 g007
Figure 8. Transfer Orders per Popularity Class.
Logistics 06 00083 g008
Figure 9. Left side of the “ideal aisle”.
Logistics 06 00083 g009
Figure 10. Right side of the “ideal aisle”.
Logistics 06 00083 g010
Figure 11. Daily Transfer Orders Distribution—Ground Floor (Initial System).
Logistics 06 00083 g011
Figure 12. Daily Transfer Orders Distribution—Mezzanine Floor (Initial System).
Logistics 06 00083 g012
Figure 13. Daily Transfer Orders Distribution—Ground Floor (Improved System).
Logistics 06 00083 g013
Figure 14. Daily Transfer Orders Distribution—Mezzanine Floor (Improved System).
Logistics 06 00083 g014
Table 1. Bay Constraints based on Class.
CLASSBay 1Bay 2Bay 3 Bay 4 Bay 5
A---
B-
C
Table 2. Rack Constraints based on Class.
CLASSABC
Rack 5--
Rack 4-
Rack 3
Rack 2
Rack 1-
Table 3. Rack Constraints based on Slot Size.
SLOTS2S2S
Rack 5-
Rack 4-
Rack 3
Rack 2
Rack 1
Table 4. Constraints of X and Y Values.
Slot TypeBayRack
XminXmaxYminYmax
A2S1223
AS1223
AS21223
B2S1313
BS1314
BS21314
C2S1513
CS1515
CS21515
Table 5. Number of slots per aisle side.
Slot TypeLeft SideRight SideTotal Slots per Aisle
A2S448
AS336
AS2224
B2S101020
BS161531
BS28715
C2S121325
CS262652
CS2212041
Table 6. Description of Symbols used in Equations (10)–(12).
SymbolDescription
TO i daily transfer orders for product i
D B i bay difficulty rate for product i
D R i rack difficulty rate for product i
W b i storage box weight for product i
W U i weight of one unit of product i
AU i average number of product i units carried per transfer order
  d i daily demand of product i in number of units
Table 7. Bay Difficulty Rate Ranking System.
Bay12345
Difficulty Rate  ( D B ) 0.511.522.5
Table 8. Rack Difficulty Rate Ranking System.
RackDifficulty Rate ( D R )
55
43
31
22
14
Table 9. Ergonomics Improvement.
Storage SystemDifficulty Rate
Initial994,121.69
Improved682,525.12
Change Percentage−31%
Publisher’s Note: MDPI stays neutral with regard to jurisdictional claims in published maps and institutional affiliations.

