Comparative Analysis of Ports on the Eastern Baltic Sea Coast
Abstract
1. Introduction
- to evaluate the competitiveness of ports based on a range of elements from a scientific point of view;
- to analyse the ports of the eastern Baltic Sea coast from a quantitative perspective.
2. Methods and Methodology
2.1. Literature Review
- External factors determining port competitiveness. The factors driving changes in ports in the global and national context should be analysed by grouping them into certain groups. PEST analysis is one of the most common methods for analysing the external environments that determine the activities of a certain object.
- Internal factors determining port competitiveness. In this case, the theory of inputs and outputs is used in the analysis of factors. According to the theory of inputs and outputs, the internal factors of port competitiveness can be divided into four main categories: (1) human factors, (2) institutional factors, (3) physical-technological factors, (4) economic factors.
- key factors in 1980: confidence in port schedules, the frequency of ship entries, the variety of shipping routes and port availability;
- key factors in 1981: navigation distance, proximity to land, connections with other ports, the availability of port equipment and port taxes and service charges;
- key factors in 1984: average waiting time in a port, confidence in port schedules and the supply of port services for port infrastructure capacity;
- key factors in 1985: port dues and service charges, port availability and interconnected transport networks;
- key factors in 1984–1985: port dues and service charges, the frequency of ship entry and port reputation and/or loyalty and cargo damage cases;
- key factors in 1988–1992: loading and unloading equipment for large and/or substandard size cargo, the possibility of servicing large volumes of shipments, few cases of damage to cargo and losses, available equipment, convenient pick-up and delivery times, information regarding the process of service provision, assistance available for claims handling processes, the flexibility of meeting special stevedoring requirements;
- key factors in 1990: internal factors: service level, available infrastructure and equipment capacity, the condition of infrastructure and equipment and port operation policy. External factors: international politics, changes in the social environment, the trade market and economic factors, the characteristics of competitive ports and functional changes in transport and materials handling;
- key factors in 1992: geographical position, land transport networks, transport accessibility and efficiency, port dues and service charges, port reliability and port information system;
- key factors in 1994: port infrastructure and equipment, internal transport networks, container transport routes, geographical position, domestic rail transport connections, investments in port infrastructure and equipment and the reliability of the port workforce;
- key factors in 1995: port dues and service charges, cargo handling security and confidence in port schedules;
- key factors in 1996 and 2000: customs services, fast service, the simplicity of port documents, guarantees for cargo damage, the qualification of port employees and the reputation of the port.
- Talley [30] presented a methodology for analysing the productivity of container ports, offering to measure the function of economic productivity and economic costs based on the number and weight of containers served.
- Tabernacle [31] emphasized the impact of characteristics of container cranes used in ports on the efficiency of port operations: the more efficient the crane, the faster the ships are served in the port and the better is the port capacity.
- Tongzon [32] conducted an empirical study analysing the performance of 23 international ports and the impact of port infrastructure on port efficiency.
- Wilson and Roach [36] analysed the opportunities of using artificial intelligence to optimize cargo handling, arrangement and warehousing in ports.
2.2. Description of the Assessment Methodology of the Eastern Baltic Ports
- port depth: maximum depth (m);
- port development: length of embankments (m); number of embankments (pcs.); maximum ship length (m); open warehouses (m2); covered warehouses (m2); refrigerated cargo warehouses (m2); liquid cargo tanks (m2);
- creation and improvement of the image of ports: territory (ha); stevedoring volumes (million tons); number of terminal operators (pcs).
- Pearson correlation (parametric)
- Kendall rank correlation (non-parametric)
- Spearman correlation (non-parametric)
- Point–Biserial correlation [58].
2.3. Ports on the Eastern Baltic Sea Coast and Their Characteristics
- Corridor I North-South or Via Baltica (Helsinki–Tallinn–Riga–Kaunas–Warsaw) for transit, export and import cargo;
- IA branch or Via Hanseatica (Riga–Siauliai–Kaliningrad–Berlin);
- Corridor IXB West–East direction (Kiev–Minsk–Vilnius–Kaunas–Klaipeda) for transit, export and import cargo transportation;
- in the railway system: Corridor I (Helsinki–Tallinn–Riga–Kaunas–Warsaw), Corridor IXB (Kiev–Minsk–Vilnius–Klaipeda) and Corridor IX (Kaišiadorys–Kaunas–Kaliningrad) Transport Corridor I, connecting Warsaw with Helsinki.
- Lithuania. Having a non-freezing port and being in the central part of Europe geographically, Lithuania can be called a transport bridge between the West and the East. The Klaipeda Seaport (Figure 3) is the closest to ports of West and North Europe and to South Scandinavian ports.Figure 3. Klaipeda seaport. Source: [63].Figure 3. Klaipeda seaport. Source: [63].The main shipping lines to the continents of Western Europe, America and Southeast Asian pass through the Klaipeda port. Klaipeda is a deep-water, universal, multifunctional port. The quality of services of the port meets all the requirements of the European Union [64]. The main characteristics of the port are as follows:
- the port now covers an area of 1442.8 ha, which consists of the land area of 557.9 ha and the internal water area of the port covering 884.9 ha;
- the depth of the port entrance channel is 15 m and the internal depth of the port channels is 15.5 m;
- the length of port berths—26.8 km, the number of berths—157 [65];
- cargo storage possibilities in the port: area of covered warehouses for general cargo—99,380 m2, storage capacity of bulk cargo—933,700 t, storage capacity of frozen cargo—66,000 t, area of open storage sites—1,045,879 m², tanks for storage of liquid cargo—749,000 m3 [66];
- the port has the following terminals: 15 cargo terminals, 2 cruise ship terminals, 3 Ro-Ro terminals and 2 container terminals;
- the port handles oil products, containers and general cargo, bulk and liquid fertilizers, mineral and chemical materials, agricultural products, metal products and raw materials, Ro-Ro cargo, liquid and frozen food products, construction materials, wood, peat, bulky and heavy cargo, Ro-Pax, cruise ship passengers and many other cargo [65];
- port capacity: the port accepts 400 m long and 59-m wide vessels with a 13.8-m draft, also large tonnage vessels: dry cargo—about 100,000 DWT, tankers—about 170,000 DWT, container vessels—19,500 TEU;
- intermodality is being developed in the port: container and container trains Mercury, Vikings and Saul connecting the Baltic markets from Klaipeda to Odessa Kazakhstan and China via Minsk, Moscow and Kiev are innovative trains promoting intermodal transport in the Baltic States. Containerization is a global trend that will continue in the future [65].
- Ferries sailing from Klaipeda to Germany, Sweden and Denmark provide good connection to Northern Europe.
More than 800 companies are directly involved in the activities of the Klaipeda port, creating 6.13 percent of the total GDP of Lithuania and more than 58,000 jobs [67]. This shows that the port makes a significant contribution to the improvement of the economic situation in Lithuania and has an important position. - Latvia. There are three ports in this country:
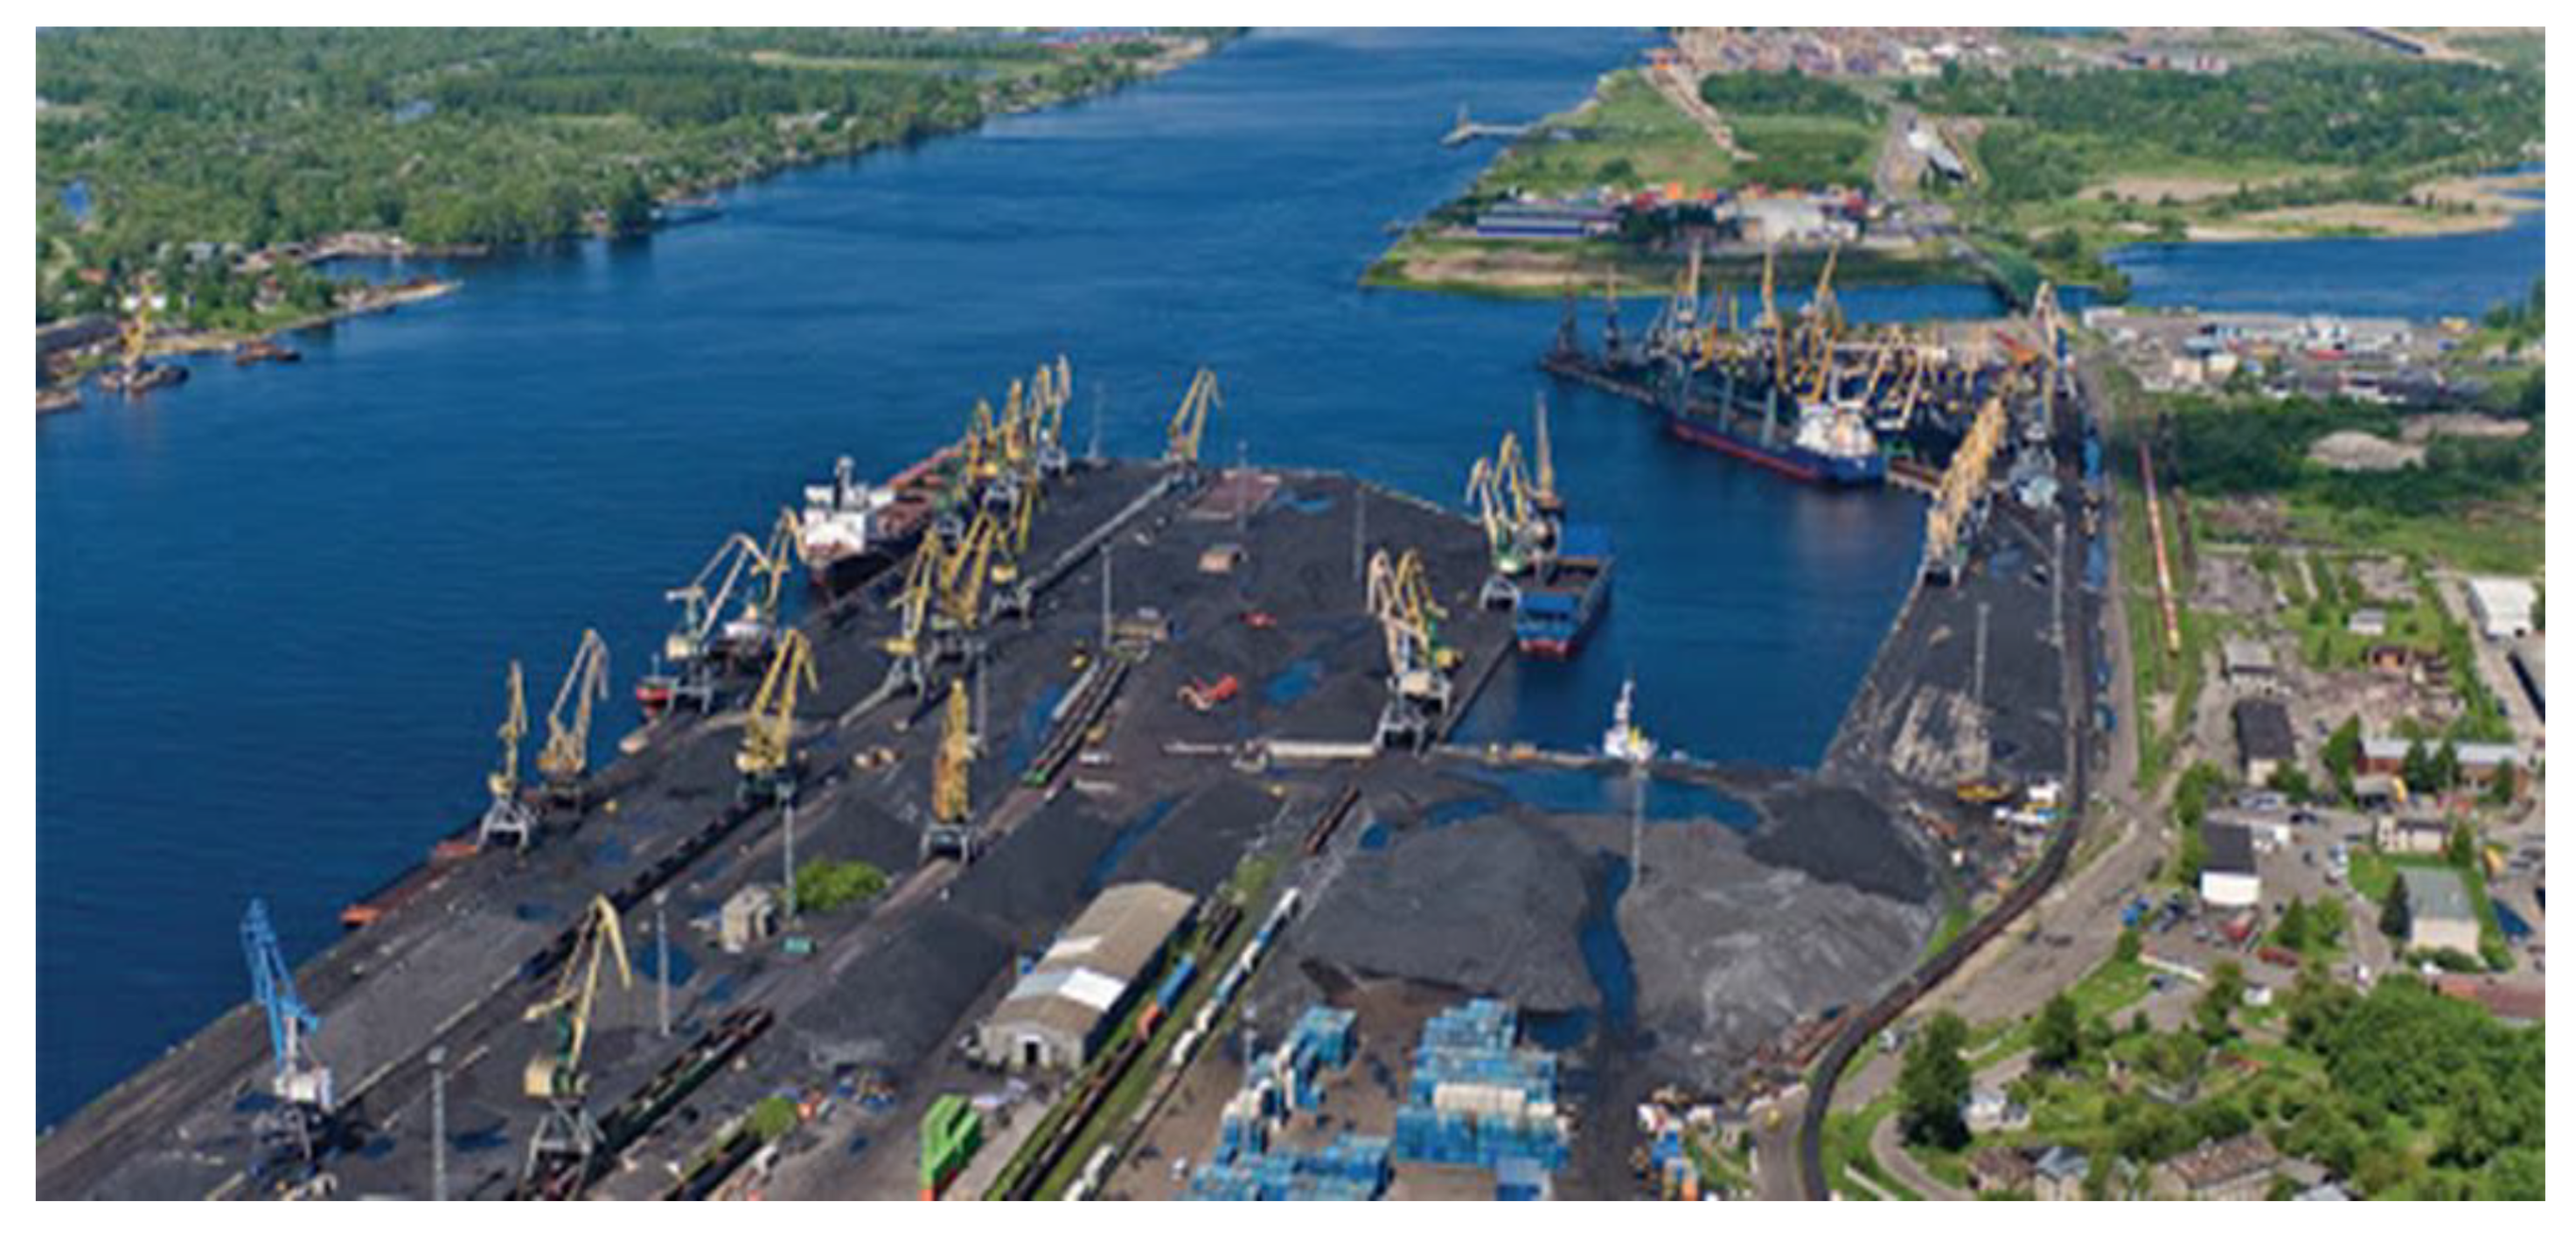
- Port of Riga. It is the main port on the eastern coast of the Baltic Sea, located in the Latvian capital Riga. Historically, Latvia has been one of the main transit countries for north-south and east-west trade. The free port of Riga (see Figure 4) is located on both banks of the Daugava River, which is 15 km long.Figure 4. Port of Riga. Source: [68].Figure 4. Port of Riga. Source: [68].The main characteristics of the port are as follows:
- the port now covers an area of 348 ha, which consists of the land area of 1962 ha and the internal water area of the port covering 4386 ha;
- the depth of the port entrance channel is 16 m and the internal depth of the port channels—13.5 m;
- the length of port berths is 18 km, the number of berths 152 [69];
- cargo storage capacity in the port: area of covered warehouses for general cargo—418,603 m2, storage areas of bulk cargo—217,800 m3, storage capacity of refrigerated cargo—7800 t—and, in addition, area of open storage sites—1,894,278 m2, liquid cargo storage tanks—522,391 m3, [69];
- The port has 46 cargo terminals, 2 cruise ship terminals and 3 container terminals;
- The port handles oil products, coal, container and general cargo, dry cargo, liquid cargo, chemicals, agricultural products, metal, Ro-Ro cargo, construction materials, timber, peat, [69];
- port capacity: the port accepts 500 m long ships with a 15-meter draft;
- Intermodality being developed in the port—Container transport services: Riga Express (Riga–Moscow), container train Baltika-Transit (Riga–Almaty), container train Zubr (Riga–Minsk–Illichevsk), block train (Riga–Hairaton) [69].
More than 9%of the Latvian workforce works in or is related to transit services. The transport, transit and cargo storage sectors create 8.7% of Latvia’s GDP. - Port of Ventspils. It is the largest port in Latvia and one of the largest in the Eastern Baltic Sea region (see Figure 5).Figure 5. Port of Ventspils. Source: [70].Figure 5. Port of Ventspils. Source: [70].The port is a useful transport link between the EU, the CIS and the Central Asia and is considered one of the main network nodes in Latvia and the Baltic Sea region between the East–West transit corridor and the European TEN-T transport network.The main characteristics of the port are as follows:
- the port now covers the area of 2451.39 ha, which consists of the land area of 2226.79 ha and the internal water area of the port of 224.6 ha;
- the depth of the port entrance channel is 17 m and the internal depth of the port channels is 14 m;
- the length of port berths is 11 km, the number of berths—57 [71];
- cargo storage facilities in the port: covered warehouses for general cargo—57,200 m2, open warehouses—460,000 m2, refrigerated cargo storage—12,000 m2, liquid cargo tanks—1,676,000 m3, [71];
- the port has 15 cargo terminals;
- port handling oil products, coal, chemicals, agricultural products, metal, Ro-Ro cargo, timber, mineral fertilizers [71];
- port capacity: the port accepts 270 m long vessels with 13.2 m draft and the maximum capacity of 150,000 DWT [71].
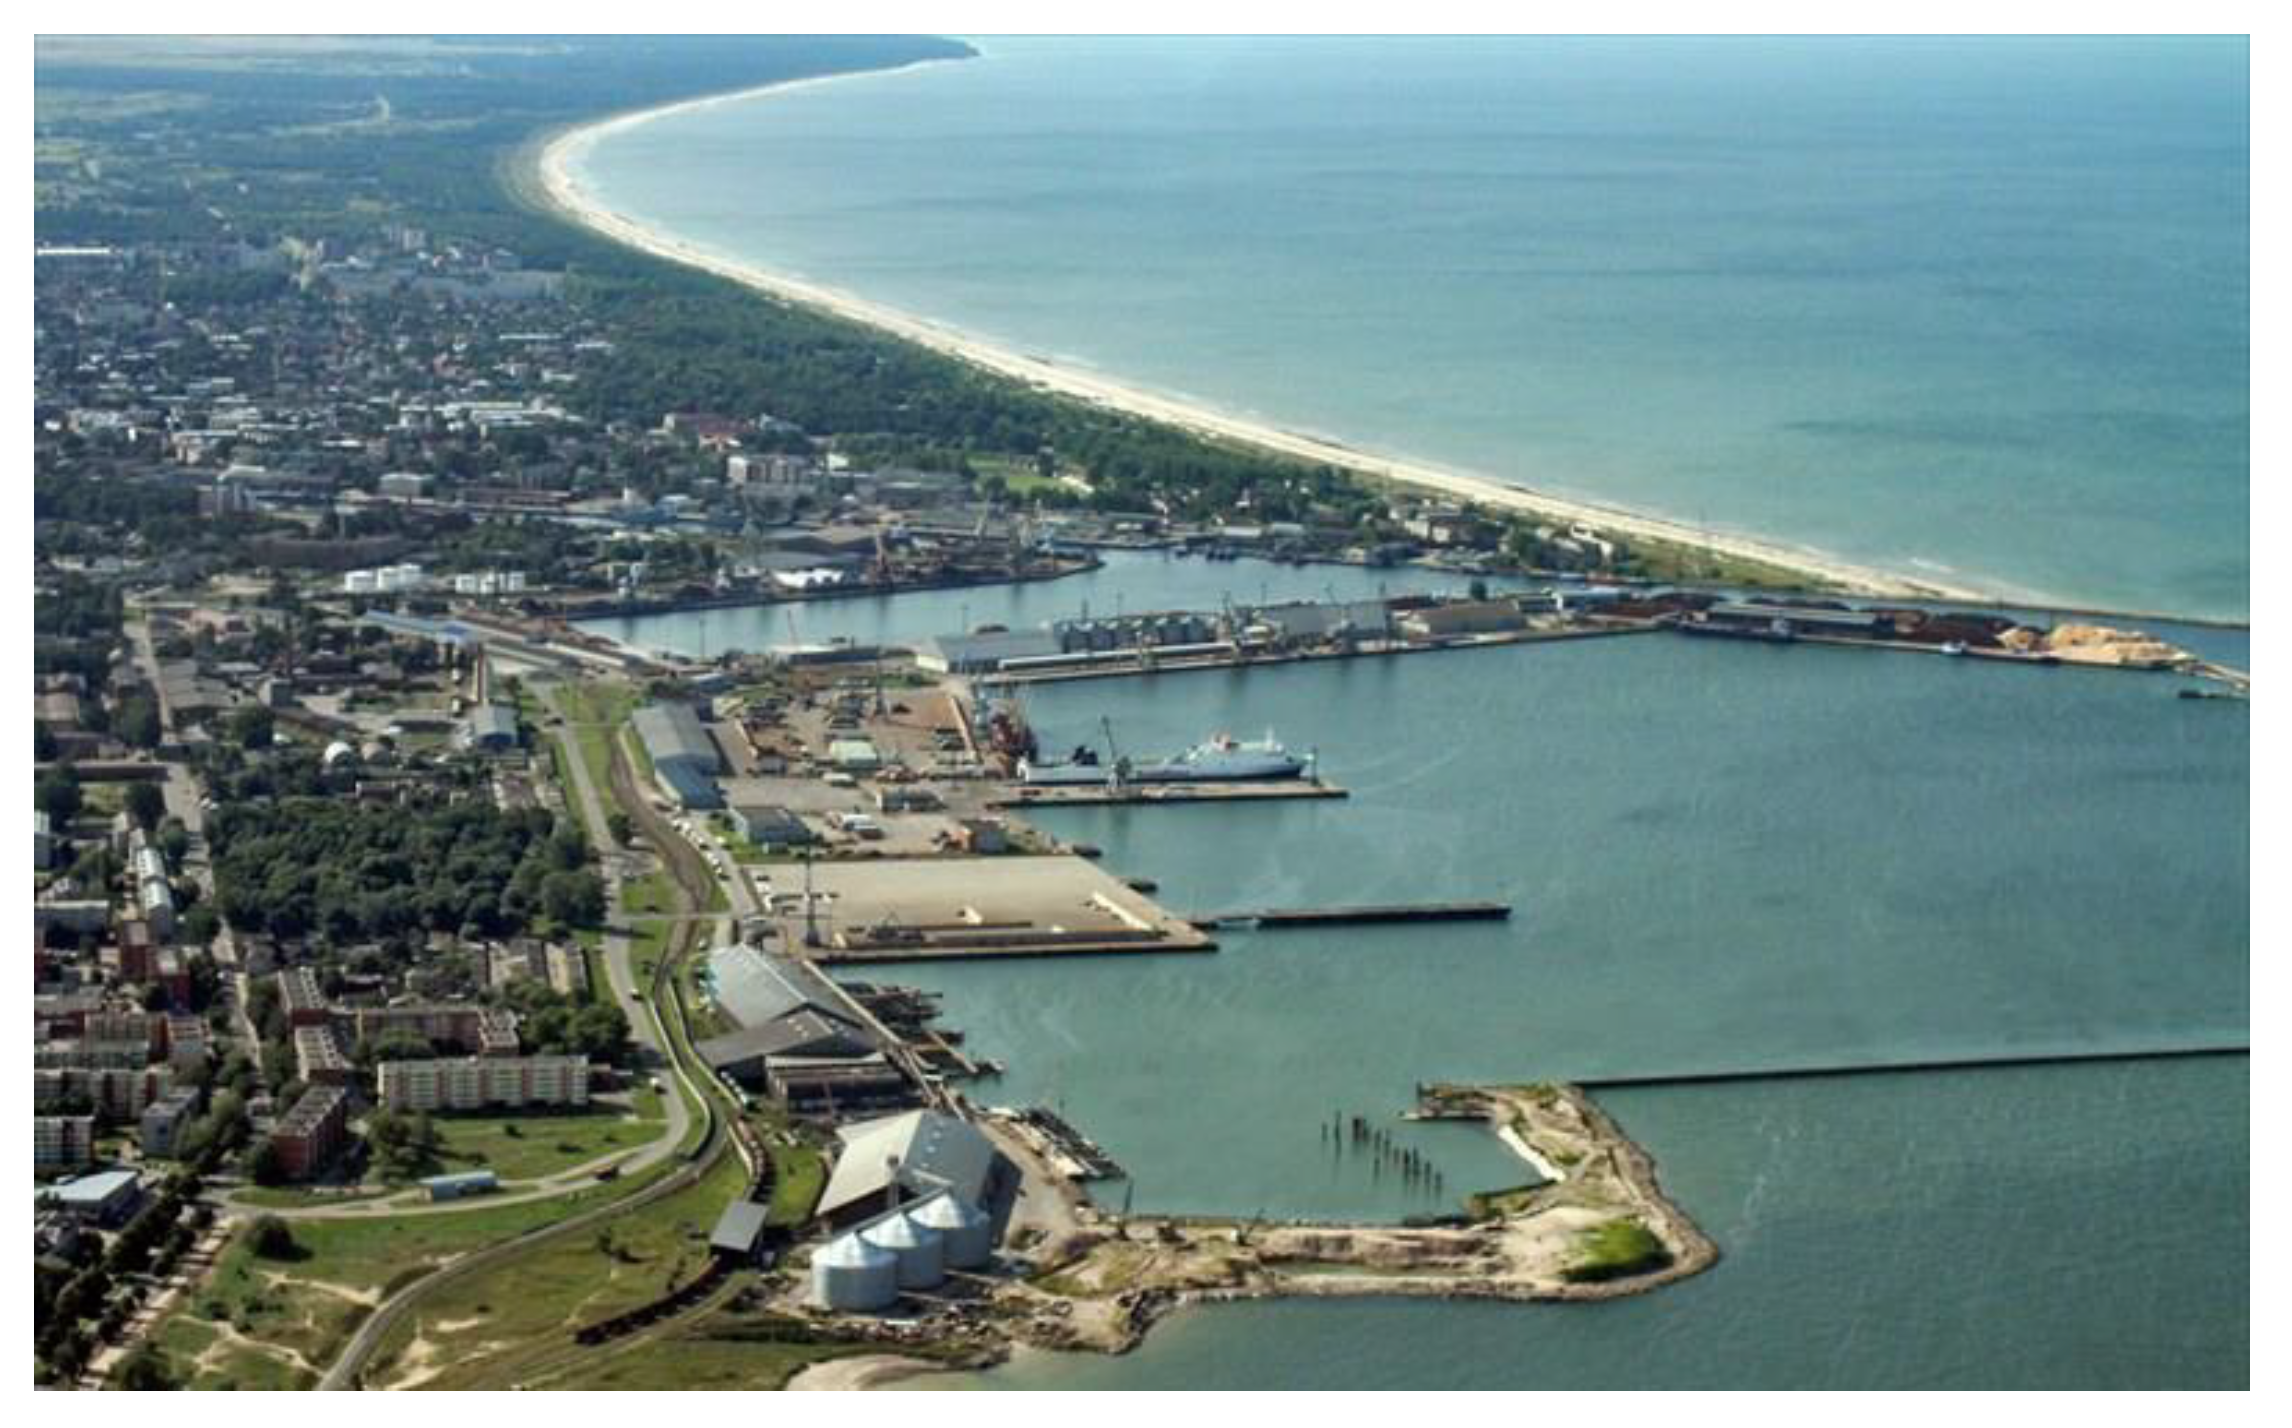
- Port of Liepaja. The port is located 100 km south of the Ventspils port (see Figure 6).Figure 6. Port of Liepaja. Source: [72].Figure 6. Port of Liepaja. Source: [72].The main characteristics of the port are as follows:
- the port now covers an area of 2451.39 ha, which consists of the land area of 2208.79 ha and the internal water area of the port covering 242.60 ha;
- the depth of the port entrance channel is 12 m and the internal depth of the port channels is 11 m;
- the length of port berths is 10 km, the number of berths—67 [73];
- cargo storage capacity in the port: area of covered warehouses for general cargo—75,000 m2, area of open warehouses—440 000 m2, frozen cargo storage capacity—25,200 m3, liquid cargo storage tanks—75,000 m3, silos—74,400 m3 [73];
- the port has 16 cargo terminals, 2 container terminals and a cruise ship terminal;
- bulk cargo, liquid cargo, general cargo, Ro-Ro cargo ad containers are handled in the port [73].
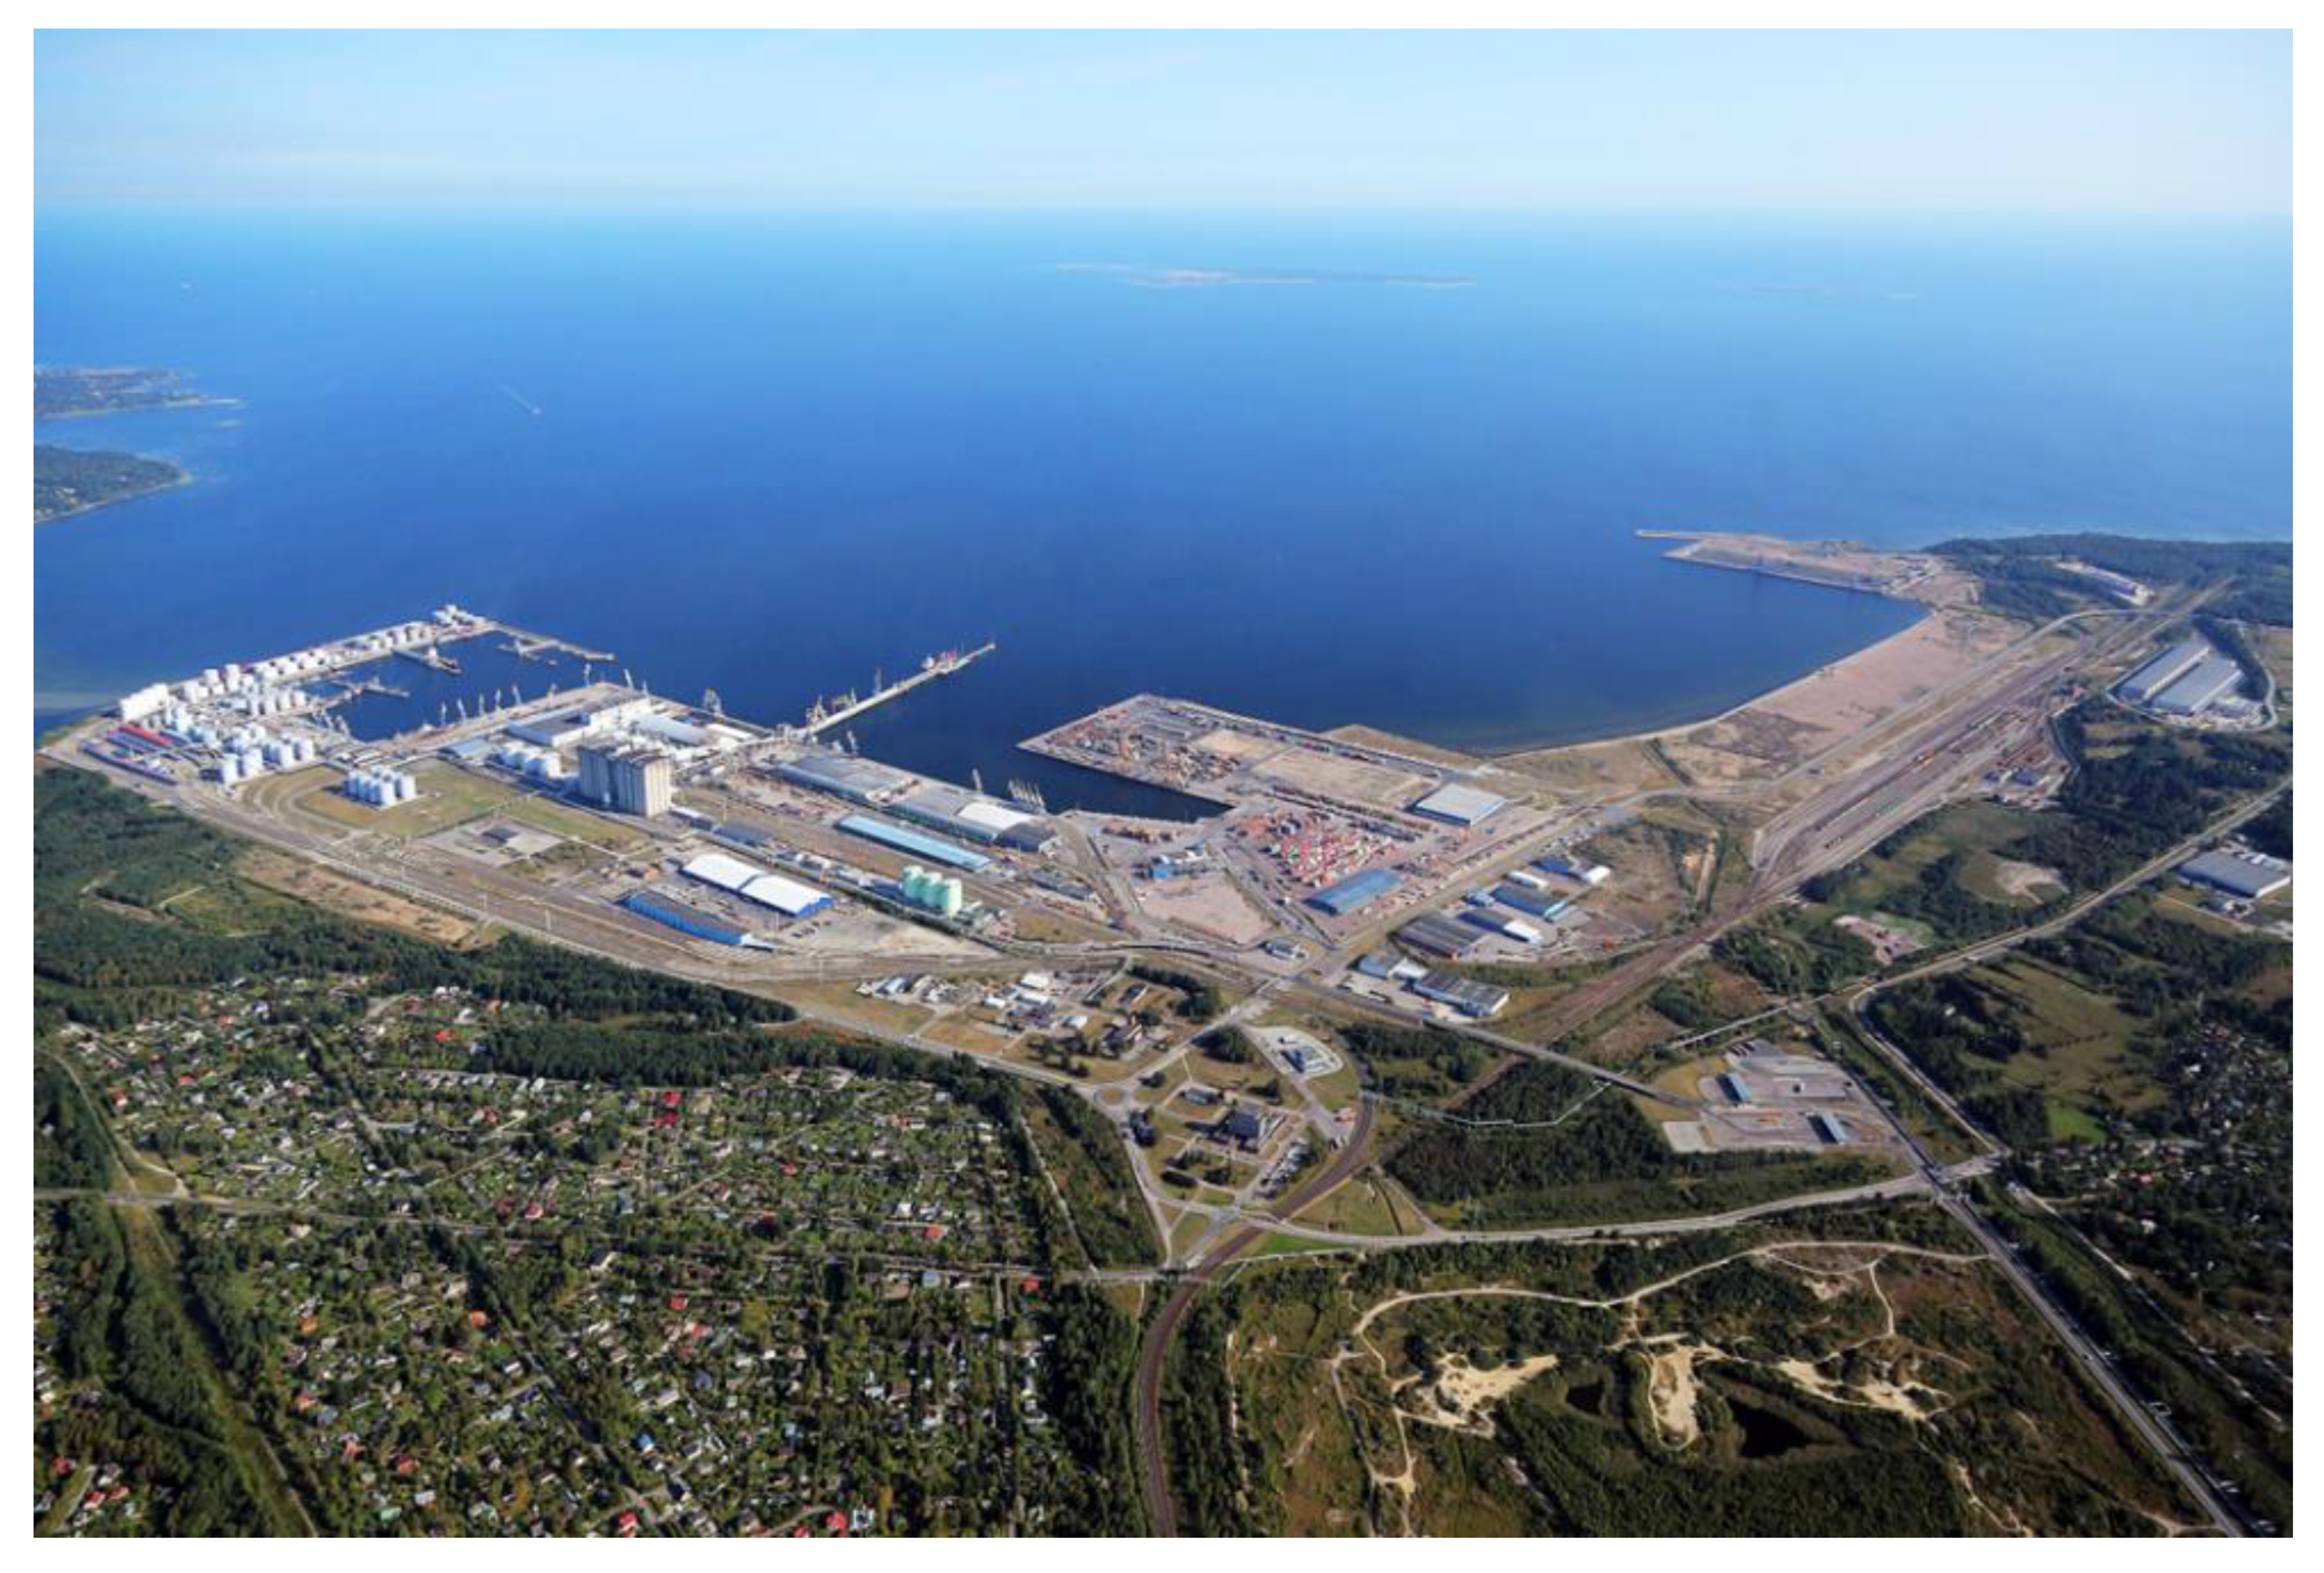
- Estonia. The Port of Tallinn is the largest port authority in Estonia. The integrated port of Tallinn consists of five ports located in separate territories. The port of Paldiski, the Tallinn Passenger Port and the Muuga Harbour (see Figure 7) are the most important ports.Figure 7. Muuga Harbour in Tallinn. Source: [74].Figure 7. Muuga Harbour in Tallinn. Source: [74].It is one of the largest port companies in the Baltic Sea in terms of cargo and passenger flows. The Port of Tallinn acts as a multimodal hub, serving passengers and different vessels every day. The Port of Tallinn has two passenger ports (the Old Town Port and Saaremaa Harbour) and two cargo ports. Muuga Harbour is the largest cargo port in Estonia. It is located about 17 km east of Tallinn.The main characteristics of the port are as follows:
- the port now covers the area of 1784.2 ha, which consists of the land area of the port of 787.2 ha and the internal water area of the port of 997 ha;
- the depth of the port entrance channel is 9 to 18 m (Old City—11 m, Muuga—18 m, Paljassare—9 m, Paldiski South—15.7 m, Saaremaa—10 m);
- the length of port berths is 15,519 km, the number of berths—77 [75];
- the cargo storage capacity in the port: the area of covered warehouses—230,000 m², frozen cargo storage area—13,500 m2, area of open storage sites—695,000 m2, oil product storage tank—1,550,150 m3, grain silo capacity—300,000 t, fertilizer storage capacity—192,000 t [75];
- the port has the following terminals: 10 cargo terminals, 2 cruise ship terminals, 2 Ro-Ro terminals and a container terminal;
- in the ports: Ro-Ro cargo handled in the Old City; Muuga—Container and general cargo, bulk cargo (fertilizers, grain, gravel, wood pellets), ro-ro cargo and liquid cargo; Paljassare—mixed cargo, coal and oil products, timber and perishable cargo; Paldiski Sauth—Ro-Ro cargo, liquid products, bulk cargo, general cargo; Saaremaa—Dry cargo (wood, chopped wood, wood pellets, gravel) [75];
- port facilities: the port accepts 340 m long, 50 m wide vessels with the maximum draft of 17.5 m;
- Intermodality is being developed in the port: a shuttle train carrying containers on the Tallinn–Moscow route. The Estonian railway network is directly connected to the railway system of Russia and other CIS countries. On the Trans-Siberian Railway, the Estonian railway network also has connections with the Far East, making it one of the transit hubs between East and West [75];
- The port’s shipping lines to Russia, Finland and Sweden provide excellent connections to Northern Europe;
- The port is a part of the Trans-European Transport Network (TEN-T).
- Russia. The country has the following ports:
- Ust Luga. The port is located on both sides of the Luga river, on the northwest coast of Russia, about 130 km south of St. Petersburg. The new deep-water port is located 7 km east of the river banks (see Figure 8).Figure 8. Port of Ust Luga. Source: [76].Figure 8. Port of Ust Luga. Source: [76].The main characteristics of the port are as follows:
- the port now covers the area of 128 ha;
- the depth of the port entrance channel is 15.2 m;
- the length of port berths is 7217 km, the number of berths—38 [77];
- cargo storage capacity in the port: the area of covered warehouses for cargo—51,700 m2, the area of open warehouses—471,530 m2; liquid cargo storage tanks—800,000 m3;
- the port has 12 specialized cargo terminals for coal, sulfur, container, multi-purpose cargo handling and timber;
- bulk cargo, liquid cargo, general cargo, Ro-Ro cargo and containers are handled in the port [77].
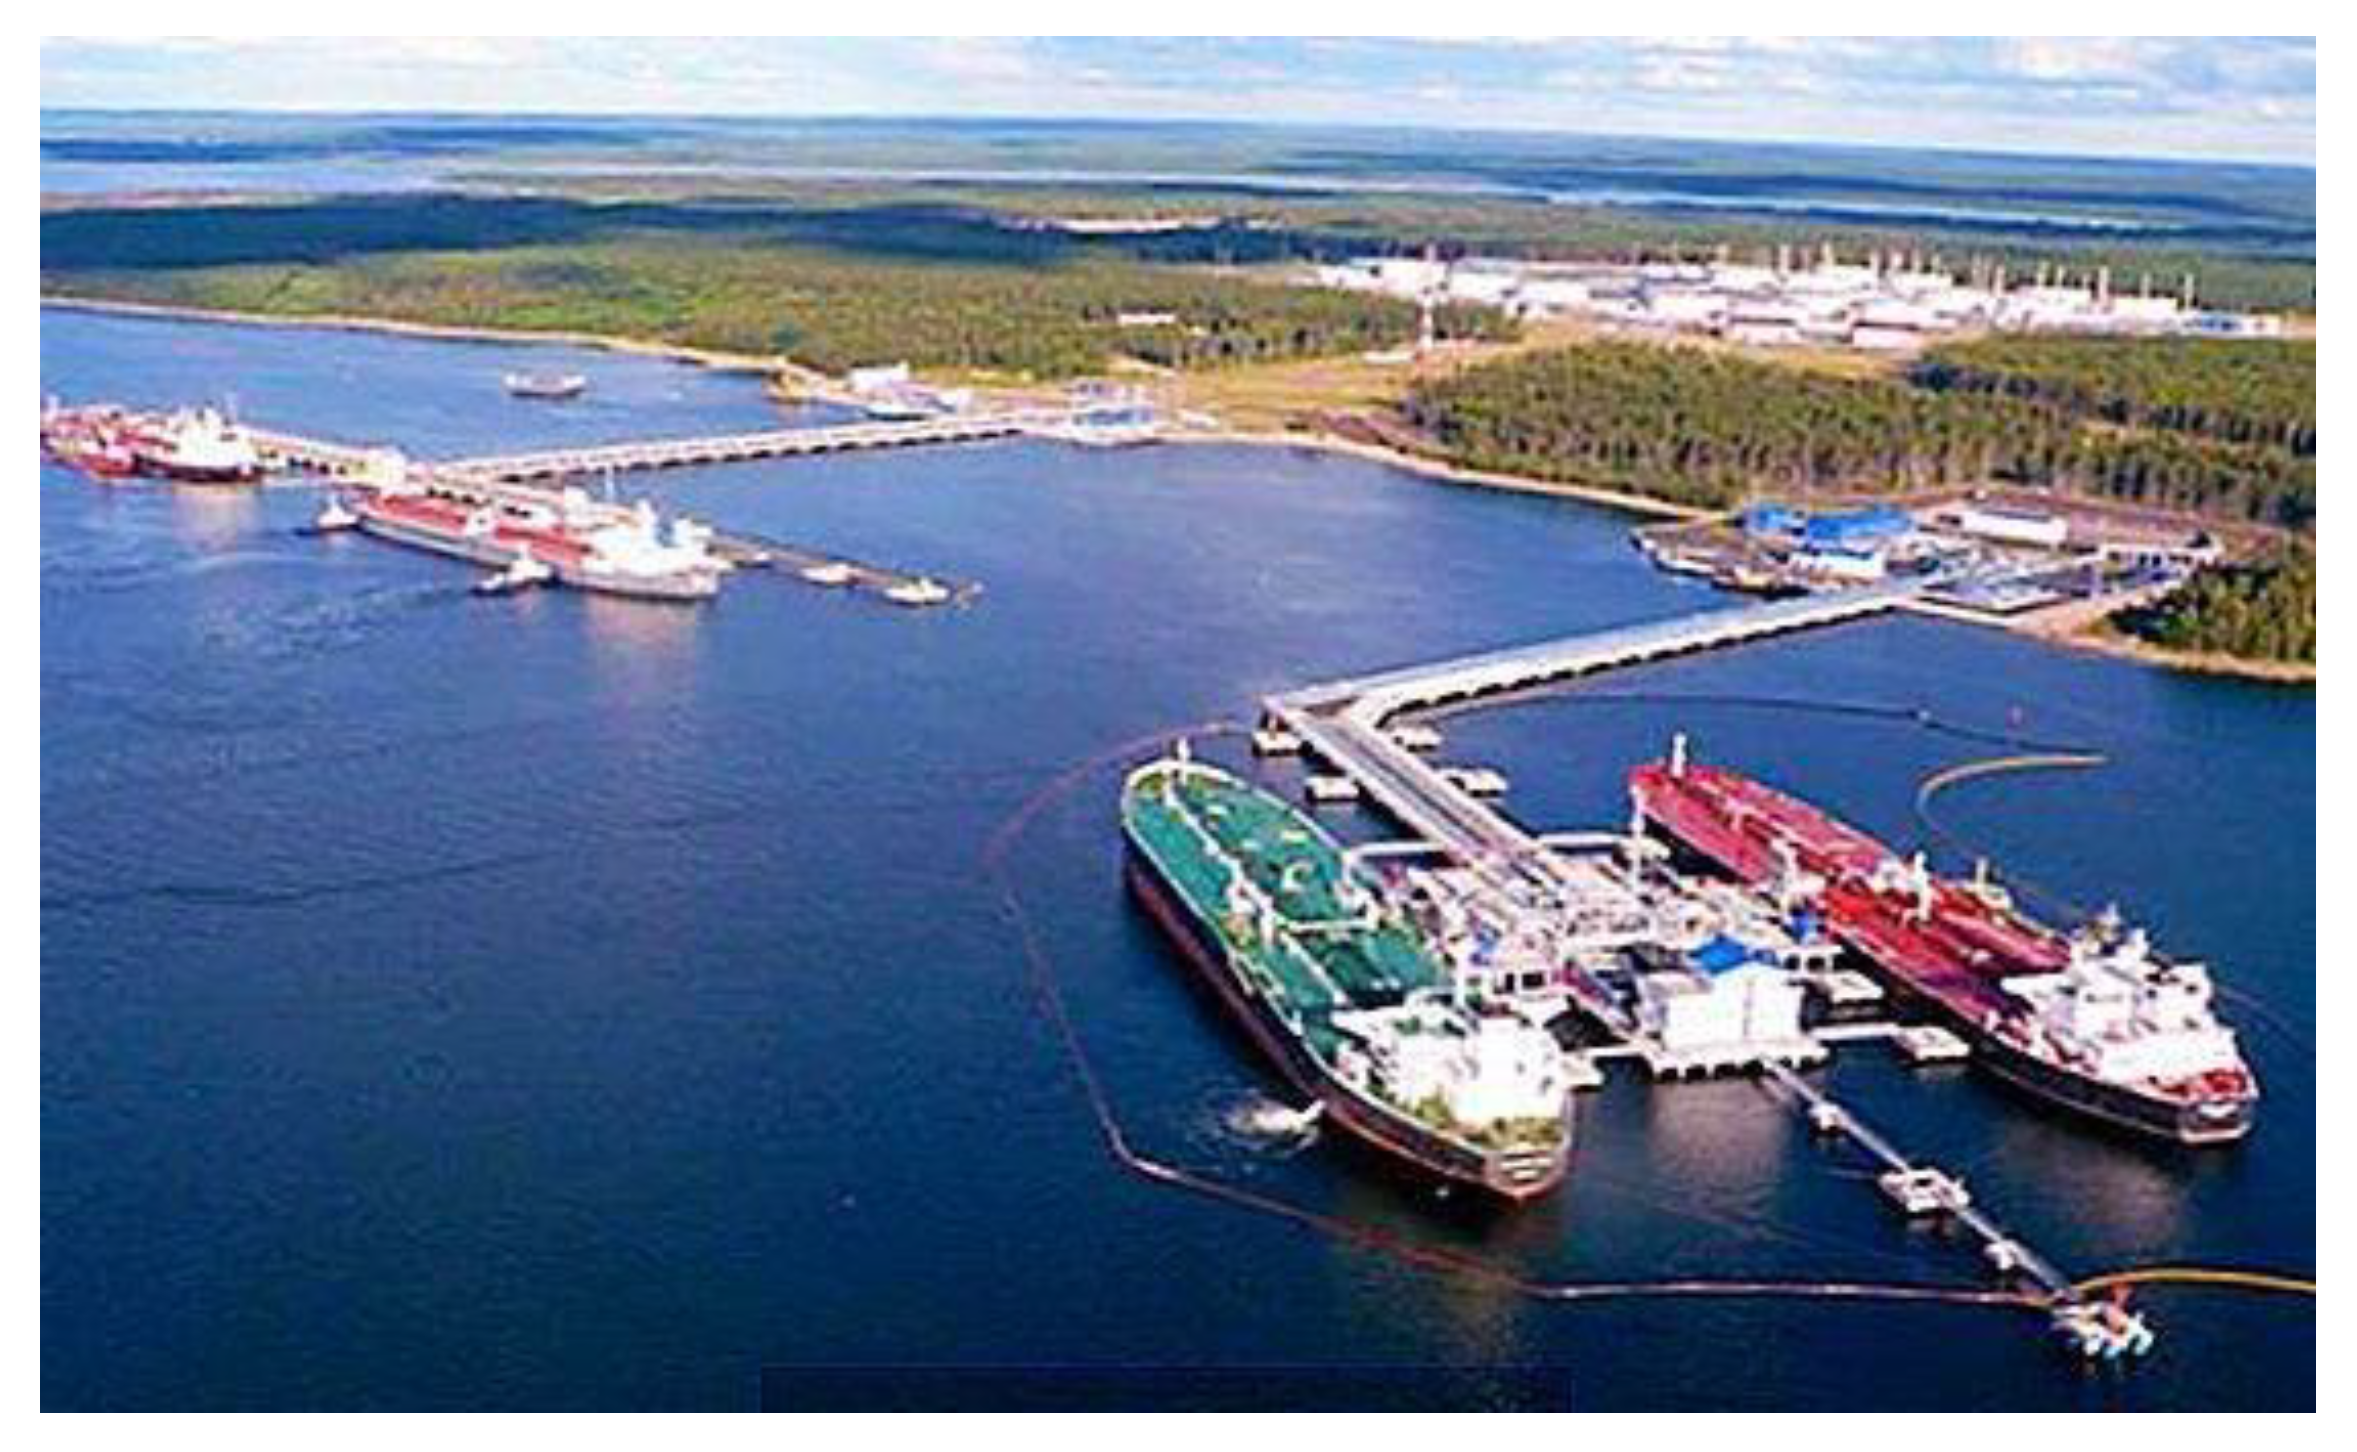
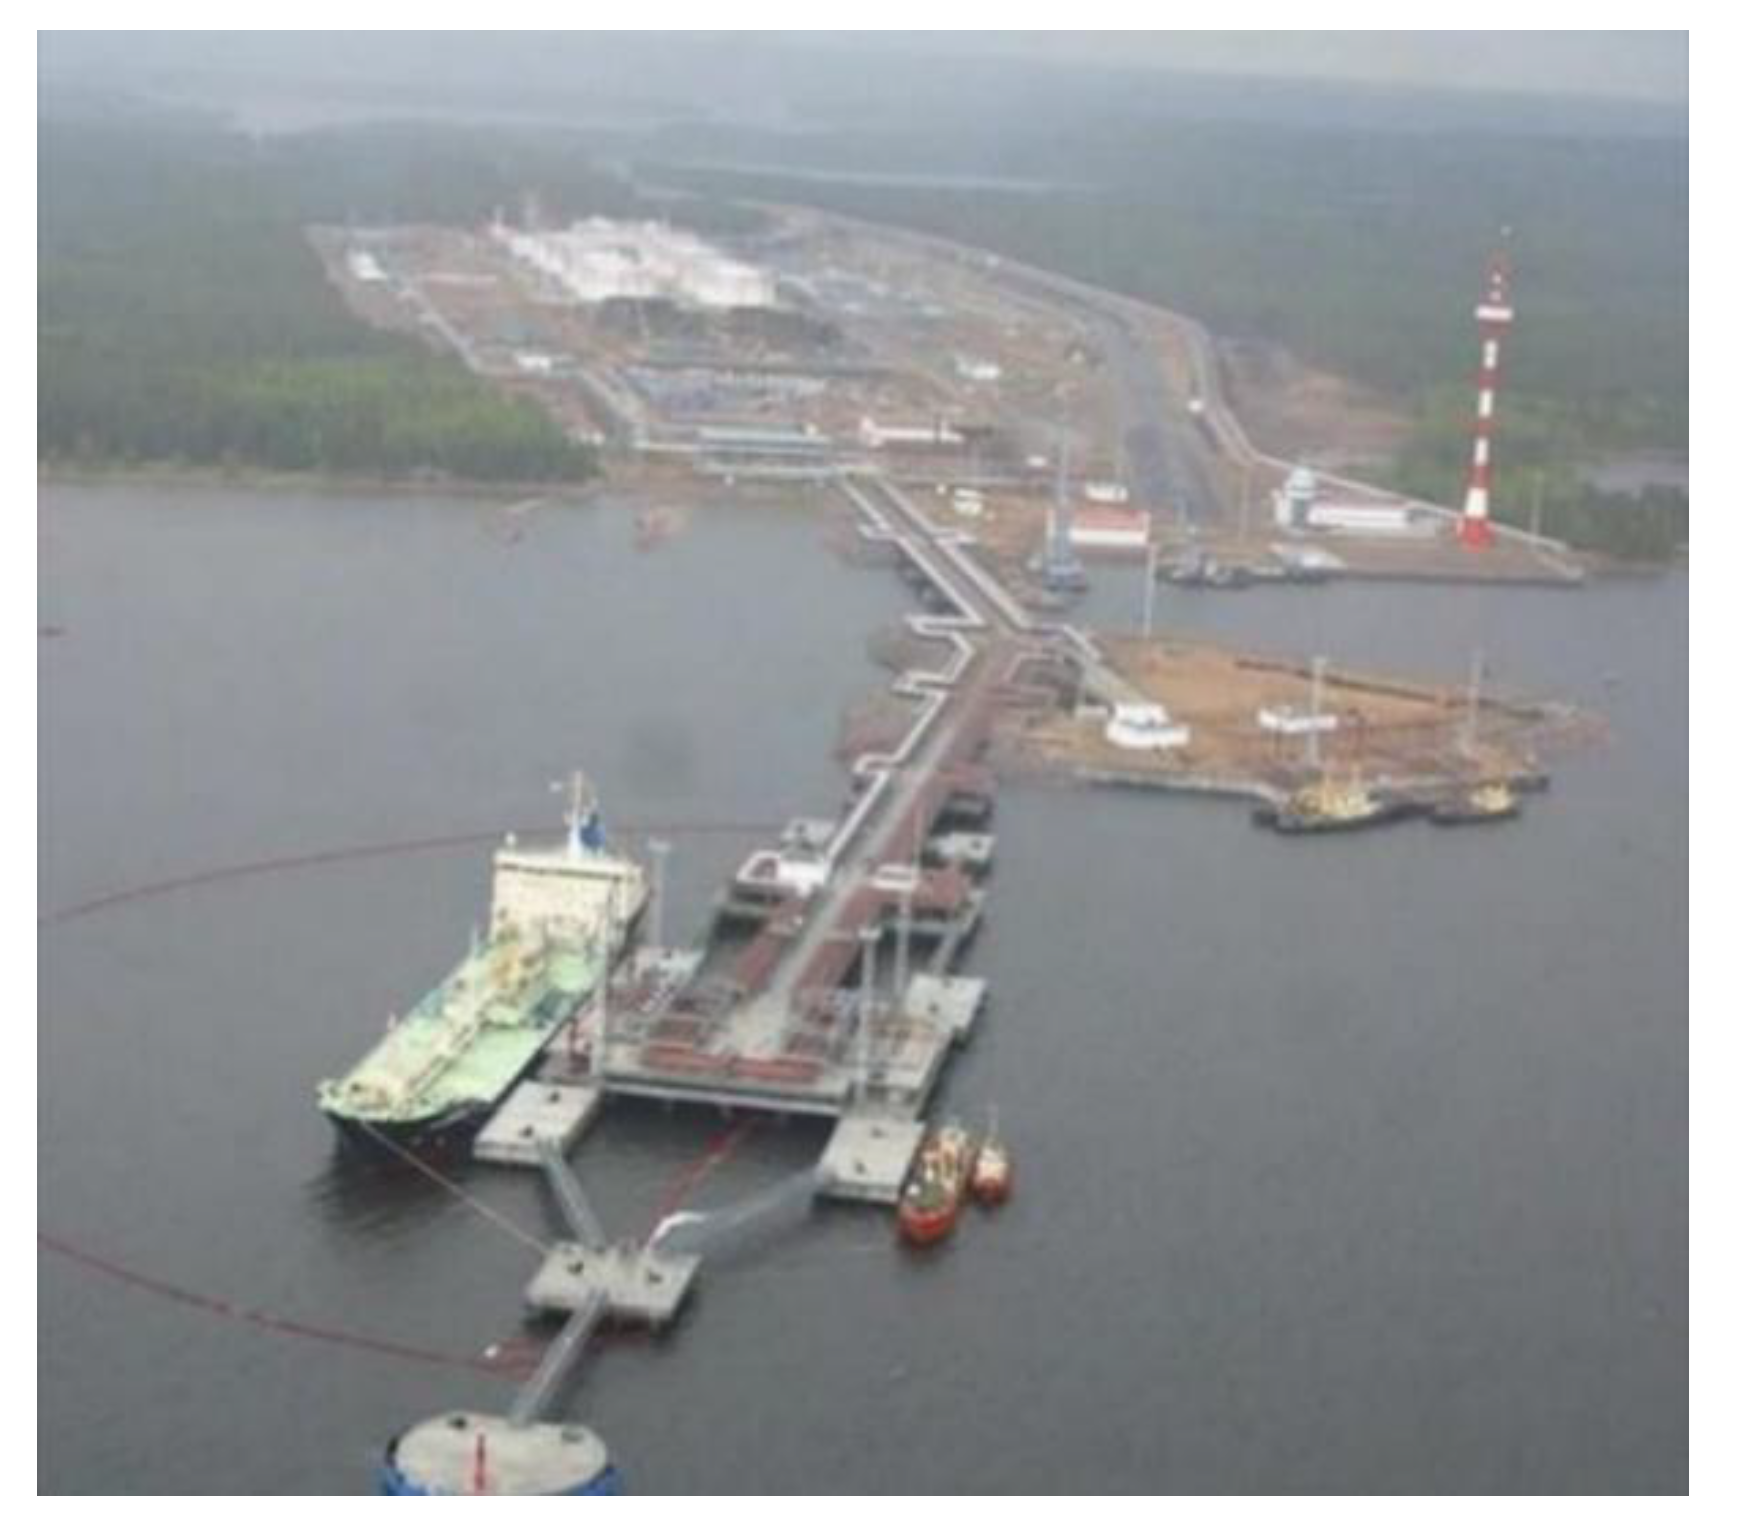
- Port of Primorsk. This port only handles oil products carried by Russian oil extraction and refining companies. The port of Primorsk handles the largest volumes of oil in the entire eastern Baltic Sea region. The trading port of Primorsk (see Figure 9) has been on the market for 12 years and has become one of Russia’s main oil terminals.Figure 9. Primorsk Commercial Sea Port. Source: [78].Figure 9. Primorsk Commercial Sea Port. Source: [78].The main characteristics of the port are as follows:
- the port now covers the area of 252 ha;
- the depth of the port entrance channel is 17.8 m;
- the length of port berths is 20.3 km, the number of berths—13 [79];
- cargo storage facilities in the port: crude oil storage tanks with a capacity of 500,000 tons and diesel for 240,000 tons;
- Port terminal capacity: the maximum estimated crude oil terminal capacity is 75 million tons per year and the diesel terminal—20 million tons per year;
- the port specializes in the handling of oil and oil products [79].
- Port of St. Petersburg. This port (see Figure 10) is currently one of the three main ports in Russia.Figure 10. Port of St. Petersburg. Source: [80].Figure 10. Port of St. Petersburg. Source: [80].The main characteristics of the port are as follows:
- the port now covers the area of 121.5 ha;
- the depth of the port entrance channel is 11 m;
- the length of port berths is 5.3 km, the number of berths—31 [81];
- cargo storage facilities in the port: area of covered warehouses—153,000 m², area of open storage sites—237,900 m², capacity of refrigerated cargo warehouses—14,200 tons [81];
- the port has various cargo terminals, including Ro-Ro and container terminals;
- cargo handled in the port includes ferrous metals, non-ferrous metals, scrap metal, mineral fertilizers, Ro-Ro cargo, bulk materials, liquid cargo, general cargo, containers and oversized cargo;
- port facilities: the port accepts 320 m long and 50 meter wide vessels with 11 m draft and the maximum tonnage of 40,000 DWT [81].
- Port of Kaliningrad. This port (see Figure 11) consists of two parts.Figure 11. Port of Kaliningrad. Source: [82].Figure 11. Port of Kaliningrad. Source: [82].One port is located in Kaliningrad, about 46 km from the sea and the entrance to the bay. Another Baltiskij port is located at the entrance to the bay, in the northern part of the Kaliningrad Canal.The main characteristics of the port are as follows:
- the port now covers the area of 230 ha;
- the depth of the port entrance channel is 9–10.5 m;
- the length of port berths is 2.5 km, the number of berths—19 [83];
- cargo storage capacity in the port: area of covered warehouses—44891.7 m2, area of open storage sites—238,275.8 m², area of frozen cargo warehouses—6192.3 m2 [83];
- the port has various cargo terminals, including a container terminal;
- cargo handled in the port: ferrous and non-ferrous metals, ro-ro cargo, bulk materials, liquid cargo, general cargo, containers and timber;
- the port is at the intersection of the branches of the trans-European transport corridors (No. 1A—”Riga–Kaliningrad–Gdansk” and No. 9D “Kiev–Minsk–Vilnius–Kaliningrad”) [83].
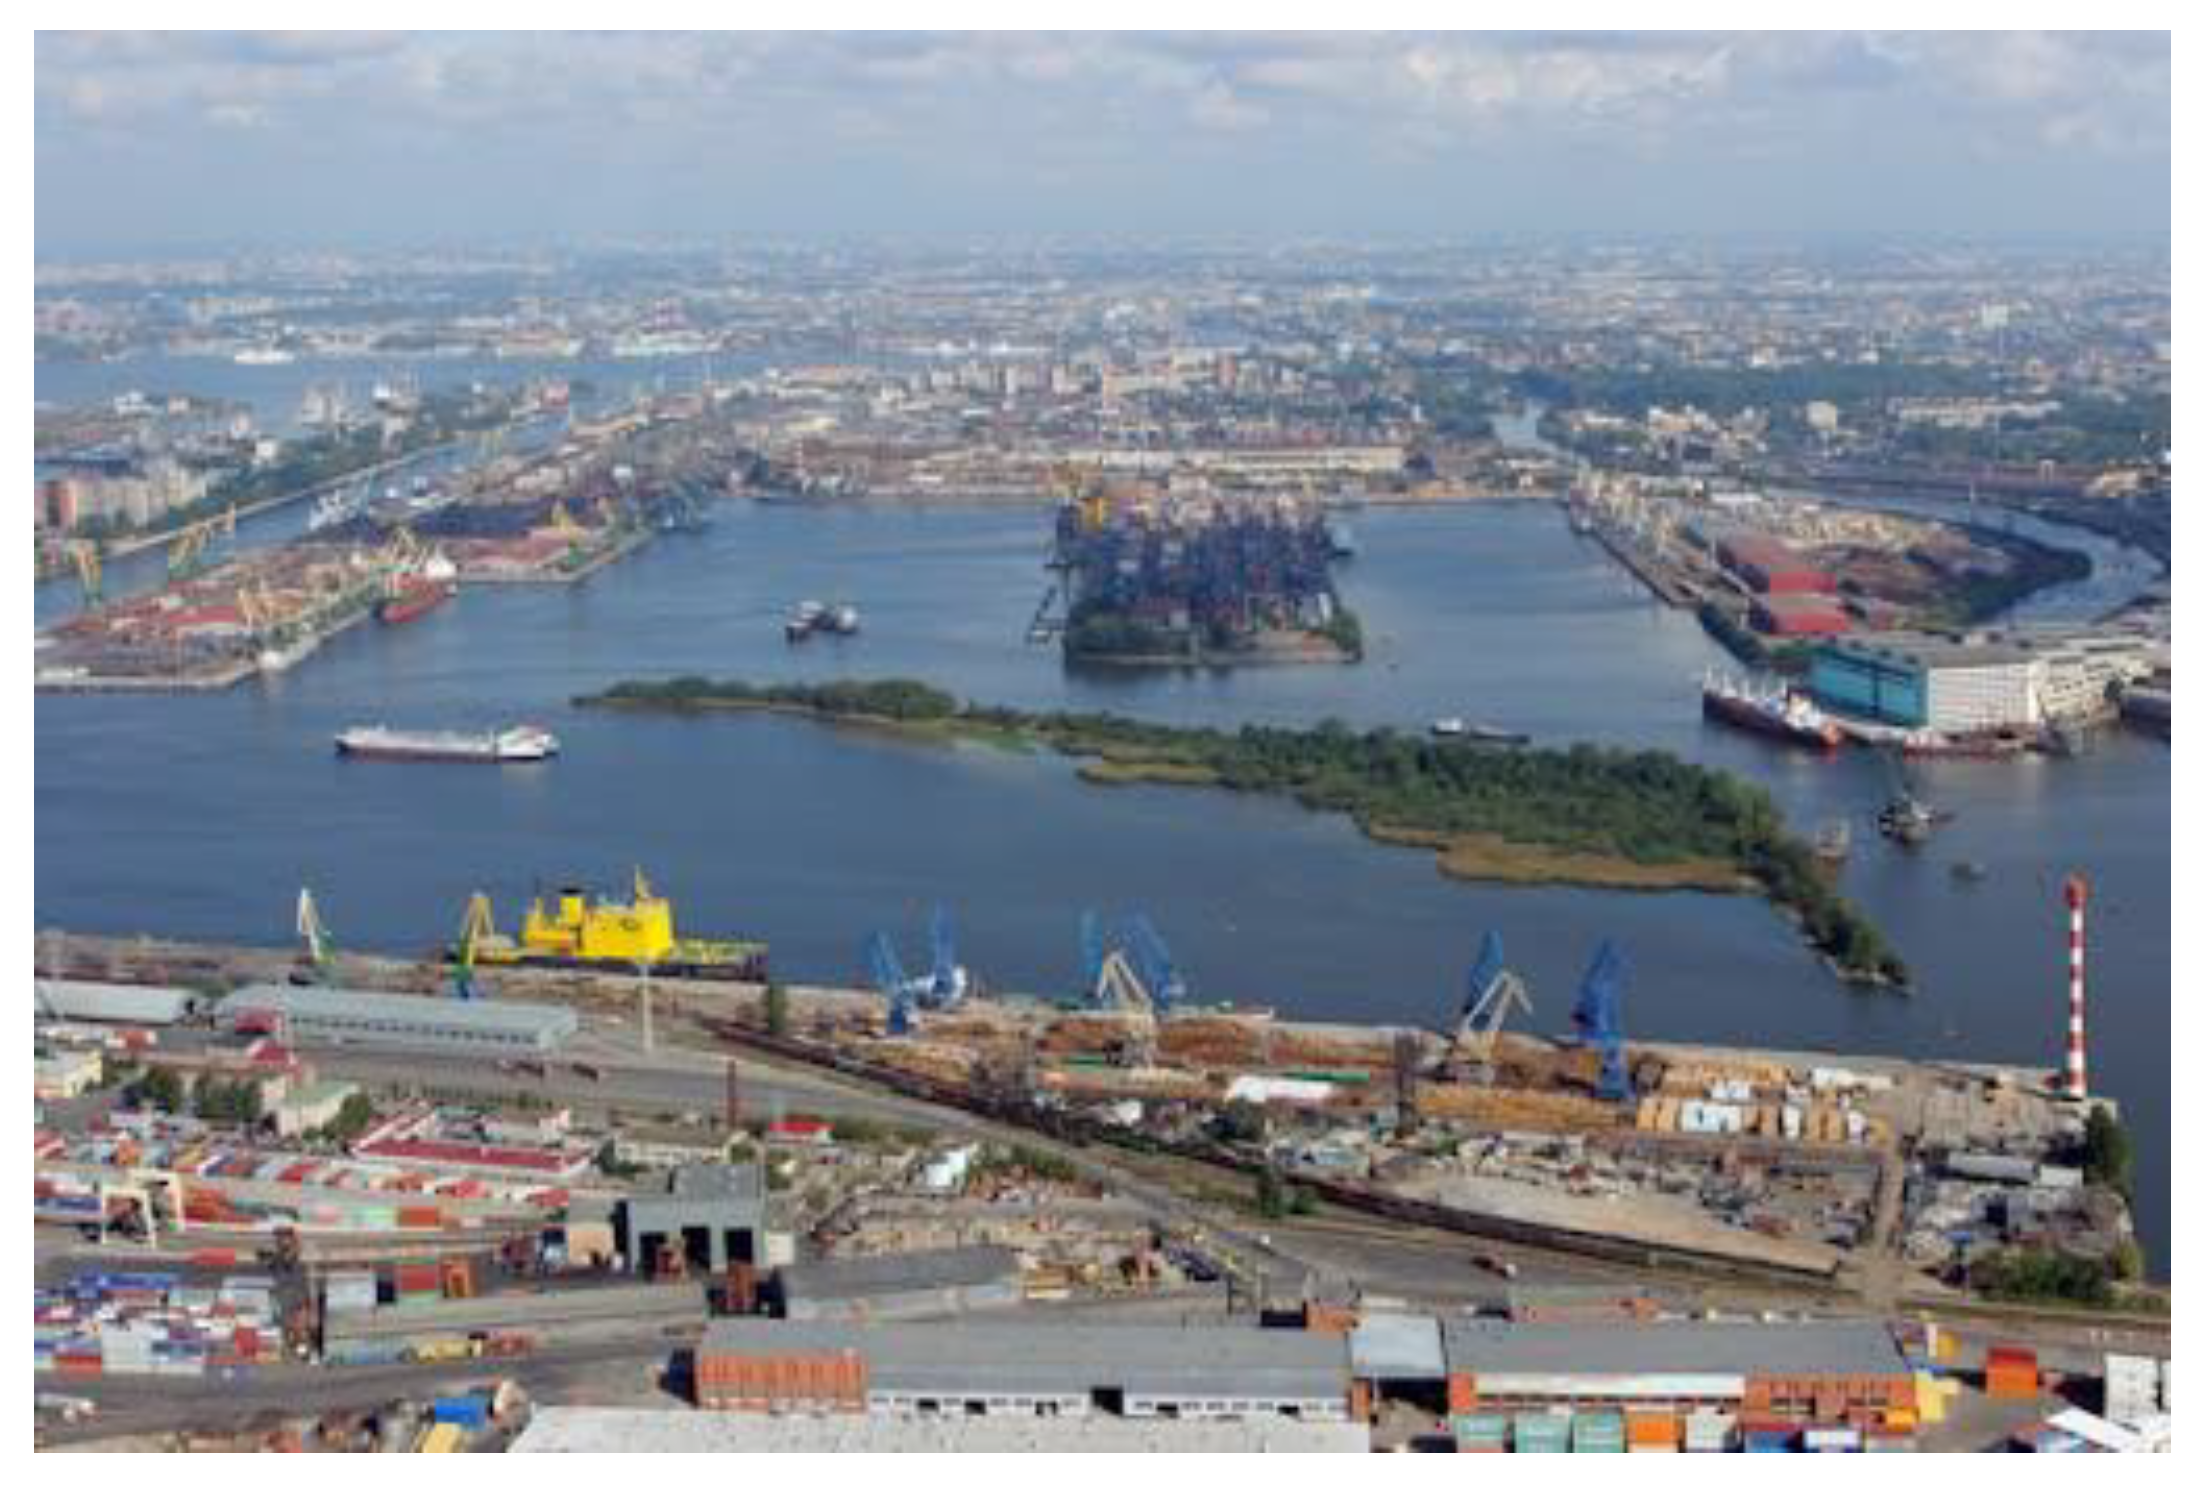
- Port of Visotsk. The sea port of Visotsk is located on Visotsky Island (Figure 12) in the Gulf of Finland, 90 km from St. Petersburg and 50 km from the Russian–Finnish border.Figure 12. Port of Visotsk. Source: [84].Figure 12. Port of Visotsk. Source: [84].The main characteristics of the port are as follows:
- the port now covers the area of 34.02 ha;
- the depth of the port entrance channel is 15.6 m;
- the length of port berths is 681 m, the number of berths—4 [85];
- cargo storage facilities in the port: the area of open storage sites covers 22 ha, allowing to store about 250,000 tons of bulk cargo at a time [85];
- the port has loading terminals adapted for bulk cargo handling;
- bulk cargo dominates in the port [85].
3. Results and Discussion
3.1. Infrastructure Parameters of Competing Ports
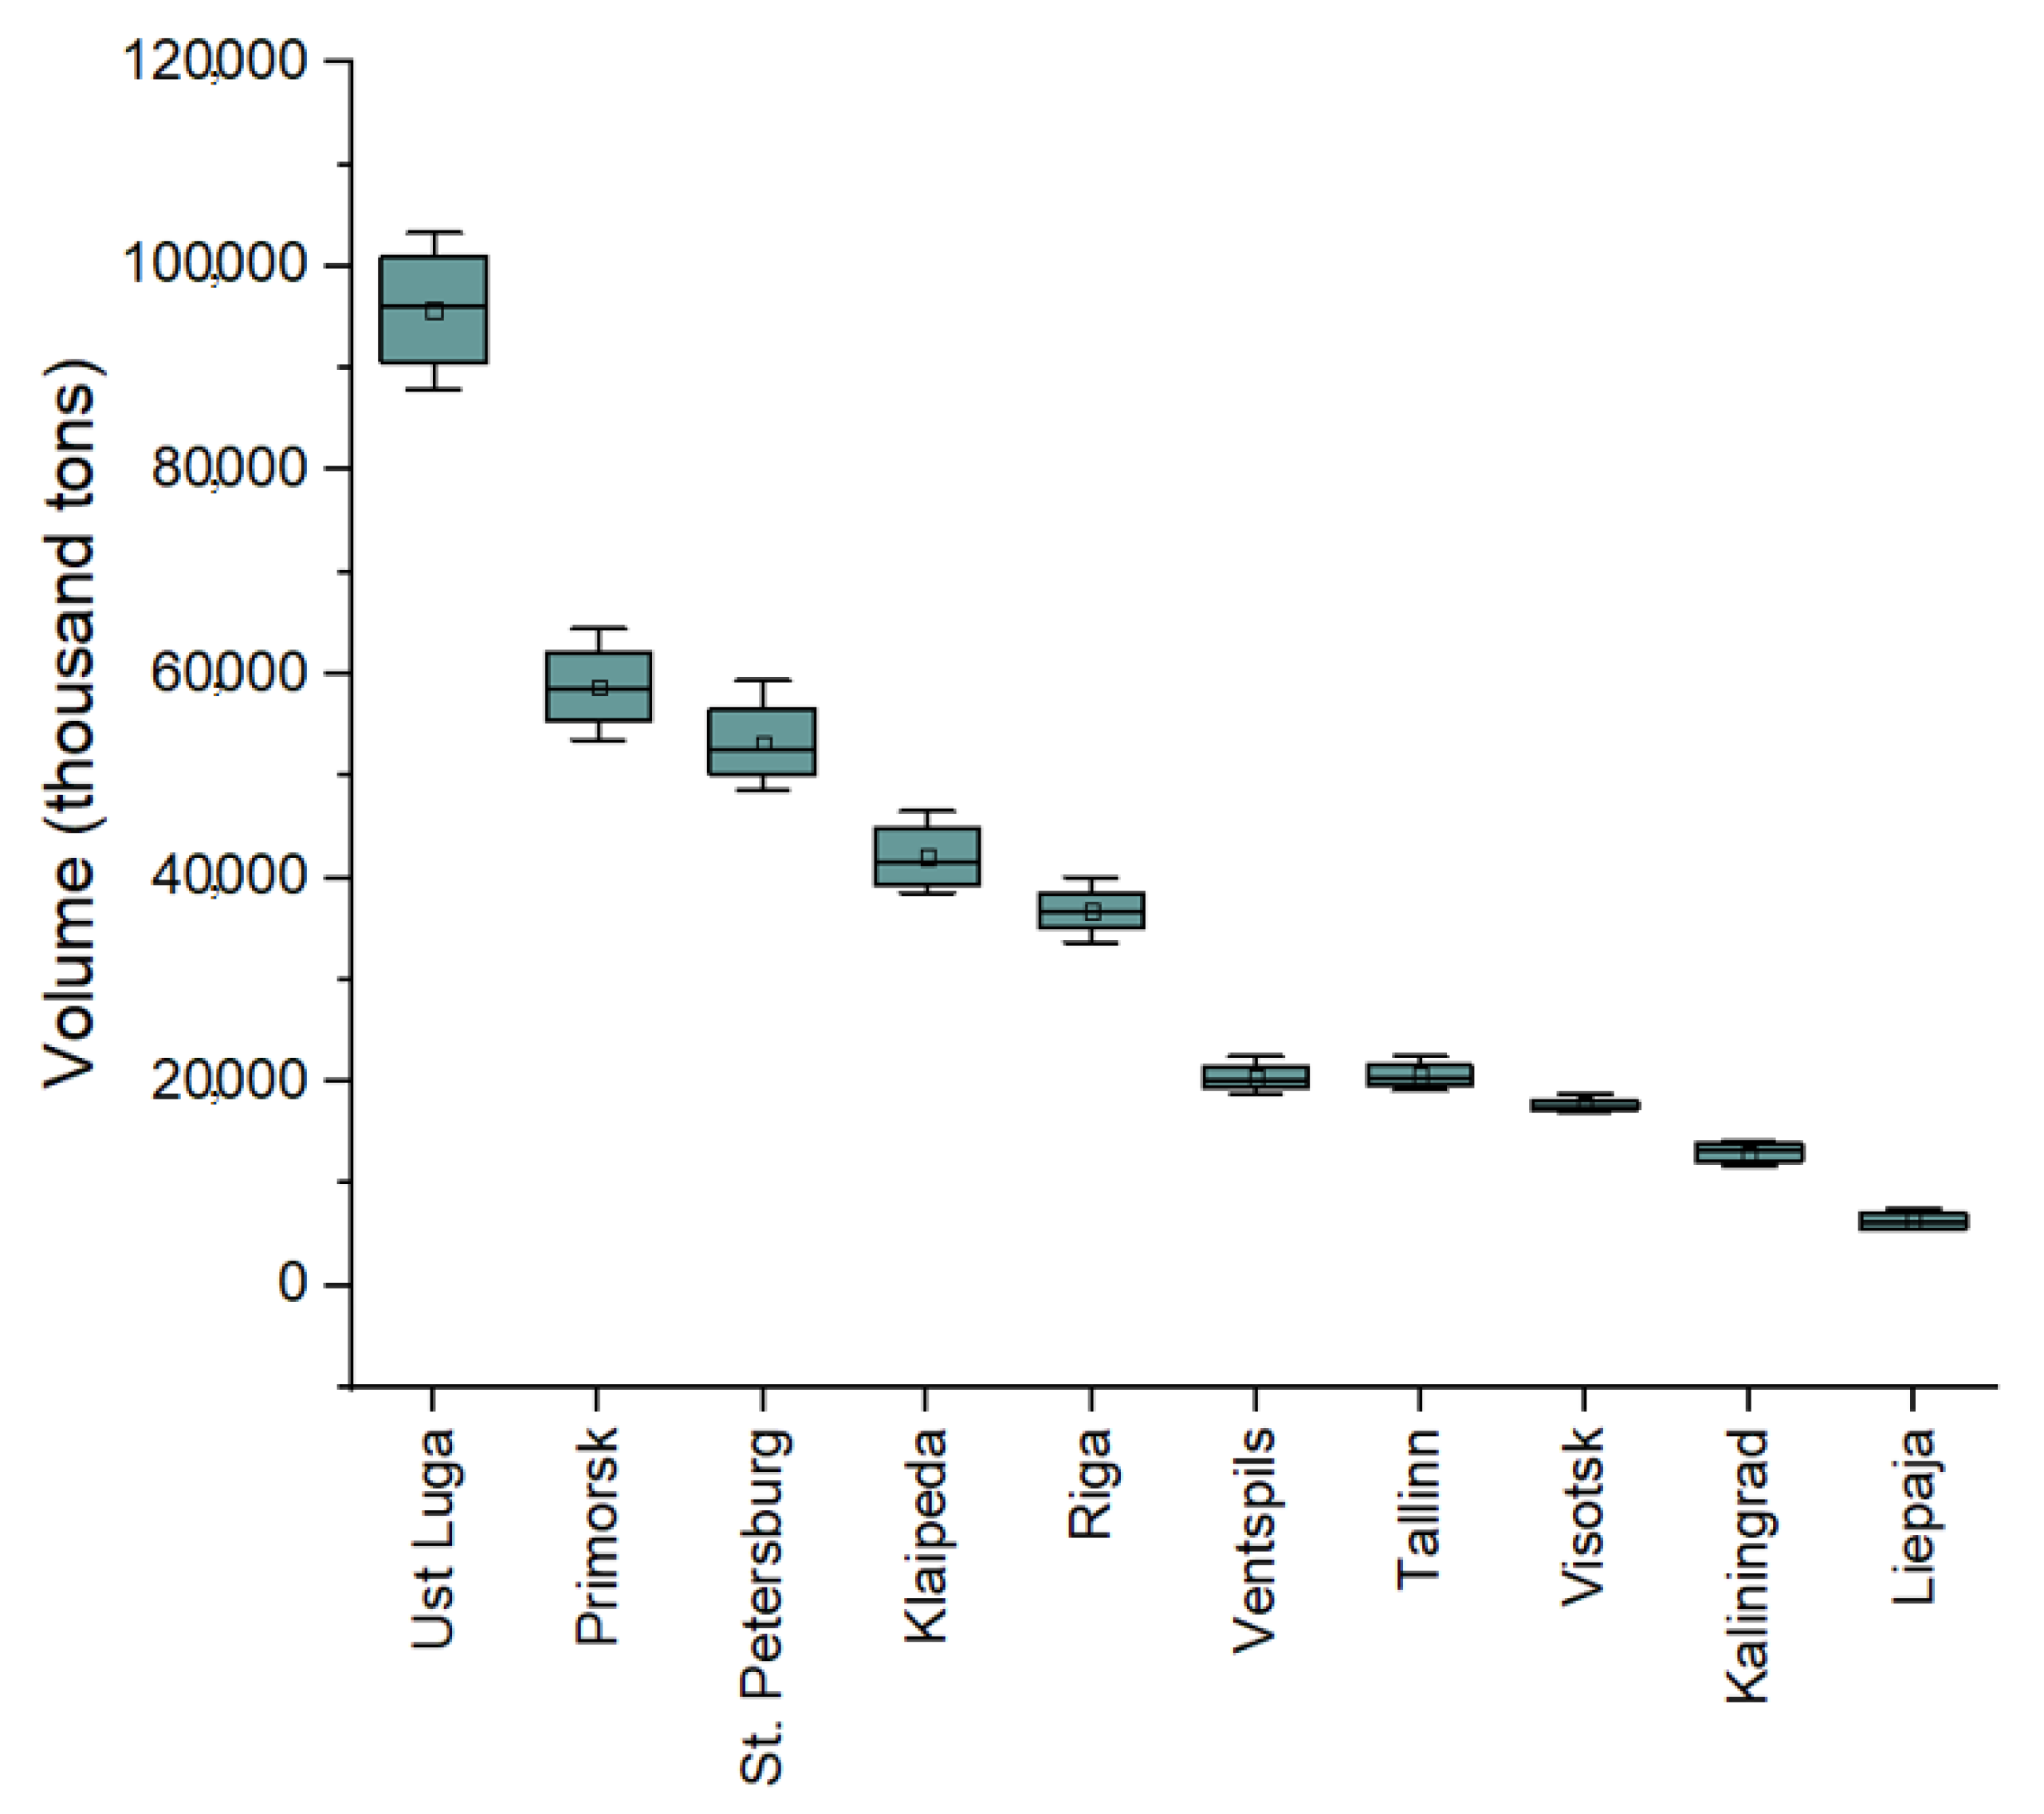
3.2. Cargo Flows in Ports of the Eastern Baltic Coast
3.3. Results of Correlation between Cargo Flows and the Selected Port Infrastructure Parameters
- In general (in terms of aggregates) the best use has been made of: (1) the maximum depth—in the port of Tallinn; (2) the length of quays—in the port of Kaliningrad. In general, however, the port of Visotsk looks best in terms of all the parameters. The correlation results show that the port of Visotsk is approaching the maximum use of its infrastructure capacity. Other parameters selected for the analysis do not correlate significantly with the distribution of cargo flows, which means that the available infrastructure capacity of the ports has not been used to the maximum.
- Before the pandemic, the best use has been made of: (1) covered warehouses (the ports of Ust Luga, Riga, Ventspils and Tallinn); (2) open warehouses (the port of Visotsk); (3) the number of quays (the ports of Tallinn, Ventspils, Visotsk and Riga); (4) the length of quays (the ports of Primorsk, St. Petersburg, Kaliningrad, Visotsk and Liepaja); (5) the maximum depth (the ports of Tallinn, Ventspils, Riga and Ust Luga); (6) the port area (the ports of Ventspils and Tallinn).
4. Conclusions
Author Contributions
Funding
Institutional Review Board Statement
Informed Consent Statement
Data Availability Statement
Conflicts of Interest
References
- Žimkus, R. Jūrų uosto Konkurencingumo Vertinimo Modelis: Klaipėdos Valstybinio jūrų uosto Atvejis. Magistro Darbas. [Seaport Competitiveness Evaluation Model: The Case of Klaipeda State Seaport]; Kaunas University of Technology: Kaunas, Lithuania, 2016. [Google Scholar]
- Talley, W. Optimum throughput and performance evaluation of marine terminals. Marit. Policy Manag. 1988, 15, 327–331. [Google Scholar] [CrossRef]
- Robinson, D. Measurements of Port Productivity and Container Terminal Design: A Cargo Systems Report; IIR Publications: London, UK, 1999. [Google Scholar]
- Cullinane, K. The productivity and efficiency of ports and terminals: Methods and applications. In The Handbook of Maritime Economics and Business; Grammenos, C., Ed.; LLP: London, UK, 2002; pp. 803–831. [Google Scholar]
- Coulson-Thomas, C. Leading a competitive company: Critical behaviors for competing and winning. Strateg. Dir. 2005, 21, 3–5. [Google Scholar] [CrossRef]
- Ng, A.K.Y.; Liu, J.J. The port and maritime industries in the post-2008 world: Challenges and opportunities. Res. Transp. Econ. 2010, 27, 1–3. [Google Scholar] [CrossRef]
- Merk, O. Competitiveness of Global Port Cities. 2011. Available online: https://www.oecd.org/gov/regional-policy/Competitiveness-of-Global-Port-Cities-Synthesis-Report.pdf (accessed on 2 September 2021).
- Álvarez-SanJaime, Ó.; Cantos-Sánchez, P.; Moner-Colonques, R.; Sempere-Monerris, J.J. Competition and horizontal integration in maritime freight transport. Transp. Res. E Logist. Transp. Rev. 2013, 51, 67–81. [Google Scholar] [CrossRef]
- Aleknevičienė, V. Įmonės Finansų Valdymas [Company Financial Management]; Spalvų Kraitė: Kaunas, Lithuania, 2011. [Google Scholar]
- Bagdonas, E.; Railienė, G. Finansų Valdymo Sprendimai [Financial Management Solutions]; KTU Technologija: Kaunas, Lithuania, 2013. [Google Scholar]
- Bagdžiūnienė, V. Apskaitos Sąvokos [Accounting Concepts]; Conto Litera: Vilnius, Lithuania, 2013. [Google Scholar]
- Broyles, J. Financial Management and Real Options; John Wiley & Sons Ltd: Chichester, UK, 2003. [Google Scholar]
- Bružauskas, V. Finansinės atskaitomybės ekspres analizė [Express analysis of financial statements]. In Apskaitos, Audito ir Mokesčių Aktualijos [Topical Issues of Accounting, Auditing and Taxation]; Conto Litera: Vilnius, Lithuania, 2004; Volume 12, pp. 14–19. [Google Scholar]
- Buškevičiūtė, E.; Kanapickienė, R.; Patašius, M. Finansinių Rezultatų Analizė [Analysis of Financial Results]; Technologija: Kaunas, Lithuania, 2010. [Google Scholar]
- Buškevičiūtė, E.; Mačerinskienė, I. Finansų Analizė [Financial Analysis]; Technologija: Kaunas, Lithuania, 2015. [Google Scholar]
- De Langen, P.W.; van der Lugt, L.M. Institutional reforms of authorities in the Netherlands: The establishment of port development companies. Res. Transp. Bus. Manag. 2017, 22, 108–113. [Google Scholar] [CrossRef]
- Arvis, J.-F.; Vesin, V.; Carruthers, R.; Ducruet, C.; de Langen, P. Maritime Networks, Port Efficiency, and Hinterland Connectivity in the Mediterranean. International Development in Focus; World Bank: Washington, DC, USA, 2019; Available online: https://openknowledge.worldbank.org/handle/10986/30585 (accessed on 25 August 2021).
- Ibrahimi, K. A theoretical framework for conceptualizing seaport as institu—tional and operational clusters. Transp. Res. Proc. 2017, 25, 261–278. [Google Scholar] [CrossRef]
- Valionienė, E. Jūrų Transporto Sektoriaus Patrauklumo Vertinimas Teorinio jūrų uosto Valdymo Modelio Pagrindu. Daktaro Disertacija [Assessment of the Maritime Transport Sector Attractiveness on the Basis of Theoretical Seaport Governance Model]; MRU: Vilnius, Lithuania, 2020. [Google Scholar]
- Nemuraitė, L. Klaipėdos Valstybinio jūrų uosto Konkurencingumo Tyrimas. Baigiamasis Magistro Darbas [Klaipėda State Seaport Competitiveness Research]; VGTU: Vilnius, Lithuania, 2011. [Google Scholar]
- Noritake, M.; Kimura, S. Optimum number and capacity of seaport berths. Waterw. Port Coast. Ocean Eng. 1983, 109, 323–339. [Google Scholar] [CrossRef]
- Sölvell, Ö. The Dynamic Firm: The Role of Technology, Strategy, Organizations, and Regions; Oxford University Press: New York, NY, USA, 2015. [Google Scholar]
- Sölvell, Ö. The Competitive Advantage of Nations 25 years—opening up new perspectives on competitiveness. Competitiven. Rev. 2015, 25, 471–481. [Google Scholar] [CrossRef]
- Puidokas, M.; Andriuškaitė, L. Klaipėdos valstybinio jūrų uosto transporto politikos analizė pozicionuojant Lietuvą kaip jūrinę [Lithuanian Maritime State Position Strengthening: The Role of Klaipėda State Seaport in the Context of Lithuanian Transport Policy] valstybę. Viešoji Polit. Ir Adm. 2012, 11, 404–419. [Google Scholar]
- Bogatova, J. Baltijos šalių jūros uostų veiklos ekonominis vertinimo modelis. Reg. Form. Dev. Stud. 2016, 18, 7–22. [Google Scholar] [CrossRef][Green Version]
- Ramanauskas, G. Evaluation of International Competitiveness. Ekonomika 2004, 68, 91–112. [Google Scholar] [CrossRef]
- Abbes, S. Seaport competitiveness: A comparative empirical analysis between North and West African countries using principal component analysis. Int. J. Transp. Econ. 2015, 42, 289–314. Available online: https://www.researchgate.net/publication/289472095_Seaport_competitiveness_A_comparative_empirical_analysis_between_North_and_West_African_countries_using_principal_component_analysis (accessed on 7 September 2021).
- Konvisarova, E.V.; Levchenko, T.A.; Pustovarov, A.A. Theoretical and Methodological Approaches to the Supply Chain Strategies Role and Analysis of Seaport Competitiveness in the Far East of Russia. Int. J. Supply Chain. Manag. 2019, 8, 493–498. [Google Scholar]
- Munim, Z.H.; Saeed, N. Seaport competitiveness research: The past, present and future. Int. J. Shipp. Transp. Logist. 2019, 11, 533–557. [Google Scholar] [CrossRef]
- Talley, W. Performance indicators and port performance evaluation. Logist. Transp. Rev. 1994, 30, 339–352. [Google Scholar]
- Tabernacle, J. A study of the changes in performance of quayside container cranes. Marit. Policy Manag. 1995, 22, 115–124. [Google Scholar] [CrossRef]
- Tongzon, J. Determinants of port performance and efficiency. Transp. Res. Part A Policy Pract. 1995, 29, 245–252. [Google Scholar] [CrossRef]
- Kim, K. Evaluation of the number of rehandles in container yards. Comput. Ind. Eng. 1997, 32, 701–711. [Google Scholar] [CrossRef]
- Kim, K.H.; Bae, J.W. Re-marshaling export containers in port container terminals. Comput. Ind. Eng. 1998, 35, 655–658. [Google Scholar] [CrossRef]
- Kim, K.H.; Kim, H.B. The optimal determination of the space requirement and the number of transfer cranes for import containers. Comput. Ind. Eng. 1998, 35, 427–430. [Google Scholar] [CrossRef]
- Wilson, I.D.; Roach, P.A. Container stowage planning: A methodology for generating computerised solutions. J. Oper. Res. Soc. 2000, 51, 1248–1255. [Google Scholar] [CrossRef]
- De Monie, G. Measuring and evaluating port performance and productivity. In UNCTAD Monographs on Port Management; UNCTAD: Geneva, Switzerland, 1987. [Google Scholar]
- Baird, A. Port Privatisation: Objectives, Extent, Process, and the UK Experience. Marit Econ Logist 2. Int. J. Marit. Trade Econ. 2000, 2, 177–194. [Google Scholar] [CrossRef]
- Cullinane, K.; Song, D.-W. Port privatisation: Principles and practice. Transp. Rev. 2002, 22, 55–75. [Google Scholar] [CrossRef]
- Jacobs, W. Political Economy of Port Competition: Institutional Analyses of Rotterdam, Dubai and Southern California; Academic Press Europe: Nijmegen, The Netherlands, 2007; Available online: https://www.academicpresseurope.com (accessed on 7 September 2021).
- Theys, C.H.; Notteboom, T.E.; Pallis, A.A.; De Langen, P.W. The economics behind the awarding of terminals in seaports: Toward a research agenda. Res. Transp. Econ. 2010, 27, 37–50. [Google Scholar] [CrossRef]
- Van Reeven, P. The effect of competition on economic rents in seaports. J. Transp. Econ. Policy 2010, 44, 79–92. Available online: https://www.jstor.org/stable/40599984 (accessed on 7 September 2021).
- Haralambides, H. Globalization, public sector reform, and the role of ports in international supply chains. Marit. Econ. Logist. 2017, 19, 1–51. [Google Scholar] [CrossRef]
- Haralambides, H. Gigantism in container shipping, ports and global logistics: A time-lapse into the future. Marit. Econ. Logist. 2019, 21, 1–60. [Google Scholar] [CrossRef]
- Notteboom, T.E.; Winkelmans, W. Structural changes in logistics: How will port authorities face to challenge? Marit. Policy Manag. 2001, 28, 71–89. [Google Scholar] [CrossRef]
- Notteboom, T.; Winkelmans, W. Reassessing Public Sector Involvement in European Seaports. Marit. Econ. Logist. 2001, 3, 242–259. [Google Scholar] [CrossRef]
- Notteboom, T. Concession agreement as port governance tools. In Devolution Port Governance and Port Performance. Research and Transportation Economic; Elsevier JAI: Amsterdam, The Netherlands, 2007; pp. 437–455. [Google Scholar]
- Notteboom, T. The adaptive capacity of container ports in era of mega vessels: The case of upstream seaports Antwerp and Hamburg. J. Transp. Geogr. 2016, 54, 295–309. [Google Scholar] [CrossRef]
- Notteboom, T.E.; De Langen, P.; Jackobs, W. Institutional plasticity and path dependence in seaports: Interactions between institutions, port governance reforms and port authority routines. J. Transp. Geogr. 2013, 27, 26–35. [Google Scholar] [CrossRef]
- Notteboom, T.E.; Parola, F.; Satta, G.; Penco, L. Disclosure as a tool in stakeholder relations management: A longitudinal study on the port of Rotterdam. Int. J. Logist. Res. Appl. 2015, 18, 228–250. [Google Scholar] [CrossRef]
- Baird, A. Public goods and the public financing of major European seaports. Marit. Policy Manag. 2004, 31, 375–391. [Google Scholar] [CrossRef]
- Pallis, A. Towards a common ports policy? EU—proposals and the ports industry’s perceptions. Marit. Policy Manag. 1997, 24, 365–380. [Google Scholar] [CrossRef]
- Pallis, A. EU port policy: Implications for port governance in Europe. In Devolution Port Governance and Port Performance; JAI Press Inc.: Stamford, CT, USA, 2007; Volume 17, pp. 479–495. [Google Scholar]
- Pallis, A.A.; Vitsounis, T.H.K.; De Langen, P.W.; Notteboom, T.E. Port economics, policy and management: Content classification survey. Transp. Rev. 2011, 31, 445–471. [Google Scholar] [CrossRef]
- Pallis, A.A.; Vaggelas, G.K. A Greek prototype of port governance. Res. Transp. Bus. Manag. 2017, 22, 49–57. [Google Scholar] [CrossRef]
- Available online: https://datascience.stackexchange.com/questions/64260/pearson-vs-spearman-vs-kendall/64261 (accessed on 15 September 2021).
- Čekanavičius, V.; Murauskas, G.; Tatarinavičiūtė. Statistika ir Jos Taikymai II; TEV: Vilnius, Lithuania, 2000. [Google Scholar]
- Point–Biserial Correlation. Available online: https://towardsdatascience.com/kendall-rank-correlation-explained-dee01d99c535 (accessed on 15 September 2021).
- Chok, N.S. Pearson’s Versus Spearman’s and Kendall’s Correlation Coefficients for Continuous Data. Master’s Thesis, University of Pittsburgh, Pittsburgh, PA, USA, 2010, unpublished. [Google Scholar]
- Baublys, A.; Vasilis Vasiliauskas, A. Transporto Infrastruktūra; Technika: Vilnius, Lithuania, 2011. [Google Scholar]
- Bentyn, Z. Poland as an regional logistic hub serving the development of northern corridor of the new silk route. JMML 2016, 3, 135–144. [Google Scholar] [CrossRef]
- Aktualijos Investuotojams. Kiek Pelningi yra Pervežimai Jūrų Transportu Šiuolaikiniame Pasaulyje? Available online: http://www.profi-forex.lt/news/entry3000000697.html (accessed on 9 August 2021).
- Klaipėdos Uostas [Port of Klaipeda]. Available online: https://www.portofklaipeda.lt/news/15088/569/ (accessed on 15 September 2021).
- Skerys, K.; Christauskas, J. Transporto Statiniai: Uostai; VGTU: Vilnius, Lithuania, 2010. [Google Scholar] [CrossRef]
- Lietuvos Jūrų Krovos Kompanijų Asociacija. Available online: https://www.ljkka.lt/uosto-pletra (accessed on 5 October 2021).
- Klaipėdos Uostas [Port of Klaipeda]. Available online: https://www.portofklaipeda.lt/galimybes (accessed on 17 August 2021).
- Klaipėdos Uostas [Port of Klaipeda]. Available online: https://www.portofklaipeda.lt/klaipedos-uostas (accessed on 17 August 2021).
- Latvia’s Port of Riga Two-Month Cargo Volume Rises 4.7% to 6.83 Million Tons March 2015. Logistik Navigator. Available online: http://navilog.ru/en/latvias-port-of-riga-two-month-cargo-volume-rises-4-7-to-6-83-million-tons/ (accessed on 18 September 2021).
- Freeport of Riga. Freeport of Riga. Available online: https://rop.lv/en/about-port/history.html (accessed on 4 October 2021).
- Port in General. Porto Ventspils. Available online: https://www.portofventspils.lv/en/port-in-general/ (accessed on 29 August 2021).
- Žaromskis, R. Baltijos Jūros Uostai; Vilniaus Universitetas: Vilnius, Lithuania, 2008. [Google Scholar]
- Marine Traffic. Port of LIEPAJA (LV LPX) Details. Available online: https://www.marinetraffic.com/en/ais/details/ports/1629/Latvia_port:LIEPAJA (accessed on 16 September 2021).
- Morskoj Port Liepaja. Available online: https://portsinfo.ru/ports/88-port-latvii/1186-morskoj-port-liepaya (accessed on 15 September 2021).
- Port of Tallinn. Available online: https://www.ts.ee/en/muuga-harbour (accessed on 18 August 2021).
- Port of Tallinn. Available online: https://www.ts.ee/en/our-ports/ (accessed on 18 August 2021).
- Oil Contamination Issues Hit Russian Port of Ust-Luga. The Maritime Executive. Available online: https://www.maritime-executive.com/article/oil-contamination-issues-hit-russian-port-of-ust-luga (accessed on 27 September 2021).
- PortNews. Available online: https://en.portnews.ru/news/282009/ (accessed on 14 October 2021).
- Public-Welfare. Available online: https://en.public-welfare.com/4343541-where-is-primorsk-how-many-cities-bear-this-name-and-where-are-they-located (accessed on 14 October 2021).
- Eisa-Shipping Agencies. Available online: https://www.eisa-moscow.ru/port/primorsk/ (accessed on 7 July 2021).
- Safaty4sea. Port of Saint Petersburg Starts Social Program. Available online: https://safety4sea.com/port-of-saint-petersburg-starts-social-program/ (accessed on 17 September 2021).
- Sea Port of Saint-Peterbung. Available online: http://www.en.seaport.spb.ru/ (accessed on 15 September 2021).
- Kaliningrad Sea Commercial Port. Port today. Available online: http://www.kscport.ru/index.php/en/about/port-today (accessed on 14 September 2021).
- Kalliningrad Sea Commercial Port. Available online: http://www.kscport.ru/index.php/en/ (accessed on 26 September 2021).
- Marine Traffic. Available online: https://www.marinetraffic.com/en/photos/of/ports/photo_keywords:2246/ports (accessed on 16 August 2021).
- Port Vysotsky. Limited Liability Company “Port Vysotsky”. Available online: https://port-vysotsky.ru/?page_id=377 (accessed on 18 August 2021).



Publisher’s Note: MDPI stays neutral with regard to jurisdictional claims in published maps and institutional affiliations. |
© 2021 by the authors. Licensee MDPI, Basel, Switzerland. This article is an open access article distributed under the terms and conditions of the Creative Commons Attribution (CC BY) license (https://creativecommons.org/licenses/by/4.0/).
Share and Cite
Liebuvienė, J.; Čižiūnienė, K. Comparative Analysis of Ports on the Eastern Baltic Sea Coast. Logistics 2022, 6, 1. https://doi.org/10.3390/logistics6010001
Liebuvienė J, Čižiūnienė K. Comparative Analysis of Ports on the Eastern Baltic Sea Coast. Logistics. 2022; 6(1):1. https://doi.org/10.3390/logistics6010001
Chicago/Turabian StyleLiebuvienė, Jūratė, and Kristina Čižiūnienė. 2022. "Comparative Analysis of Ports on the Eastern Baltic Sea Coast" Logistics 6, no. 1: 1. https://doi.org/10.3390/logistics6010001
APA StyleLiebuvienė, J., & Čižiūnienė, K. (2022). Comparative Analysis of Ports on the Eastern Baltic Sea Coast. Logistics, 6(1), 1. https://doi.org/10.3390/logistics6010001


