Abstract
Truck platooning involves a small convoy of freight vehicles using electronic coupling as an application in automated driving technology, and it is expected to represent a major solution for improving efficiency in truck transportation in the near future. Recently, there have been several trials regarding truck platooning with major truck manufacturers and logistics companies on public roads in the United States, European countries and Japan. There is a need to locate a facility for the formation of truck platooning to realize the unmanned operation of trucks following in a platoon. In this study, we introduce the current status of truck platooning in Japan and present the optimal location model for truck platooning using the continuous approximation model with a numerical experiment, considering the case in Japan. We derived the optimal locational strategy for the combination of the long-haul ratio and the cost factor of platooning. With parameters estimated for several scenarios for the deployment of truck platooning in Japan, the numerical results show that the optimal locational strategy for a platoon of manned vehicles and a platoon with unmanned following vehicles is the edge of the local region, and that for a platoon of fully automated vehicles is the center of the region.
1. Introduction
In the context of the current global trend toward sustainable development, sustainability is becoming more important in supply chain management (SCM) and for the natural environment. Green SCM has become one of the significant issues in the global logistics system, and efforts have been made to reduce the emissions of environmental burdens and greenhouse gas (GHG) emissions in supply chains [1]. Additionally, in Japan, various sectors, including freight transportation, face labor shortages under the condition of a declining and aging population with a low birthrate. As the insufficiency caused by this labor shortage in supply side has not caught up with increasing demand on the consumer side, such as in e-commerce, home-delivery, etc., some action needs to be taken to maintain balance in freight transportation.
One of the possible countermeasures for sustainable and efficient SCM is automation in freight transportation. In recent years, the development of various new technologies related to automation has progressed rapidly around the world to improve labor-savings and efficiency in freight transportation. Among the recent key trends and innovations in SCM, one of the technologies with the highest impact is self-driving vehicles (SDVs) [2]. In order to implement SDVs, it is necessary to integrate new technologies, such as Artificial Intelligence (AI) and the Internet of Things (IoT), as well as to comply with laws and regulations focusing on safe driving in each country. In the logistics industry, SDVs are expected to be used in a variety of transportation, from long-distance trucking to last-mile delivery. Fully automated vehicles (FAVs) are already being used in completely closed environments such as mines and ports, while on public roads, demonstration tests are still being conducted in limited areas under legal restrictions. As a major solution for improving the efficiency of long-haul trucking, truck platooning, which involves a small convoy of freight vehicles using electronic coupling with semi-automated driving, has been under technological development since the early 2000s [3]. Truck platooning is expected to reduce environmental burdens by reducing the air resistance of following trucks and could be a possible solution for the labor shortage problem.
In this decade, several trials have been conducted for truck platooning with major truck manufacturers and logistics companies on the public roads in the United States, European countries and Japan. In Europe, the Netherlands is taking the initiative to conduct large-scale field operational tests for the cross-border transportation [4] and R&D related to the development of inter-manufacturer-standard specifications by six major truck manufacturers [5]. In Germany, a field operational test of truck platooning on an expressway has been conducted with the involvement of logistics companies [6]. In the UK, the world’s first platooning trials took place in a commercial operating environment to quantify real-world benefits [7]. The deployment of multi-brand platooning with unmanned following vehicles is assumed to be part of the roadmap for truck platooning in Europe by the end of 2021 [8]. In the United States, the key performance measures for evaluating truck platooning field deployments have been proposed by the government [9], and the operational tests of truck platooning with unmanned following vehicles have recently made steady progress in some commercial services [10]. In Japan, field operational tests on expressways have been conducted with manned following vehicles since 2017 and unmanned following vehicles since 2018 [11]. The trials in Europe mainly focus on manned operations, but those in the United States and Japan intend to include unmanned operations.
For the introduction of unmanned truck platooning, infrastructure improvement, laws and regulations and commercialization have been discussed. In particular, the truck platooning trials conducted in Japan revealed some issues related to infrastructure. For example, there is a need for a dedicated or prioritized lane for truck platooning and a facility for the formation of truck platooning to switch the drivers in the following truck in the platoon. Bhoopalam et al. [12] provided a framework to classify various new transportation planning problems that arise in truck platooning, as well as surveying relevant operational research models for these problems in the literature. In an overview of previous optimization studies of truck platooning schemes, literature on the planning, scheduling and routing of the operational side of truck platooning has been proposed, but research on facility locations on the strategic side has been quite limited. Therefore, this research focuses on facility locations for the formation of truck platooning for unmanned truck platooning. Continuous approximation (CA) is an efficient and effective technique for modeling complex and uncertain logistics problems, especially in the areas of facility locations [13]. In this study, we introduce the current status of truck platooning trials in Japan and summarize the related plan of truck platooning formation. Considering the case of the unmanned truck platooning system in Japan, we present an optimal location analysis to minimize the total operation cost of truck platooning using the CA model and discuss the implications of the computational results with a numerical experiment of the case of Japan.
2. Literature Review
In the formation of platoons, complex planning problems may arise, and sophisticated decision support models and tools are required in the planning, such as the scheduling and routing of platoons. Bhoopalam et al. [12] provided a framework to classify various new transportation planning problems that arise in truck platooning and surveyed relevant operations research models for these problems in the literature. For the scheduling problem, Larsson et al. [14] presented a mathematical framework to formulate and analyze the platoon coordination and departure time scheduling problems under the condition of travel time uncertainty. Larsen et al. [15] presented a model for optimizing truck platoons formed at a platooning hub—that is, a fixed location—using a dynamic programming-based local search heuristic. In the factors of fuel consumption, Zhang et al. [16] summarized the methodologies about fuel savings for truck platooning, the coordination methods to improve the platooning rate and the look-ahead control strategies to generate fuel-efficient speed profiles for each vehicle driving in a platoon over different road conditions.
As a case study for truck platooning operation in a specific region, some simulation models that consider the regional logistics system have been proposed. Gerrits et al. [17] presented the design and implementation of an agent-based simulation model based on the Port of Rotterdam in the Netherlands and its surrounding expressways to study the potential benefits of truck platooning. The results showed that the most influential factors in platoon formation and the total platoon profitability are wage savings and the possibility of different truck brands platooning together. Jo et al. [18] analyzed the influence of truck platooning on the performance of freeway networks in terms of travel time savings based on the integration of a microscopic and macroscopic approach in Korea and observed that truck platooning would result in annual benefits of travel time savings corresponding to approximately USD 167.7 million in 2020. Paddeu et al. [19] investigated the potential for truck platooning to reduce carbon emissions from road freight in UK, presenting a series of scenarios that varied by adoption rates, operational models and platoon sizes. The result showed that there is a potential for small reductions in polluting emissions due to truck platooning. These simulation models based on case studies in each country require detailed data on freight demand and costs in the operation of truck platooning to simulate the potential future scenarios, but there is an inherent uncertainty in forecasting the future deployment of truck platooning.
To design logistics networks with the unmanned operation of following trucks in a platoon, there is a need to locate a facility for the formation of truck platooning. The facility location decision is classified into strategic planning for solid long-term decision-making in logistics problems. Laporte et al. [20] provided some guidelines on how location decisions and logistics functions can be integrated into a single mathematical model to optimize the configuration of a logistics network. Facility location problems can be categorized according to the location space into continuous and discrete with a network. The continuous approximation (CA) model can approximate the objective into localized functions that can be optimized by relatively simple analytical operations and widely applied to various logistics problems including facility location, inventory management and vehicle routing [13]. The formation center for truck platooning is considered as a platooning hub and can be formulated by the hub location problems (HLPs), and there are a large number of related studies for the optimization of hub location for logistics operations, mainly using a discrete model with a fixed set of candidate facility locations, discrete time periods and discrete customer demand points. Since future forecasting for truck platooning operation is quite difficult due to the restrictions and uncertainty of the detailed demand volume data and operational assumption, it is quite difficult to obtain exact solutions with a discrete model; however, it is suitable for discussing the basic characteristics of a facility location for truck platooning with the CA model. The developments in the CA model are strongly related to computational geometry and geometric probability considering the continuous location space [20,21]. In the case of many-to-many distribution with hubs for time-definite freight transportation carriers, Campbell [22] formulated hub location models without the consideration of service hubs to minimize transportation costs. As an integrated location-routing problem, Xie and Ouyang [23] studied the optimal spatial layout of transshipment facilities and the corresponding service regions on an infinite homogeneous plane that minimizes the total cost for facility set-up, outbound delivery and inbound replenishment transportation.
3. Current Status of Truck Platooning in Japan
3.1. Field Operational Tests on Public Road
In Japan, truck platooning has developed within a national intelligent transport systems (ITS) project named “Energy ITS” in 2008, focusing on energy saving and environmental protection in addition to safety and aiming at introduction in the near future, and the operational tests in this project were mainly conducted in limited areas such as test tracks [24]; in particular, unmanned operational tests directly connected with the solution for the current serious lack of truck drivers were conducted. Now, the field operational tests have been conducted by the Ministry of Economy, Trade and Industry (METI) and Ministry of Land, Infrastructure, Transport and Tourism (MLIT) mainly on expressways from fiscal year (FY) 2017 to 2020 [11]. The tests were conducted step-by-step under the conditions shown in Table 1. The control direction included the longitudinal direction only (CACC: Cooperative Adaptive Cruise Control, equivalent to Autonomation Level 1) and driving including the horizontal direction (CACC and LKA: Lane Keeping Assist, equivalent to Autonomation Level 2). Driver types in following vehicles include manned (equivalent to Autonomation Level 1 or 2) and unmanned (equivalent to Autonomation Level 4). The inter-vehicle distance and time were 35 m (70 km/h, 1.6 s), 20 m (70 km/h, 1 s), 10 m (70 km/h, 0.5 s) and 10 m (80 km/h, 0.4 s). In addition, the safety equipment included the monitoring system of the following vehicle with a Human–Machine Interface (HMI) and the Minimum Risk Maneuver (MRM); more advanced damage reduction methods, such as braking and Emergency Driving Stop, were installed in the trial in 2019.

Table 1.
Field operational tests of truck platooning in Japan.
The government’s strategy “Public–Private ITS Initiative/Roadmaps” related to ITS/automated driving has been updated every year since its original publication in FY2014 [25]. The 2018 version provided the roadmap to achieve truck platooning with unmanned following vehicles on the Shin-Tomei Expressway in 2020 and the commercialization of manned following vehicle platooning in 2021. For commercialization in 2021, four major truck companies (ISUZU, HINO, Mitsubishi Fuso and UD) in Japan are developing products equipped with ACC and LKA [26]. The 2019 version clearly defines the approaches to realize the practical use of truck platooning with unmanned following vehicles in the target year of 2020, presenting the development phases shown in Table 2. For truck platooning with unmanned following vehicles, it is explicitly stated that a platoon should be formed and deformed outside the main lane of an expressway.
Table 2.
Development phases of truck platooning in Japan.
In Europe, the project “ENabling SafE Multi-Brand pLatooning for Europe” (ENSEMBLE) suggested the pre-standards for interoperability between trucks, platoons and logistics solution providers to speed up the actual market adoption of (sub)system development and implementation and to enable the harmonization of legal frameworks in the member states [5]. In ENSEMBLE, three different levels of platooning automation are anticipated: Level A for the first stage, Level B with an advanced automation level and Level C with FAVs. The current status of platooning automation levels in ENSEMBLE in Europe [27] and Japan [28] is almost the same, as shown in Table 3. However, there are differences in some aspects, such as vehicle gap distance, fallback, fail-safe and the number of vehicles in a platoon, and Japan adopts stricter standards than Europe. The commercialization of longitudinal/horizontal platooning (in the same lane) in the initial phase is planned in the same year of 2022. In Europe, the main purpose for truck platooning is to reduce drivers’ labor loads and the burden on the environment. Therefore, they mainly study truck platooning with manned following vehicles rather than truck platooning with unmanned following vehicles. This reveals that Japan is ahead of Europe from the perspective of conducting field operational tests with unmanned following vehicles.
Table 3.
Comparison of platooning automation levels between Europe and Japan.
3.2. Infrastructure Development for Truck Platooning
Traffic rules, commercialization and infrastructure development for truck platooning have been discussed in advance of the discussion of legislation. Major tasks for truck platooning in Japan include the legal requirements of truck platooning with an unmanned following vehicle, the development of rules for truck platooning, the development of rules for Vehicle-to-Vehicle (V2V) communication, special traffic rules for truck platooning and the required infrastructure such as the facility for the formation/deformation of truck platooning.
Three platooning formation concepts have mainly been considered [3]: (i) scheduled platooning, (ii) “on-the-fly” or self-organized platooning and (iii) orchestrated platooning facilitated by Platooning Service Providers (PSPs). In orchestrated platooning, the Platoon Formation Center (PFC) is the facility or parking lot for platooning formation operated by PSPs. As shown in Figure 1, PFCs need to be equipped with several functions such as a matching/coordination system for the truck platoon, parking spaces for electronic coupling and decoupling of truck platoon, a cargo handling yard and a rest station for drivers [29].
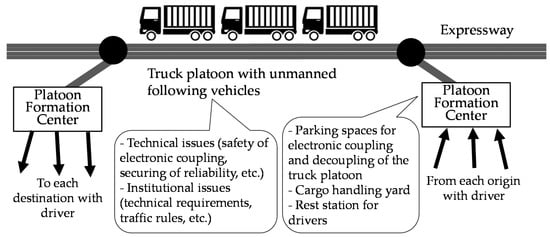
Figure 1.
Truck platooning operation with Platoon Formation Centers.
3.3. Facility Location Plan for Platoon Formation Centers
Major cities and industries in Japan are geographically concentrated along the Pacific coast, especially between Tokyo, Nagoya and Osaka, as shown in Figure 2. The Shin-Tomei and Shin-Meishin expressways were opened in the 2010s with a high-standard design as an alternative route to the existing, dilapidated expressways between the three major cities. At first, the facility development plan for truck platooning was under discussion on the Shin-Tomei and Shin-Meishin expressways [29]. In this plan, the approximate candidate sites of three PFCs were proposed near the interchange of the major corridor and outer ring roads in the suburbs of three major cities, shown as the red circled areas in Figure 2.
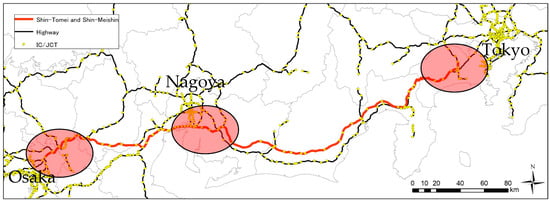
Figure 2.
Facility development plan for Platoon Formation Centers for Tokyo–Nagoya–Osaka.
4. Formulation of Facility Location Model for Truck Platoon with Continuous Approximation
4.1. Model Description
We assume a simple route choice in the case of two trucks, as shown in Figure 3, to explain the effect of truck platooning formation. Both trucks need to make a detour to form a platoon, but this is a waste of time and cost for both trucks. To make the truck platooning more advantageous than the shortest route with a single truck trip, cost reduction on the platoon arc is quite an important factor, including saving fuel consumption and labor cost by platooning. Therefore, the cost factor of platooning (α) is adopted in the platoon arc.
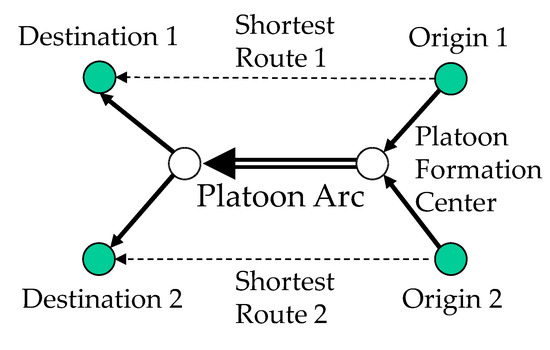
Figure 3.
Routes with and without Truck platooning.
The formulation and assumption of this model are as follows. As shown in Figure 4, we consider the two circled regions A and B, whose radii are r, and the distance between two regions is l. The long-haul ratio x (x > 2) is deployed to consider the relationship between l and r as follows: in general, the long-haul ratio x becomes larger as the distance between two regions l becomes longer with a fixed radius r.
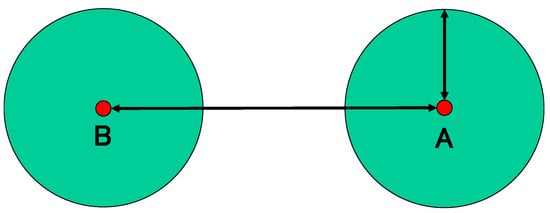
Figure 4.
Two circled regions.
The travel demand between two regions is uniformly generated. As shown in Figure 5, travel cost is formulated as the average travel distance between two regions, and the scenarios for route choice are considered as follows:
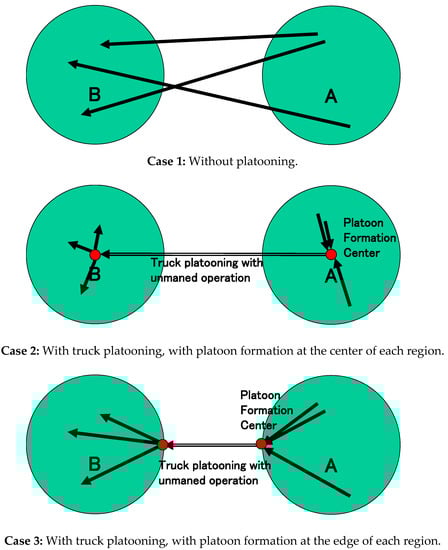
Figure 5.
Three scenarios with and without truck platooning.
Case 1: Without platooning;
Case 2: With truck platooning, with platoon formation at the center of regions;
Case 3: With truck platooning, with platoon formation at the edge of regions—i.e., the nearest location to another circle.
In Case 1, each truck travels alone and moves directly with the shortest distance from the origin to destination between two regions. The average travel distance is calculated using the approximate formulas of average distances between two points in two different coplanar regions [30]. The travel cost of Case 1 Ds is derived as follows:
In Case 2, the travel cost consists of the long-haul cost with platooning between the PFCs at the center of the region and the average travel cost in the local area of each PFC. In long-haul travel, the travel distance is l between two PFCs with the cost factor with platooning (α). In local access travel to each PFC, the average distance to the center of circle is 2/3r [21,31], and there are two circle regions for the origin and destination. The travel cost of Case 2 Dc is derived as follows:
In Case 3, the travel cost consists of the long-haul cost with platooning between the PFCs at the edge of the region and the average travel cost in the local area of each PFC. In long-haul travel, the travel distance is l − 2r between two PFCs with the cost factor with platooning (α). In local access travel to each PFC, the average distance to the edge of the circle is [31,32], and there are two circle regions for the origin and destination. The travel cost of Case 3 De is derived as follows:
Figure 6 shows the comparison between the cost functions in cases 1, 2 and 3 with the change in the cost factor with platooning (α) using the long-haul ratio x is as follows: for the low cost reduction scenario, α = 0.8; for the middle cost reduction scenario, α = 0.5; and for the high cost reduction scenario, α = 0.3. We can observe that the travel cost in Case 3 is the cheapest case in scenarios where α = 0.8 and 0.5, but not for x = 2, and the travel cost in Case 2 is the cheapest case in the scenario where α = 0.3. Case 1 is the cheapest case in α = 0.8 and 0.5 only where x = 2; i.e., the situation that two circles come into contact with each other. In conclusion, Case 2 is the optimal location as the cost factor with platooning (α) becomes smaller, but Case 3 is the optimal location for most scenarios. Case 1, without platooning, is the optimal route choice only in the special case that two regions are located close to one another.
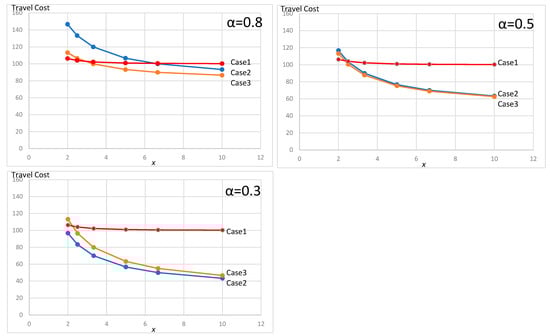
Figure 6.
Travel cost with three scenarios of cost factors with platooning (α).
4.2. Optimal Location
In this section, the optimal locational strategy is discussed according to the analytical comparison among three cases. Solving the condition from Equations (2) and (3) with the long-haul ratio x for the comparison between the travel Cost of Case 1 and 2, we can derive the following Equation:
Solving the condition from Equations (2) and (4) with the long-haul ratio x for the comparison between the travel cost of Cases 1 and 3, we can derive the following equation:
Solving the condition from Equations (3) and (4) with the long-haul ratio x for the comparison between the travel costs of cases 2 and 3, we can derive the following equation that is independent of the long-haul ratio x:
From Equations (5)–(7), we can obtain the results that show the dominant combination of x and the cost factor with platooning (α) for all three cases, as shown in Figure 7. The border of Case 1 and Case 2 is a quadratic function based on Equation (5), but the length of this border is quite short. The border of Case 1 and Case 3 is also a quadratic function based on Equation (6). The border of Case 2 and Case 3 is a constant value to x based on Equation (7). Three borders meet at the point α = (=0.465) and x = 2.284.
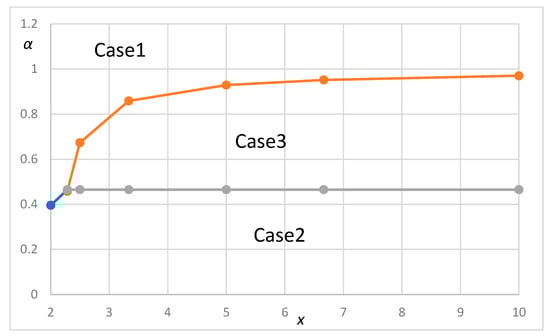
Figure 7.
Optimal locational strategy for the combination of the long-haul ratio x and the cost factor with platooning (α).
5. Numerical Experiments Considering the Scenarios in Japan
5.1. Estimation of the Cost Factor with Platooning
In this section, we estimate the cost factor with platooning (α), which is the advantage of truck platooning considering the scenarios in Japan. The travel cost per vehicle is defined as follows: the single vehicle without platooning in Case 1 is s, the leading vehicle of the truck platoon in Case 2 and 3 is a, and the following vehicle of the truck platoon in Case 2 and 3 is b. The number of vehicles is n. The travel cost for a single vehicle without platooning in Case 1 is:
The travel cost for the platooning in Case 2 and 3 is:
The cost factor with platooning (α) is the ratio of the travel cost for the platooning to the travel cost for the single vehicle without platooning, and we can derive this as follows:
To check the characteristics of Equation (10), the numerical experiment in the simple case (s = 1 and a = 1) is shown in Figure 8. As the number of vehicles in a platoon (n) increases, the cost factor with platooning (α) decreases. As the travel cost per vehicle following in the truck platoon (b) decreases, the cost factor with platooning (α) decreases.
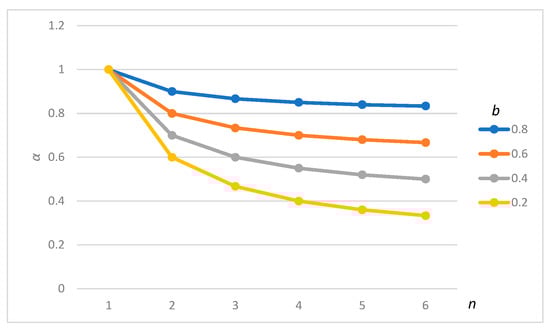
Figure 8.
The cost factor with platooning (α) with the number of vehicles in a platoon (n) and travel cost per vehicle following in the truck platoon (b).
5.2. Optimal Locational Strategy for the Scenarios in Japan
Next, we estimate the parameter settings of several scenarios for the deployment of truck platooning in Japan. The ratio of labor costs in the trucking industry is around 40%, and this is related to the cost reduction for unmanned driving compared to manned driving. As regards the reduction in fuel consumption in a platoon, that of the leading vehicle is around 10% and that of the following vehicle is around 20%. In the scenario for platooning, these reduction factors are also considered both in leading and following vehicles. As for the total number of vehicles, the regulation limits the number of vehicles to three in a platoon.
We consider the following three scenarios that have not been discussed enough in Japan and derive the parameters as shown in Table 4. From Figure 7, we can derive the relationship between the cost factor with platooning (α) in three scenarios in Table 4 and the long-haul ratio x as shown in Figure 9.
Table 4.
Calculation of parameters and the optimal locational strategy in three scenarios.
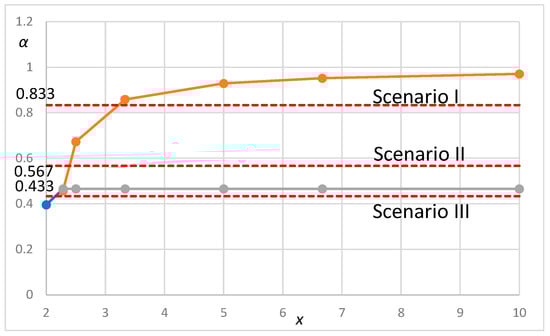
Figure 9.
Optimal locational strategy for the combination of the long-haul ratio x and the cost factor with platooning (α) based on the parameters in Japan.
We choose the sections for scenario evaluation in Japan as shown in Table 5 and Figure 10. From Figure 9, we can derive the optimal locational strategy in the case of x = 5 as shown in the rightmost cell in Table 4. These results show that the optimal locational strategy for the platoon of all manned vehicles and the platoon with unmanned following vehicles is the edge of the circle region and that for the platoon of fully automated vehicles (FAVs) is the center of the circle region. As the candidate location for PFCs with unmanned following vehicles is around the suburbs of the metropolitan area near the outer ring road, as shown in Figure 2, we can conclude that the results from this analytical model are very close to this situation.
Table 5.
Sections for the evaluation of scenarios in Japan.
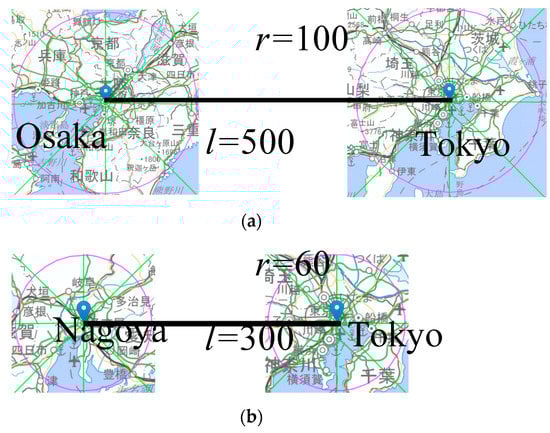
Figure 10.
Sections for scenarios in Japan. (a) Tokyo-Osaka, (b) Tokyo-Nagoya
6. Implication
The results of this study have some implications both for logistics companies that may participate in truck platooning and for governments that implement road infrastructure investment and regulatory guidance measures.
First, logistics companies should adjust their truck transportation system to reduce the travel costs considering the deployment of truck platooning. From the numerical results using this continuous approximation model, it has been shown that logistics companies involved in long-haul transport could make their transportation system more efficient by participating in truck platooning based on the current cost structure. In addition, it is also shown that the travel distance of truck platooning is different depending on the scenarios of the platoon: (I) platoon of all manned vehicles, (II) platoon with unmanned following vehicles and (III) platoon of all fully automated vehicles (FAVs). Thus, the distance is between the fringes of the origin–destination regions for scenarios (I) and (II), while the distance is between the center of the origin–destination regions for scenario (III). Therefore, logistics companies should construct a desirable freight transportation system, considering the travel distance of their cargo and the advancement of truck platooning.
Next, the government has the role of developing infrastructure and regulatory guidance to support the freight transportation system of logistics companies. The numerical results of this study based on the current cost structure indicate that it is optimal to locate Platooning Formation Centers (PFCs) at the fringes of the origin–destination regions for scenarios (I) and (II), and at the center of the origin–destination regions for scenario (III). Therefore, the government should implement various policies, considering the advancement of truck platooning. In particular, for the future deployment of scenario (II) with unmanned following vehicles, the government should locate PFCs around the suburbs of the metropolitan area near the outer ring road. In addition, the government should secure land available for industrial uses where PFCs could be located among the optimal locations for PFCs and develop a road network infrastructure that allows truck platoon to travel safely.
In this decade, due to increasing freight transportation demands and a serious lack of drivers in Japan, efforts for the deployment of high-capacity vehicles (HCVs) are being made to improve the labor savings and efficiency of freight transportation. HCVs have been widely used in Europe and the U.S. for a long time, but the official introduction of 25 m long vehicles was only approved in 2019 on expressways along the Pacific coast from northern Japan (Tohoku) to western Japan (Kyushu) including the Shin-Tomei and Shin-Meishin expressways. As a supply chain in Japan, logistics between parts suppliers and assembly plants are linked by wide-area trunk transportation using expressways. In Japan, a production system based on the Just In Time (JIT) approach has been established, and it can be said that logistics is highly oriented toward high-frequency and low-volume transportation [33,34]. Considering the problems for the deployment of 25 m long vehicles, such as restrictions on the approved sections and the total weight of the vehicles, a collaborative distribution with HCVs is under operation among multiple logistics companies. An HCV with one tractor and one trailer can be considered as a convoy of two freight vehicles using a physical coupling, while truck platooning is a small convoy of multiple freight vehicles using electronic coupling. Therefore, the results of this research into Platoon Formation Centers (PFCs) are expected to be used to determine facility locations for the coupling and de-coupling of trailers in this collaborative distribution for HCVs.
7. Conclusions
In this study, we introduced the current status of truck platooning in Japan and presented the optimal location model for truck platooning using a continuous approximation model with a numerical experiment considering the case in Japan. Truck platooning has been under technological development since the early 2000s as a major solution for improving the efficiency of long-distance trucking. This research focused on the optimal locational strategy of Platoon Formation Centers (PFCs)—the facilities for the platoon formation of freight trucks for unmanned truck platooning—considering the facility development plan on major corridors between the major three metropolitan areas by the government. Continuous approximation (CA) is an efficient and effective technique for modeling complex and uncertain logistics problems, especially in the areas of facility locations. In this model, the travel cost is calculated as the average travel distance between two market areas and three cases—without platooning/with platooning via PFCs at the center/edge of each market area—are considered. We derived the optimal locational strategy of PFCs for the combination of the long-haul ratio and the cost factor with platooning. With the estimated parameters of several scenarios for the deployment of truck platooning in Japan, the numerical results show that the optimal locational strategy of PFCs for the platoon of all manned vehicles and the platoon with unmanned following vehicles is the edge of the local region and that for the platoon of FAVs is the center. Especially for PFCs with unmanned following vehicles, we can conclude that the results from this continuous approximation model based on the current cost structure are very close to the facility development plan by the government.
For future study, we need to consider the optimal location model inside a region and formulate this with a discrete network model for actual transport demand and road networks.
Author Contributions
Conceptualization, D.W.; methodology, D.W.; software, D.W.; validation, D.W., T.K. and K.S.; formal analysis, D.W.; investigation, T.K. and K.S.; resources, D.W., T.K. and K.S.; data curation, D.W.; writing—original draft preparation, D.W., T.K. and K.S.; writing—review and editing, D.W., T.K. and K.S.; visualization, D.W., T.K. and K.S.; supervision, D.W.; project administration, D.W.; funding acquisition, D.W. All authors have read and agreed to the published version of the manuscript.
Funding
This research was partially funded by the Institute of Behavioral Sciences (IBS Fellowship) and the Japan Society for the Promotion of Science (JSPS KAKENHI), grant number 19H02255.
Institutional Review Board Statement
Not applicable.
Informed Consent Statement
Not applicable.
Data Availability Statement
Not applicable.
Conflicts of Interest
The authors declare no conflict of interest.
References
- Upadhyay, A. Antecedents of green supply chain practices in developing economies. Manag. Environ. Qual. Int. J. 2020. [Google Scholar] [CrossRef]
- DHL: Logistics Trend Ladar, 5th edition. Available online: https://www.dhl.com/global-en/home/insights-and-innovation/insights/logistics-trend-radar.html (accessed on 27 February 2021).
- Janssen, R.; Zwijnenberg, J.; Blankers, I.; Kruijff, J.D. Truck Platooning-Driving the Future of Transportation; TNO 2014 R11893. 2015. Available online: https://www.semanticscholar.org/paper/Truck-platooning%3A-driving-the-future-of-Janssen-Zwijnenberg/8c06e8e2b7c15e9e186a254bda6c6adad83bad61 (accessed on 29 April 2021).
- Aarts, L.O.; Feddes, G.E. European Truck Platooning Challenge-Creating next generation mobility. In Proceedings of the HVTT14: International Symposium on Heavy Vehicle Transport Technology, The Dutch Ministry of Infrastructure and the Environment, Rotorua, New Zealand, 15–18 November 2016. [Google Scholar]
- Willemsen, D.; Schmeitz, A.; Fusco, M.; Jan van Ark, E.; van Kempen, E.; Soderman, M.; Atanassow, B.; Sjoberg, K.; Nordin, H.; Dhurjati, P. “Requirements Review from EU Projects”, D2.1 of H2020 Project ENSEMBLE. 2018. Available online: https://platooningensemble.eu/storage/uploads/documents/2021/03/24/ENSEMBLE-Deliverable-2.1-StateOfTheArt_EUProjects_Final.pdf (accessed on 29 April 2021).
- Hochschule Fresenius, DB Schenker and MAN Truck & Bus SE, “EDDI: Electronic Drawbar-Digital Innovation”, Project Report-Presentation of the Result. 2019. Available online: https://www.deutschebahn.com/resource/blob/4136372/d08df4c3b97b7f8794f91e47e86b71a3/Platooning_EDDI_Project-report_10052019-data.pdf (accessed on 29 April 2021).
- UK Heavy Goods Vehicle Platooning Project. Available online: http://www.helmuk.co.uk/ (accessed on 27 February 2021).
- EU Roadmap for Truck Platooning; European Automobile Manufacturers’ Association: 2017. Available online: https://www.acea.be/publications/article/infographic-eu-roadmap-for-truck-platooning (accessed on 29 April 2021).
- Truck Platooning Early Deployment Assessment–Independent Evaluation: Performance Measures for Evaluating Truck Platooning Field Deployments; The United States Department of Transportation: Washington, DC, USA. 2020. Available online: https://rosap.ntl.bts.gov/view/dot/50551 (accessed on 29 April 2021).
- Bishop, R. New Moves, New Markets for Truck Platooning Revealed at AVS2020. Available online: https://www.forbes.com/sites/richardbishop1/2020/09/27/new-moves-new-markets-for-truck-platooning-revealed-at-avs2020/?sh=9eb2c6a62974 (accessed on 27 February 2021).
- Truck Platooning Initiative. Available online: https://truck-platooning-initiative.com/ (accessed on 27 February 2021).
- Bhoopalam, A.K.; Agatz, N.; Zuidwijk, R. Planning of truck platoons: A literature review and directions for future research, Transp. Res. Part B 2018, 107, 212–228. [Google Scholar] [CrossRef]
- Ansari, S.; Başdere, M.; Li, X.; Ouyang, Y.; Smilowitz, K. Advancements in continuous approximation models for logistics and transportation systems: 1996–2016. Transp. Res. Part B Methodol. 2018, 107, 229–252. [Google Scholar] [CrossRef]
- Larsson, E.; Sennton, G.; Larson, J. The vehicle platooning problem: Computational complexity and heuristics. Transp. Res. Part C Emerg. Technol. 2015, 60, 258–277. [Google Scholar] [CrossRef]
- Larsen, R.; Rich, J.; Rasmussen, T.K. Hub-based truck platooning: Potentials and profitability. Transp. Res. Part E Logist. Transp. Rev. 2019, 127, 249–264. [Google Scholar] [CrossRef]
- Zhang, L.; Chen, F.; Ma, X.; Pan, X. Fuel Economy in Truck Platooning: A Literature Overview and Directions for Future Research. J. Adv. Transp. 2020, 2020, 1–10. [Google Scholar] [CrossRef]
- Gerrits, B.; Mes, M.; Schuur, P. Simulation of Real-Time and Opportunistic Truck Platooning at the Port of Rotterdam. In Proceedings of the 2019 Winter Simulation Conference (WSC), 2019 Winter Simulation Conference (WSC), National Harbor, MD, USA, 8–11 December 2019; Institute of Electrical and Electronics Engineers (IEEE): Piscataway, NJ, USA, 2019; pp. 133–144. [Google Scholar]
- Jo, Y.; Kim, J.; Oh, C.; Kim, I.; Lee, G. Benefits of travel time savings by truck platooning in Korean freeway networks. Transp. Policy 2019, 83, 37–45. [Google Scholar] [CrossRef]
- Paddeu, D.; Denby, J. Decarbonising road freight: Is truck automation and platooning an opportunity? Clean Technol. Environ. Policy 2021, 1–15. [Google Scholar] [CrossRef]
- Laporte, G.; Nickel, S. Location Science; Springer: Cham, Switzerland, 2015. [Google Scholar]
- Larson, R.; Odoni, A. Urban Operations Research, 2nd ed.; Dynamic Ideas: Charlestown, MA, USA, 2007. [Google Scholar]
- Campbell, J.F. A continuous approximation model for time definite many-to-many transportation. Transp. Res. B 2013, 54, 100–112. [Google Scholar] [CrossRef]
- Xie, W.; Ouyang, Y. Optimal layout of transshipment facility locations on an infinite homogeneous plane. Transp. Res. Part B Methodol. 2015, 75, 74–88. [Google Scholar] [CrossRef]
- Tsugawa, S. An Overview on an Automated Truck Platoon within the Energy ITS Project. IFAC Proc. Vol. 2013, 46, 41–46. [Google Scholar] [CrossRef]
- Strategic Conference for the Advancement of Utilizing Public and Private Sector Data and Strategic Headquarters for the Advanced Information and Telecommunications Network Society: Public-Private ITS Initiative/Roadmaps. 2019. Available online: http://japan.kantei.go.jp/policy/it/2019/2019_roadmaps.pdf (accessed on 29 April 2021).
- Japan Automobile Manufacturers Association: Press Release on 20 July 2020. Available online: http://release.jama.or.jp/sys/news/detail.pl?item_id=1930 (accessed on 27 February 2021). (In Japanese).
- Vissers, J.; Banspach, J.; Liga, V.; Tang, T.; Nordin, H.; Julien, S.; Martinez, S.; Villette, C. V1 Platooning Use-Cases, Scenario Definition and Platooning Levels, D2.2 of H2020 project ENSEMBLE. 2018. Available online: https://platooningensemble.eu/storage/uploads/documents/2021/03/24/ENSEMBLE-D2.2_V1-Platooning-use-cases,-scenario-definition-and-platooning-levels_FINAL.pdf (accessed on 29 April 2021).
- An Interim Report of the Joint Public-Private Sector Council for Commercialization of Truck Platooning; The Joint Public-Private Sector Council for Commercialization of Truck Platooning: Tokyo, Japan, 2019. (In Japanese)
- The Reports of the Study Group on Utilization of Expressway Infrastructure Corresponding to New Logistics System; The Ministry of Land, Infrastructure, Transport and Tourism: Tokyo, Japan, 2019. (In Japanese)
- Koshizuka, T.; Kurita, O. Approximate formulas of average distances associated with regions and their applications to location problems. Math. Program. 1991, 52, 99–123. [Google Scholar] [CrossRef]
- Vaughan, R. Urban Spatial Traffic Patterns; Pion Publication: London, UK, 1987. [Google Scholar]
- Mathai, A.M. An Introduction to Geometrical Probability: Distributional Aspects with Applications; CRC Press: Boca Raton, FL, USA, 1999. [Google Scholar]
- Kaneko, J.; Nojiri, W. The logistics of Just-in-Time between parts suppliers and car assemblers in Japan. J. Transp. Geogr. 2008, 16, 155–173. [Google Scholar] [CrossRef]
- Guerrero, D.; Itoh, H. Ports, regions and manufacturing systems: Automobile manufacturing in Kyushu, Japan. Case Stud. Transp. Policy 2017, 5, 332–341. [Google Scholar] [CrossRef]
Publisher’s Note: MDPI stays neutral with regard to jurisdictional claims in published maps and institutional affiliations. |
© 2021 by the authors. Licensee MDPI, Basel, Switzerland. This article is an open access article distributed under the terms and conditions of the Creative Commons Attribution (CC BY) license (https://creativecommons.org/licenses/by/4.0/).