Review

Cash Flow Bullwhip—Literature Review and Research Perspectives

1
Laboratory of Scientific Engineering of Organizations (ISO), National School of Business and Management of Casablanca, Hassan II University, Casablanca 20250, Morocco
2
Laboratory of Research and Prospects in Finance and Management (LRPFG), National School of Business and Management of Casablanca, Hassan II University, Casablanca 20250, Morocco
*
Author to whom correspondence should be addressed.
Logistics 2021, 5(1), 8; https://doi.org/10.3390/logistics5010008
Submission received: 28 December 2020 / Revised: 24 January 2021 / Accepted: 25 January 2021 / Published: 31 January 2021

Abstract

:
The bullwhip effect is a pervasive phenomenon in all supply chains causing excessive inventory, delivery delays, deterioration of customer service, and high costs. Some researchers have studied this phenomenon from a financial perspective by shedding light on the phenomenon of cash flow bullwhip (CFB). The objective of this article is to provide the state of the art in relation to research work on CFB. Our ambition is not to make an exhaustive list, but to synthesize the main contributions, to enable us to identify other interesting research perspectives. In this regard, certain lines of research remain insufficiently explored, such as the role that supply chain digitization could play in controlling CFB, the impact of CFB on the profitability of companies, or the impacts of the omnichannel commerce on CFB.

1. Introduction

The success of companies, regardless of their industry, depends on their ability to effectively manage their cash flow. Good cash management guarantees the company’s liquidity, which allows it to honor its financial commitments to third parties (suppliers, employees, funders, etc.) and to free up excess cash to finance its development projects.
That said, it should be emphasized that these cash flows are only the consequence of the physical and information flows that are exchanged within a supply chain. In fact, every sale transaction is preceded by an information flow (order, forecast, etc.) and manifests itself in a physical flow (delivery of goods) which triggers a financial flow (payment). Thus, it is clear that good control of cash flow is conditioned by control of physical and information flows.
However, it has been demonstrated that, in all supply chains, companies experience disruptions in their physical and information flows, which researchers have called the bullwhip effect [1]. This phenomenon, which has been deeply studied by researchers, results in oscillations of physical flows, making inventory flow times uncontrollable as well as causing instability in financial flows. This instability of financial flows, called cash-flow bullwhip [2], risks penalizing severely the liquidity of these companies, impacting their profitability or even endangering their existence.
While the bullwhip effect has been widely studied by the research community, the cash-flow bullwhip is a concept that was recently introduced by Tangsucheeva and Prabhu in 2013, and therefore remains poorly explored by the scientific community. In this regard, this article aims to review the existing literature, provide a summary of the state of the art, and introduce new research perspectives.
The rest of this article is structured around the following three sections: Section 2 dedicated to the theoretical anchoring of the concept of CFB, Section 3 presenting the main contributions of researchers, and Section 4 discussing the perspectives of future research.

2. Theoretical Basis

2.1. Supply Chains and Bullwhip Effect

A supply chain is an extensive network of partners who contribute to the production and implementation of products intended for a market. This chain can be seen as a value creation chain made up of suppliers, storage and/or transshipment points, processing and storage sites, distributors, and customers.
To satisfy the end customer, these players exchange information flows, physical flows, and financial flows with each other. This set of flows must be managed in a synchronized and coordinated manner, so that the supply chain achieves optimal performance. Such performance is often associated with making the right product available to the customer, at the right time, in the right place, in the right quantity, and at minimal cost [3].
Several researchers have been interested in the analysis of supply chain flows. In this regard, a phenomenon was first introduced in 1961 by Jay Forrester, concerning what the scientific community calls the bullwhip effect. The bullwhip effect refers to the fact that the variability of demand increases as we move away from the end consumer up the supply chain. The bullwhip effect was explored in a supply chain analysis of infant diapers at Procter & Gamble. The observation was that, when there was a slight fluctuation in sales at retail stores, diaper consumption was very stable. However, by examining the derived demand transmitted to the intermediate channel, a great variability in the quantities ordered was found. This variability has increased relative to P & G’s material orders from their suppliers. Figure 1 illustrates this phenomenon.
Research on this phenomenon has focused on the existence of BWE and its implications for the physical part of supply chain flows. Thus, using the beer distribution game, Sterman pointed out the existence of BWE [4]. Subsequently, and by studying the BWE, Burbidge concluded that the increase in demand in the supply chain is due to delays in the transmission of information and stocks [5]. Afterwards, Lee et al. identified the causes of this phenomenon, namely [6]:
  • Frequency of updating the demand forecasts
  • Additional lead times and safety stocks added to the forecasts by each actor in the chain
  • Batch orders aiming to optimize the fixed launch costs at an individual level (economies of scale); indeed, instead of generating replenishment orders based on demand, planners wait until an economical order quantity, a lot size determined by MRP order policy, or periodic review to take place
  • Price fluctuations and promotions pushing supply chain players to place orders that are disproportionate to the actual demand of the end customer, which increasingly amplifies the distortion of demand
In addition, some research has shown the negative impact of the bullwhip effect on the overall performance of the supply chain: high stocks, poor customer service, disruption in production schedules, delivery delays, high costs, etc. [6].

2.2. Bullwhip Effect and Financial Impacts: From Bullwhip Effect to Cash Flow Bullwhip

Another group of researchers focused on the impacts of BWE on the financial flows, at the level of the supply chain [2]. Indeed, the amplification of stocks caused by the BWE extends the time needed to transform them into sales, and consequently the time to transform them into cash. This leads to cash flow problems, referred to as cash flow bullwhip (CFB) [2].
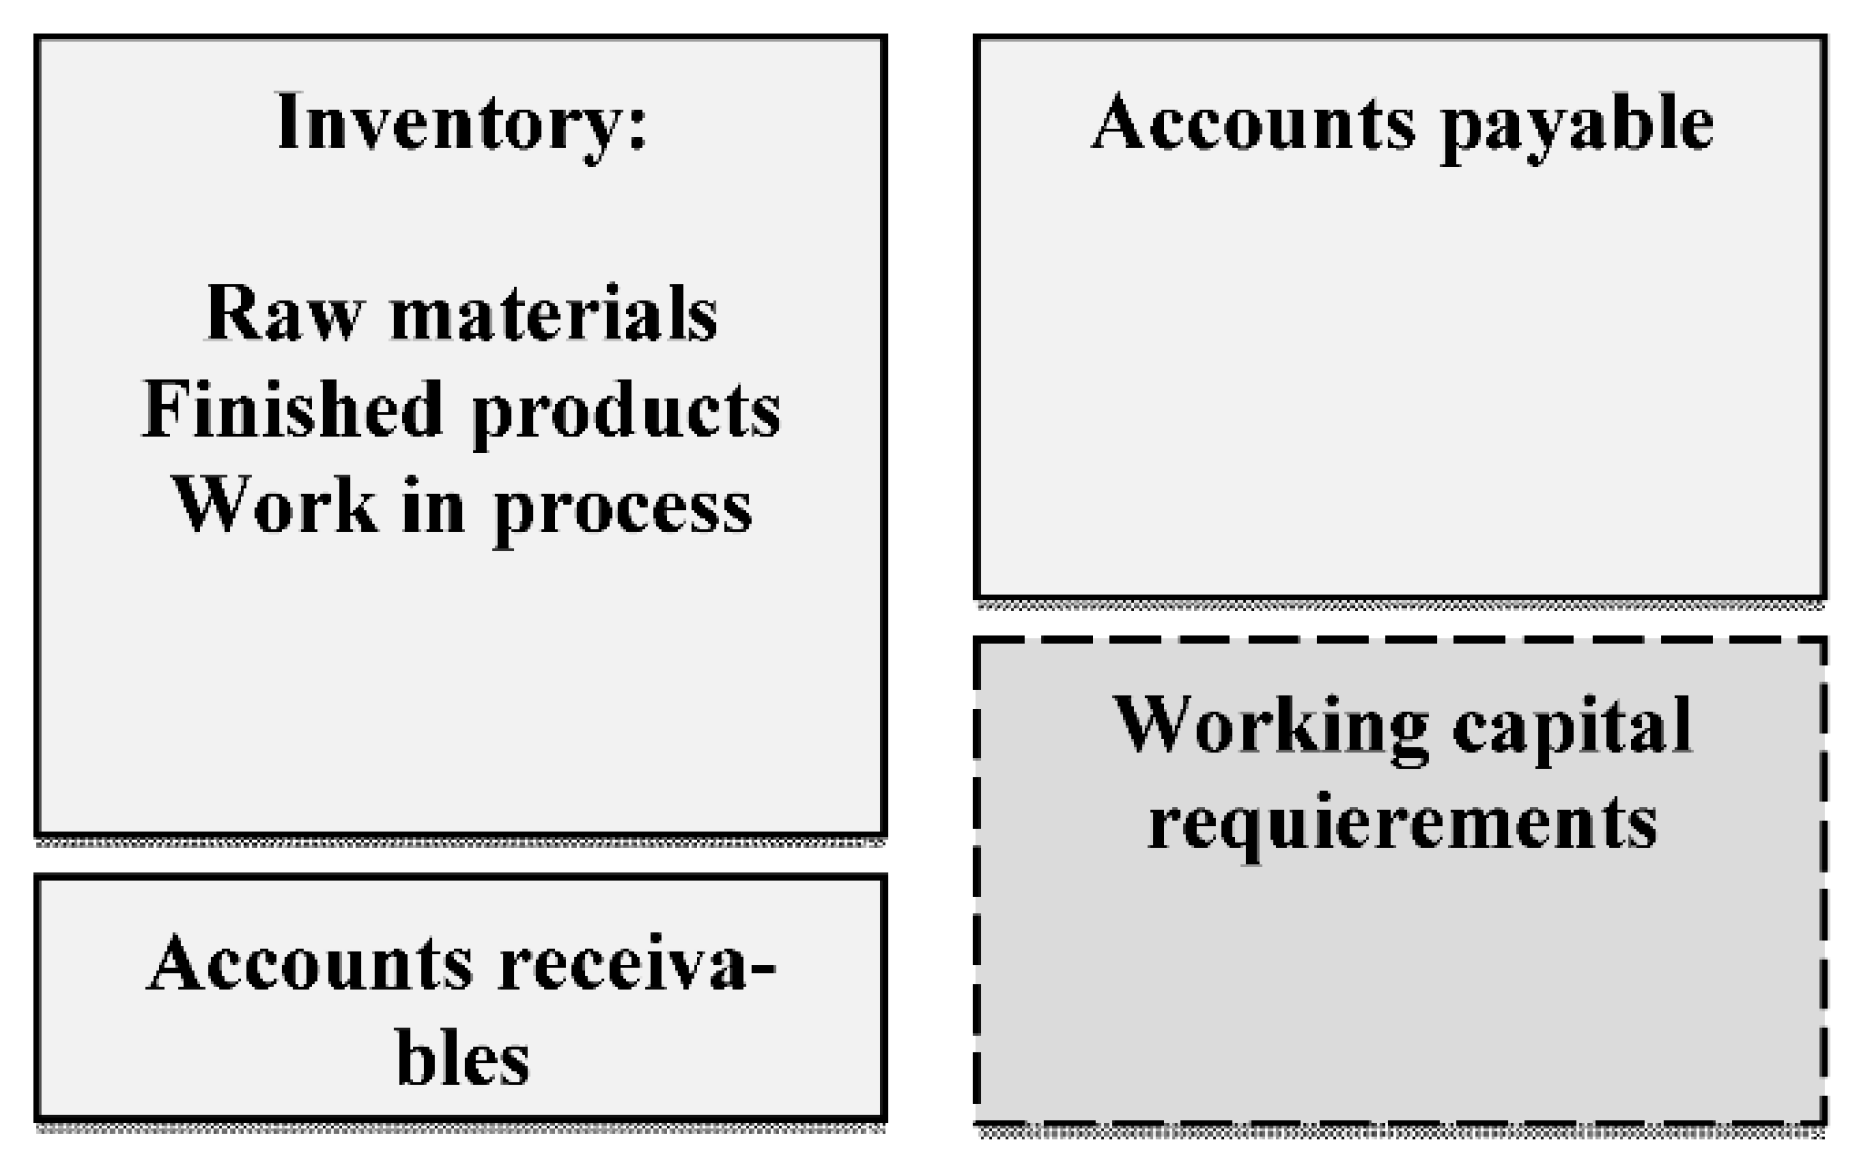
To better understand the impact of CFB on a company cash flow, it is first necessary to analyze the concept of the operating working capital requirement (WCR). Operational WCR can be defined as the amount of money required for a company to finance its operating activity. This need is the result of the gap that exists between the dates of cash inflows and outflows. The operational WCR is related to the following operating activities of company: purchase, transformation, and sale [7,8].
Thus, at time “t”, the operational WCR is the result of the difference between the cash resources and uses available to the company. Cash resources, known as “Current operating liabilities”, correspond to the debts granted by suppliers during a purchase transaction. Cash uses, known as “Current operating assets”, correspond to the receivables due to deferred payments granted by the company to its customers and to stocks held by the company.
Thus, the operational WCR is obtained according to the following formula:
Operational   WCR = Current   assets Current   liabilies
Figure 2 illustrates the relationship among the current operating assets, the current operating liabilities, and the operational working capital.
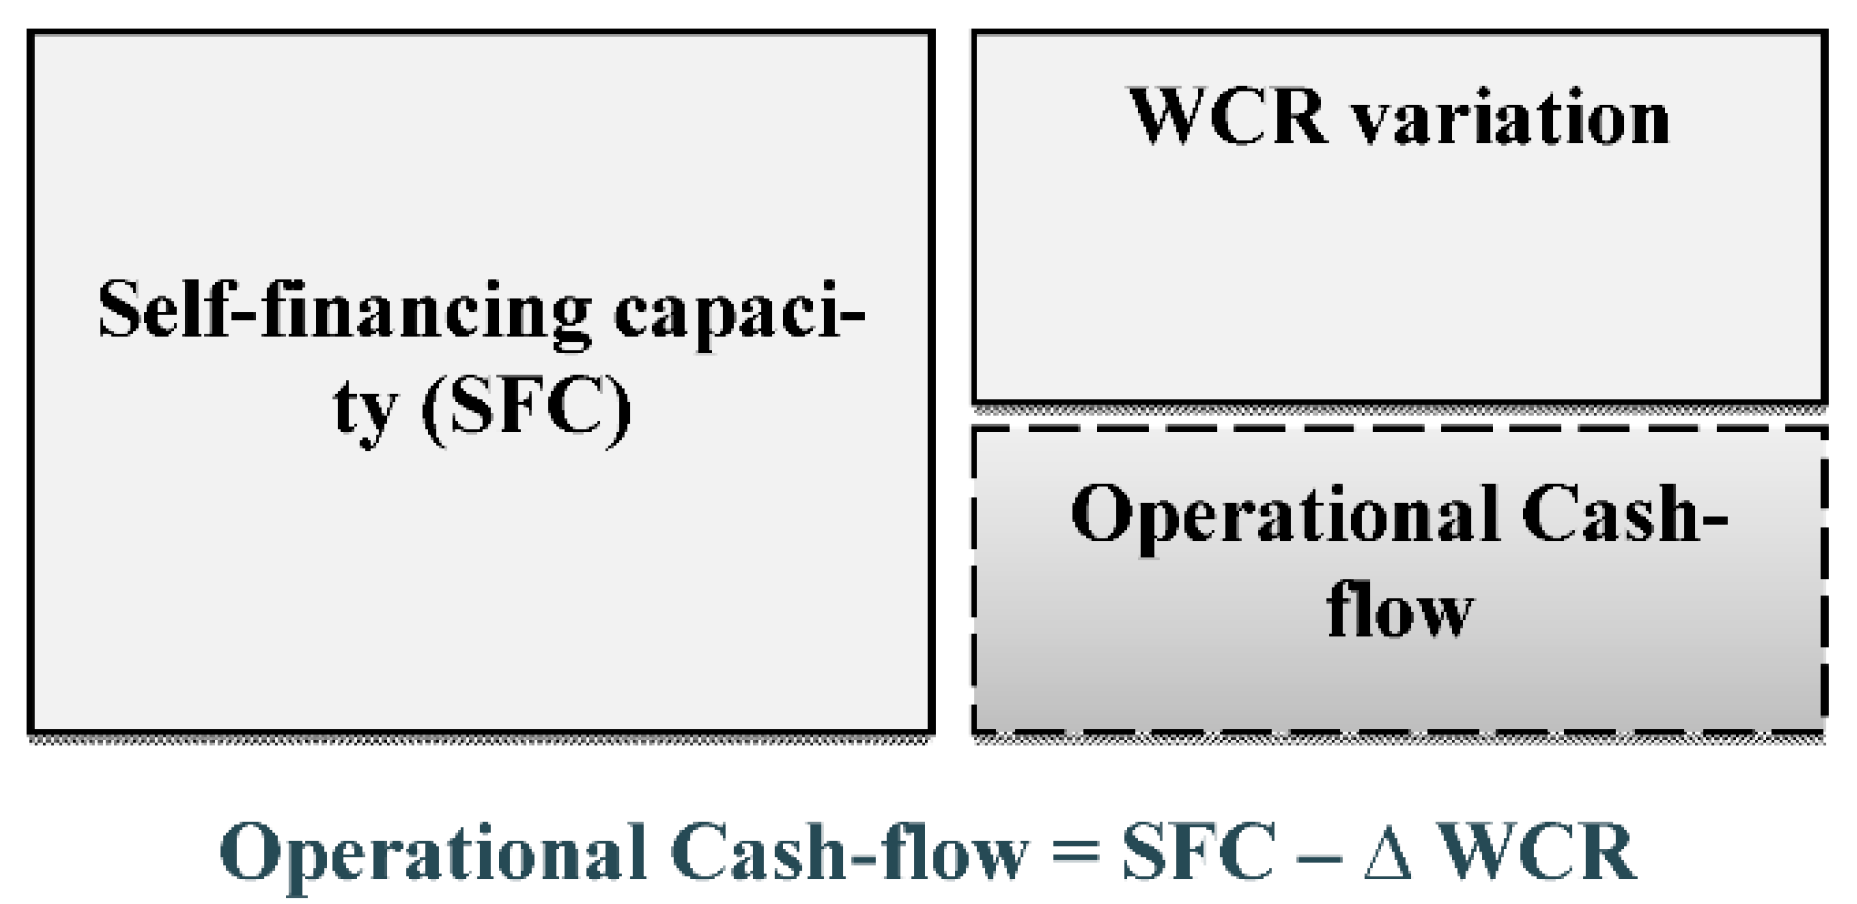
The importance of the operational WCR resides in the fact that partly determines the level of the operational cash flow of the company. Indeed, the operating cash flow results from the difference between cash flow and the variation of the working capital. Besides, the self-financing capacity is the result of the company’s actual income and expenses. Figure 3 expresses the relationship among the operating cash flow, the self-financing capacity, and the variation in working capital, according to the cash flow statement approach.
Thus, the higher is the operational WCR of a company, the less operating cash flow it will generate.
Given the importance of the operational WCR in generating cash flow, another operational WCR approach, called a normative approach, is used to better understand the elements that are at its origin. This approach makes it possible to express each of the operational WCR items (inventory, accounts receivables, and accounts payables) in a flow time (FT), measured by the ratio of the average amount of the item, to the annual flow that generated it, multiplied by 360 to obtain a duration expressed in days:
FT = ( Item Flow ) × 360
The coefficient of structure (CS), measured by the report of the annual flow that generated the item, on the turnover excluding the tax, is calculated as:
CS = ( Flow Turnover )
Thus, the different flow times related to the operating cycle of the company form what is called the cash conversion cycle (CCC). The CCC can be defined as the number of days it takes for a business to recover $1 from its operating activity. The CCC is the sum of the inventory flow time, the receivables flow time, and the payables flow time, and it can be summarized by the following formula:
CCC = ( Average   Inventory Inventory   Costs × 360 ) + ( Accounts   Receivables Turnover × 360 ) ( Accounts   Payables Purchases × 360 )
The impact of CFB on a company cash flow is explained by the variability it causes in CCC components, namely the inventory flow times and the accounts receivable times. Thus, the more the flow times oscillate and lengthens, the longer the company will take to collect money, which will negatively impact its cash flow. This situation means that companies affected by the CFB are held hostage by their inability to finance their activity, even though they are profitable. This will push them to seek other sources of external financing, the cost of which will impact their profitability.
Thus, it is obvious that companies need to deploy control mechanisms of the CFB to guaranty the continuity of their activities and their sustainability.
The numerical example in Table 1 illustrates how the bullwhip effect can lengthen the cash conversion cycle due to inventory increase.
Thus, the additional inventory that was observed has led to an increase in the cash conversion cycle by 12 days (81–69 days). This increase will impact the financial liquidity of the company.

3. Cash Flow Bullwhip: State of the Art

3.1. Methodology

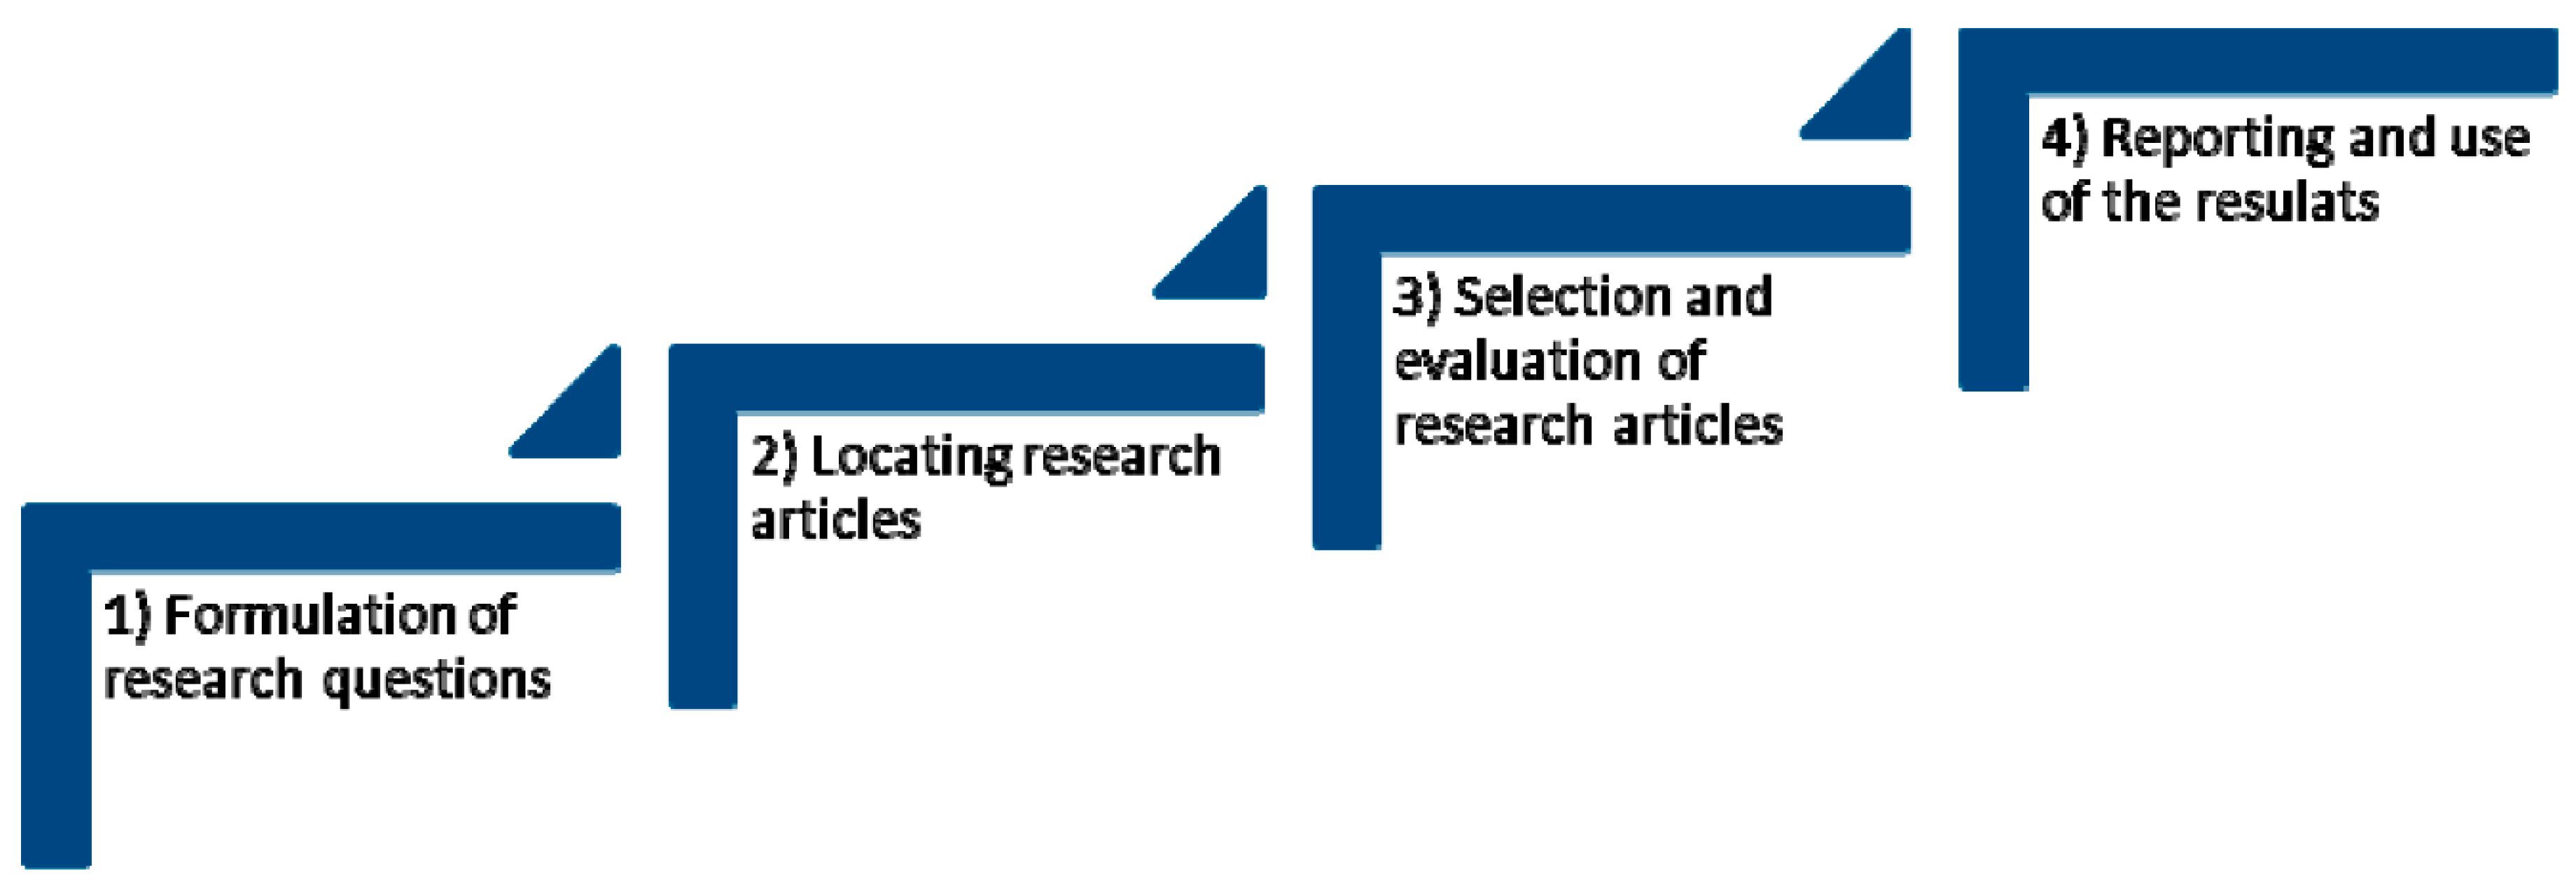
To fully understand the CFB phenomenon, we opted for a systematic literature review. This type of literature review is more methodical compared to narrative reviews and establishes an in-depth description of the steps taken to select, examine, and analyze relevant sources with the aim of minimizing bias and increasing transparency.
We used the approach of Denyer and Tranfield, which distinguishes the four steps in Figure 4.
Since the research question is addressed at the introductory level, we develop the rest of the process in what follows.

3.1.1. Definition of Keywords and Databases

Articles potentially related to our topic were identified by using the terms “Cash flow bullwhip” and “Cash flow distortion” as search keywords to query the Scopus database.

3.1.2. Definition of Selection Criteria

The identification of the most relevant articles was carried out in October 2020. The selection was made based on reading articles’ summaries or books’ introductions. Figure 5 shows the item’s selection process.

3.2. Descriptive Analysis of the Results

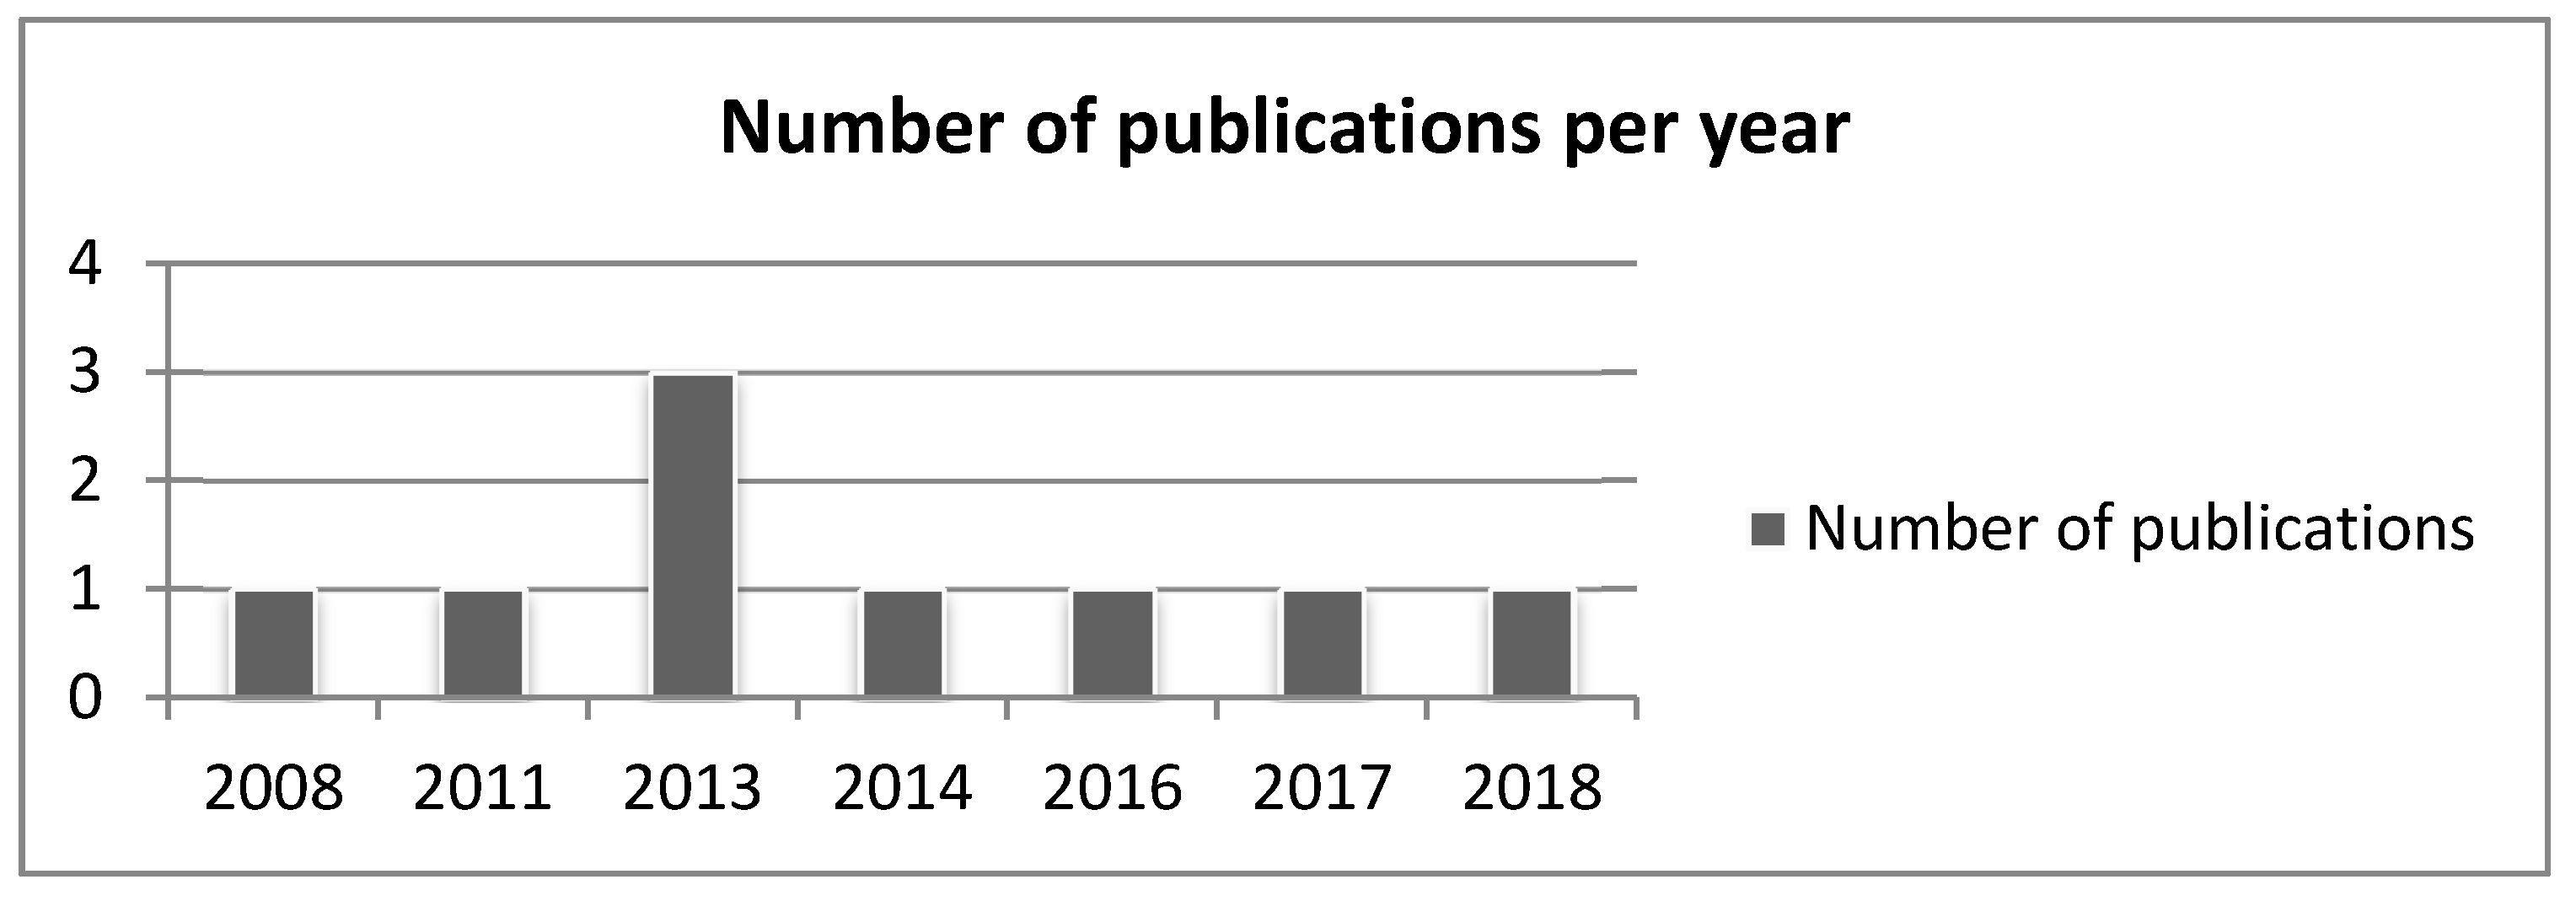
By analyzing the nature of the research work selected, we found that all nine selected works are journal articles. The analysis of the year of publication of the research shows that this is a relatively new subject, since the first article identified was published in 2008. Figure 6 shows the distribution of the articles, by year of publication.
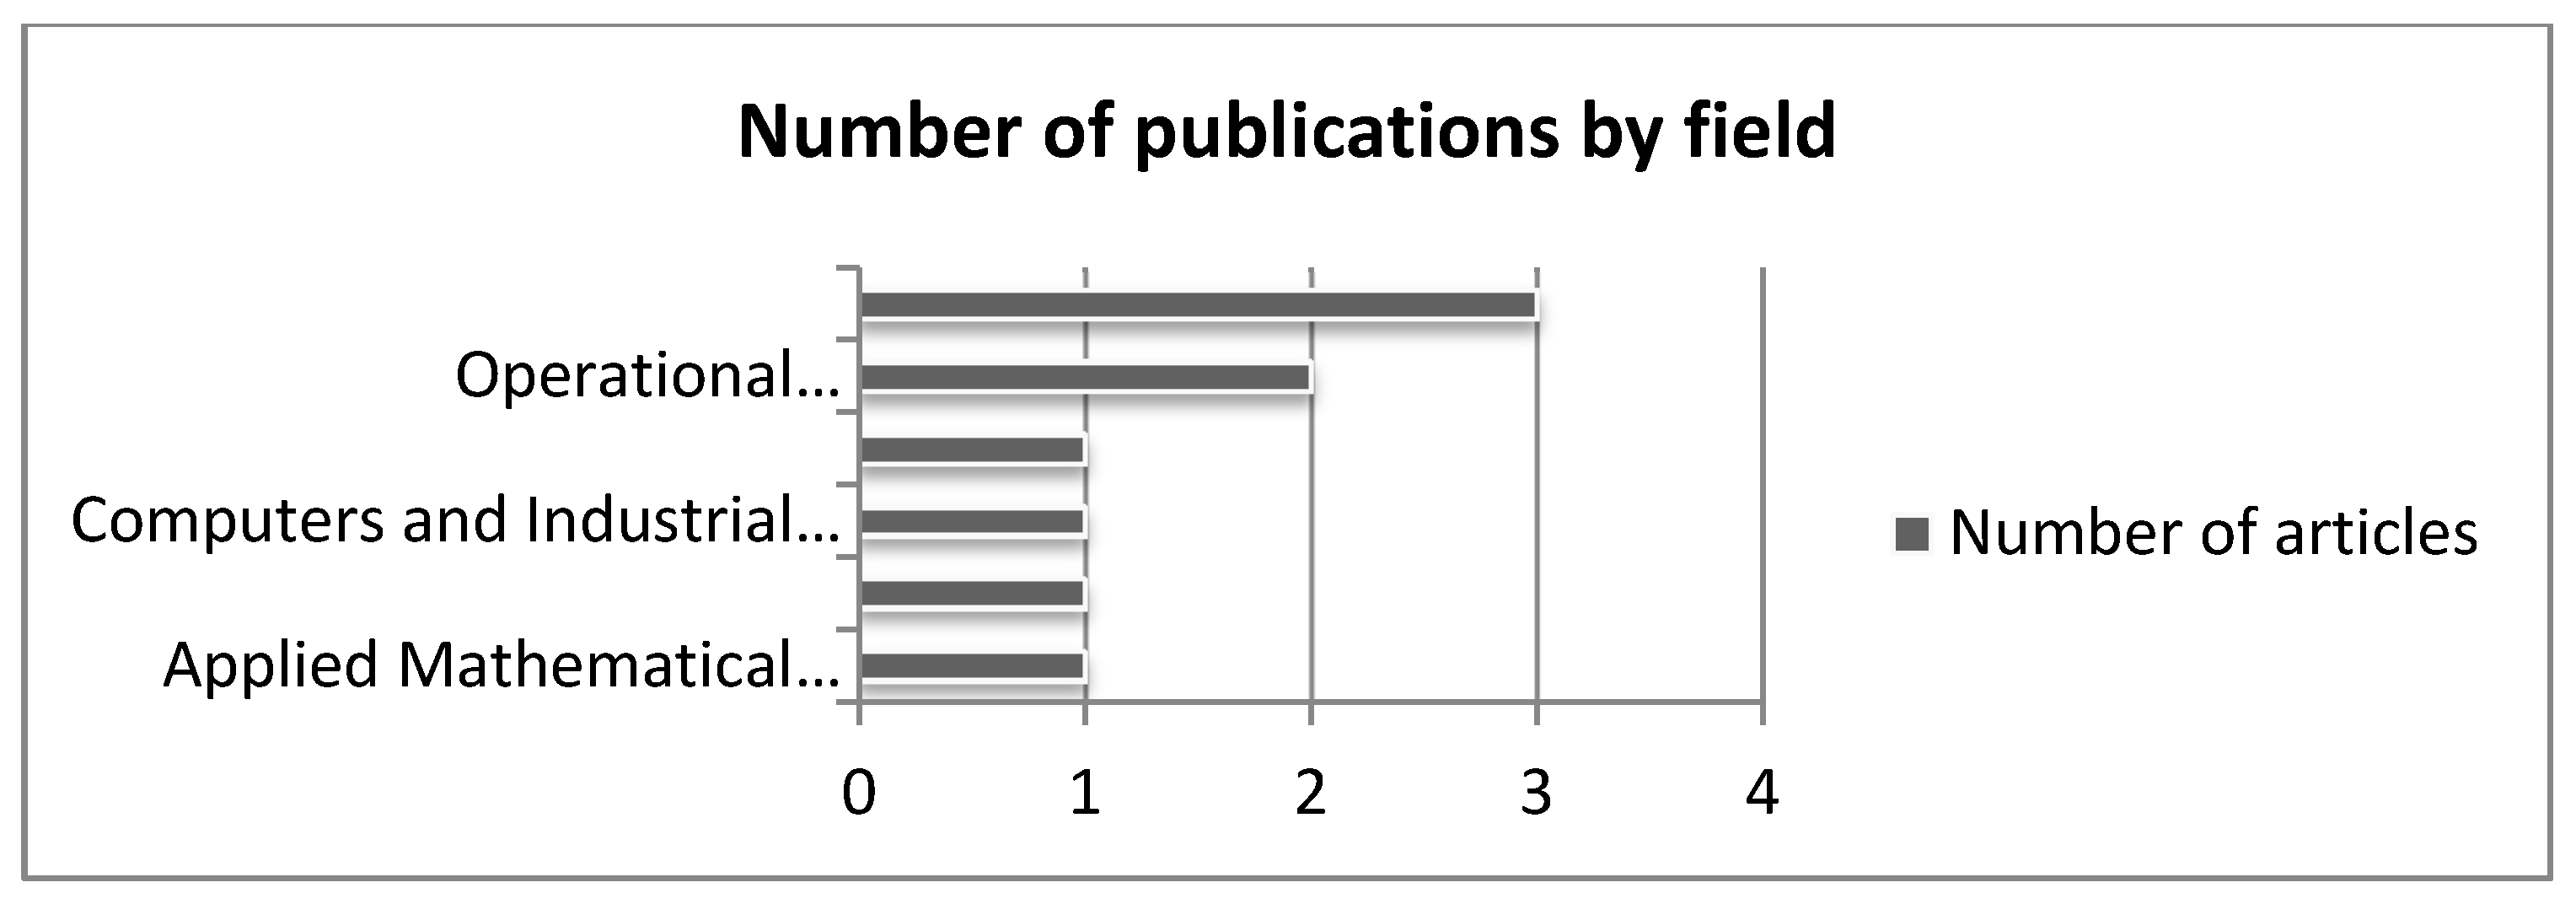
Finally, the analysis of the work selected according to the field of the publication journal reveals the results in Figure 7.

3.3. Content Analysis Results

While the term CFB was introduced in 2013, by Tangsucheeva and Prabhu, to denote the disruption of cash flow caused by the bullwhip effect, several research studies tried to address this topic long before. Thus, a modeling of the cash flow risks linked to the supply chain for a commercial entity was proposed, by measuring the standard deviations of receipt, disbursement, and net flows for each period within a planning horizon [9]. Through this modeling, Tsai provided insight into how practices aiming to improve the cash conversion cycle (CCC), such as early payment discounts, could contribute to cash flow risks. To reduce the cash conversion cycle and the risk of collection, Tsai recommended using an asset-backed securities (ABS) policy to fund accounts receivable. For the researcher, this solution presents an interesting mechanism for small businesses that suffer from limited liquidity and high financing costs.
In addition, Tsai highlighted the collection risks suffered, especially by companies with limited cash resources, when they seek to increase their sales [10]. Indeed, the payment terms granted by suppliers to their customers generate a mismatch between physical flows and financial flows and contribute to the increase in the risk of debt collection and the risk of default. Tsai also described the relationship between physical and financial flows during a period of increasing sales, without any constraint, and then developed a probabilistic model to observe the managerial implications of the cash flow risk linked to cash flow constraints. He deduced that, due to payment delays, the evolution of cash flow is always lower compared to the evolution of sales or accounts receivables. In addition, sales growth is generally accompanied by negative operating cash flow for low margin operations, due to the risk of collection and the evolution of cash flow. On the other hand, he found that unforeseen structural changes in the demand model can lead to a loss of sales opportunities and alters cash receipts. He stated that, when sales growth continues, net cash flow decreases with increasing risk for future periods. He also inferred that efforts to reduce the cash conversion cycle help improve net cash flow, by reducing the mismatch between physical flows and financial flows. For Tsai, unforeseen changes in cash flow parameters require security cash to protect companies. He concluded that cash flow difficulties can force a company to abandon growth opportunities in order to maintain their financial security.
In 2013, Tangsucheeva and Prabhu, demonstrated that, when BWE occurs, it leads to increased stock variability and causes CFB. In other words, since the amplification of orders does not reflect the actual demand, which is less than the orders, the products will be kept in stock longer, which will cause a high cost of stock holding, an opportunity cost, and increased working capital requirement. Thus, CFB refers to the disruption of cash flow caused by the bullwhip effect [2].
Tangsucheeva and Prabhu developed a mathematical model and a simulation to analyze the relationship between inventory and CFB, which allowed them to conclude that increasing end customer demand variability increases inventory and the CFB. They concluded that the CFB is an increasing function of inventories and delivery time, while it is a decreasing function of demand. They also demonstrated that the impact of CFB increases throughout the supply chain, and that the increase in variability of inventory and CFB also exists at the level of multi-level supply chains with centralized management of demand. Finally, they demonstrated that the CFB is a function of the variation of the BWE, the lead time, the order quantity, and the increase in selling prices.
In 2014, Tangsucheeva and Prabhu proposed a stochastic model for forecasting corporate cash flows by taking into account the dynamics of supply chains, and in particular the phenomenon of the bullwhip effect and cash flow bullwhip. The model integrates a Markov chain model for the overall payment behavior of all the company’s customers using aging receivables and a Bayesian model relating to the payment behavior of the individual customer. According to the same authors, the proposed model seems to be independent of the BWE, with a very precise forecast, which makes it robust and adapted to the specific dynamics of supply chains. The robustness of the model improves the use of the company’s working capital [11].
Other research studies have analyzed the simultaneous impact of the causes of the bullwhip effect and the effect of their interactions on the CFB, based on an “Order Up To” replenishment policy [12]. These researchers developed a simulation model, based on the beer distribution game, which includes a multi-stage supply chain, a centralized and a decentralized supply chain. They also developed a CFB function, by designing experiments in a simulation model using response surface methodology (RSM). The results show that, even though each member of the chain uses an “Order Up To” replenishment policy, the CFB still exists in both chains and that the CFB largely comes from the rationing game and the shortage in the two centralized and decentralized supply chains. Additionally, when order parameter information is not shared among members, the downstream stage parameters (i.e., retailer) are more important than the upstream stage parameters (i.e., manufacturer) to reduce the CFB function.
In addition, some researchers have focused on the analysis of the impact of the variability of orders on the variability of supplier payment deadlines at the level of a supply chain, as well as the impact on risk and its propagation in the upstream of the chain [13]. Thus, for these researchers, the variability of payments occurs and spreads upstream despite the stability of orders. Their research makes it possible to identify the factors that lead to the propagation of variability, namely the risk linked to the industry, the operational leverage of the company, the existence of a financial leverage objective, and the cost of the debt.

4. Discussion

This article presents the main contributions of researchers in connection with the phenomenon of cash flow bullwhip. Table 2 is intended as a synthesis of what is discussed above, and it allows illustrating the lines of research that have been addressed, and the perspectives of future research.
Thus, it emerges that the majority of research has focused on the mathematical modeling of the CFB, the optimization of the CCC, and the development of a forecasting model taking into account the mechanisms of the CFB.

5. Conclusions

Cash flow bullwhip is a phenomenon that can harm the financial health of companies by lengthening their cycle of cash conversion, making the time needed to recover the money from the operational activities more unpredictable and instable. This paper reviews the main contributions of the research community and serves as a baseline for future research. In this regard, it seems to us that several research perspectives can still be explored, in particular with the latest developments and changes facing supply chains. In this sense, we propose to treat this subject under other lines of research, including for example:
  • The role of digital technologies in the control of CFB
  • The impact of CFB on the profitability of the company and its investment capacity
  • The study of the CFB phenomenon in light of the pandemic COVID-19 crisis
  • The determination of CFB control’s mechanisms
  • The study of the dynamics associated with CFB within the framework of the omnichannel commerce.

Author Contributions

Conceptualization, H.L. and H.D.; methodology, N.E.H.; writing—original draft preparation, H.L.; writing—review and editing, H.L.; supervision, H.D. All authors have read and agreed to the published version of the manuscript.

Funding

This research received no external funding.

Institutional Review Board Statement

Not applicable.

Informed Consent Statement

Not applicable.

Conflicts of Interest

The authors declare no conflict of interest.

References

  1. Burbidge, J.L. Production Flow Analysis; Oxford University Press: Oxford, UK, 1989. [Google Scholar]
  2. Drissi, H.; El Ghazali, M. Audit Intene et Management des Risques. 2018. Available online: https://www.ceeol.com/search/chapter-detail?id=685399 (accessed on 24 January 2021).
  3. Faucher, P.; Bazet, J. Finance d’entreprise; Nathan: Paris, France, 2010. [Google Scholar]
  4. Fri, M.; Fedouaki, F.; Douaioui, K.; Mabrouki, C.; Semma, E. Supply chain performance evaluation models, state-of-the-art and future directions. Int. J. Eng. Adv. Technol. 2019, 9. [Google Scholar] [CrossRef]
  5. Goodarzi, M.; Makvandi, P.; Saen, R.F.; Sagheb, M.D. What are causes of cash flow bullwhip effect in centralized and decentralized supply chains? Appl. Math. Model. 2017, 44, 640–654. [Google Scholar] [CrossRef]
  6. Forrester, J.W. Industrial Dynamics; The MIT Press: Cambridge, MA, USA, 1961. [Google Scholar]
  7. Lee, H.L.; Padmanabhan, V.; Whang, S. The bullwhip effect in supply chains. Sloan Manag. Rev. 1997, 38, 93–102. [Google Scholar] [CrossRef]
  8. Serrano, A.; Oliva, R.; Kraiselburd, S. Risk propagation through payment distortion in supply chains. J. Oper. Manag. 2018, 58, 1–14. [Google Scholar] [CrossRef]
  9. Sterman, J.D. Modeling managerial behavior: Misperceptions of feedback in a dynamic decision making experiment. Manag. Sci. 1989, 35, 321–339. [Google Scholar] [CrossRef] [Green Version]
  10. Tangsucheeva, R.; Prabhu, V. Modeling and analysis of cash-flow bullwhip in supply chain. Int. J. Prod. Econ. 2013, 145, 431–447. [Google Scholar] [CrossRef]
  11. Tangsucheeva, R.; Prabhu, V. Stochastic financial analytics for cash flow forecasting. Int. J. Prod. Econ. 2014, 158, 65–76. [Google Scholar] [CrossRef]
  12. Tsai, C.Y. On supply chain cash flow risks. Decis. Support Syst. 2008, 44, 1031–1042. [Google Scholar] [CrossRef]
  13. Tsai, C.Y. On delineating supply chain cash flow under collection risk. Int. J. Prod. Econ. 2011, 129, 186–194. [Google Scholar] [CrossRef]
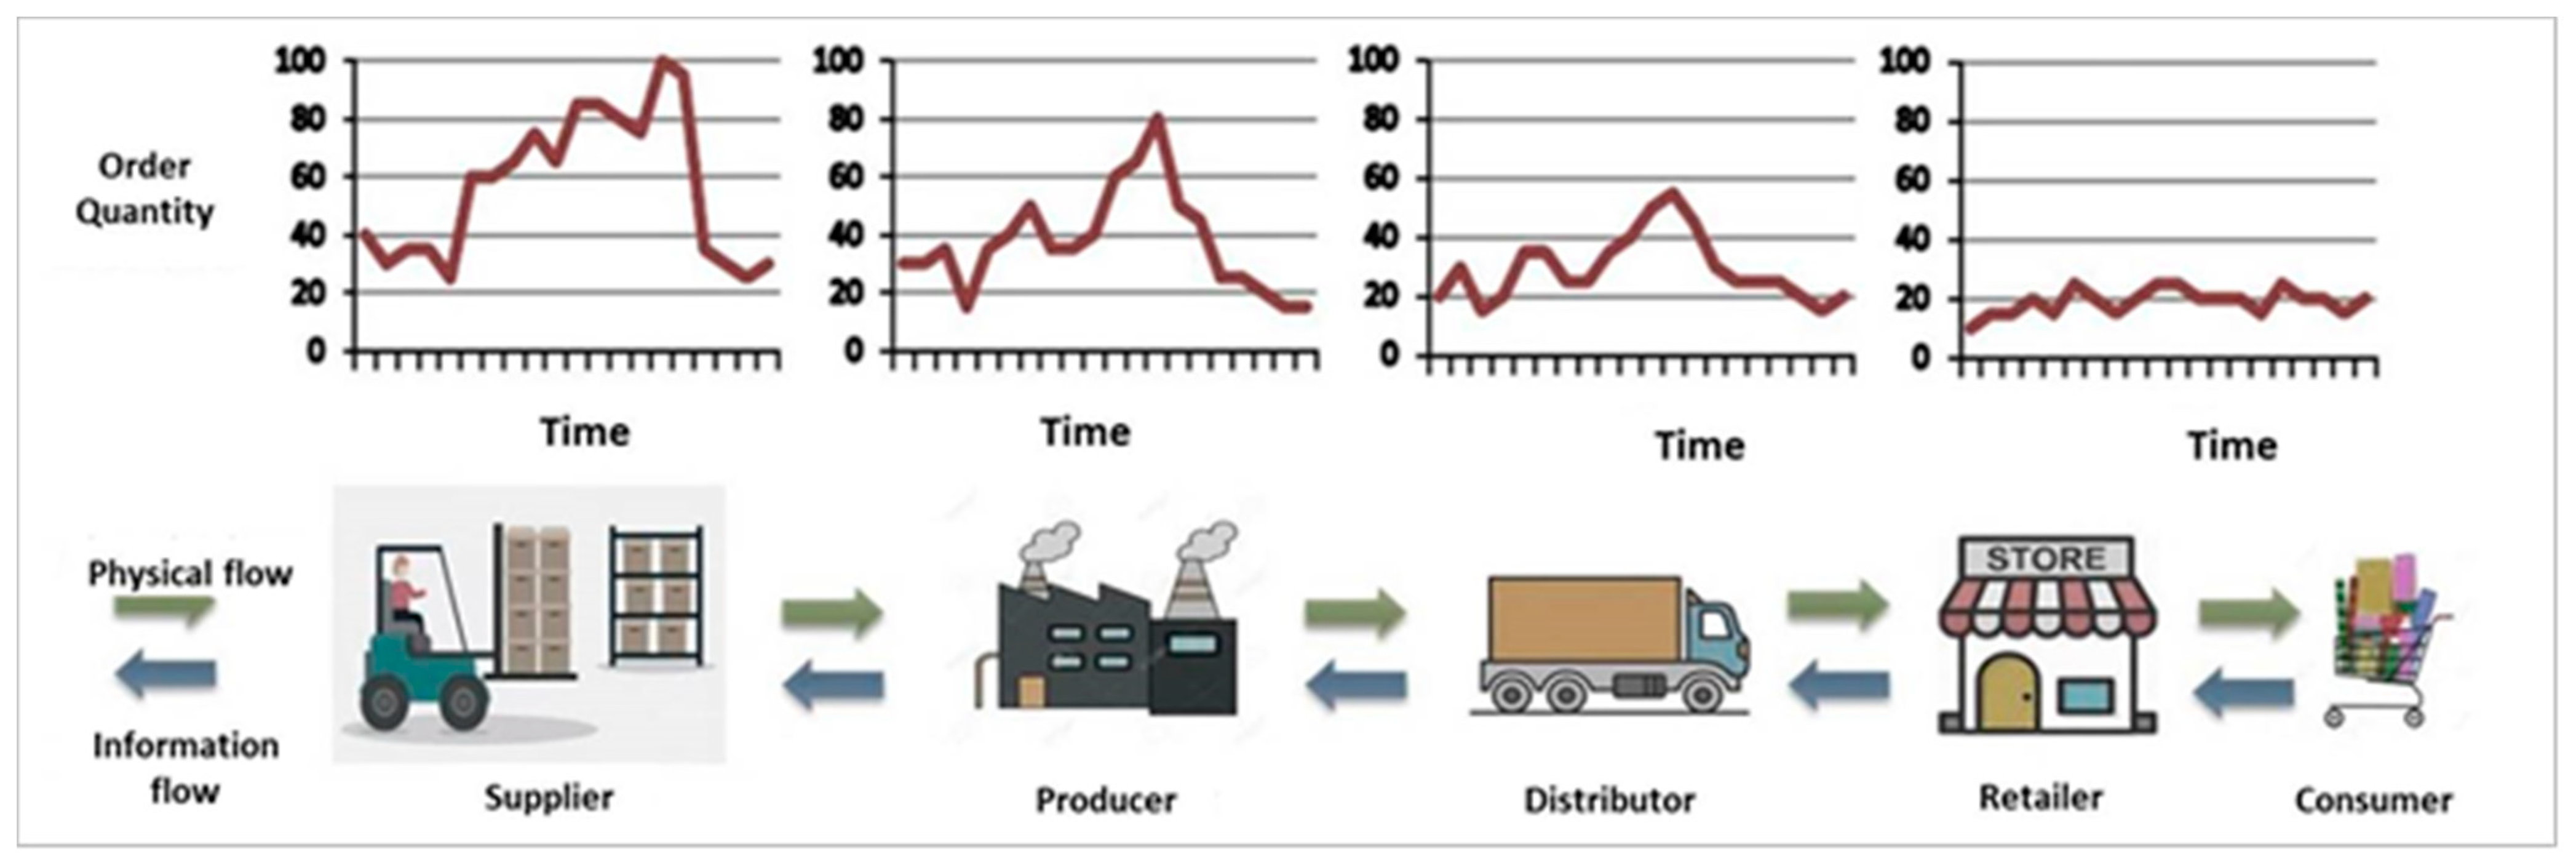
Figure 1. Bullwhip effect in supply chains.
Logistics 05 00008 g001
Figure 2. Relationship among current assets, current liabilities, and WCR.
Logistics 05 00008 g002
Figure 3. Relationship among self-financing capacity operational cash flow, and WCR.
Logistics 05 00008 g003
Figure 4. Research methodology.
Logistics 05 00008 g004
Figure 5. Research work selection process.
Logistics 05 00008 g005
Figure 6. Distribution of the publications per year.
Logistics 05 00008 g006
Figure 7. Distribution of the publications by field.
Logistics 05 00008 g007
Table 1. Numerical example.
- We consider the following elements at the end of the first month “M1” for a company:
  • An average inventory of $900,000 for an inventory cost of $6,000,000 that represents a flow time of:
  • An average accounts receivables of $1,500,000 for an annual turnover of $12,000,000 that represents a flow time of:
  • An average accounts payables of $500,000 for an inventory cost of $6,000,000 that represents a flow time of:
  • This leads to a cash conversion cycle of:
  ( 900000 6000000 × 360 ) = 54   days
  ( 1500000 12000000 × 360 ) = 45   days
  ( 500000 6000000 × 360 ) = 30   days
60   days + 54   days 30   days = 69   days
- Due to the phenomenon of bullwhip effect, we suppose that the average inventory of this company has grown to $1,100,000 in the following month “M1”. We assume that the rest of elements have not changed.
  • The new amount of inventory is of $1,100,000 for an inventory cost of $6,000,000. This represents a flow time of:
  • An average accounts receivables of $1,500,000 for an annual turnover of $12,000,000 that represents a flow time of:
  • An average accounts payables of $500,000 for an inventory cost of $6,000,000 that represents a flow time of:
  • This leads to a cash conversion cycle of:
  ( 110000 6000000 × 360 ) = 66   days
  ( 1500000 12000000 × 360 ) = 45   days
  ( 500000 6000000 × 360 ) = 30   days
60   days + 54   days 30   days = 81   days
Table 2. Summary of researchers’ contributions according to the angle of analysis.
AuthorsAnalysis Angle
SimulationForecastingOptimization
Chih-Yang Tsai, 2008 Optimization of the CCC and reduction of the risk of collection
Chih-Yang Tsai, 2011 Reducing the risk of collection through a probabilistic optimization model
Rattachut Tangsucheeva, Vittaldas Prabhu, 2013Mathematical modeling of the CFB and simulation of the relationship between the stock and the CFB
Rattachut Tangsucheeva, Vittaldas Prabhu, 2014 Stochastic cash flow forecasting model taking into account the CFB
Marziye Goodarzi, Payam Makvandi, Reza Farzipoor Saen, Mohammad Daniel Sagheb, 2017Mathematical modeling using response surface methodology (RSM)
Alejandro Serrano, Rogelio Oliva, Santiago Kraiselburd, 2018Mathematical modeling of the impact of CFB on the propagation of the risk of non-payment.
Publisher’s Note: MDPI stays neutral with regard to jurisdictional claims in published maps and institutional affiliations.