A New Logistic Model of Market Information Asymmetry Reduction in Poland

Abstract
1. Introduction
- Does logistification of the world economy have a role in limiting the scale of market information asymmetry?
- What elements of the logistics process in a firm singularly contribute to the reduction in the consequences of market information asymmetry?
2. The Nature of Market Information Asymmetry: A Literature Review
- The flourishing logistics industry, where value offered to client strictly depends on operational excellence.
- The versatility and universality of logistics, which in turn poses strategic challenges for clients. In this respect, its particular role is attributed to the following [13]:
- Strategy of creative logistics: management of change, creating innovative methods of evaluating logistics effectiveness
- Strategy of pervading logistics: acquiring superior logistics competencies through information exchange
- Strategy of systemic logistics: implementing logistic audits, identification of profit centres and added value sources.
- Wide access to logistics training, not least because logistics has now become part of management science. A special feature of specialist logistics training is the ability to combine the personnel function of human resource management with the requirements of logistics management [14]. As studies conducted in Polish firms have shown, logisticians are characterized by high motivation in the administration of logistics tasks and creativity with respect to European requirements.
3. The Role of Logistics in Reducing the Effects of Market Information Asymmetry—The Measuring Method
- Intensified internationalization of enterprises in the twenty-first century, with a special role attributed to transnational strategies for company development
- Dynamic increase of the number and quality of logistics services globally
- The steadily growing role of strategic alliances formed by logistics and transport firms.
- Internationalization of logistics processes, from simple operational tasks to logistics as company strategy
- Internationalization of markets for goods and services through global logistics services, including outsourcing and offshoring
- Internationalization of logistics management in firms and transnational corporations through implementing modern methods of strategic management.
- Artificial intelligence (AI)
- Augmented reality (AR)
- Self-driving vehicles (SDV)
- Robotics (RO)
- Discriminating competencies, including logistics competencies
- Geographic reach of logistics operations
- Diversification of supply sources
- Synergy effect
- Capacity planning (CP)
- Location planning (LP)
- Facilities design (FD)
- Operations scheduling (OS)
- Agility
- Adaptability
- Alignment
- Easier entry to the market, especially the transport market
- Equal sharing of profits among partners in the alliance
- Equal participation of partners in R&D aimed at developing new services
- Gaining competitive advantage in the market
- The synergy effect
- An equitable share in the management of the alliance, based on the proportion of shares owned
- Appointing one partner as manager of the strategic alliance
- Delegating management functions to selected partners
- International reach of operations
- Annual net sales over 50 million PLN
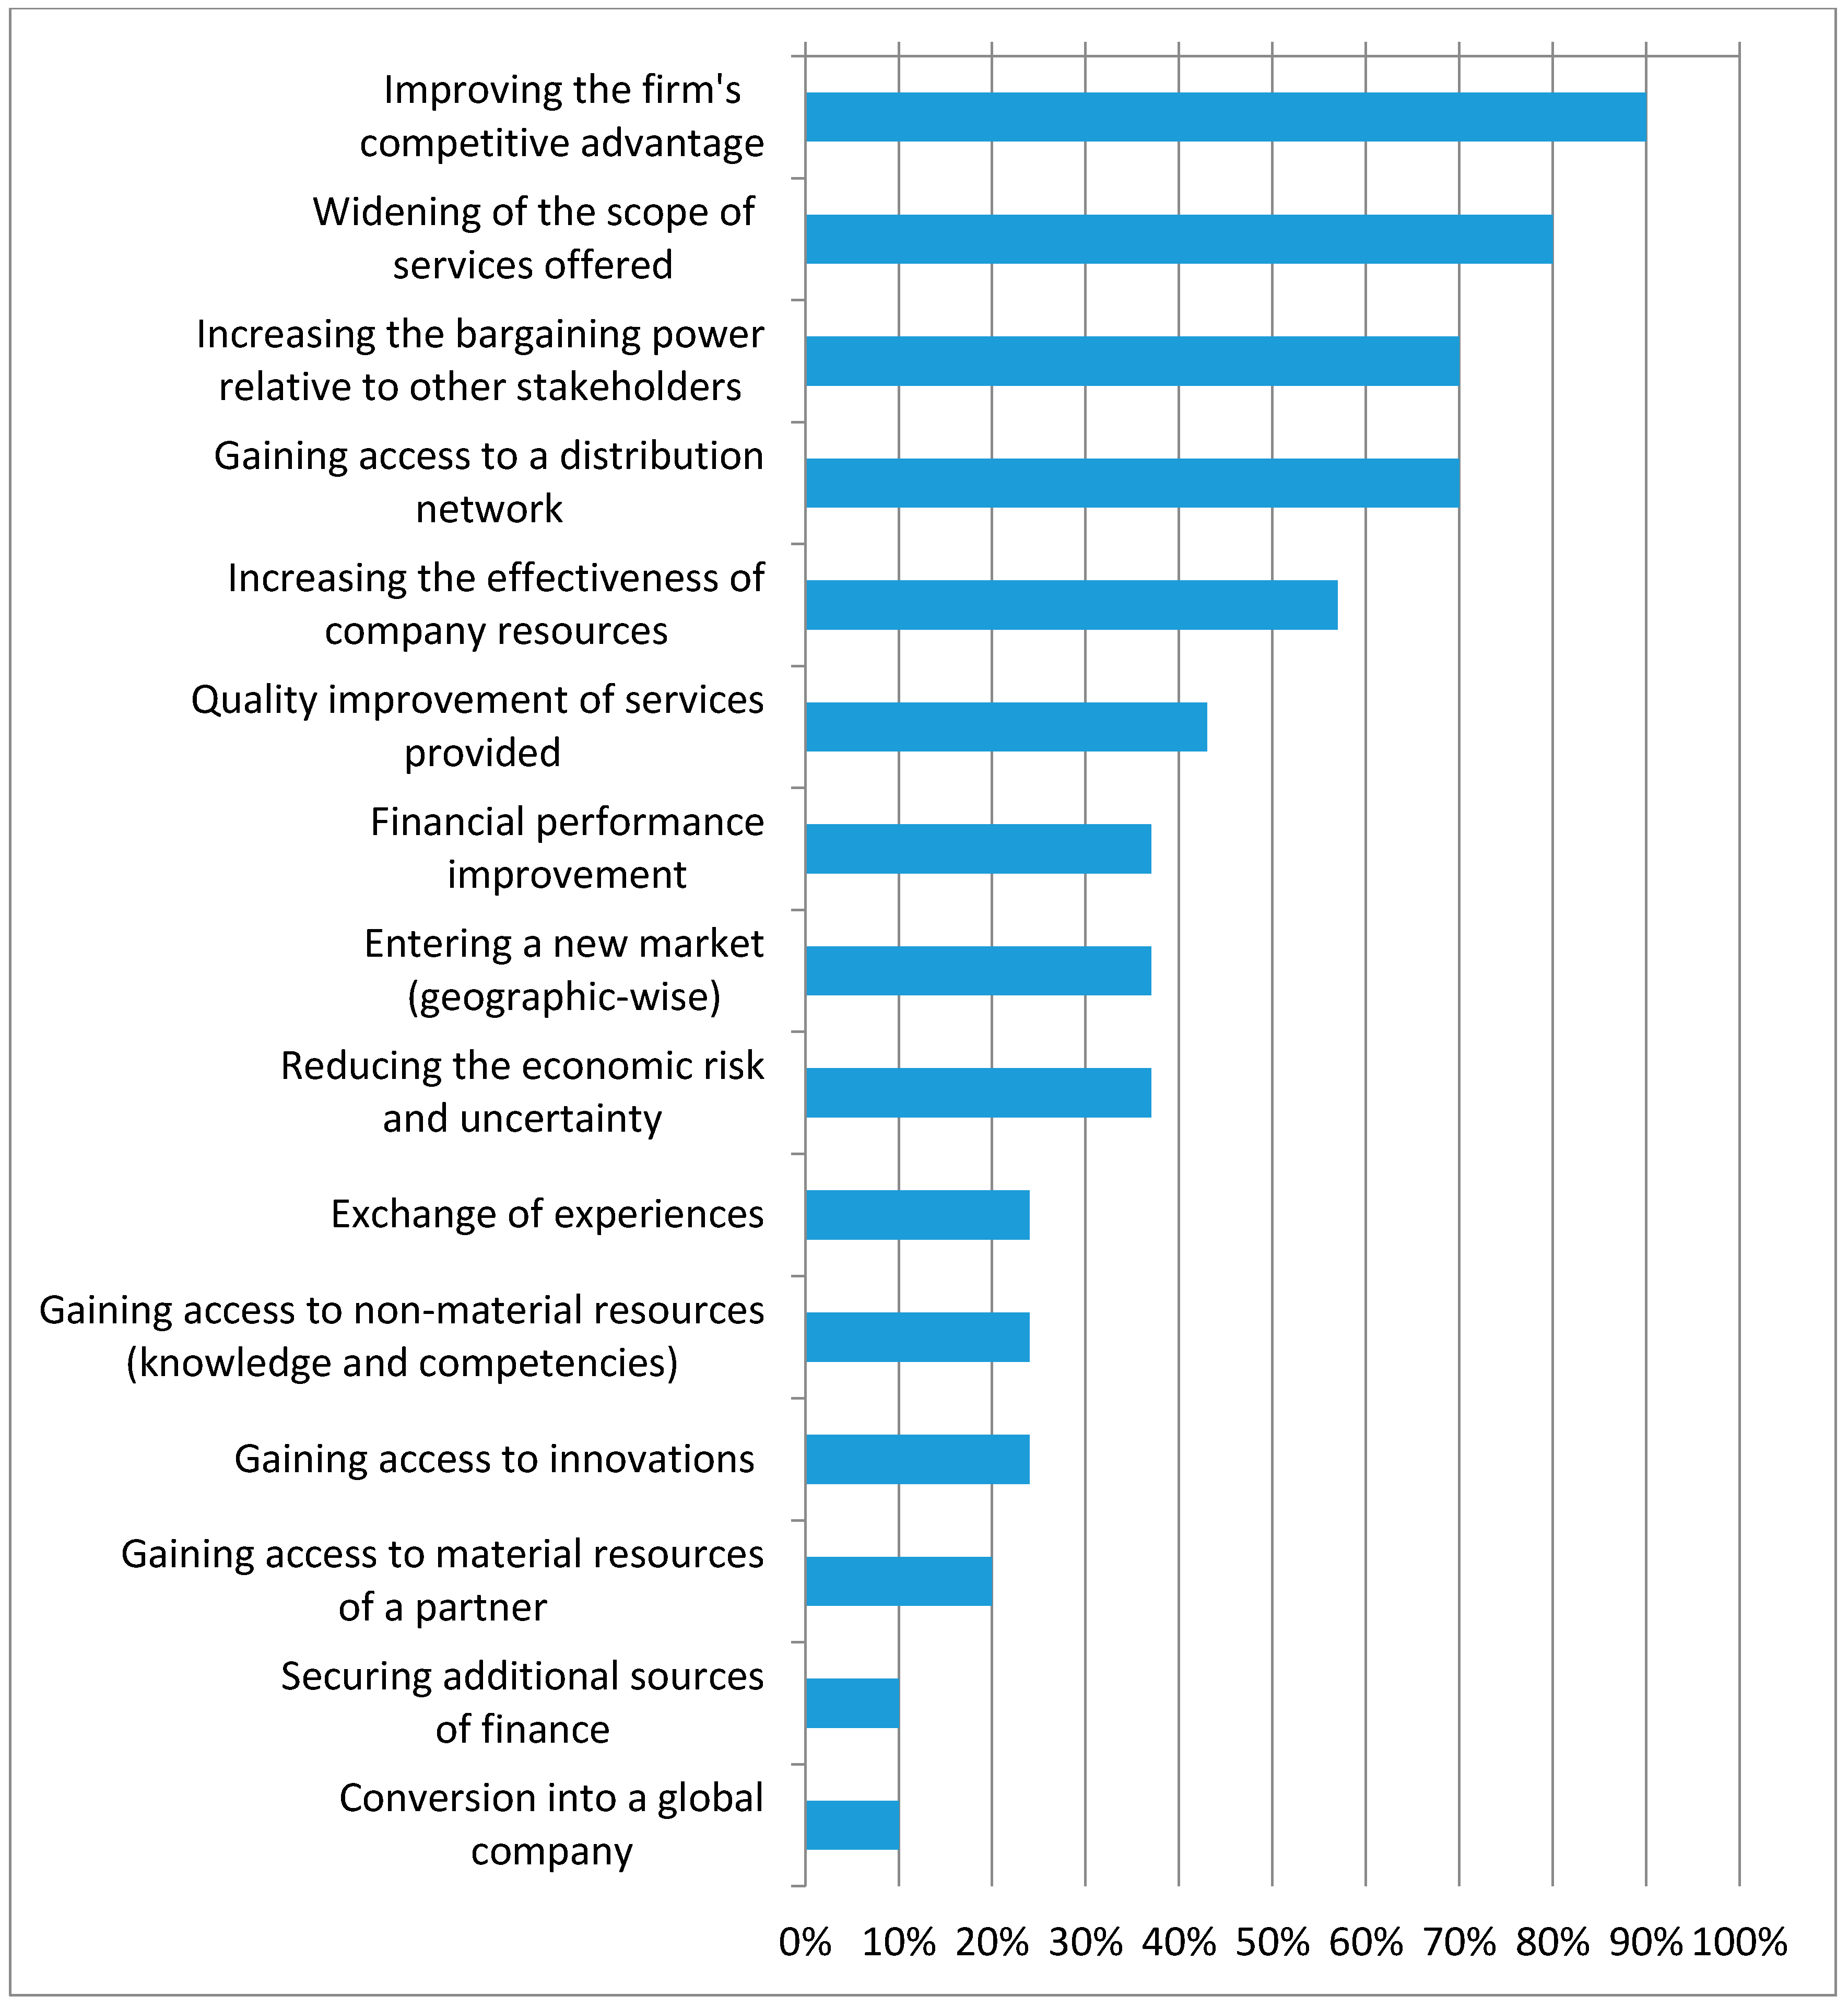
- What were the aims of the alliance?
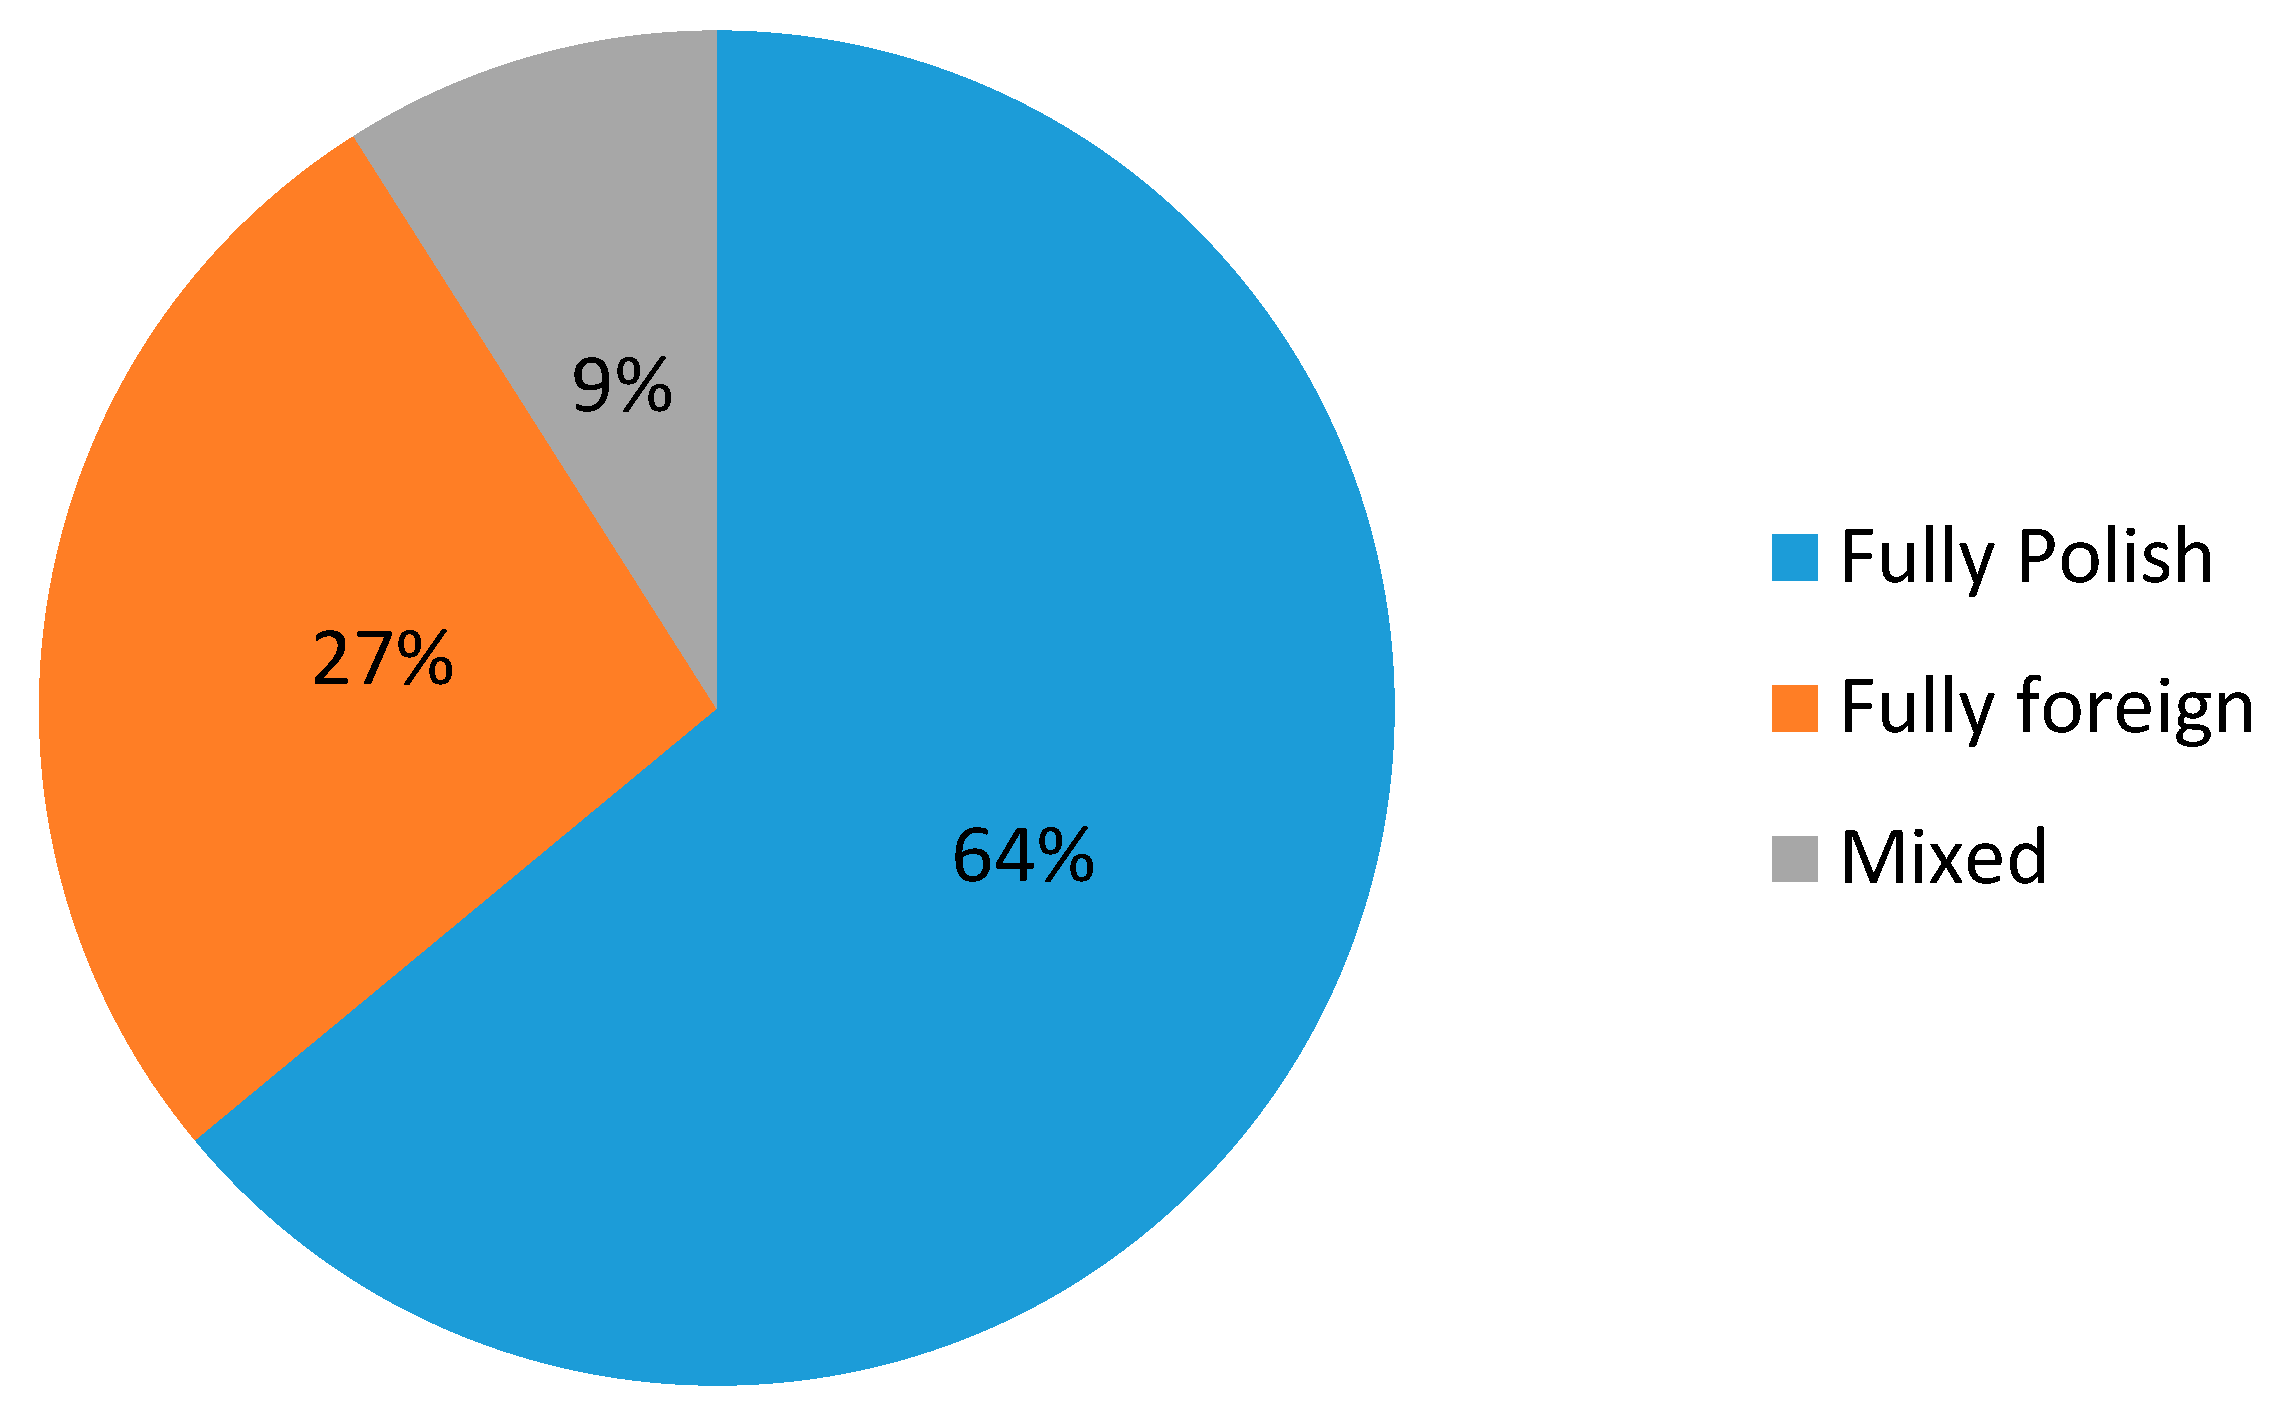
- What was the origin of capital in the surveyed firms?
- What factors determined the success of alliances?
- Good communication within the alliance
- Selecting appropriate partners
- Ethical behaviour of partners in the alliance
- Fulfilment of set objectives
- Friendly, partner relations within the alliance
4. Assessment of the Logistics Influence on Information Asymmetry Effects: The Study Results
5. Conclusions
- Methodology: the choice and characteristics of the elements of logistics used in the LMAI model.
- The empirical layer: the processing of source data collected from Polish firms in the period 2004–2018.
- The future: propositions for follow-up research to investigate the role of logistics in reducing the effects of market information asymmetry.
- 1.
- The Methodological Layer
- The operation of transforming de-stimulants into stimulants is justified. This is a classical statistical procedure whereby variables belonging to different domains are expressed as a number of standard deviations from the average.
- It was deemed necessary to determine parameters qi, which are the measures showing how much individual indicators divert from maximum values in the sample.
- As a result, the LMAI indicator was computed from coefficients qi through their normalization, which enabled the expression of the impact of individual logistics processes on the level of market information asymmetry as percentages.
- 2.
- The Empirical Layer
- The model evaluates various components of logistics activities such as sales, company assets, inventories, investments in logistics infrastructure, cost of logistics, and cost of transport.
- Recognizing the fact that the study findings will be different depending on the type of business activity, three types of firms were identified: manufacturers, distributors and service providers.
- The study covered businesses from nine sectors which are key to Poland’s economy. These include metal processing, pharmaceutical, and electronics industries, household electric goods wholesalers, clothing and foodstuffs traders, telecommunications, and tourism. The study findings clearly show that the reduction in information asymmetry due to logistics is greatest in high technology industries.
- 3.
- The Future
- The model can process any number of arbitrarily chosen aspects of logistics activities, such as warehousing and inventory holding costs, costs of supplies, value of turnover, etc.
- Depending on the region or country where a firm is based, different demand-sensitive industries can be considered, e.g., the chemical industry, automotive industry, furniture manufacturers, or hospitality industry.
- Future studies of this interesting phenomenon could also consider different levels of economic development in selected regions of the world.
Funding
Institutional Review Board Statement
Informed Consent Statement
Data Availability Statement
Conflicts of Interest
References
- Fabbe-Costes, N.; Rouquet, A. (Eds.) La Logistization du Monde: Chroniques sur une Révolution en Cours; Presses Universitaires De Provance: Marseille, France, 2019. [Google Scholar]
- Banaszyk, P.; Gołembska, E. Logistyka w Biznesie Międzynarodowym (Logistics in International Business); WMT: Warszawa, Poland, 2015. [Google Scholar]
- Blajer-Gołębiewska, A. Modelowanie Niepełnej Informacji za Pomocą Teorii Gier (Modelling of Incomplete Information Using the Game Theory); Szczecin University Publishers: Szczecin, Poland, 2007. [Google Scholar]
- Akerlof, G.A. The Market for Demons. Quality Uncertainty and the Market Mechanism. Q. J. Econ. 1970, 84, 488–500. [Google Scholar] [CrossRef]
- Spence, M. Job Market Signaling. Q. J. Econ. 1973, 87, 355–374. [Google Scholar] [CrossRef]
- Stiglitz, J.E. Informacja i Zmiana Paradygmatu w Ekonomii (Information and the Change in the Paradigm in Economics); Gospodarka Narodowa: Warszawa, Poland, 2004; Nos. 3–4. [Google Scholar]
- Gruszecki, T. Współczesne Teorie Przedsiębiorstwa (Modern Theories of the Business Enterprise); WMT: Warszawa, Poland, 2002. [Google Scholar]
- Stradomski, M. Finansowanie Obce Firm Rodzinnych na Rynku Niedoskonałym (Family Firm Non-Equity Financing in the Imperfect Market); PWE: Warszawa, Poland, 2010. [Google Scholar]
- Noga, A. Teorie Przedsiębiorstw (Theories of the Business Enterprise); PWE: Warszawa, Poland, 2011. [Google Scholar]
- Williamson, O. Corporate Finance and Corporate Governance. J. Financ. 1988, 43, 19. [Google Scholar] [CrossRef]
- Hart, O. Firms, Contracts and Finnacial Structure; Oxford University Press: London, UK, 1995. [Google Scholar]
- Kubiak, J. Zjawisko Asymetrii Informacji a Struktura Kapitału Przedsiębiorstw w Polsce (The Phenomenon of Information Asymmetry and the Capital Structure of Companies in Poland); UEP: Poznań, Poland, 2013. [Google Scholar]
- Gołembska, E. Nowe paradygmaty w rozwoju logistyki międzynarodowej (New paradigms in the development of international logistics. In Logistyka Międzynarodowa w Gospodarce Światowej (International Logistics in the Global Economy); Gołembska, E., Szuster, M., Eds.; AEP: Poznań, Poland, 2008. [Google Scholar]
- Gołembska, E.; Gołembski, M. Transport w Logistyce; CeDeWu Publishers: Warszawa, Poland, 2020. [Google Scholar]
- Gołembska, E.; Gołembski, M. A New Model of the Personnel Function Delivery in the Logistics of Polish Firms. Logistics 2020, 4, 15. [Google Scholar] [CrossRef]
- Gołembska, E. Logistyka Międzynarodowa (International Logistics); PWN: Warszawa, Poland, 2014. [Google Scholar]
- Gołembska, E. Logistyka w Gospodarce Światowej (Logistics in the Global Economy); CH. Beck: Warszawa, Poland, 2009; p. 51. [Google Scholar]
- Insight Partners, Third Party Logistics Market—Global Analysis to 2025, Anand EMP, 2018. Available online: https://www.theinsightpartners.com/reports/third-party-logistics-market (accessed on 15 September 2020).
- Bartlett, C.A.; Ghoshal, S. Transnational Management; R.D. Irwin: Chicago, IL, USA, 1995. [Google Scholar]
- Hill, C.W.I.; Jones, G.R. Strategic Management; An Analytical Approach; Houghton Mifflin: Boston, MA, USA, 2004. [Google Scholar]
- David, P.; Steward, R. International Logistics; Thomson: London, UK, 2008. [Google Scholar]
- Gołembska, E.; Bentyn, Z.; Gołembski, M. Logistyka Usług (Services Logistics); PWN: Warszawa, Poland, 2017. [Google Scholar]
- Griffin, R.W.; Pustay, M.W. International Business: A Managerial Perspective; Pearson: London, UK, 2020. [Google Scholar]
- Gibson, R.; Saghiri, S.; Godsmark, J. Supply Chain Innovations. CILT-Focus Magazine, 2017; 34. [Google Scholar]
- Peng, M.; Meyer, K. Supply chain management. In International Business; Gengage Learning EMEA: Andover, UK, 2019. [Google Scholar]
- Gołembski, M. Funkcja Personalna w Przedsiębiorstwie. Aktualne Trendy i Perspektywy Rozwoju (The Firm’s Personnel Function. Contemporary Trends and Development Prospects); CeDeWu: Warszawa, Poland, 2019. [Google Scholar]
- Godsmark, J.; Richards, G. The Logistics Outsourcing; Kogan Page: London, UK, 2020. [Google Scholar]
- Gołembska, E. New Logistics paradigms in Poland. Logistics 2019, 2, 19. [Google Scholar] [CrossRef]
- Tsang, E.W.K. Acquiring knowledge by foreign partners from international joint ventures in a transition economy: Learning-by-doing and learning myopia. Strateg. Manag. J. 2002, 23, 835–854. [Google Scholar] [CrossRef]
- Gołembska, E.; Tunak, B. Alianse Strategiczne w Konkurencyjności Usług Logistycznych (Strategic Alliances and Competitive Advantage of Logistics Services); WSB: Poznań, Poland, 2018. [Google Scholar]
- Ireland, R.D.; Hitt, M.A.; Vaidyanath, D. Alliance Management as a Source of Competitive Advantage. J. Manag. 2002, 28, 413–446. [Google Scholar] [CrossRef]


| No. | Industry Name | Synthetic Measure of Information Asymmetry (SMAI) | Median | Max | Min | Standard Deviation |
|---|---|---|---|---|---|---|
| 1. | Pharmaceutical industry | 3.419 | 2.181 | 20.875 | 1.267 | 3.533 |
| 2. | Services (intangible) | 3.343 | 2.394 | 27.778 | 0.231 | 4.404 |
| 3. | Machine industry | 2.947 | 2.479 | 18.696 | 0.827 | 1.755 |
| 4. | Trade and hospitality | 2.704 | 2.391 | 19.183 | 0.439 | 1.635 |
| 5. | Wood processing industry | 2.534 | 2.216 | 21.226 | 0.309 | 1.741 |
| 6. | Transport and logistics | 2.376 | 2.179 | 28.323 | 0.660 | 1.805 |
| 7. | Power generation | 1.853 | 1.769 | 13.639 | 0.459 | 1.290 |
| 8. | Purification and distribution of potable water, waste management | 1.906 | 1.866 | 5.589 | 0.623 | 0.675 |
| 9. | Mining and quarrying industry | 1.845 | 1.996 | 3.917 | 0.179 | 0.725 |
| Form of Internationalization | Examples |
|---|---|
| Internationalization of markets |
|
| Internationalization of institutions and organizations |
|
| Internationalization of economic policy instruments |
|
| Name of the Unit | Scope of Operation |
|---|---|
| SSC (Shared Services Centre) | The centre providing shared services for operational units of an organization or for companies belonging to a capital group. As a rule, such a unit does not provide services to external entities. |
| BPO (Business Process Outsourcing) | Specialized firms providing outsourced services for external clients. Most frequently these units provide services such as accounting, payrolls, or administration of the personnel function. Selected complete functions of a firm are transferred to a BPO and processed within its structure. |
| R&D (Research and Development) | Centres of R&D conduct research and development work for the parent company within a group. Such units are mostly related to business organizations in manufacturing and high technology industries. |
| ITO (IT Outsourcing) | Units specializing in executing and controlling various IT processes for clients (computer systems, databases, network administration, etc.). Services of this type are provided for both operational units within a parent company and for external entities. |
| No. | Group of Industries | Industry | Sales PLN | Total Assets PLN m | Average Value of Inventories PLN m | Share of Inventories in Assets % | Logistics Infrastructure Investments Expenditure | Costs of Logistics as % Share of Sales | Transport Costs as % Share of Sales |
|---|---|---|---|---|---|---|---|---|---|
| 1. | Producers | Metal industry | 300.3 | 80.1 | 16.1 | 20 | 33 | 19 | 12 |
| 2. | Pharmaceutical industry | 168.3 | 132.9 | 13.8 | 10.3 | 50 | 17 | 14 | |
| 3. | Electronics industry | 86.4 | 20.6 | 8.7 | 4.2 | 21 | 12 | 13 | |
| 4. | Distributors | Household electrical goods wholesalers | 15 | 3.6 | 16.5 | 45 | 10 | 18 | 15 |
| 5. | Clothing trading companies | 38.7 | 4.1 | 2.8 | 68.2 | 8 | 16 | 11 | |
| 6. | Foodstuffs trading companies | 114 | 31.2 | 26.4 | 84.6 | 15 | 19 | 16 | |
| 7. | Service providers | Telecommunications | 36.3 | 9.6 | 2.4 | 2.5 | 5 | 19 | 7 |
| 8. | Transport | 66.3 | 18.2 | 7.5 | 4.1 | 8 | 11 | 9 | |
| 9. | Tourism | 20.7 | 5.6 | 2.4 | 4.3 | 4 | 28 | 15 |
| Variables Describing Logistics Activities | Stimulants/De-Stimulants | Weights |
|---|---|---|
| Sales (PLN million) | de-stimulant | 0.25 |
| Total assets (PLN million) | de-stimulant | 0.1 |
| Average value of inventories (PLN million) | de-stimulant | 0.1 |
| Percentage share of inventories in assets | de-stimulant | 0.1 |
| Value pf logistics infrastructure investment expenditure | stimulant | 0.1 |
| Costs of logistics as percentage share of sales | de-stimulant | 0.25 |
| Transport costs as percentage share of sales | stimulant | 0.1 |
| No. | Group of Industries | Industry | Sales PLN | Total Assets PLN m | Average Value of Inventories PLN m | Share of Inventories in Assets % | Logistics Infrastructure Investments Expenditure | Costs of Logistics as % Share of Sales | Transport Costs as % Share of Sales |
|---|---|---|---|---|---|---|---|---|---|
| 1. | Producers | Metal industry | −2.386 | −1.109 | −0.697 | −1.097 | −1.097 | −0.289 | −0.157 |
| 2. | Pharmaceutical industry | −0.859 | −2.379 | −0.398 | −2.270 | −2.270 | 0.144 | 0.549 | |
| 3. | Electronics industry | 0.088 | 0.322 | 0.264 | −0.268 | −0.268 | 1.227 | 0.196 | |
| 4. | Distributors | Household electrical goods wholesalers | 0.914 | 0.731 | −0.749 | 0.491 | 0.491 | −0.072 | 0.902 |
| 5. | Clothing trading companies | 0.639 | 0.719 | 1.031 | 0.629 | 0.629 | 0.361 | −0.510 | |
| 6. | Foodstuffs trading companies | −0.231 | 0.067 | −2.035 | 0.146 | 0.146 | −0.289 | 1.255 | |
| 7. | Service providers | Telecommunications | 0.667 | 0.586 | 1.083 | 0.836 | 0.836 | −0.289 | −1.922 |
| 8. | Transport | 0.320 | 0.380 | 0.420 | 0.629 | 0.629 | 1.443 | −1.216 | |
| 9. | Tourism | 0.848 | 0.683 | 1.083 | 0.905 | 0.905 | −2.237 | 0.902 |
| No. | Group of Industries | Industry | q Indicator Value |
|---|---|---|---|
| 1. | Producers | Metal industry | 2.282 |
| 2. | Pharmaceutical industry | 2.021 | |
| 3. | Electronics industry | 1.122 | |
| 4. | Distributors | Household electrical goods wholesalers | 1.058 |
| 5. | Clothing trading companies | 0.814 | |
| 6. | Foodstuffs trading companies | 1.467 | |
| 7. | Service providers | Telecommunications | 1.598 |
| 8. | Transport | 1.228 | |
| 9. | Tourism | 2.035 |
| No. | Group of Industries | Industry | LMAI Indicator Value |
|---|---|---|---|
| 1. | Producers | Metal industry | 0.0% |
| 2. | Pharmaceutical industry | 11.4% | |
| 3. | Electronics industry | 50.8% | |
| 4. | Distributors | Household electrical goods wholesalers | 53.6% |
| 5. | Clothing trading companies | 64.3% | |
| 6. | Foodstuffs trading companies | 35.7% | |
| 7. | Service providers | Telecommunications | 30.0% |
| 8. | Transport | 46.2% | |
| 9. | Tourism | 10.8% |
Publisher’s Note: MDPI stays neutral with regard to jurisdictional claims in published maps and institutional affiliations. |
© 2021 by the author. Licensee MDPI, Basel, Switzerland. This article is an open access article distributed under the terms and conditions of the Creative Commons Attribution (CC BY) license (http://creativecommons.org/licenses/by/4.0/).
Share and Cite
Gołembska, E. A New Logistic Model of Market Information Asymmetry Reduction in Poland. Logistics 2021, 5, 5. https://doi.org/10.3390/logistics5010005
Gołembska E. A New Logistic Model of Market Information Asymmetry Reduction in Poland. Logistics. 2021; 5(1):5. https://doi.org/10.3390/logistics5010005
Chicago/Turabian StyleGołembska, Elżbieta. 2021. "A New Logistic Model of Market Information Asymmetry Reduction in Poland" Logistics 5, no. 1: 5. https://doi.org/10.3390/logistics5010005
APA StyleGołembska, E. (2021). A New Logistic Model of Market Information Asymmetry Reduction in Poland. Logistics, 5(1), 5. https://doi.org/10.3390/logistics5010005