


Abstract
Background: Transport costs in industrial waste management can account for up to 60% of total expenditures, yet existing optimization models often rely on simplified distance metrics and treat facility location and routing separately. This paper addresses these gaps. Methods: A simulation model is developed integrating real OpenStreetMap road networks, differentiated environmental risk coefficients by waste hazard class, and joint optimization of the number, location, and capacity of sorting stations and recycling plants. A nearest-available-facility heuristic is applied for routing. The model is implemented as an agent-based simulation in AnyLogic and validated on real data from the Republic of Tatarstan. Results: The optimized configuration (five sorting stations and two new recycling plants) increased the recycling rate from 29.8% to 69.1%, reduced waste sent to storage from 59.3% to 21.5%, and achieved a positive net present value. Transport costs became the dominant cost item (47% of total costs). Conclusions: The model provides a practical decision-support tool for transport planners and logisticians, enabling an assessment of infrastructure decisions on transport work, mileage, and emissions. Integrating real road networks and environmental risk coefficients significantly improves the accuracy of logistics optimization in waste management systems.
1. Introduction
Globally, estimates suggest that between 7 and 10 billion tonnes of solid waste are generated annually. This figure encompasses industrial, construction, commercial, and mining waste. Of this total, less than one third is reintroduced into the economic cycle through recycling, recovery, or safe treatment [1,2]. The majority is disposed of in landfills or temporary storage facilities, leading to environmental pollution and land alienation [3]. Transport and logistics costs in waste management systems can account for up to 60% of total expenditures [4], making logistics optimization a critical lever for improving both economic and environmental performance.
Despite its recognized importance, the optimization of transport and logistics systems for industrial waste management faces significant scientific and methodological challenges. Existing studies, as a rule, solve either strategic facility location problems or tactical routing problems, but they do not propose a mechanism for their integration [5]. Furthermore, many models rely on simplified distance metrics, such as Euclidean distances, which fail to capture real-world road network constraints. The heterogeneity of waste streams by hazard class and the associated environmental risks during transportation are also often overlooked.
To overcome these limitations, this paper proposes a simulation model for optimizing the transport and logistics system of industrial waste management. The key novelty of the proposed approach lies in three interconnected contributions: (1) the integration of real OpenStreetMap road networks for distance and travel time calculation, (2) the joint optimization of facility location and vehicle routing, and (3) the introduction of differentiated environmental risk coefficients based on waste hazard class. The model is implemented as an agent-based simulation in the AnyLogic environment and validated on real data from the Republic of Tatarstan.
It is important to clarify that the term “joint optimization” is used here to indicate that facility location and routing decisions are simultaneously considered and evaluated within a unified simulation–optimization framework. This contrasts with sequential approaches, where location decisions are made first and routing decisions are optimized subsequently. The Genetic Algorithm searches the configuration space, while the simulation model evaluates each configuration, capturing the interdependencies between facility placement and routing performance.
The remainder of this paper is organized as follows. Section 2 reviews the relevant literature on facility location, vehicle routing, and simulation approaches in waste logistics. Section 3 describes the mathematical formulation of the problem and the simulation model. Section 4 presents the results of simulation and optimization experiments and discusses the findings, their implications, and limitations. Section 5 concludes the paper and outlines directions for future research.
2. Literature Review
The efficiency of transport and logistics systems is determined by two groups of factors: (1) the rational placement of infrastructure facilities and (2) the optimal organization of transport processes (routing, selection of rolling stock, flow management, consideration of environmental risks, etc.). The irrational location of waste management facilities leads to increased mileage and higher tariff burdens [6]. The non-optimal organization of transport processes results in a reduced efficiency of vehicles used for waste transportation, decreased transport safety, increased accident risk, and higher costs [7].
The problem of determining the optimal location of infrastructure facilities is one of the fundamental problems in logistics and operations research. In its most general form, it is formulated as the “Facility Location Problem” (FLP) [8]. In the context of waste management systems, FLP allows determining where sorting stations, recycling plants, or landfills should be built to minimize the sum of transport and infrastructure costs.
The Vehicle Routing Problem (VRP) involves constructing optimal routes for delivering goods from sources to infrastructure facilities. In waste management systems, location and routing problems are interconnected: the location of facilities determines the structure of transport flows, while optimal routes determine the final costs [9].
Issues related to optimizing the location of waste management facilities have been addressed in the work of many scholars. Typically, classical facility location models (p-median and p-center, covering problems, center of gravity method, etc.) were adapted for different types of waste and territorial scales [10,11]. Furthermore, multi-criteria approaches have been developed that consider environmental and social factors alongside economic ones [12,13].
However, existing studies, as a rule, are either limited to a static formulation or use simplified distance metrics. Insufficient attention has been paid to the real road network. In addition, the issue of joint optimization of the number, capacity, and location of sorting stations and recycling plants remains open. Several studies have considered the optimal location of waste management facilities as a means of minimizing transport distances and costs. In the study [14], a model was proposed to determine optimal locations for sorting and recycling enterprises based on waste generation volumes, vehicle capacity, and transport distances, using a transport-logistics function to minimize total transportation costs. Similarly, the role of centralized logistics hubs in reducing carbon dioxide emissions and improving the efficiency of waste collection networks was emphasized [15].
A recent study by Noreña-Zapata et al. (2024) addresses the Periodic Location-Routing Problem (PLRP) for urban waste collection with a focus on selective recycling. Their approach introduces a classification of 25 customer types based on heterogeneous waste demands and visit frequencies, and they propose a three-level Variable Neighborhood Search (VNS) metaheuristic. The algorithm integrates decisions on route sequencing, visit scheduling, and depot opening, demonstrating the effectiveness of VNS for integrated location-routing challenges [16]. While their work focuses on municipal solid waste, it provides a valuable methodological parallel to our industrial waste logistics problem, particularly in demonstrating the effectiveness of VNS for integrated location-routing challenges.
A study [17] also addresses the integration of location, sizing, and routing decisions, focusing on a biomethane supply chain from the Organic Fraction of Municipal Solid Waste (OFMSW). Their two-stage iterative approach combines strategic plant location and capacity selection with tactical vehicle routing. A key feature of their model is the classification of waste producers into small and large categories, enabling tailored strategies: waste pooling for small producers and optimized vehicle allocation for large ones. In a case study for the Lazio Region in Italy, their integrated approach achieved a 30% reduction in transportation costs and a 30% reduction in daily kilometers compared to a model that only optimized location and sizing without routing considerations. Their work focuses on a single waste type (OFMSW) for a specific energy production purpose, and their approach does not explicitly incorporate real road network constraints.
The transition from linear to circular models faces numerous obstacles. In [18], the authors identified several barriers: insufficient management commitment, high implementation costs, limited policy effectiveness, inadequate software infrastructure, and uncertain consumer demand for recycled products. These findings underscore the need for practical, integrable decision support tools, especially in the context of changing regulatory environments.
In countries with insufficiently developed centralized waste management systems, decentralized waste processing technologies are actively being developed. In [19], the concept of a locally managed decentralized circular economy for plastic waste recycling in developing countries was proposed. The authors developed a metric to identify countries with the greatest potential for such an approach, using nine indicators covering economic, social, and environmental aspects.
An important direction in logistics optimization is the shift to alternative modes of transport. For example, from the perspective of environmental and economic efficiency, rail transport offers several advantages over road transport. For significant distances and cargo volumes, the efficiency ratio is approximately 3:1 or more in favor of railways. Moreover, with “clean” electricity generation, rail transport has a minimal carbon footprint [20]. In the EU, web-oriented logistics software packages for optimizing waste collection and transportation routes are also being developed, allowing transport costs to be reduced by more than 50% [21].
Cities implementing the “zero waste” concept demonstrate high performance in reducing the volume of landfilled waste. The Japanese city of Kamikatsu (Tokushima Prefecture) introduced a separate collection system with 45 waste categories, achieving a recycling rate of 80% by 2017 and completely eliminating waste incineration by 2020 [22]. The Italian city of Capannori (Tuscany) implemented a door-to-door waste collection system with Pay-As-You-Throw pricing, which, combined with an organic waste composting program and subsidies for reusable alternatives (e.g., cloth diapers), reduced waste by 40% and achieved a separate collection rate of about 90%. The annual volume of non-recyclable waste per capita here is only 59 kg—more than 60% below the Italian average [23]. The study [24] revealed that implementing the zero-waste concept brings substantial benefits: reducing waste generation volumes and their negative impact, extending landfill lifespan, increasing raw material use efficiency, reducing greenhouse gas emissions, lowering energy consumption, and creating new jobs.
In the field of mathematical modeling of waste management systems, Multi-Objective Evolutionary Algorithms (MOEAs) are the most common tool abroad. These methods allow for the simultaneous optimization of conflicting objective functions, such as minimizing transport costs, reducing greenhouse gas emissions, maximizing the recycling rate, and minimizing negative impacts on the population [25]. The study [26] also confirms that multi-criteria approaches integrating social, economic, and environmental criteria are the most popular for solving waste collection routing optimization problems with most studies using mixed-integer linear programming models. The review [27] emphasizes that MCDM multi-criteria approaches are the most popular for solving waste facility location selection problems; however, their effectiveness is limited under dynamically changing external factors.
In addition to technical and economic factors, governance structures also play an important role. In [28], the concept of polycentric collaborative governance was considered in the context of urban waste management systems, demonstrating how public value can be co-created through CSR–community partnerships (a concept whereby organizations consider societal interests, taking responsibility for the impact of their activities on firms and other stakeholders in the public sphere [29]). Although this paper focused on institutional mechanisms rather than transport logistics per se, its findings highlight the importance of aligning operational tools—such as the proposed decision support system—with the broader governance context.
The formation of the scientific foundations for developing a transport and logistics system for industrial waste management is impossible without understanding the fundamental shift in the paradigm of material flow management. Since the traditional linear model of “extract–produce–discard”, based on the unidirectional flow of resources from source to disposal site, has exhausted itself, generating environmental, economic, and social crises [30], concepts have been developed that radically redefine the status of “waste”, transforming it into a resource temporarily withdrawn from economic circulation. An analysis of three key complementary concepts—the Waste Hierarchy, Zero Waste, and Circular Economy—reveals a set of new, significantly more complex requirements for the organization of transport and logistics processes.
The synthesis of the influence of these concepts on the formation of requirements for transport and logistics systems manifests itself in several fundamental shifts that must be considered when developing the scientific and methodological apparatus for the design and optimization of such systems:
- From unidirectionality to multidirectionality and flow complexity. The transport and logistics system (TLS) must manage not one waste stream but multiple specialized streams of potential resources (secondary raw materials, organics, repairable items), each with its own destinations (processors, repair centers, manufacturers) and its own transportation requirements. This necessitates the use of multi-product optimization models [31].
- From removal efficiency to quality preservation efficiency. One of the key criteria becomes minimizing the loss of material quality along the chain (contamination, mixing). This requires investment in separate accumulation infrastructure, specialized transport, and tracking technologies [32].
- From an isolated system to an interactive system. An efficient TLS in a circular economy is impossible without deep coordination among all participants: the population (separate collection), businesses (product design, returns acceptance), processors, and regulators. Logistics becomes a tool for integration and creating transparent material and information flows between them [33].
- Tightening regulatory requirements. International agreements (Basel, Stockholm Conventions) and national legislations impose increasingly stringent requirements on transportation, especially of hazardous waste, and on documentation, increasing the role of administrative and technological support for logistics operations [34].
The conducted analysis of the theoretical foundations and existing approaches to modeling transport and logistics systems for waste management allows us to identify the following unresolved problems and gaps, which determine the direction of this research: existing works, as a rule, solve either strategic facility location problems or tactical routing problems, but they do not propose a mechanism for their integration. Furthermore, many models use simplified representations of waste flows, not accounting for their heterogeneity, hazard classes, and associated environmental risks during transportation.
The four fundamental shifts identified above—multidirectionality of flows, quality preservation, system integration, and regulatory compliance—directly inform the methodological choices for the proposed model. First, the shift from unidirectional to multidirectional material flows must be captured by a multi-product structure, requiring separate flow variables for different waste types and destinations, each with its own processing requirements and destinations. Second, the emphasis on preserving material quality must be reflected in the design of compatibility constraints to prevent the mixing of incompatible waste types and hazard classes as well as in the introduction of differentiated environmental risk coefficients to internalize the external costs of transporting hazardous materials. Third, the need for an integrated system approach requires the joint optimization of facility location and routing within a single simulation framework, linking strategic and tactical decisions. Fourth, regulatory requirements must be incorporated through hazard class restrictions, a penalty mechanism for exceeding landfill capacity, and the use of real road network data to ensure compliance with routing restrictions for hazardous waste. Thus, the conceptual framework directly shapes the formulation of the mathematical model and the simulation architecture, ensuring that the proposed approach aligns with the principles of the Waste Hierarchy, Zero Waste, and Circular Economy.
Thus, the aim of this paper is to develop a simulation model for optimizing the placement of facilities in the transport and logistics system of industrial waste management and the routes of specialized vehicles, which would improve the efficiency of the system’s functioning.
3. Materials and Methods
3.1. Statement of the Problem
A regional transport and logistics system for industrial waste management is considered. The central element of the system is road transport, which ensures the movement of waste between generation sources, sorting stations, recycling plants, and landfills. The system includes the following types of facilities:
- Waste generation sources (industrial enterprises) with known coordinates, volumes, types, and hazard classes of waste;
- Existing sorting stations and stations that can be built (their number, coordinates, and capacity are subject to optimization);
- Existing waste recycling plants and plants that can be built (their number, coordinates, and capacity are subject to optimization);
- Existing landfills for industrial waste disposal with known residual capacity and coordinates.
Waste is transported between system elements by road along the existing road network. The cost of transportation depends on the distance, shipment volume, and hazard class of the waste.
It is required to determine the optimal system configuration (the number and parameters of sorting stations and waste recycling plants as well as the optimal routes for transporting waste along roads) that minimizes the total cost (transport, infrastructure, storage and disposal costs) considering revenue from the sale of secondary raw materials.
3.2. Mathematical Model
In this section, we present a mathematical formulation of the optimization problem underlying the transport and logistics system for industrial waste management. The model is defined over a finite planning horizon and aims to determine the optimal configuration of facilities and allocation of waste flows.
The problem involves finding optimal values for the following variables:
- For each sorting station and processing plant , the values of binary variables are found:
- Continuous variables:—coordinates of station j;—capacity of station j, t/year;—coordinates of processing plant k;—capacity of plant k, t/year.
- Flow variables:—volume of waste from source i to station j, t/year;—volume of secondary raw materials from station j to processing plant k, originating from source i, t/year;—volume of residues from station j to landfill l, originating from source i, t/year;—volume of waste directly from source i to plant k, t/year;—volume of waste directly from source i to landfill l, t/year;All flow variables are non-negative: , , , , .
- Accumulation variable:—average annual stock of waste remaining in storage at source i, t.
The objective function represents the revenue from the sale of secondary raw materials minus all reduced costs:
The key parameters used in the objective function are defined as follows. The parameter (USD/(t·km)) is the unit cost of transporting one tonne of waste over one kilometer, which includes fuel, maintenance, driver wages, and overhead costs. The parameter (dimensionless, ) is the sorting efficiency at transfer stations, representing the fraction of incoming waste that is recovered as secondary raw materials. The coefficient (dimensionless) is the environmental risk multiplier associated with hazard class c with values increasing for higher hazard classes to account for additional safety and regulatory requirements during transportation.
The variable (t/year) denotes the total annual volume of waste generated at source i. The variable (t/year) represents the average annual stock of waste that remains in temporary storage at source i rather than being transported for treatment or disposal. These variables are used consistently throughout the model formulation and results sections.
The model uses the following constraints:
- Waste balance at sources: for each source ,
- Capacity constraints for temporary waste storage sites: for each source ,
- Capacity constraints for sorting stations: for each station ,
- Sorting balance at stations: for each station , the flow of secondary raw materials is represented by the following:The flow of residues to landfills is represented by the following:
- Capacity constraints for processing plants: for each plant , the flow of secondary raw materials is represented by the following:
- The compatibility constraints for types and classes of waste is represented by the following:
- Capacity constraints for existing landfills: the total volume of waste sent to the landfill must not exceed its residual capacity:
If the residual capacity is exceeded, a penalty for the impossibility of disposal is introduced, stimulating the minimization of landfilling:
where is the specific penalty for waste disposal above the limit, USD/t.
The penalty term P is included in the objective function F (Equation (3)) as the final cost component. This ensures that the mathematical model fully accounts for the economic consequences of exceeding landfill capacity. In the simulation model, the same penalty is applied dynamically whenever the landfill capacity is exceeded during the simulation run. Thus, the penalty term is consistently applied in both the analytical formulation and the simulation framework.
To determine waste flows, a heuristic rule based on the nearest available facility principle is used. This rule is not a strict mathematical constraint but represents an algorithmic simplification that significantly reduces the computational complexity of the problem while maintaining the adequacy of the results.
For each source at each discrete time moment (day), the following procedure is performed:
- The set of available sorting stations is determined, for which the conditions are met:
- The station is built ();
- The station has sufficient free capacity: , where is the volume of waste planned for removal;
- The station accepts this type of waste (compatibility condition).
- If the set is not empty, the nearest station is selected:Then, the entire volume of waste prepared for removal is sent to this station:
- If the set is empty (no suitable station), the waste is sent directly to plants or landfills according to the following priorities:
- First to plants compatible by type and hazard class and having free capacity;
- In the absence of suitable plants—to landfills.
The heuristic calculates the distance between two points using the Euclidean distance formula with a correction factor for the map projection:
where and are the differences in latitude and longitude between points p and q, 111.0 km is the length of one degree of latitude, and 78.5 km is the length of one degree of longitude at the average latitude of the study region (55° N).
The heuristic is applied within the simulation model to identify the nearest available facility (sorting station, plant, or landfill) for each waste source at each time step. The procedural logic is summarized in Algorithm 1.
| Algorithm 1 Nearest-available-facility routing heuristic |
|
Rationale for using heuristics:
- The heuristic is essential for maintaining computational feasibility. To quantify its impact, consider the following calculation. The simulation model performs routing decisions for each of the 17 waste sources at each of the 365 days, resulting in 6205 routing decisions per simulation run. A single GIS-based route calculation using the OpenStreetMap road network takes an average of 1.0 s in AnyLogic 8.9.8. Thus, evaluating one configuration using GIS-based routing would require approximately 6205 s (about 1.7 h). For an optimization experiment with 1000 configurations, this would amount to approximately 6.2 million seconds (about 72 days)—clearly impractical. In contrast, the Euclidean approximation is computed in microseconds—more than 10,000 times faster than a GIS query. A single Euclidean distance calculation takes approximately 0.0001 s, reducing the time for one configuration to about 0.62 s. For 1000 configurations, the total time would be approximately 620 s (about 10 min). This represents a speed-up of approximately 10,000 times per configuration and makes the optimization experiment feasible within a practical timeframe. Thus, the heuristic provides a near-optimal approximation with complexity, where is the number of sources and is the number of facilities, ensuring the model’s practical applicability while enabling the rapid evaluation of candidate configurations. The final optimized configuration is then validated using GIS-based routing in a separate simulation run to ensure accuracy.
- The heuristic is consistent with real-world dispatching practice in industrial waste management, where routing decisions are typically made based on proximity and available capacity rather than by solving complex optimization models in real time. Studies have shown that the nearest neighbor approach is widely used in waste collection routing and provides good initial solutions with minimal computational effort [35].
- The model operates at a strategic planning level, where the primary goal is to optimize the configuration of the infrastructure network (facility location and capacity) rather than to find the exact optimal routes for individual vehicles. At this level, the heuristic provides sufficient accuracy for evaluating alternative configurations, while detailed routing optimization is addressed in the micro-model (Section 4) [36].
To benchmark the heuristic, we compared its performance with a Genetic Algorithm (GA) for a subset of test instances. The results show that the heuristic achieves approximately 92–95% of the GA’s performance in terms of total routing cost while being several orders of magnitude faster (milliseconds vs. minutes per instance). Given that the heuristic is applied hundreds of times during the optimization experiment, this speed advantage is critical [37].
The presented mathematical model forms the theoretical basis for the development of a simulation model that implements algorithms for the distribution of waste flows, cost calculation, and optimization of the system configuration.
3.3. Simulation Model
One of the optimal solutions for logistics and territorial facility location problems, in terms of both goal and costs, is the development of a decision support system in which the simulation model acts as an intelligent core [38]. Let us develop a simulation model that includes multi-variant calculations considering the real road network, allowing for simulation and optimization experiments. Such an implementation should provide the visualization of results, the ability to change parameters, and integration with optimization algorithms. The AnyLogic simulation environment (version 8.9.8) was chosen for the software implementation of the model. The model is implemented as an agent-based model, where each system element is represented by a separate agent type.
The following agent types are introduced into the model:
- WasteSource corresponds to waste generation sources—aggregations of industrial enterprises within a relatively small territory.
- TransferStation represents sorting stations.
- ProcessingPlant models waste recycling plants.
- Landfill corresponds to existing landfills for industrial waste disposal.
- WasteStreamAgent is an auxiliary agent type used to transfer data (waste transportation volumes) between model elements.
A GIS world map is loaded into the model. To calculate distances along the real road network, a road graph based on OpenStreetMap data in PBF (Protocolbuffer Binary Format) format is used. The use of the real road network, rather than Euclidean distances, is a key feature of the model, enabling more accurate estimates of mileage, travel time, and transport costs. This fundamentally distinguishes the proposed model from known static approaches in which distances are calculated as straight-line distances.
The road graph includes information on road types (highways, regional roads, city streets), permitted travel directions, and the presence of bridges and overpasses. This allows modeling routes considering real-world constraints, which is critical for an adequate assessment of transport work.
For each waste movement from a source to a treatment or disposal facility, the model uses vehicles whose characteristics match those of the specialized fleet used in the waste management sector.
Transport costs are calculated as a linear function of the volume of transported waste and the transport distance, which corresponds to classical approaches in transport logistics [39].
Transport costs are adjusted using environmental risk coefficients , which are implemented in the model as the riskFactor array. For hazard class c, the coefficient value is retrieved as riskFactor[c-1] (zero-based indexing). Thus, the cost of transporting 1 ton of waste of class c over a distance d km is USD, where is the environmental risk coefficient for hazard class; and is the cost of transporting 1 ton of waste for 1 km, USD/(t·km).
The environmental risk coefficients are established in accordance with the applicable regulatory documents of the Russian Federation [40].
The simulation model operates in a discrete mode with a daily step day. At each step, the following actions are performed: initialization and step-by-step simulation.
Initialization. Based on the values of the optimized parameters (number, coordinates, and capacity of sorting stations J; number, coordinates, capacity, and specialization of plants K), the corresponding agents are created. Cost and revenue counters are reset as well as accumulation variables: initial waste stocks at sources , current load of stations and plants , and the initial filling of landfills .
Time loop (step-by-step simulation). For each day (), the following sub-steps are performed:
- Calculation of waste generation. For each source i, the generation rate is determined. The volume generated during the day is added to the current stock .
- Decision-making on removal. For each source i, the following apply:
- The set of available sorting stations (built and having free capacity) is determined.
- If such stations exist, the nearest station (with the minimum ) is selected.
- If no station is found, the waste is distributed directly to plants or landfills according to type and hazard class compatibility.
- Modeling the operation of sorting stations. For each station j, the following apply:
- Received waste increases the stock .
- Waste treatment occurs at the rate , where is the treatment time. Sorted secondary raw materials ( of the volume) are sent to plants, while residues () are sent to landfills.
- Modeling the operation of plants. For each plant k, the following apply:
- Received waste (both directly from sources and from stations) increases the stock in processing .
- Processing is completed at the rate with the resulting secondary raw materials generating revenue .
- Modeling the operation of landfills. For each landfill l, the following apply:
- Received residues increase the filling .
- If , a penalty for excess disposal is applied.
- Calculation of costs and revenue includes the following:
- Transport costs: for all movements.
- Storage costs: .
- Disposal costs: (volume of landfilled waste).
- Revenue from secondary raw materials: (volume of processed waste).
- Update of state variables. Stocks at sources , stations , plants , and landfills are recalculated.
- Calculation of the Net Present Value (NPV) over the planning horizon H years considering the discount rate r.
The obtained NPV value is returned to the optimizer as the value of the objective function F. It is important to clarify that the amortized capital costs added during the NPV calculation refer to the same annualized capital expenditures already represented in the objective function through the term. Specifically, the term in Equation (1) represents the annualized capital cost plus operating cost for each sorting station. The same annualized values are aggregated and included in the total annual costs used in the NPV computation. Thus, no double-counting occurs: the capital costs are annualized once and used consistently in both the optimization objective and the project evaluation.
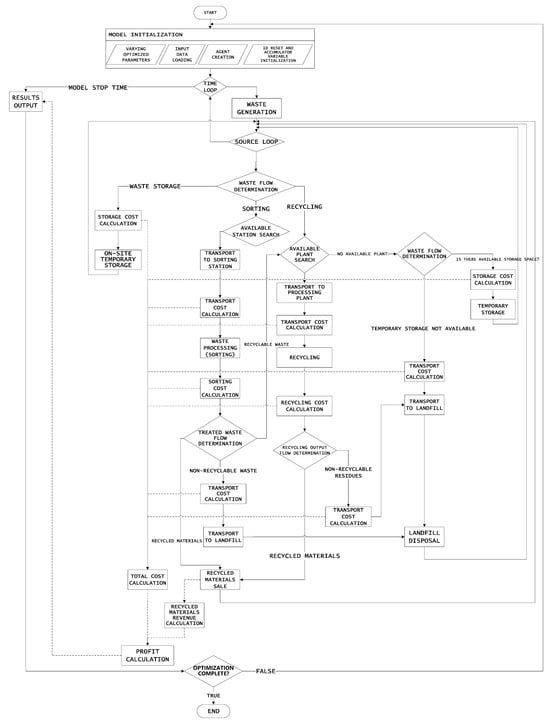
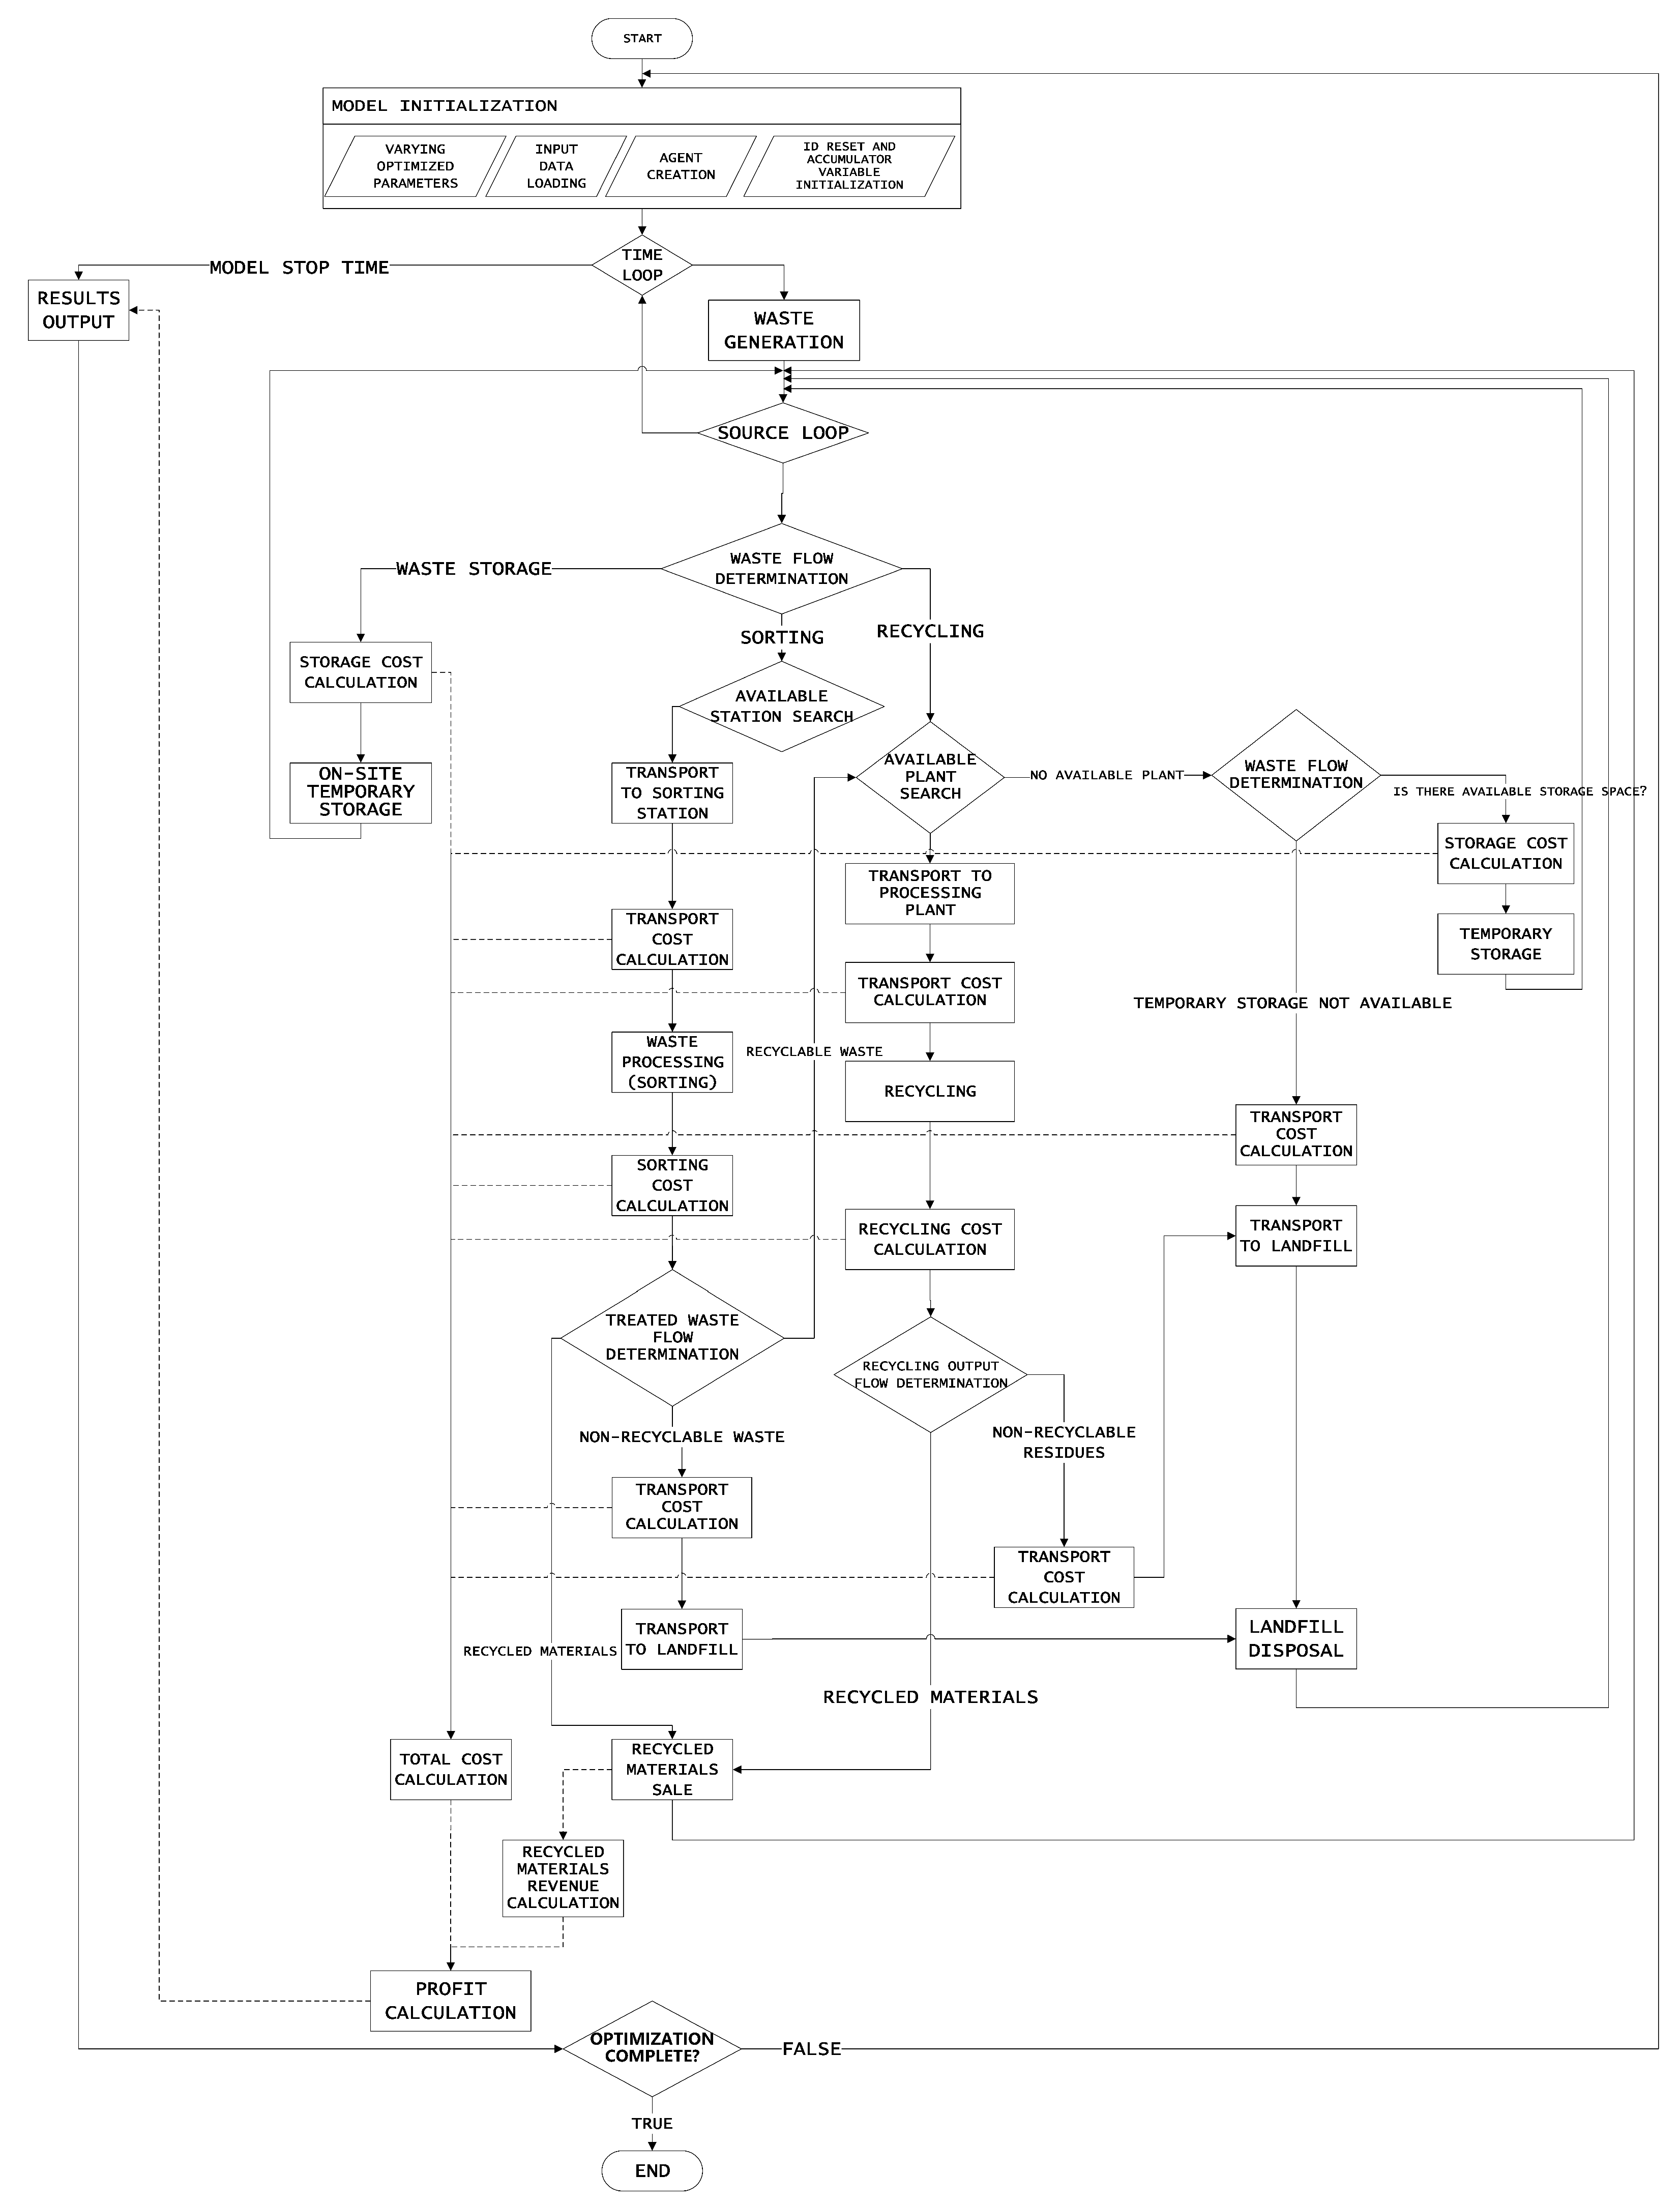
The flowchart of the simulation model’s operation algorithm is shown in Figure 1.
Figure 1.
Algorithm of the simulation model’s operation.
To assess the adequacy of the developed simulation model of the industrial waste management system, verification and validation procedures were performed. Verification of the model was aimed at checking the correctness of algorithm implementation in the software code and the absence of logical errors.
One of the criteria for the correctness of the model’s operation is the observance of mass balance: the total volume of waste generated must equal the sum of the volumes of recycled, landfilled, and stored waste. During the experiment on the model, the waste balance results were obtained, which are presented in Table 1.
Table 1.
Waste balance.
The balance converges, which confirms the correctness of the implementation of the material flow distribution algorithms.
Additionally, the waste flow distribution algorithms were tested. For each waste source, a search for the nearest sorting stations was performed considering available capacity. For example, for the waste source wasteSourceA (Almetyevsk), the algorithm selected stations 4 and 5, which had the minimum distances (113.0 km and 111.3 km, respectively), and fully distributed the entire volume. A similar check was performed for all 17 waste sources—in all cases, the distribution was performed correctly.
During the simulation, 100% utilization of all five sorting stations was recorded, which indicates the correct operation of the available capacity accounting mechanism. The utilization of processing plants ranged from 38.3% to 86.2%, which also corresponds to the specified constraints.
Validation of the model consists of checking the correspondence of the simulation results to real data on the waste management system.
According to estimates and statistical data on waste distribution in the Russian Federation on average, the recycling, landfilling, and storage rates have the values presented in Table 2.
Table 2.
Data on recycling, landfilling, and temporary storage of waste.
The simulation results obtained (29.8% recycling, 10.9% landfilling, 59.3% storage) fall within the statistical ranges, which confirms the adequacy of the model to the real waste management system. A more granular validation using disaggregated facility-level data (e.g., actual throughput of individual sorting stations and recycling plants) was not feasible for this paper due to the commercial sensitivity of such data. This remains a direction for future work, which will aim to collect and incorporate such data to further strengthen the validation of the model.
Thus, the developed simulation model can be used for conducting experiments and developing recommendations for the development of the industrial waste management system.
3.4. Overall Solution Framework
To clarify the relationship between the mathematical model, the heuristic, the simulation model, and the optimization algorithm, this subsection describes the overall solution framework and how these components interact to solve the optimization problem.
The optimization problem is solved using a “simulation-based optimization” approach. The mathematical formulation provides the formal problem description—sets, parameters, decision variables, objective function (Equation (3)), and constraints (Equations (4)–(13)). However, due to the complexity of the problem—real road networks, dynamic waste generation, stochastic variability, and the combinatorial nature of facility location and routing decisions—an analytical solution is not feasible.
Instead, the mathematical formulation is implemented as an executable agent-based model in AnyLogic. The simulation model computes the objective function (NPV) through the calcTransportCost() function, which implements Equation (3) and enforces all constraints during the simulation run. To enable the fast evaluation of each candidate configuration, the nearest-available-facility heuristic is embedded within the simulation through the functions findNearestTransferStation(), findBestPlants(), and findNearestLandfill(). These functions assign waste flows to the nearest compatible facilities with available capacity at each time step, providing a fast approximation of routing decisions that is essential for evaluating configurations over a 365-day horizon.
The Genetic Algorithm (GA), implemented in the AnyLogic Optimization Engine, searches the solution space by generating candidate configurations—varying the number, location, and capacity of sorting stations and plants. Each candidate configuration is passed to the simulation model, which evaluates it by computing the resulting NPV and returns this value as the fitness to the GA. The GA then applies selection, crossover, and mutation to generate new configurations, iteratively improving the solution until the stopping criteria (maximum iterations or convergence) are met.
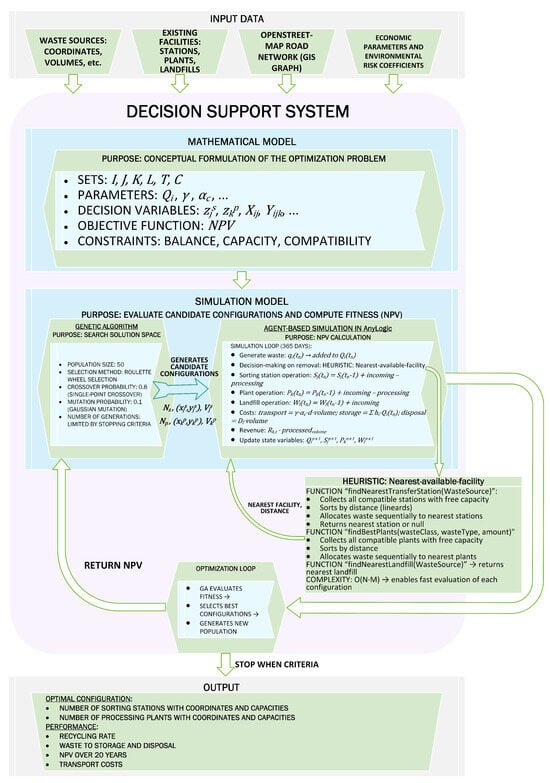
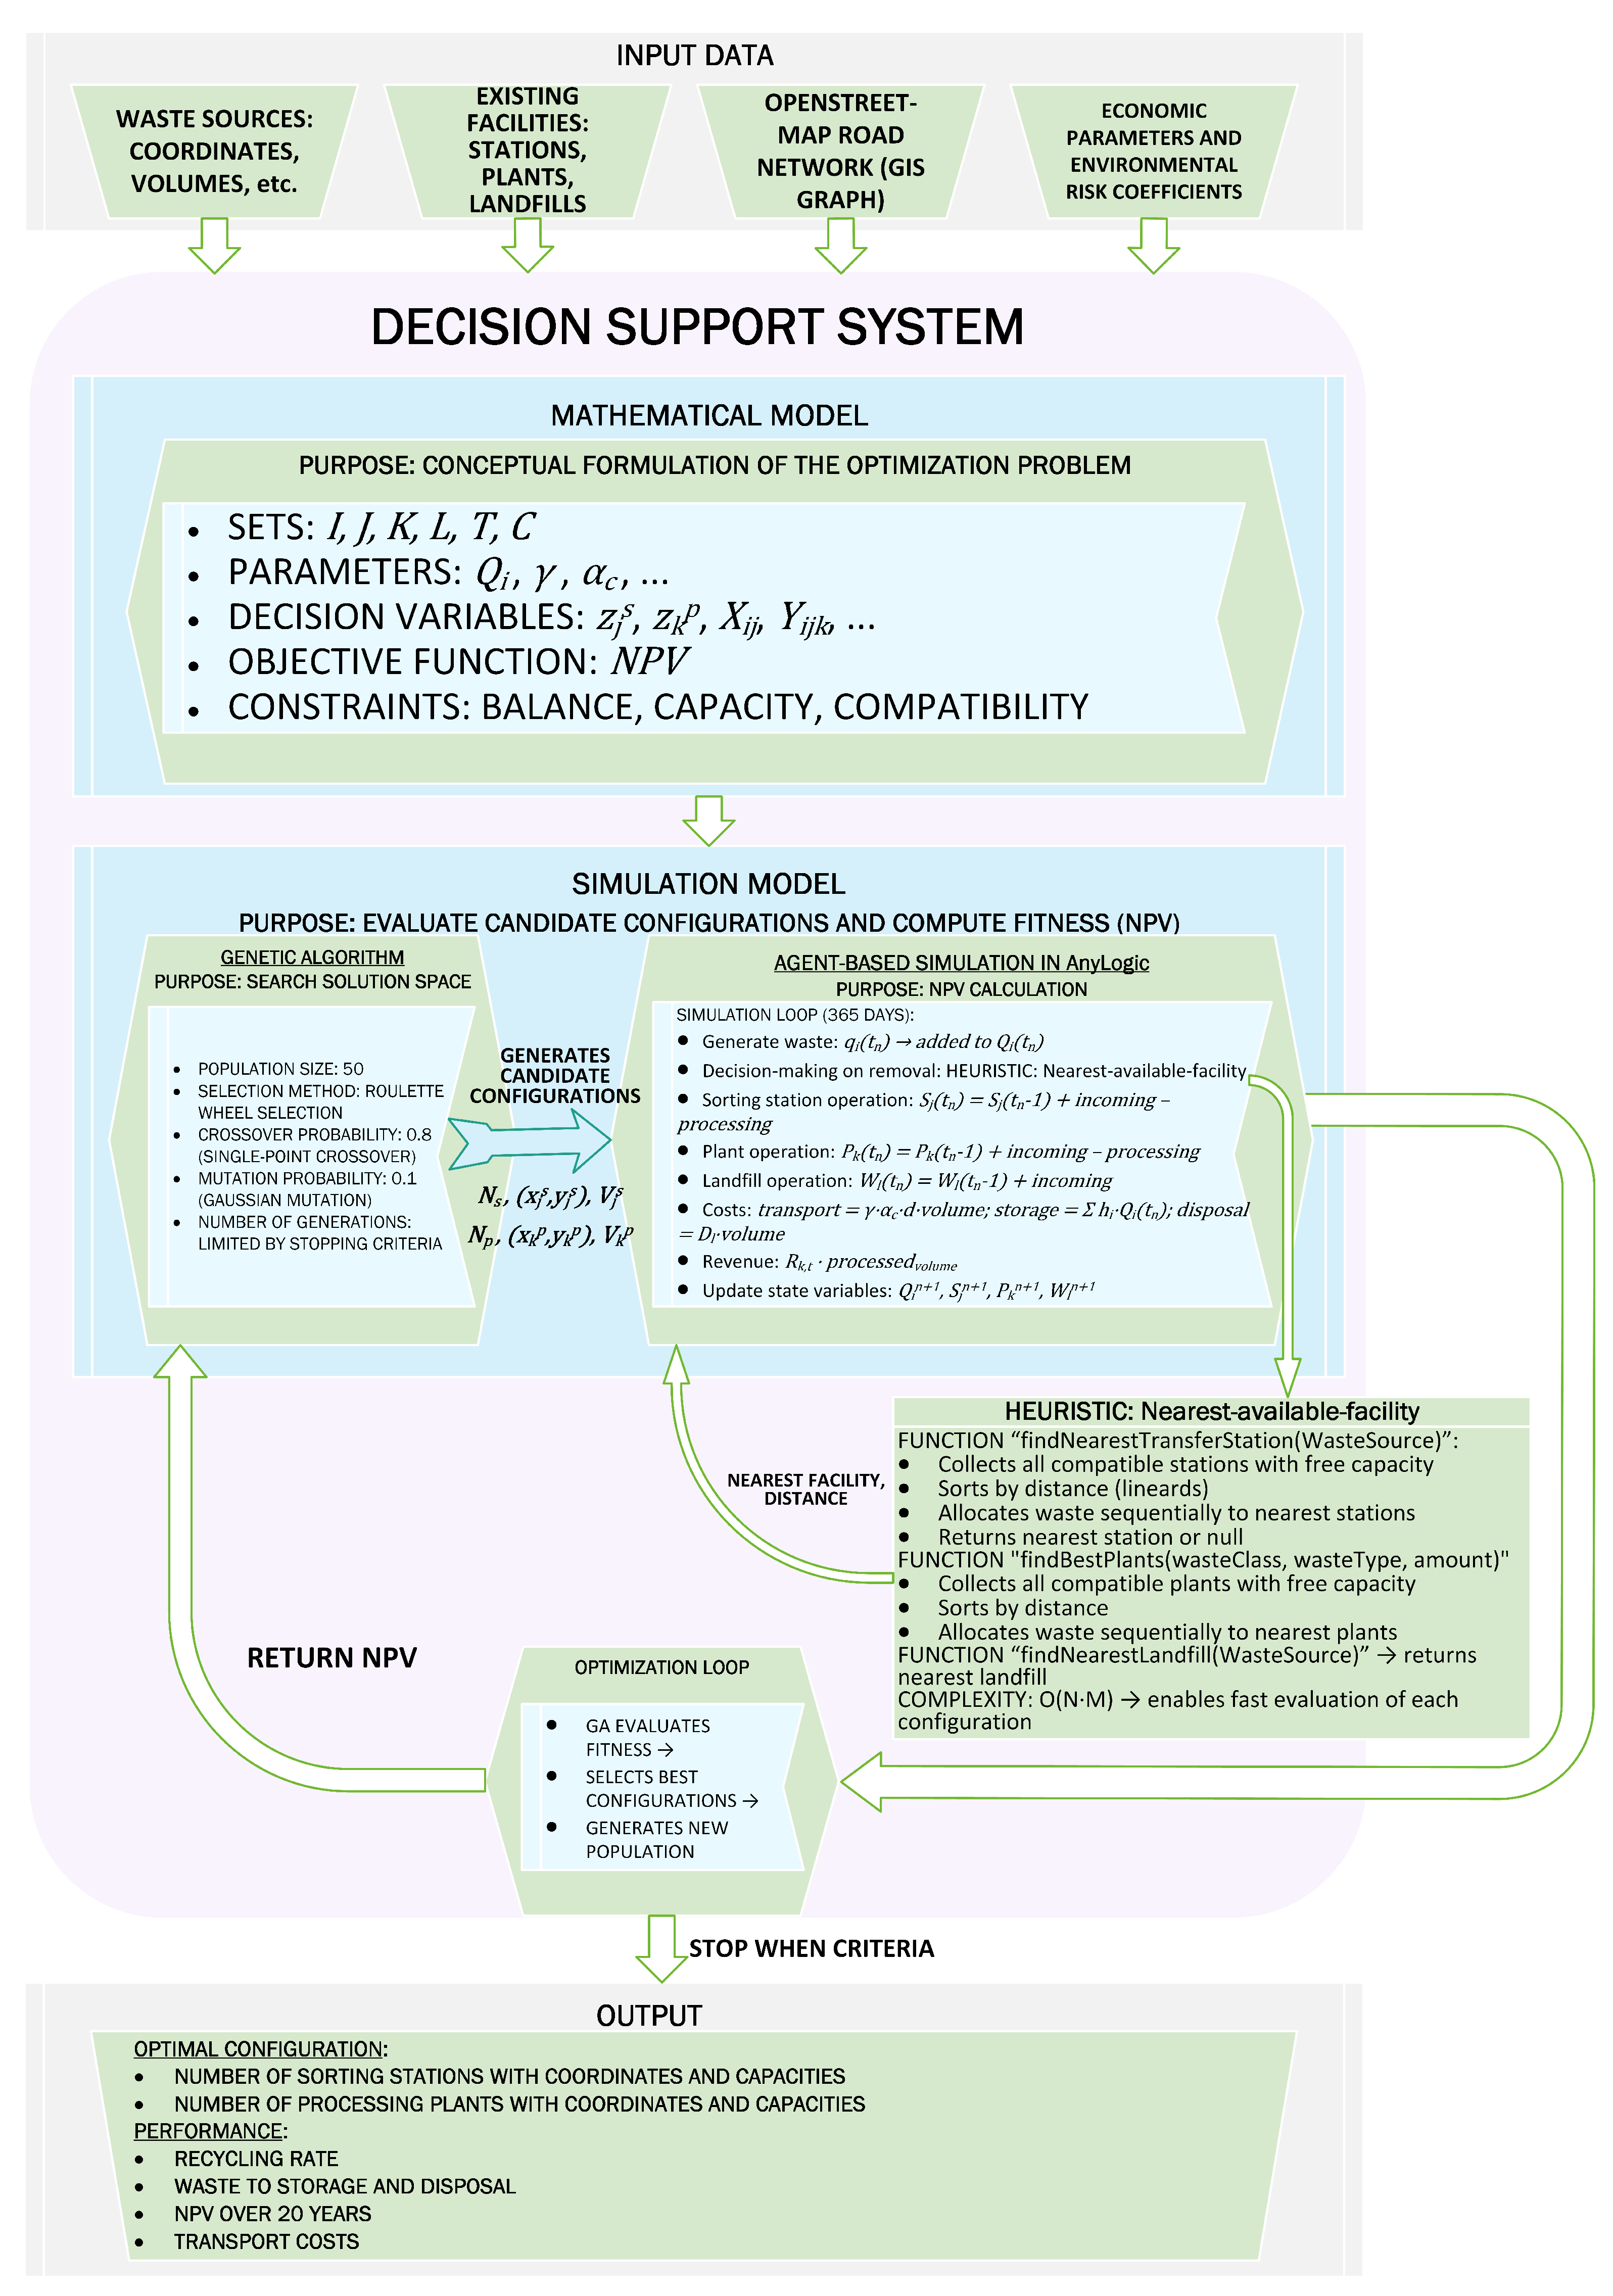
Thus, the mathematical model defines what is being optimized; the simulation model provides how each configuration is evaluated; the heuristic enables fast routing within the simulation; and the GA guides the search toward the optimal configuration. This framework allows the optimization algorithm to explore hundreds of configurations efficiently, while the simulation model ensures that each configuration is evaluated with sufficient accuracy to provide meaningful results. The interaction between these components is illustrated schematically in Figure 2.
Figure 2.
Interaction between the mathematical model, heuristic, simulation model, and optimization algorithm.
It is important to emphasize that the proposed framework does not claim to solve the mathematical formulation analytically. Rather, it uses the formulation as a formal description of the problem and implements it through simulation-based optimization. This is a well-established approach in operations research for complex, non-linear, and stochastic problems where exact solution methods are not feasible. The framework provides practical, near-optimal solutions that can be validated against real data and used for decision support.
4. Results and Discussion
4.1. Conducting a Simulation Experiment
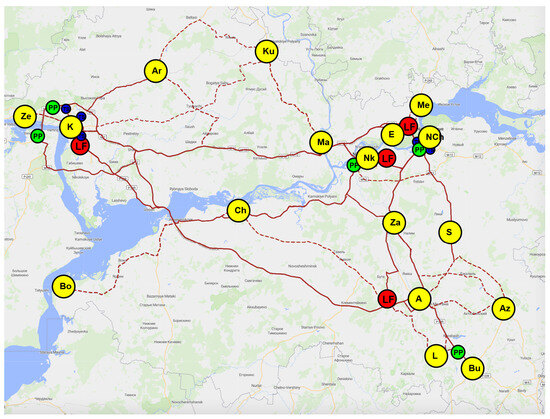
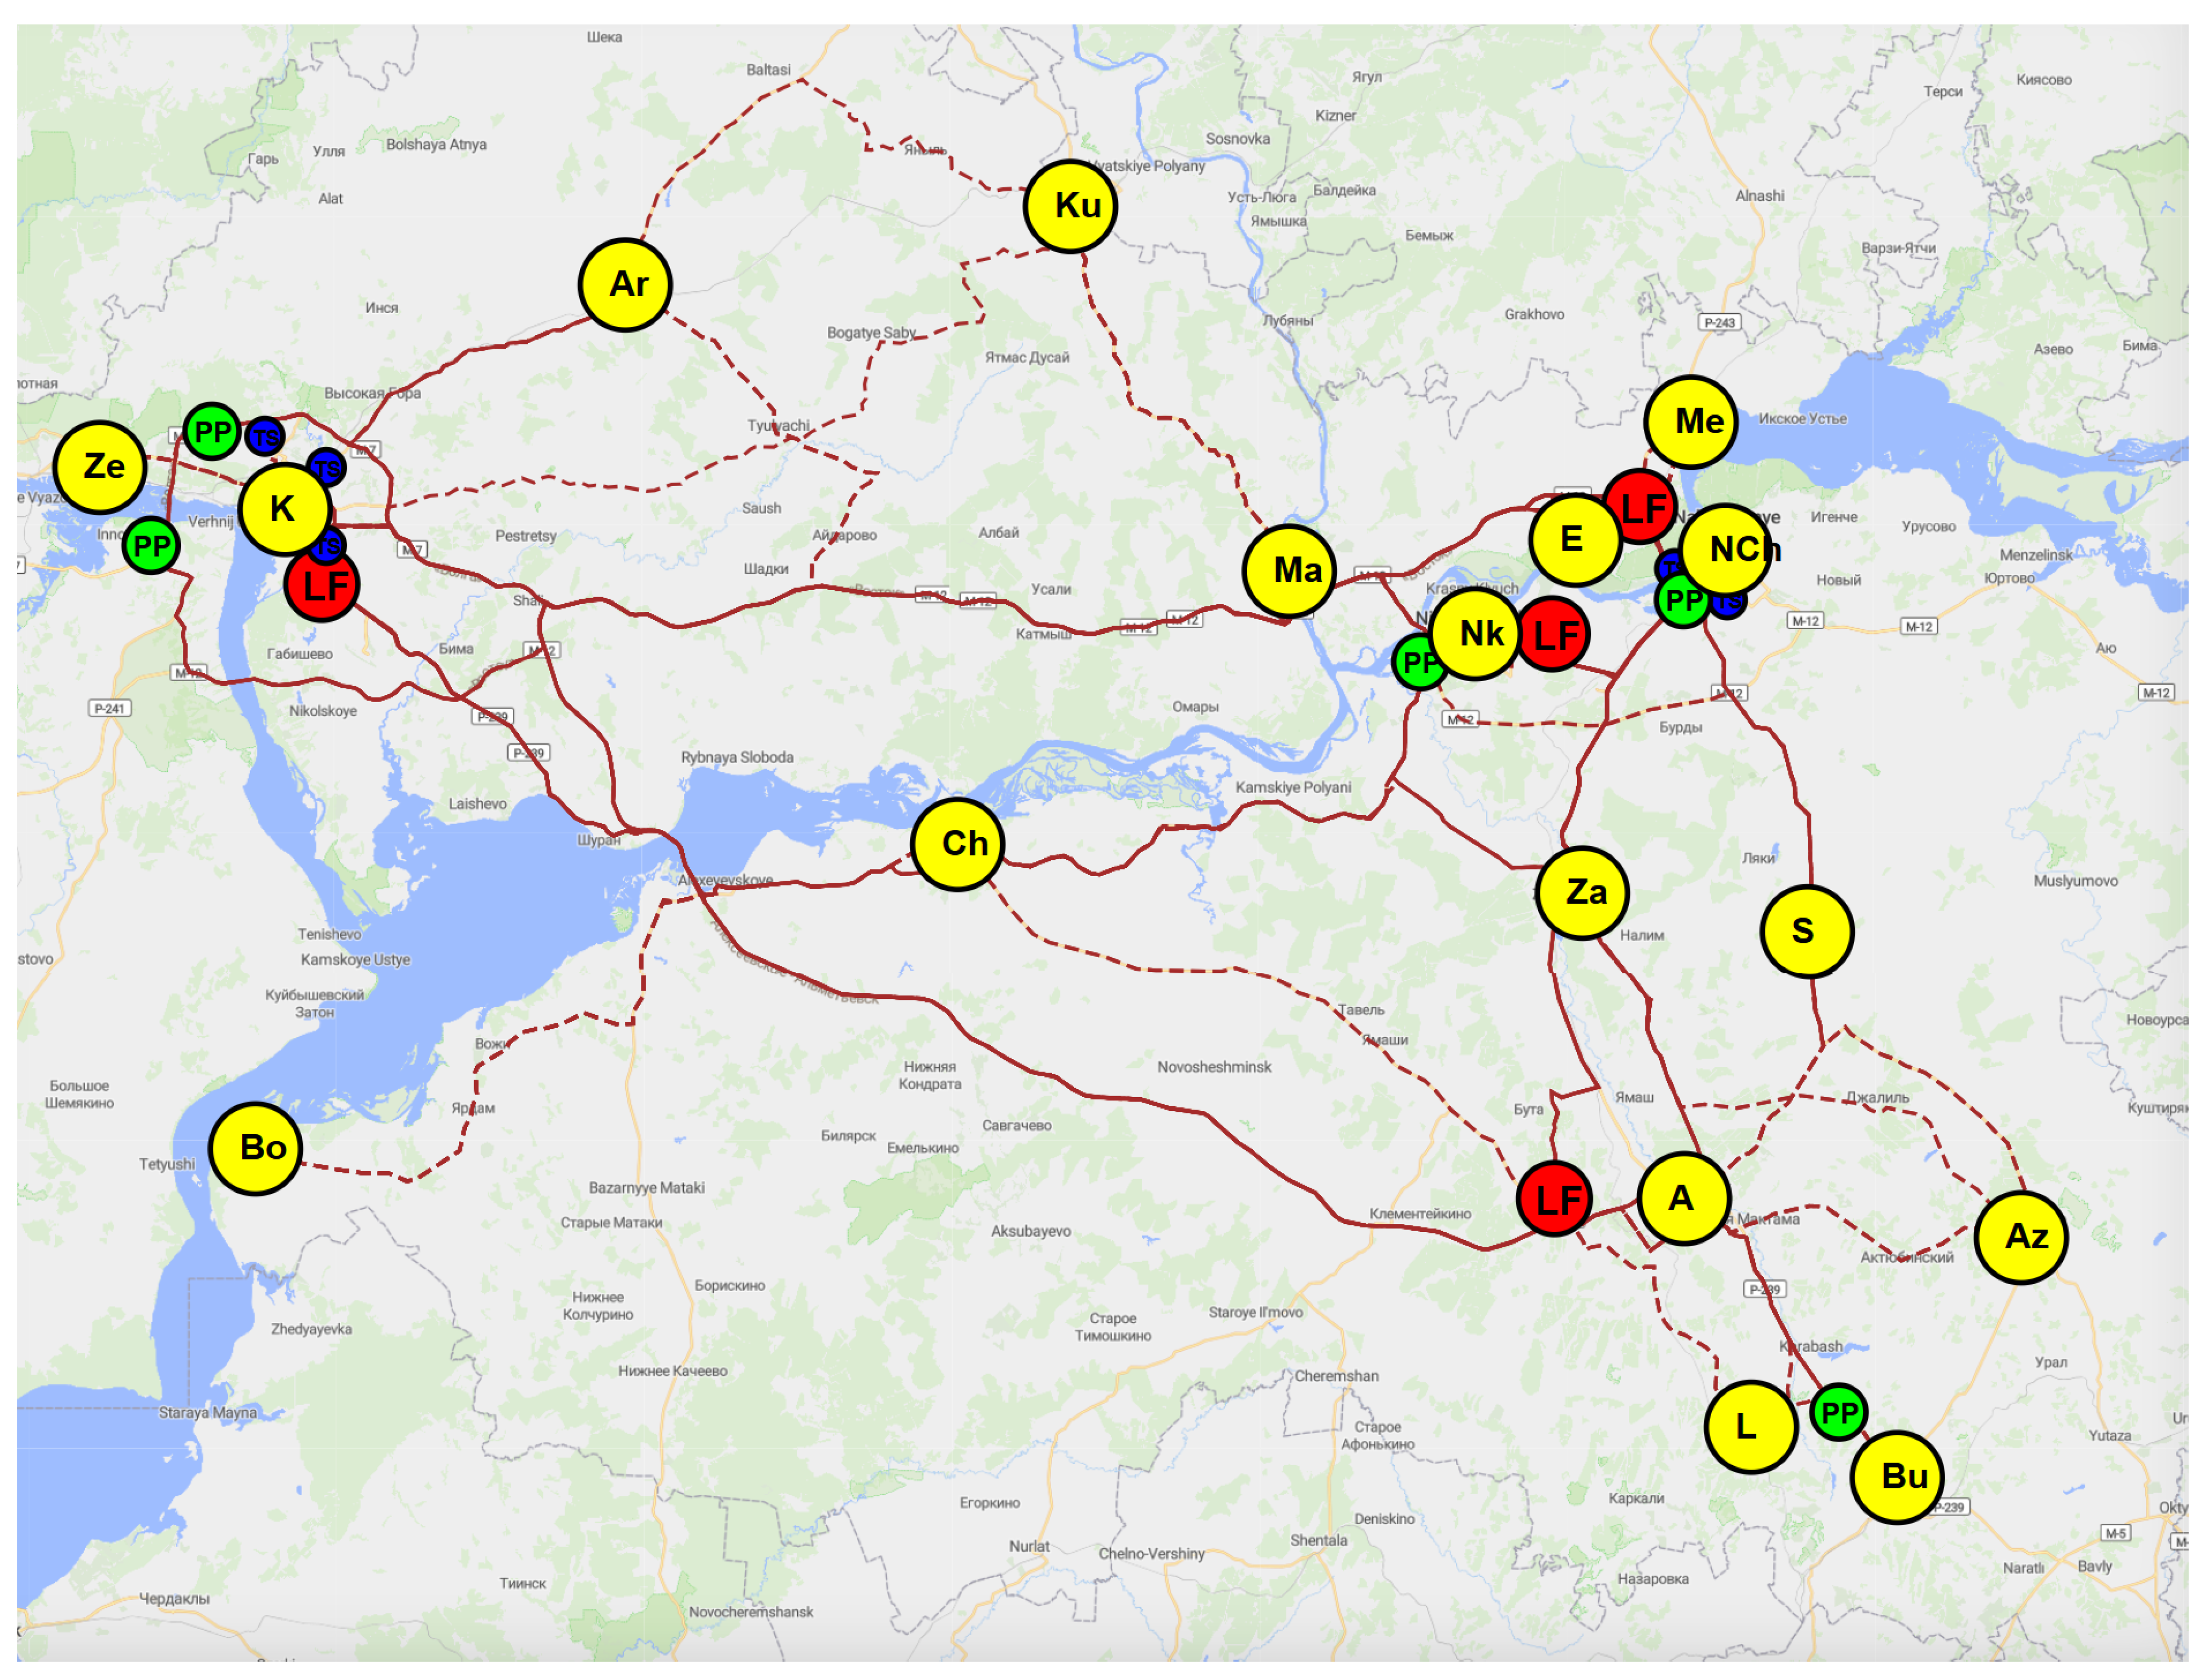
Let us conduct a simulation experiment on the model to assess the efficiency of the current transport and logistics system for industrial waste management in the Republic of Tatarstan and identify the system’s bottlenecks. The Republic of Tatarstan was selected as a test case for the developed model due to a combination of factors. As one of the most developed regions of the Russian Federation with a wide range of industrial sectors, it is representative for studying industrial waste management in a rapidly developing industrial center. Visualization of the simulation experiment is shown in Figure 3.
Figure 3.
Visualization of the simulation experiment. The map shows the following: •—sources of industrial waste generation; •—waste disposal landfills; •—sorting stations; •—waste recycling plants.
The model used data on the actually operating waste sorting stations of the Republic of Tatarstan, operating and under-construction waste recycling plants, landfills available for industrial waste disposal, as well as sources of industrial waste [41]. The simulation experiment yielded the economic indicators presented in Table 3.
Table 3.
Economic indicators of the current transport and logistics waste management system.
Based on the results of the simulation experiment, the critical limitations of the current system were identified (Table 4).
Table 4.
System constraints.
The simulation experiment showed that the current industrial waste management system of the Republic of Tatarstan is characterized by low efficiency. The key bottleneck of the system is the sorting stations, whose total capacity (951 thousand t/year) allows processing only 26.8% of the total waste volume (3.55 million t/year). The remaining waste is either sent directly to landfills, bypassing sorting, or accumulated, preventing the recovery of valuable fractions. The capacity of recycling plants is also insufficient. Thus, to improve the efficiency of the waste management system, a comprehensive reorganization of its infrastructure is required. In this regard, it is advisable to conduct an optimization experiment aimed at determining the following:
- The optimal number and location of sorting stations and processing plants;
- Rational capacities of sorting and processing facilities, considering forecasted waste generation volumes;
- Efficient vehicle routes that minimize logistics costs.
4.2. Conducting an Optimization Experiment
The annual costs and revenues used in the Net Present Value (NPV) calculation are obtained from the simulation model as follows. After completing the 365-day time loop, the total annual transport costs, storage costs, disposal costs, and operating costs for sorting stations and processing plants are summed. The annual revenue from the sale of secondary raw materials is also accumulated over the simulation period. Amortized capital costs for the construction of new facilities (stations and plants) are then added to the annual costs. The resulting annual cash flows are used to compute the NPV over the 20-year planning horizon, applying a discount rate. This NPV value serves as the fitness value for the optimization algorithm, which guides the search for the optimal system configuration:
where —annual revenue from the sale of secondary raw materials in year t, USD; —annual costs (transport, storage, disposal, depreciation and operation of facilities) in year t, USD; —discount rate.
The annual costs in the NPV calculation include the same annualized capital costs (station and plant construction costs divided by the annuity factor ) that appear in the objective function F (Equation (1)) together with the annual operating costs, transport costs, storage costs, and disposal costs. This ensures consistency between the optimization objective and the project evaluation criterion.
The optimization of the system configuration was performed using the Genetic Algorithm (GA) implemented in the AnyLogic Optimization Engine. GA was chosen due to its proven effectiveness for solving NP-hard facility location and routing problems involving mixed-integer decision variables.
The following variables were subject to optimization:
- Number of sorting stations: integer, ;
- Coordinates of each station: continuous, latitude within [54.0°, 56.0°], longitude within [48.0°, 54.0°];
- Capacity of each station: continuous, t/year;
- Number of new processing plants: integer, ;
- Coordinates of each new plant: continuous, latitude within [54.0°, 56.0°], longitude within [48.0°, 54.0°];
- Capacity of each new plant: continuous, t/year.
The following GA parameter settings were used in the optimization:
- Population size: 50 individuals;
- Selection method: roulette wheel selection;
- Crossover probability: 0.8 (single-point crossover);
- Mutation probability: 0.1 (Gaussian mutation);
- Number of generations: limited by stopping criteria.
The optimization was terminated when either of the following conditions was met:
- Maximum number of iterations: 100,000;
- Convergence criterion: no improvement in the best fitness value over 100 consecutive generations.
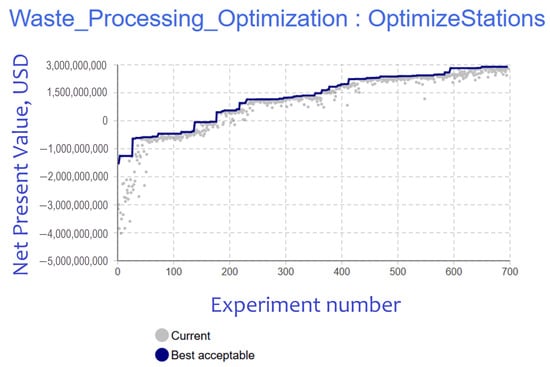
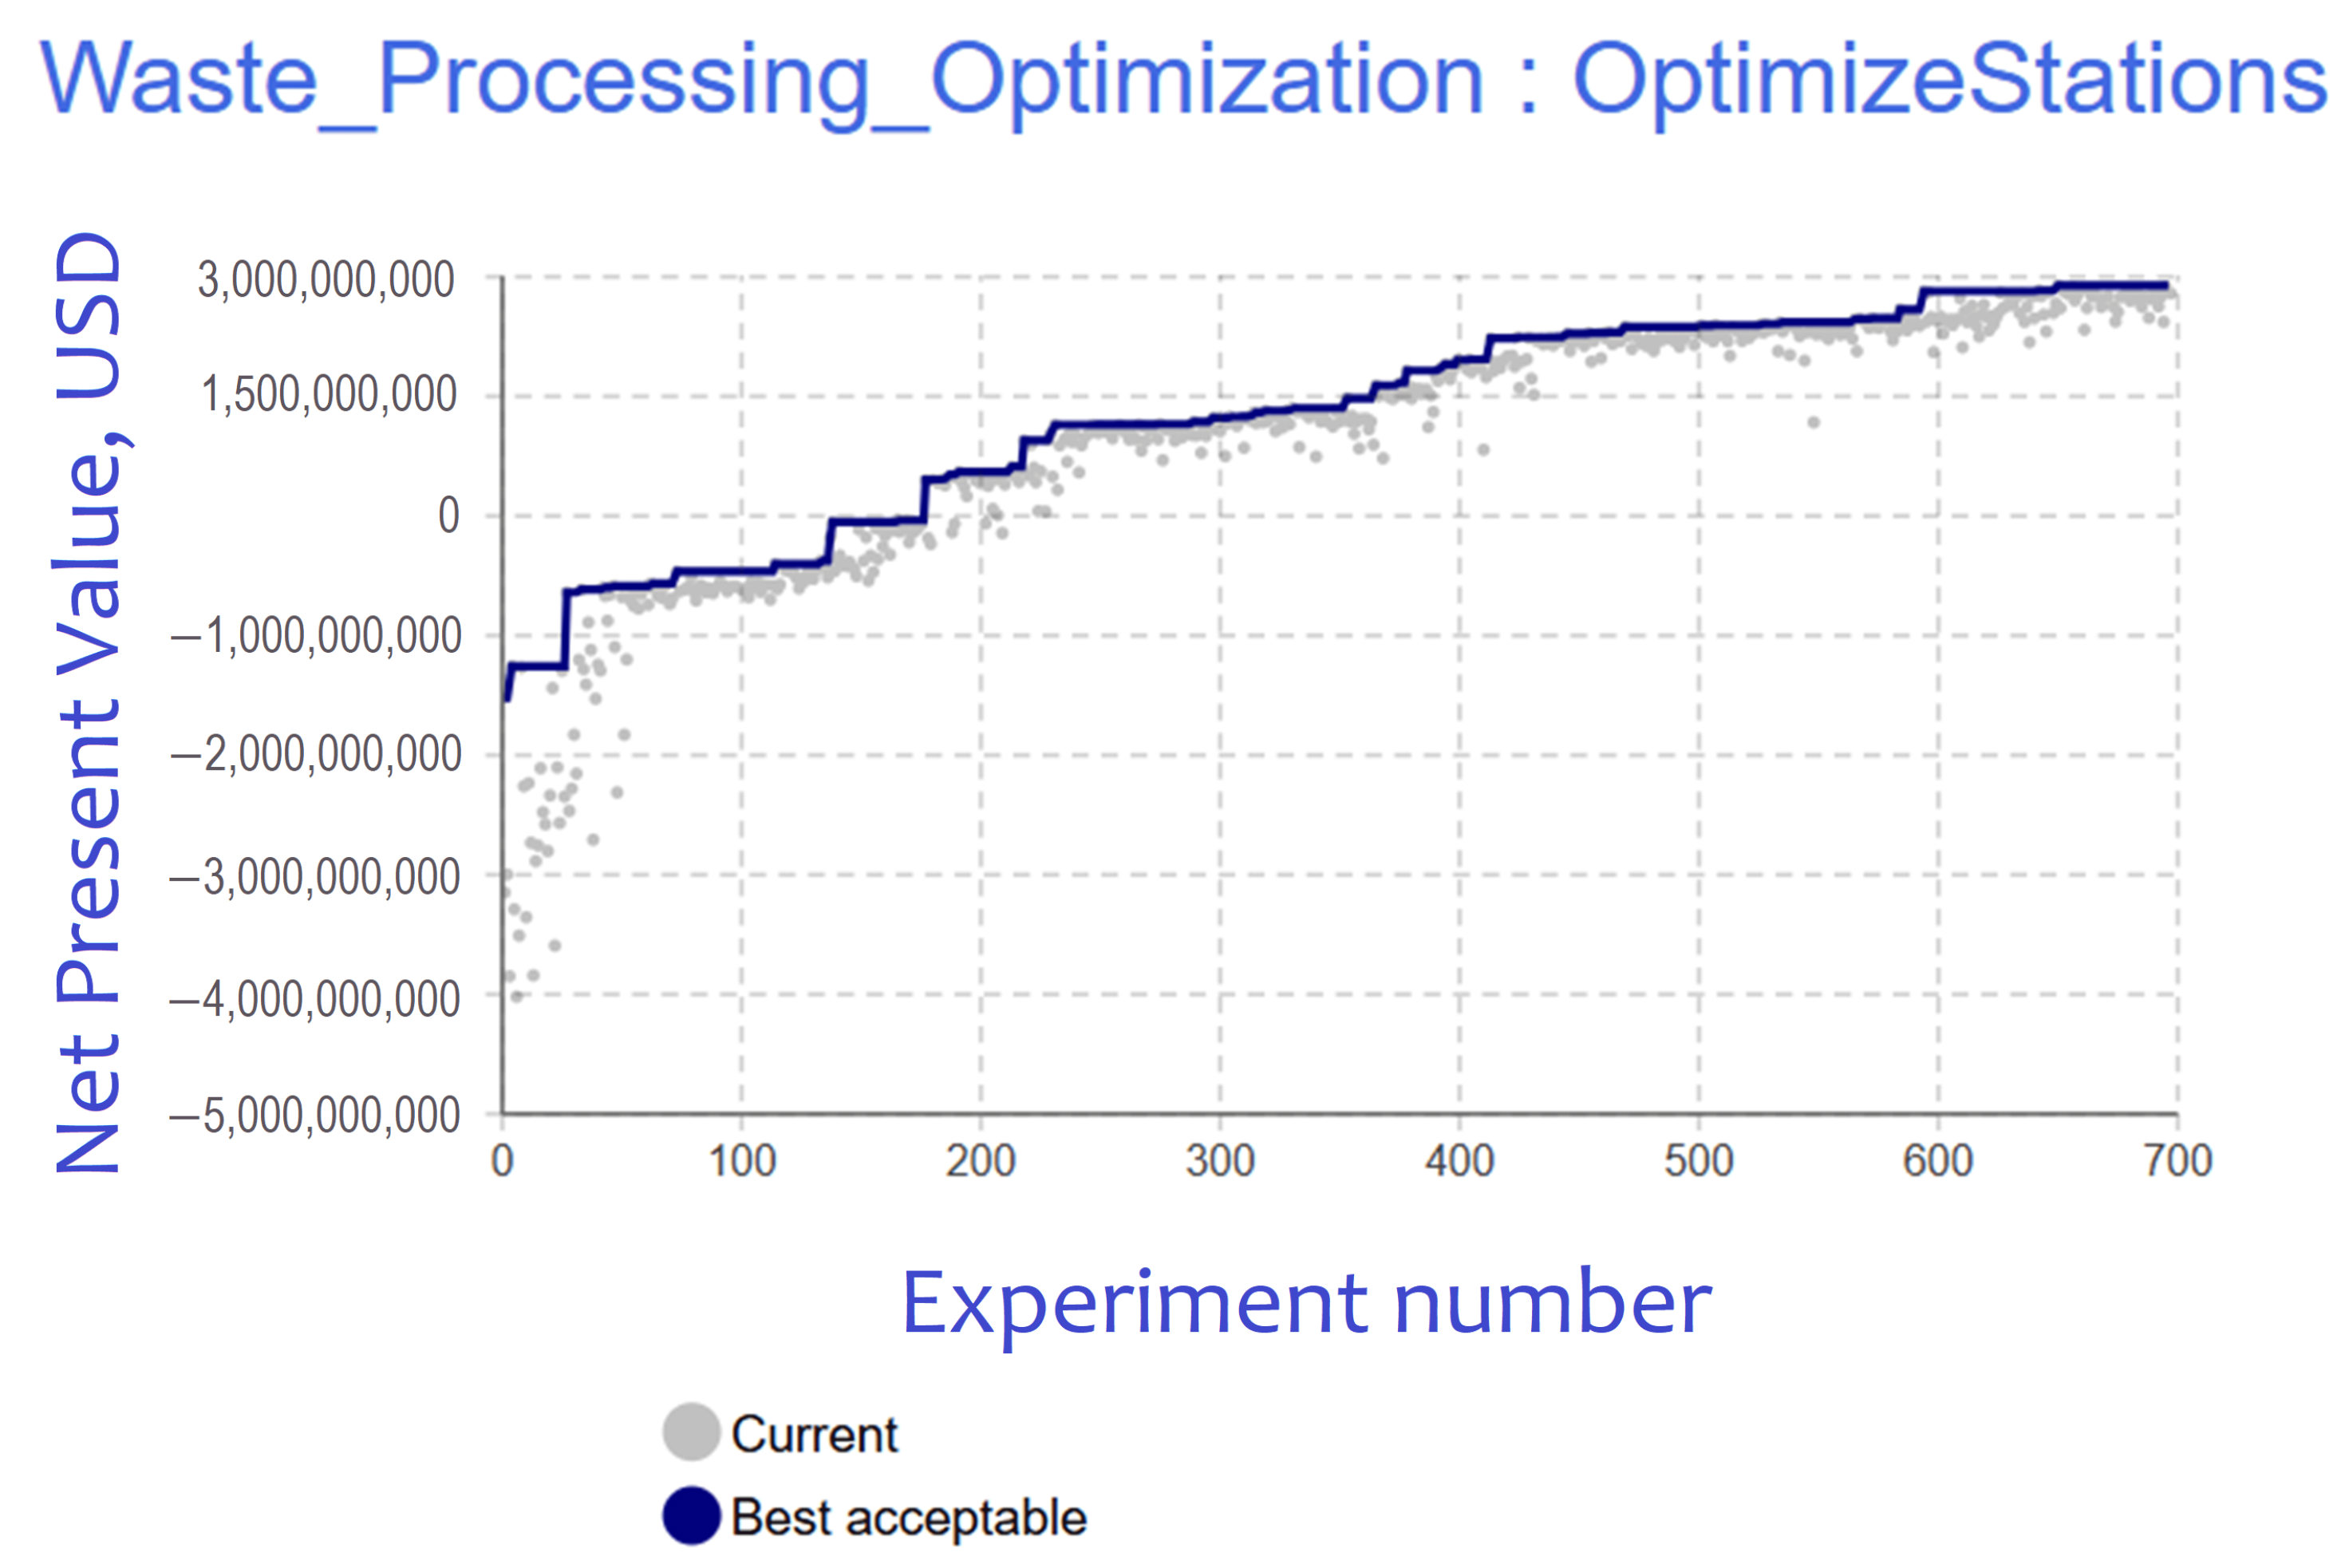
During the optimization experiment, 698 different system configurations were analyzed. The convergence of the optimization process is illustrated in Figure 4, showing the improvement of the best NPV value over the evaluated configurations.
Figure 4.
Result of the optimization experiment.
The best found solution (maximum NPV value) is characterized by the parameters specified in Table 5.
Table 5.
Optimal system configuration found as a result of the optimization experiment.
The optimal configuration involves the construction of five sorting stations with a total capacity of 3.6 million t/year and two new recycling plants with capacities of 400 thousand t/year and 200 thousand t/year. The coordinates of the stations are selected to cover the main industrial hubs of the region: central (stations 1 and 5), western (station 4), and eastern (stations 2 and 3). The optimal location for the new recycling plants is in the east, where the republic’s main production capacities are concentrated. The distribution of waste in the optimized configuration is presented in Table 6.
Table 6.
Waste balance in the optimized system.
The economic indicators of the optimal configuration are shown in Table 7.
Table 7.
Economic indicators of the optimal configuration.
4.3. Sensitivity Analysis of the Optimal Solution
To assess the robustness of the optimal solution to variations in transport costs, a sensitivity analysis was performed. The baseline transport cost coefficient USD/(t·km) was varied from to with a step of . For each value, the simulation model was executed with the optimized configuration, and the resulting NPV was calculated. The results are summarized in Table 8.
Table 8.
Sensitivity of NPV to changes in transport costs.
The analysis reveals several critical findings. First, the NPV is highly sensitive to transport cost variations: a 10% increase in transport costs reduces the NPV from 38.4 to million USD, turning the project from profitable to loss making. Second, the break-even point occurs at USD/(t·km), only 3% above the baseline value, indicating a very narrow margin of safety. Third, the elasticity of NPV with respect to transport costs is approximately , meaning that a 1% increase in transport costs leads to an 8.4% decrease in NPV.
The high elasticity is explained by the fact that transport costs constitute nearly half of the total operating expenses (48.1%), while the net annual profit is relatively modest (4.5 million USD/year). These results are particularly significant in light of the observed growth in road transport service costs in the Russian Federation, which is driven by rising fuel prices, customs duties, and the cost of imported vehicles and spare parts.
The low safety margin (only 3%) suggests that the system requires additional measures to mitigate transport cost risks, such as long-term contracts with carriers, fleet modernization, or the development of domestic truck manufacturing.
4.4. Discussion of the Optimized Configuration
The results of the optimization experiment demonstrate that the system can be transitioned from a loss-making to a profitable state (NPV > 0). However, the following limitation was identified: almost 100% utilization of all sorting capacities and recycling plants indicates that the system is operating at the limit of its throughput capacity and does not have a reserve for future growth in waste volumes. At the same time, increasing sorting and processing capacities will lead to a sharp increase in costs, which could return the system to a loss-making state.
From a transport perspective, the most significant result is the redistribution of waste flows: the share of waste directed to recycling increased from 29.8% to 69.1%. This means that the transport system began to service a larger volume of useful shipments (secondary raw materials) rather than “idle” shipments to landfills and storage sites. Accordingly, the share of waste going to storage decreased from 59.3% to 21.5%. It is important to note that the optimization of the location of sorting and recycling facilities led to a significant change in the transport characteristics of the system. Absolute transport costs increased. At the same time, the share of transport costs in the total system costs increased from 10.8% to 47.0%, confirming the hypothesis that in the optimized system, it is transport logistics that becomes the key factor of efficiency and requires further improvement.
The observed five-fold increase in absolute transport costs (from 18.9 to 95.6 million USD) is not a negative outcome but a logical consequence of the dramatic increase in the volume of waste being recycled. As the volume of useful cargo (secondary raw materials) increased by a factor of 2.3 (from 1.06 to 2.33 million tons), the transport system began serving productive logistics rather than merely moving waste to landfills. This shift from “idle” shipments to “value-creating” shipments is the primary driver of the positive net annual result.
The obtained results align with and extend recent findings in the field of waste logistics modeling. For instance, the use of OpenStreetMap road networks in this paper’s simulation model is consistent with the approach adopted in the study [42] in a techno-economic model of biowaste-to-energy systems. That study demonstrated that detailed transport costs, calculated using actual road networks, significantly affect the economic viability of waste treatment facilities and achieved a 42.8% improvement in the number of vehicles required for collection. Similarly, the agent-based modeling approach used here mirrors the methodology in the study [43], which explored the location of waste treatment centers. Their ABM framework allowed for a dynamic evaluation of how facility location impacts coverage rates and treatment efficiency, providing a richer understanding of system performance under realistic conditions.
The value of integrating simulation and optimization approaches in waste logistics is further validated by recent independent studies. In work [44], a simulation–optimization system for a recyclable express packaging network was developed, combining agent-based techniques with a hybrid heuristic algorithm. The study demonstrated that integrated optimization can reduce transportation costs by 30%, daily kilometers by 30%, and travel time by 26%. These findings confirm that the magnitude of logistics cost savings through integrated modeling is substantial and consistent across different waste streams and geographic contexts, supporting the practical relevance of the approach adopted in this paper.
The obtained results acquire particular significance in light of the observed growth in the cost of road transport services in the Russian Federation. There are five main factors driving this growth:
- Increase in the recycling fee for motor vehicles;
- Growth in customs duties on imported commercial vehicles;
- Rising fuel and spare parts costs;
- Increase in the cost of domestic vehicle production;
- Increase in maintenance and repair costs due to limited access to foreign spare parts and service systems.
The optimized routing strategy leads to a significant reduction in the volume of waste sent to landfills and long-term storage. In the baseline configuration, 70.2% of waste (10.9% landfilled + 59.3% stored) was removed from the economic cycle. In the optimized configuration, this share decreases to 30.9% (9.4% landfilled + 21.5% stored). Thus, the system prevents approximately 1.4 million tonnes of waste per year from being landfilled or stored, diverting it to recycling and recovery.
Using the IPCC default methodology for methane emissions from landfills (IPCC 2006 Guidelines, Volume 5, Chapter 3), an emission factor of 0.6 t CO2-eq per tonne of waste diverted from landfill was applied. The annual CO2-equivalent emission reduction is estimated as shown below:
This reduction corresponds to the prevention of methane emissions that would otherwise result from the decomposition of organic fractions in landfills. While transport-related emissions increase due to the additional logistics activity, the net environmental effect is strongly positive.
The practical value of the proposed model lies in its ability to provide quantitative estimates of the impact of infrastructure decisions on transport work, mileage, and emissions. This makes it a useful decision-support tool for transport planners and logisticians. However, the model currently assumes a linear relationship between transport costs and distance. While this simplification is common in strategic planning, future work could incorporate non-linear cost functions to account for economies of scale or congestion effects. Furthermore, the model focuses on a single region; its transferability to other regions would require a recalibration of input parameters, which is a straightforward process given the open-data approach used (OpenStreetMap).
A limitation of this paper is the absence of micro-level validation against observed operational data, such as actual routing decisions, transport distances, logistics costs, or facility utilization records. Such data were not accessible for this paper due to various circumstances. While the macro-level validation against statistical waste distribution data confirms that the model reproduces regional-scale material flows, future work should focus on collecting and incorporating disaggregated facility-level data to enable a more granular validation of routing and cost predictions.
5. Conclusions
This paper has developed a simulation model for optimizing the transport and logistics system of industrial waste management. The model integrates real OpenStreetMap road networks, differentiated environmental risk coefficients based on waste hazard classes, and the joint optimization of facility location and vehicle routing. The model was validated on real data from the Republic of Tatarstan, showing that the optimized configuration can increase the recycling rate from 29.8% to 69.1%, reduce the share of waste sent to storage from 59.3% to 21.5%, and achieve a positive net present value of USD 38.4 million over a 20-year horizon. Transport costs become the dominant cost item (47% of total costs), confirming the critical role of logistics in system efficiency. The model also demonstrates significant environmental benefits, preventing approximately 1.4 million tonnes of waste per year from being landfilled or stored, corresponding to an estimated reduction of 837,000 tonnes of CO2-equivalent emissions annually.
For logistics practitioners, the results highlight the importance of using real road network data rather than Euclidean approximations, which can underestimate transport costs by up to 13%. The two-stage optimization approach—Euclidean search followed by GIS verification—offers a practical and computationally efficient methodology for solving large-scale facility location and routing problems. The sensitivity analysis underscores the vulnerability of optimized systems to transport cost fluctuations, suggesting that long-term contracts with carriers and fleet modernization are essential risk mitigation measures.
For policy makers, the findings demonstrate that strategic investment in sorting and recycling infrastructure can transform a loss-making waste management system into a profitable one while delivering substantial environmental benefits. The optimized configuration supports the development of regional waste management strategies that prioritize recycling and recovery over disposal, which is in line with circular economy principles and national environmental objectives. Future research will focus on incorporating non-linear cost functions, multi-modal transport options, and dynamic routing based on real-time IoT data.
It should be acknowledged that the proposed framework relies on heuristic approximations (Euclidean distances) and does not solve the mathematical formulation exactly. However, this trade-off between accuracy and computational feasibility is justified by the complexity of the problem and the scale of the optimization experiment. The framework is designed to be adaptive and extensible, allowing for progressive calibration as more operational data become available.
Author Contributions
Conceptualization, I.M. and G.M.; methodology, I.M.; software, V.M.; validation, V.M.; formal analysis, G.M.; investigation, V.M.; resources, V.M.; data curation, V.M.; writing—original draft preparation, V.M.; visualization, V.M.; supervision, G.M.; project administration, I.M. All authors have read and agreed to the published version of the manuscript.
Funding
This research received no external funding.
Institutional Review Board Statement
Not applicable.
Informed Consent Statement
Not applicable.
Data Availability Statement
The original contributions presented in this paper are included in the article. Further inquiries can be directed to the corresponding author.
Conflicts of Interest
The authors declare no conflicts of interest.
References
- Kang, P.; Zhang, H.; Duan, H. Characterizing the implications of waste dumping surrounding the Yangtze River economic belt in China. J. Hazard. Mater. 2020, 383, 121207. [Google Scholar] [CrossRef] [Scilit] [PubMed]
- Srivastava, R.R.; Rajak, D.K.; Ilyas, S.; Kim, H.; Pathak, P. Challenges, Regulations, and Case Studies on Sustainable Management of Industrial Waste. Minerals 2023, 13, 51. [Google Scholar] [CrossRef] [Scilit]
- Mesjasz-Lech, A. Trends of Industrial Waste Generation in Manufacturing Enterprises in the Context of Waste Prevention—Shift-Share Analysis for European Union Countries. Sustainability 2025, 17, 34. [Google Scholar] [CrossRef] [Scilit]
- D’Onza, G.; Greco, G.; Allegrini, M. Full cost accounting in the analysis of separated waste collection efficiency: A methodological proposal. J. Environ. Manag. 2016, 167, 59–65. [Google Scholar] [CrossRef] [Scilit] [PubMed]
- Wang, T. Internet of Things and Big Data in Smart Logistics. In Proceedings of the 2022 2nd International Conference on Education, Information Management and Service Science (EIMSS 2022), Changsha, China, 22–24 July 2022; pp. 1265–1271. [Google Scholar] [CrossRef] [Scilit] [PubMed]
- Pachakis, G.; Malamis, D.; Mai, S.; Barampouti, E.M. Spatial Influence on Waste-to-Energy Sustainability: A Life Cycle Assessment of RDF Transport and Plant Siting. Energies 2025, 18, 6238. [Google Scholar] [CrossRef] [Scilit]
- Jiang, Q.; Wang, H. Risk assessment and hybrid algorithm transportation path optimization model for road transport of dangerous goods. IATSS Res. 2025, 49, 72–80. [Google Scholar] [CrossRef] [Scilit]
- Markarian, C. Online Algorithmic Study of Facility Location Problems: A Survey. IEEE Access 2024, 12, 77724–77738. [Google Scholar] [CrossRef] [Scilit]
- Li, W.; Ng, T.F.; Ibrahim, H.; Wang, S.L. A literature review of the state of the art of sustainable waste collection and vehicle routing problem. J. Air Waste Manag. Assoc. 2024, 75, 3–26. [Google Scholar] [CrossRef] [Scilit] [PubMed]
- Pérez-Mesa, J.C.; Serrano-Arcos, M.M.; Jiménez-Guerrero, J.F.; Sánchez-Fernández, R. Addressing the Location Problem of a Perishables Redistribution Center in the Middle of Europe. Foods 2021, 10, 1091. [Google Scholar] [CrossRef] [Scilit] [PubMed]
- Duan, Y.; Hu, B.; Ri, S.; Wang, L.; Zhou, M. A hybrid multi-criteria decision-making model for waste facilities location considering system resilience. Comput. Ind. Eng. 2024, 193, 110326. [Google Scholar] [CrossRef] [Scilit]
- Güler, M.; Samastı, M.; Yücesan, M.; Gül, M.; Celik, E.; Ciner, M.; Algorabi, Ö. Selection of the central composting facility for organic wastes through the Bayesian best worst method and Geographic information system incorporation: The case of Istanbul. Eng. Sci. Technol. Int. J. 2025, 70, 102175. [Google Scholar] [CrossRef] [Scilit]
- Batta, R.; Lejeune, M.; Prasad, S. Public facility location using dispersion, population, and equity criteria. Eur. J. Oper. Res. 2014, 234, 819–829. [Google Scholar] [CrossRef] [Scilit]
- Ait Ihia, O.; Khomsi, D.; Semlali Aouragh Hassani, N.; Edderkaoui, R. GIS and Multi-Objective Optimization Model for the Design of Municipal Solid Waste Management Systems: Case Study of the Province of Tiznit, Morocco. Int. Rev. Civ. Eng. 2023, 14, 82–93. [Google Scholar] [CrossRef] [Scilit]
- Oo, P.Z.; Trakarn, P.; Strezov, V.; Huda, N.; Oshita, K.; Takaoka, M.; Ren, J.; Halog, A.; Gheewala, S. The role of global waste management and circular economy towards carbon neutrality. Sustain. Prod. Consum. 2024, 52, 498–510. [Google Scholar] [CrossRef] [Scilit]
- Noreña-Zapata, D.; Restrepo-Vallejo, J.C.; Morillo-Torres, D.; Gatica, G. A Novel Exact and Heuristic Solution for the Periodic Location-Routing Problem Applied to Waste Collection. Processes 2024, 12, 1557. [Google Scholar] [CrossRef] [Scilit]
- Croella, A.L.; Fraccascia, L. A location-sizing and routing model for a biomethane production chain fed by municipal waste. Comput. Ind. Eng. 2024, 198, 110714. [Google Scholar] [CrossRef] [Scilit]
- Sonar, H.; Sarkar, B.D.; Joshi, P.; Ghag, N.; Choubey, V.; Jagtap, S. Navigating barriers to reverse logistics adoption in circular economy: An integrated approach for sustainable development. Clean. Logist. Supply Chain 2024, 12, 100165. [Google Scholar] [CrossRef] [Scilit]
- Joshi, C.; Seay, J.; Banadda, N. A perspective on a locally managed decentralized circular economy for waste plastic in developing countries. Environ. Prog. Sustain. Energy 2018, 38, 3–11. [Google Scholar] [CrossRef] [Scilit]
- Trevisan, L.; Bordignon, M. Screening Life Cycle Assessment to compare CO2 and Greenhouse Gases emissions of air, road, and rail transport: An exploratory study. Procedia CIRP 2020, 90, 303–309. [Google Scholar] [CrossRef] [Scilit]
- Sahu, M.; Sharma, P.; Sharma, H.; Choudhury, T.; Dewangan, B. Route Optimization for Waste Collection. In Emerging Technologies in Data Mining and Information Security; Dutta, P., Chakrabarti, S., Bhattacharya, A., Dutta, S., Piuri, V., Eds.; Springer: Singapore, 2023; Volume 491, pp. 605–613. [Google Scholar] [CrossRef] [Scilit]
- Shenyoputro, K.; Jones, T. Reflections on a two-decade journey toward zero waste: A case study of Kamikatsu town, Japan. Front. Environ. Sci. 2023, 11, 1171379. [Google Scholar] [CrossRef] [Scilit]
- Romano, G.; Masserini, L. Does a zero-waste strategy in sustainable urban waste management affect hierarchy targets and costs? Util. Policy 2023, 85, 101659. [Google Scholar] [CrossRef] [Scilit]
- Pietzsch, N.; Ribeiro, J.L.D.; de Medeiros, J.F. Benefits, challenges and critical factors of success for Zero Waste: A systematic literature review. Waste Manag. 2017, 67, 324–333. [Google Scholar] [CrossRef] [Scilit] [PubMed]
- Alharbi, S.T. Multi-Objective Evolutionary Algorithms in Waste Disposal Systems: A Comprehensive Review of Applications, Case Studies, and Future Directions. Computers 2025, 14, 316. [Google Scholar] [CrossRef] [Scilit]
- Mohd Ghazali, J.; Shuib, A.; Wan Abdul Aziz, R. Advancements in Multi-Objective Mathematical Programming Models and Solution Approaches for Sustainable Waste Management Practices in Vehicle Routing Problem: A Systematic Literature Review. PaperASIA 2024, 40, 44–54. [Google Scholar] [CrossRef] [Scilit]
- Ayyildiz, E.; Erdogan, M. Literature analysis of the location selection studies related to the waste facilities within MCDM approaches. Environ. Sci. Pollut. Res. 2025, 32, 19574–19595. [Google Scholar] [CrossRef] [Scilit] [PubMed]
- Ma’ruf, M.F.; Muzaqi, A.H.; Ramadhani, G.T. Polycentric Collaborative Governance and Circular Economy in Urban Waste Systems: Public Value Co-Creation Through CSR—Community Partnerships in Surabaya, Indonesia. J. Perenc. Pembang. Indones. J. Dev. Plan. 2025, 9, 408–421. [Google Scholar] [CrossRef] [Scilit]
- Tomar, L.; Seth, S. Corporate Social Responsibility and Community Engagement: A Conceptual Review of Strategic Integration. J. Emerg. Manag. Stud. 2025, 3, 33–47. [Google Scholar] [CrossRef] [Scilit]
- Dennison, M.S.; Kumar, M.B.; Jebabalan, S.K. Realization of circular economy principles in manufacturing: Obstacles, advancements, and routes to achieve a sustainable industry transformation. Discov. Sustain. 2024, 5, 438. [Google Scholar] [CrossRef] [Scilit]
- Shang, C.; Ma, L.; Gao, Y. Two-Echelon Collaborative Location Routing Problem With Intuitionistic Fuzzy Multi-Demands for Sorted-Waste Collection and Transportation. IEEE Trans. Intell. Transp. Syst. 2025, 26, 3671–3683. [Google Scholar] [CrossRef] [Scilit]
- Rumetshofer, T.; Fischer, J. Information-Based Plastic Material Tracking for Circular Economy—A Review. Polymers 2023, 15, 1623. [Google Scholar] [CrossRef] [Scilit] [PubMed]
- Farooque, M.; Zhang, A.; Thürer, M.; Qu, T.; Huisingh, D. Circular supply chain management: A definition and structured literature review. J. Clean. Prod. 2019, 228, 882–900. [Google Scholar] [CrossRef] [Scilit]
- Li, K.; Ward, H.; Lin, H.X.; Tukker, A. Shift to intra-EU-OECD trade enhanced environmental benefits after Basel Convention Plastic Waste Amendments. Resour. Conserv. Recycl. 2025, 223, 108527. [Google Scholar] [CrossRef] [Scilit]
- Ferrão, C.C.; Ribas Moraes, J.A.; Fava, L.P.; Furtado, J.C.; Machado, E.; Rodrigues, A.; Sellitto, M.A. Optimizing routes of municipal waste collection: An application algorithm. Manag. Environ. Qual. 2024, 35, 965–985. [Google Scholar] [CrossRef] [Scilit]
- Nickdoost, N.; Jalloul, H.; Choi, J. An integrated framework for temporary disaster debris management sites selection and debris collection logistics planning using geographic information systems and agent-based modeling. Int. J. Disaster Risk Reduct. 2022, 80, 103215. [Google Scholar] [CrossRef] [Scilit]
- Bräysy, O.; Gendreau, M. Tabu Search heuristics for the Vehicle Routing Problem with Time Windows. Top 2002, 10, 211–237. [Google Scholar] [CrossRef] [Scilit]
- Mavrin, V.; Makarova, I. Developing a Decision Support System to Improve the Waste Transportation Process. Logistics 2026, 10, 78. [Google Scholar] [CrossRef] [Scilit]
- Alzahrani, A.M.Y. Mitigation of waste transportation costs in Taif Province, Saudi Arabia. Rud.-Geološko-Naftni Zb. 2022, 37, 159–167. [Google Scholar] [CrossRef] [Scilit]
- Ministry of Natural Resources of the Russian Federation. Order No. 158 of 31 March 2025 “On Approval of Criteria for Classifying Waste into Hazard Classes I–V According to the Degree of Negative Environmental Impact”. Registered with the Ministry of Justice of the Russian Federation on 29 April 2025, Registration No. 82010. Available online: https://www.consultant.ru/document/cons_doc_LAW_504642/ (accessed on 21 June 2026).
- Government of the Republic of Tatarstan. On Approval of the Territorial Scheme in the Field of Waste Management of the Republic of Tatarstan. Decree No. 149 of 13 March 2018 (as Amended on 19 December 2024). Available online: https://pravo.tatarstan.ru/file/npa/2024-12/1552662/npa_1552663.pdf (accessed on 30 June 2026).
- Matthew, C.; Spataru, C. What drives the viability of waste-to-energy? Modelling techno-economic scenarios of anaerobic digestion and energy generation for the Scottish islands. J. Clean. Prod. 2023, 410, 137306. [Google Scholar] [CrossRef] [Scilit]
- Tian, X.; Peng, F.; Wei, G.; Xiao, C.; Ma, Q.; Hu, Z.; Liu, Y. Agent-based modeling in solid waste management: Advantages, progress, challenges and prospects. Environ. Impact Assess. Rev. 2025, 110, 107723. [Google Scholar] [CrossRef] [Scilit]
- Shi, Y.; Lin, Y.; Wang, S.; Wen, H.; Yang, L.; Lim, M.K.; Li, Y. A simulation-optimization system for recycling logistics network of recyclable express packaging. Comput. Ind. Eng. 2024, 189, 109949. [Google Scholar] [CrossRef] [Scilit]

Disclaimer/Publisher’s Note: The statements, opinions and data contained in all publications are solely those of the individual author(s) and contributor(s) and not of MDPI and/or the editor(s). MDPI and/or the editor(s) disclaim responsibility for any injury to people or property resulting from any ideas, methods, instructions or products referred to in the content. |
© 2026 by the authors. Licensee MDPI, Basel, Switzerland. This article is an open access article distributed under the terms and conditions of the Creative Commons Attribution (CC BY) license.