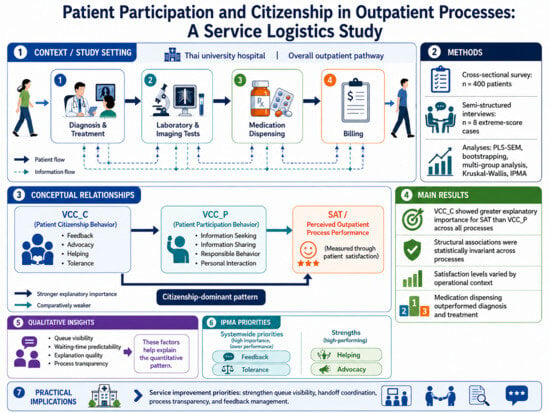
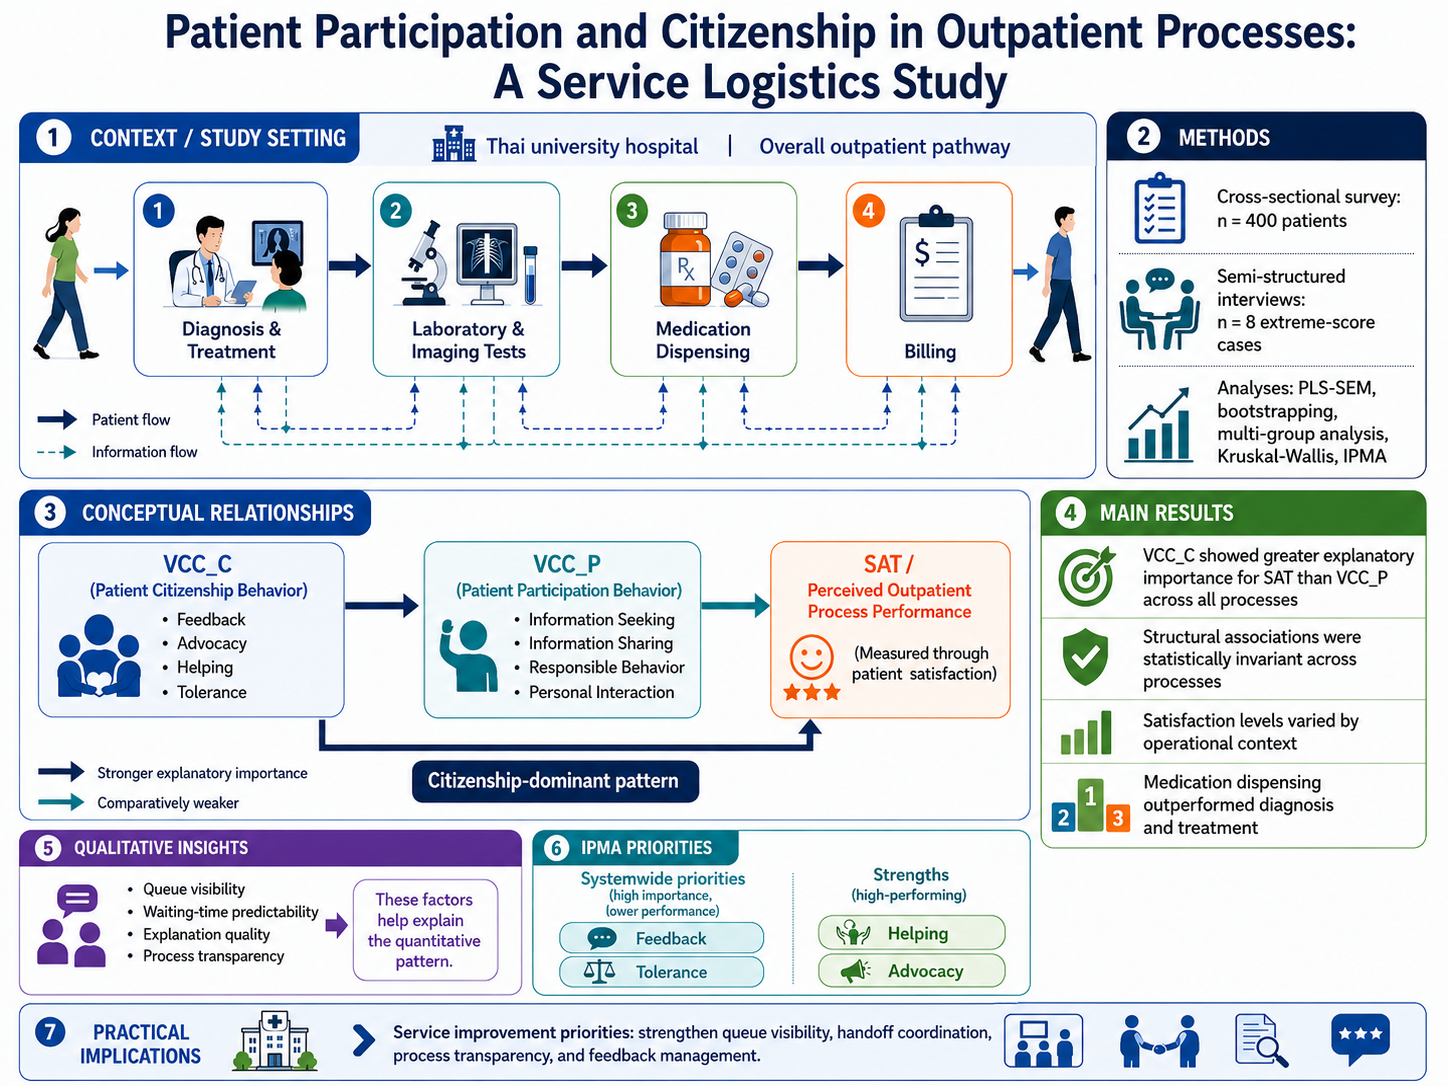
1. Introduction
Global demand for healthcare has increased substantially over recent decades, placing growing pressure on healthcare delivery systems and health expenditure worldwide [
1,
2]. At the same time, hospitals are expected to deliver services that are timely, reliable, and responsive to patients’ needs, while operating under increasing fiscal and workforce constraints [
2,
3]. In outpatient settings, these pressures are especially visible because service delivery depends on the coordination of multiple service interfaces, including consultation, testing, dispensing, and billing, each of which can shape how patients evaluate the overall service experience [
4,
5]. This process-based view is consistent with the hospital logistics literature, which emphasizes that patient flow performance depends on how service pathways are structured and coordinated across care units rather than on isolated encounters alone [
6,
7,
8]. In this context, improving perceived outpatient process performance has become an important managerial priority for hospitals seeking to strengthen service quality through better coordination and more reliable service delivery.
At the same time, patients are no longer passive recipients of care, but are increasingly informed, selective, and willing to engage more actively in service processes [
9,
10]. Greater access to information and rising expectations for transparency, responsiveness, and personalized service have changed how patients interact with healthcare providers and hospital systems [
9,
11]. In outpatient settings, this shift has important operational implications because patient behaviors can either support or hinder the smooth coordination of service encounters across multiple handoffs. As a result, hospitals must consider not only how care is clinically delivered, but also how patient engagement shapes the experience of waiting, communication, coordination, and service continuity across the outpatient pathway.
Within this context, value co-creation offers a useful perspective for understanding how patient behaviors may contribute to service improvement in hospital operations [
12,
13]. In healthcare, patients do not merely receive services, but may also participate by seeking and sharing information, cooperating with service staff, and engaging in behaviors that support smoother service interactions [
14,
15]. Such behaviors are especially relevant in outpatient care, where coordination across multiple process interfaces depends not only on formal systems and staff actions, but also on how patients respond to instructions, communicate information, and navigate service steps. From a service logistics perspective, these patient-side behaviors can be interpreted as potential enablers of more reliable coordination, reduced process friction, and better perceived service performance across the outpatient pathway. In healthcare operations, the quality of coordination depends not only on physical patient movement, but also on timely and accurate information exchange and effective handover communication across service interfaces [
16,
17].
In hospital settings, service quality is often evaluated not only in terms of clinical outcomes, but also in terms of how patients experience timeliness, reliability, responsiveness, assurance, and empathy during service delivery [
18,
19,
20]. For this reason, patient satisfaction is widely used as an important evaluative outcome in healthcare service research and provides a practical way to assess how outpatient processes are experienced from the patient perspective [
21,
22,
23]. In the present study, patient satisfaction is treated as a reflection of perceived outpatient process performance, particularly in relation to how patients experience waiting, coordination, communication, and service continuity across multiple outpatient handoffs. This positioning allows the study to remain consistent with the patient-centered measurement logic of service quality while interpreting the findings through a service logistics perspective.
Despite growing interest in value co-creation in healthcare, important gaps remain in the current literature. First, prior studies have generally examined the relationship between value co-creation and satisfaction at an aggregate service level, with limited attention to how these relationships may differ across specific outpatient processes [
24,
25,
26]. Second, although previous studies have shown that value co-creation is positively associated with patient satisfaction, fewer studies have examined these relationships from a process-level perspective that explicitly considers coordination across patient flow, information flow, and multiple outpatient handoffs [
4,
15,
27]. Third, limited evidence is available on how direct effects, mediated effects, and process-specific improvement priorities can be integrated within a single analytical design that supports decision-making in hospital operations. Addressing these gaps is important for developing a more operationally meaningful understanding of how patient-side behaviors are associated with perceived outpatient process performance.
To address these gaps, this study investigates how patient citizenship behavior and participation behavior are associated with patient satisfaction across four outpatient processes, namely diagnosis and treatment, laboratory and imaging tests, medication dispensing, and billing, as well as across the overall outpatient pathway in a Thai university hospital. Grounded in customer value co-creation behavior and performance-based service quality measurement, the study conceptualizes citizenship behavior and participation behavior as patient-side behavioral enablers and treats patient satisfaction as an indicator of perceived outpatient process performance [
13,
18]. The study makes four contributions. First, it adopts a process-level design that distinguishes among outpatient subprocesses rather than treating outpatient care as a single aggregate service context. Second, it examines both direct and mediated relationships among citizenship behavior, participation behavior, and patient satisfaction across distinct outpatient processes, thereby extending value co-creation analysis to a more process-level and operationally meaningful outpatient context, despite a growing healthcare operations literature on hospital-wide patient flow logistics and flow improvement [
7,
8]. Third, it combines PLS-SEM, multi-group analysis, Kruskal–Wallis testing, and IPMA to distinguish stable structural associations from process-level differences in perceived performance [
28,
29,
30,
31]. Fourth, it interprets the findings through a service logistics perspective to identify improvement priorities related to queue visibility, handoff coordination, process transparency, and patient-information flow across outpatient operations.
2. Materials and Methods
This study adopts a case-based empirical design within a large university hospital in Bangkok, Thailand to examine how patient-side value co-creation behaviors are associated with patient satisfaction as an indicator of perceived outpatient process performance, interpreted through a service logistics perspective.
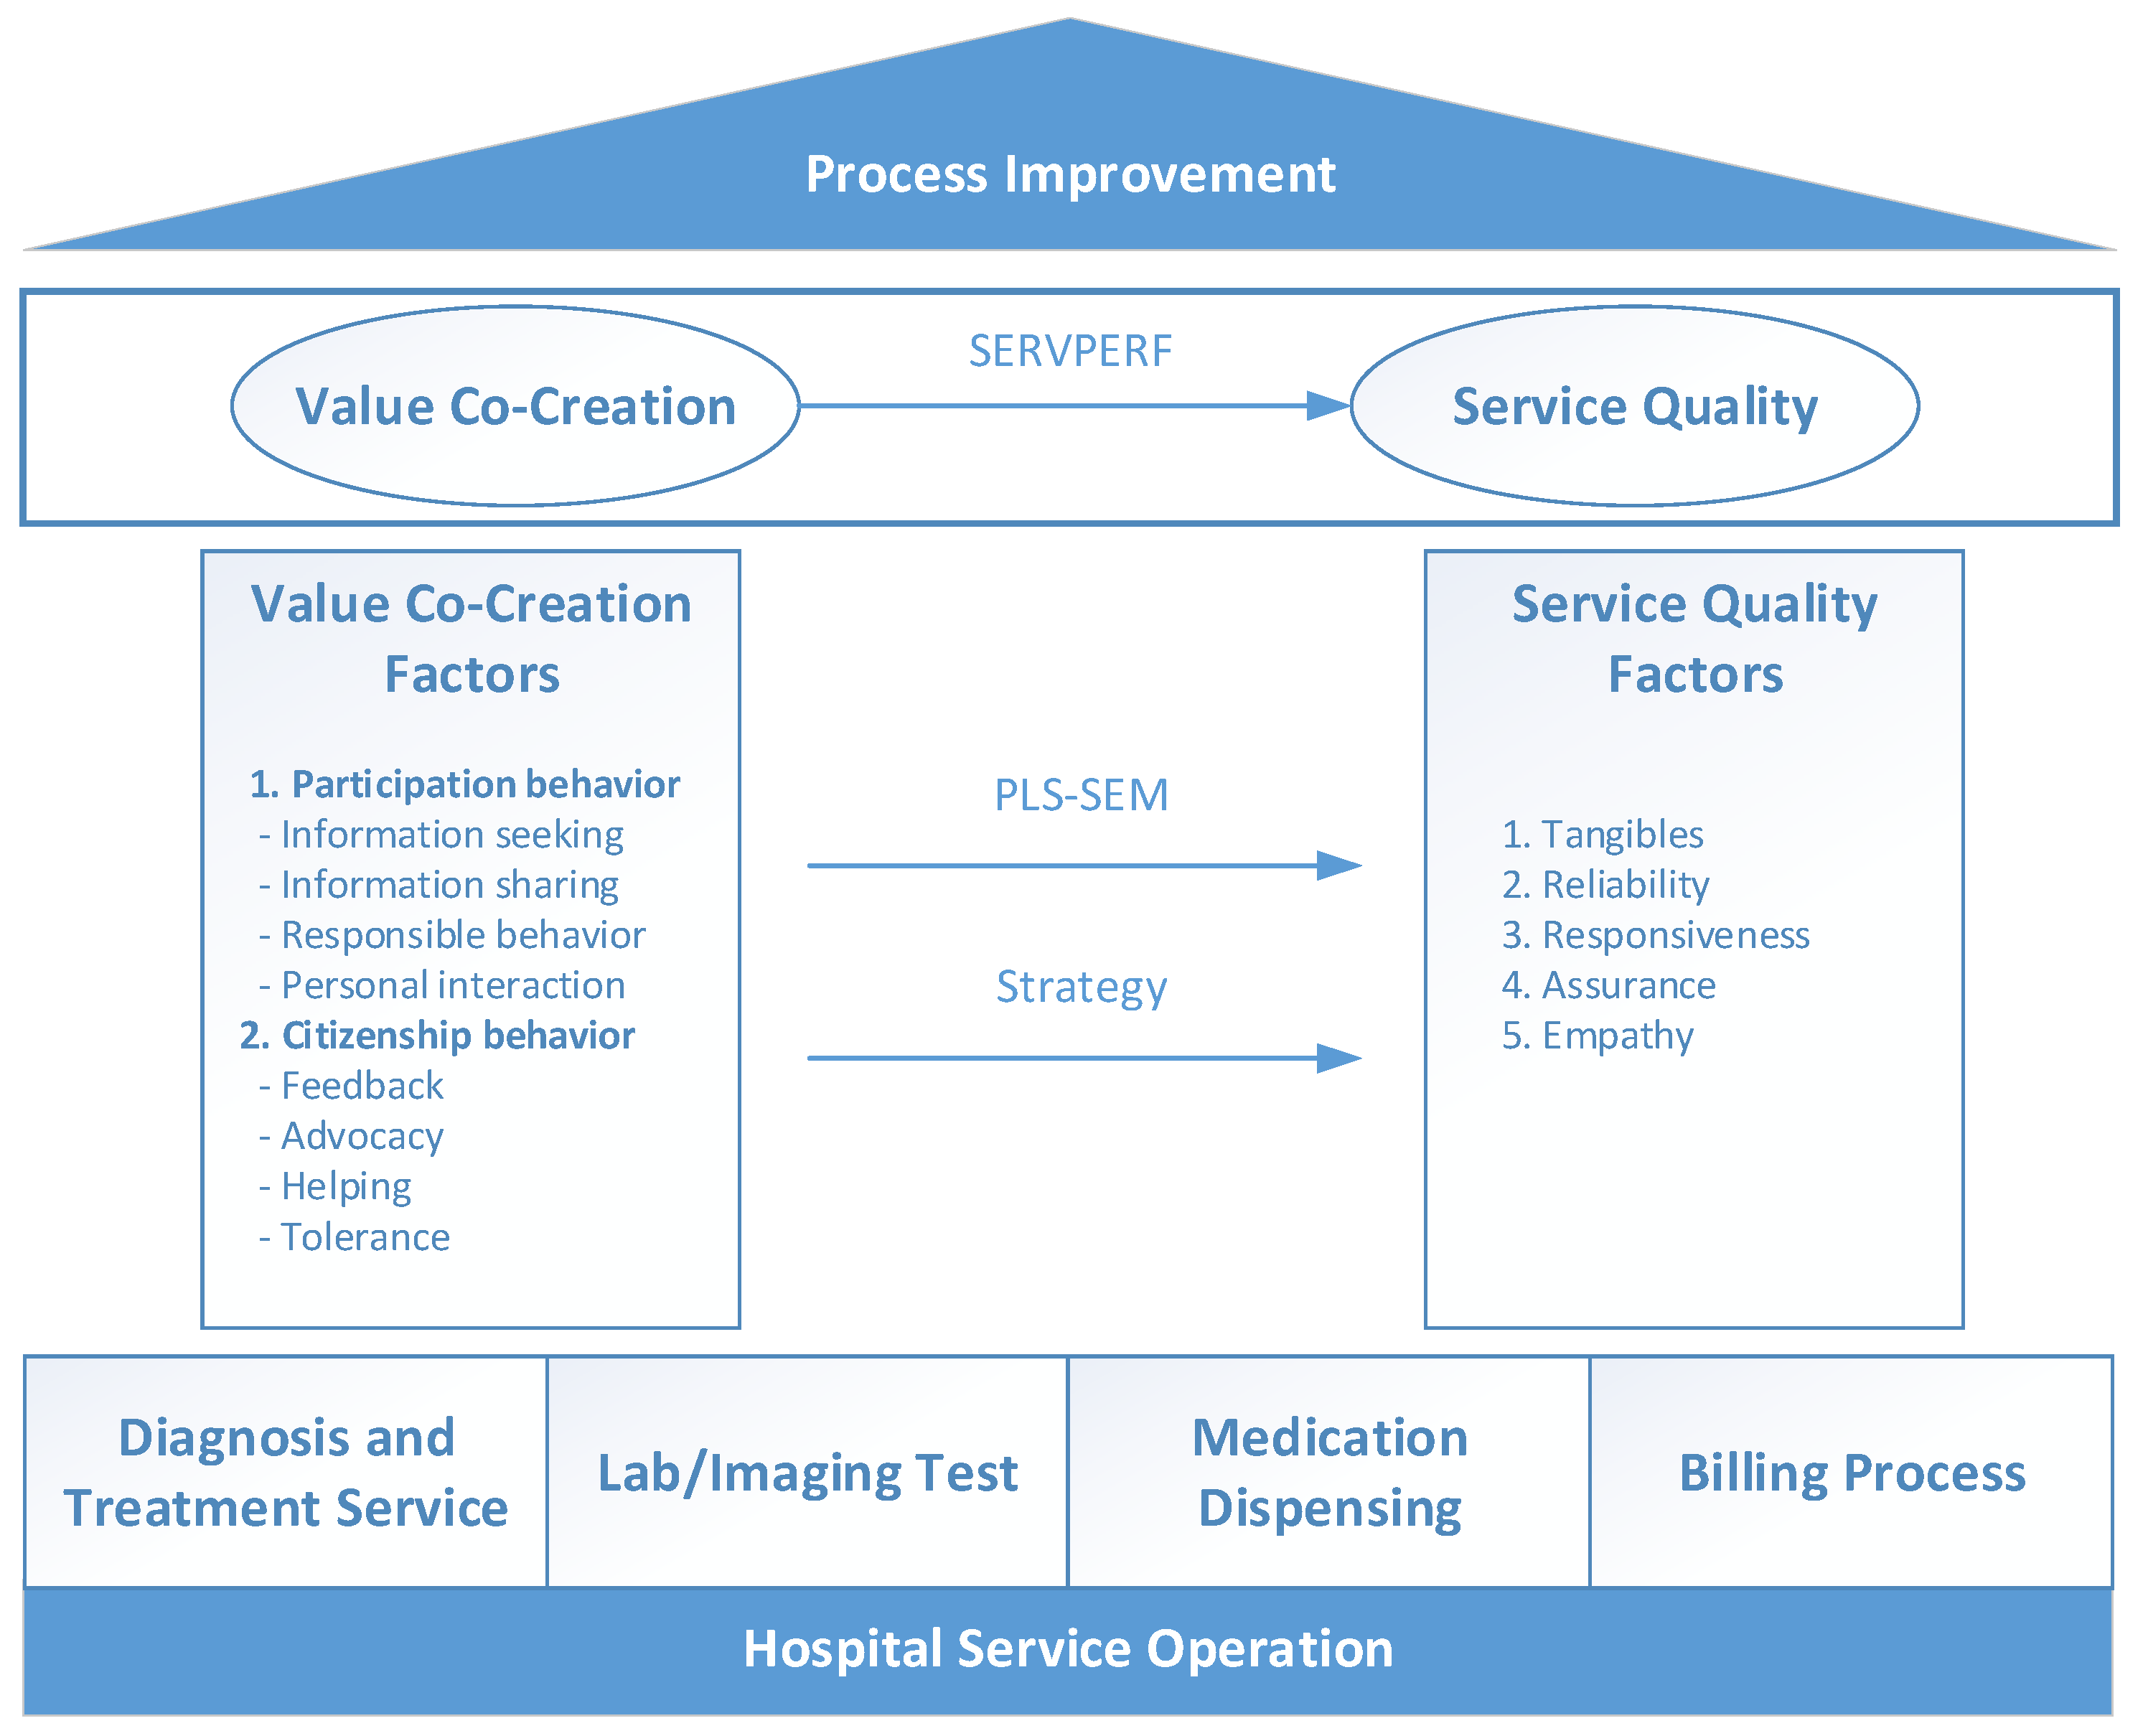
The analysis covers four outpatient (OPD) processes: (1) diagnosis and treatment, (2) laboratory and imaging tests, (3) medication dispensing, and (4) billing, together with an overall pooled analysis reflecting the hospital’s process mix. The objectives are to: (i) estimate the associations of citizenship and participation behaviors with patient satisfaction within each process and in the pooled model; (ii) translate these findings into actionable, process-specific priorities using Importance–Performance Map Analysis (IPMA); and (iii) develop an evidence-based framework for outpatient process improvement from a service logistics perspective, informed by the observed associations between patient value co-creation behaviors and patient satisfaction (
Figure 1).
2.1. Study Setting and Process Mapping
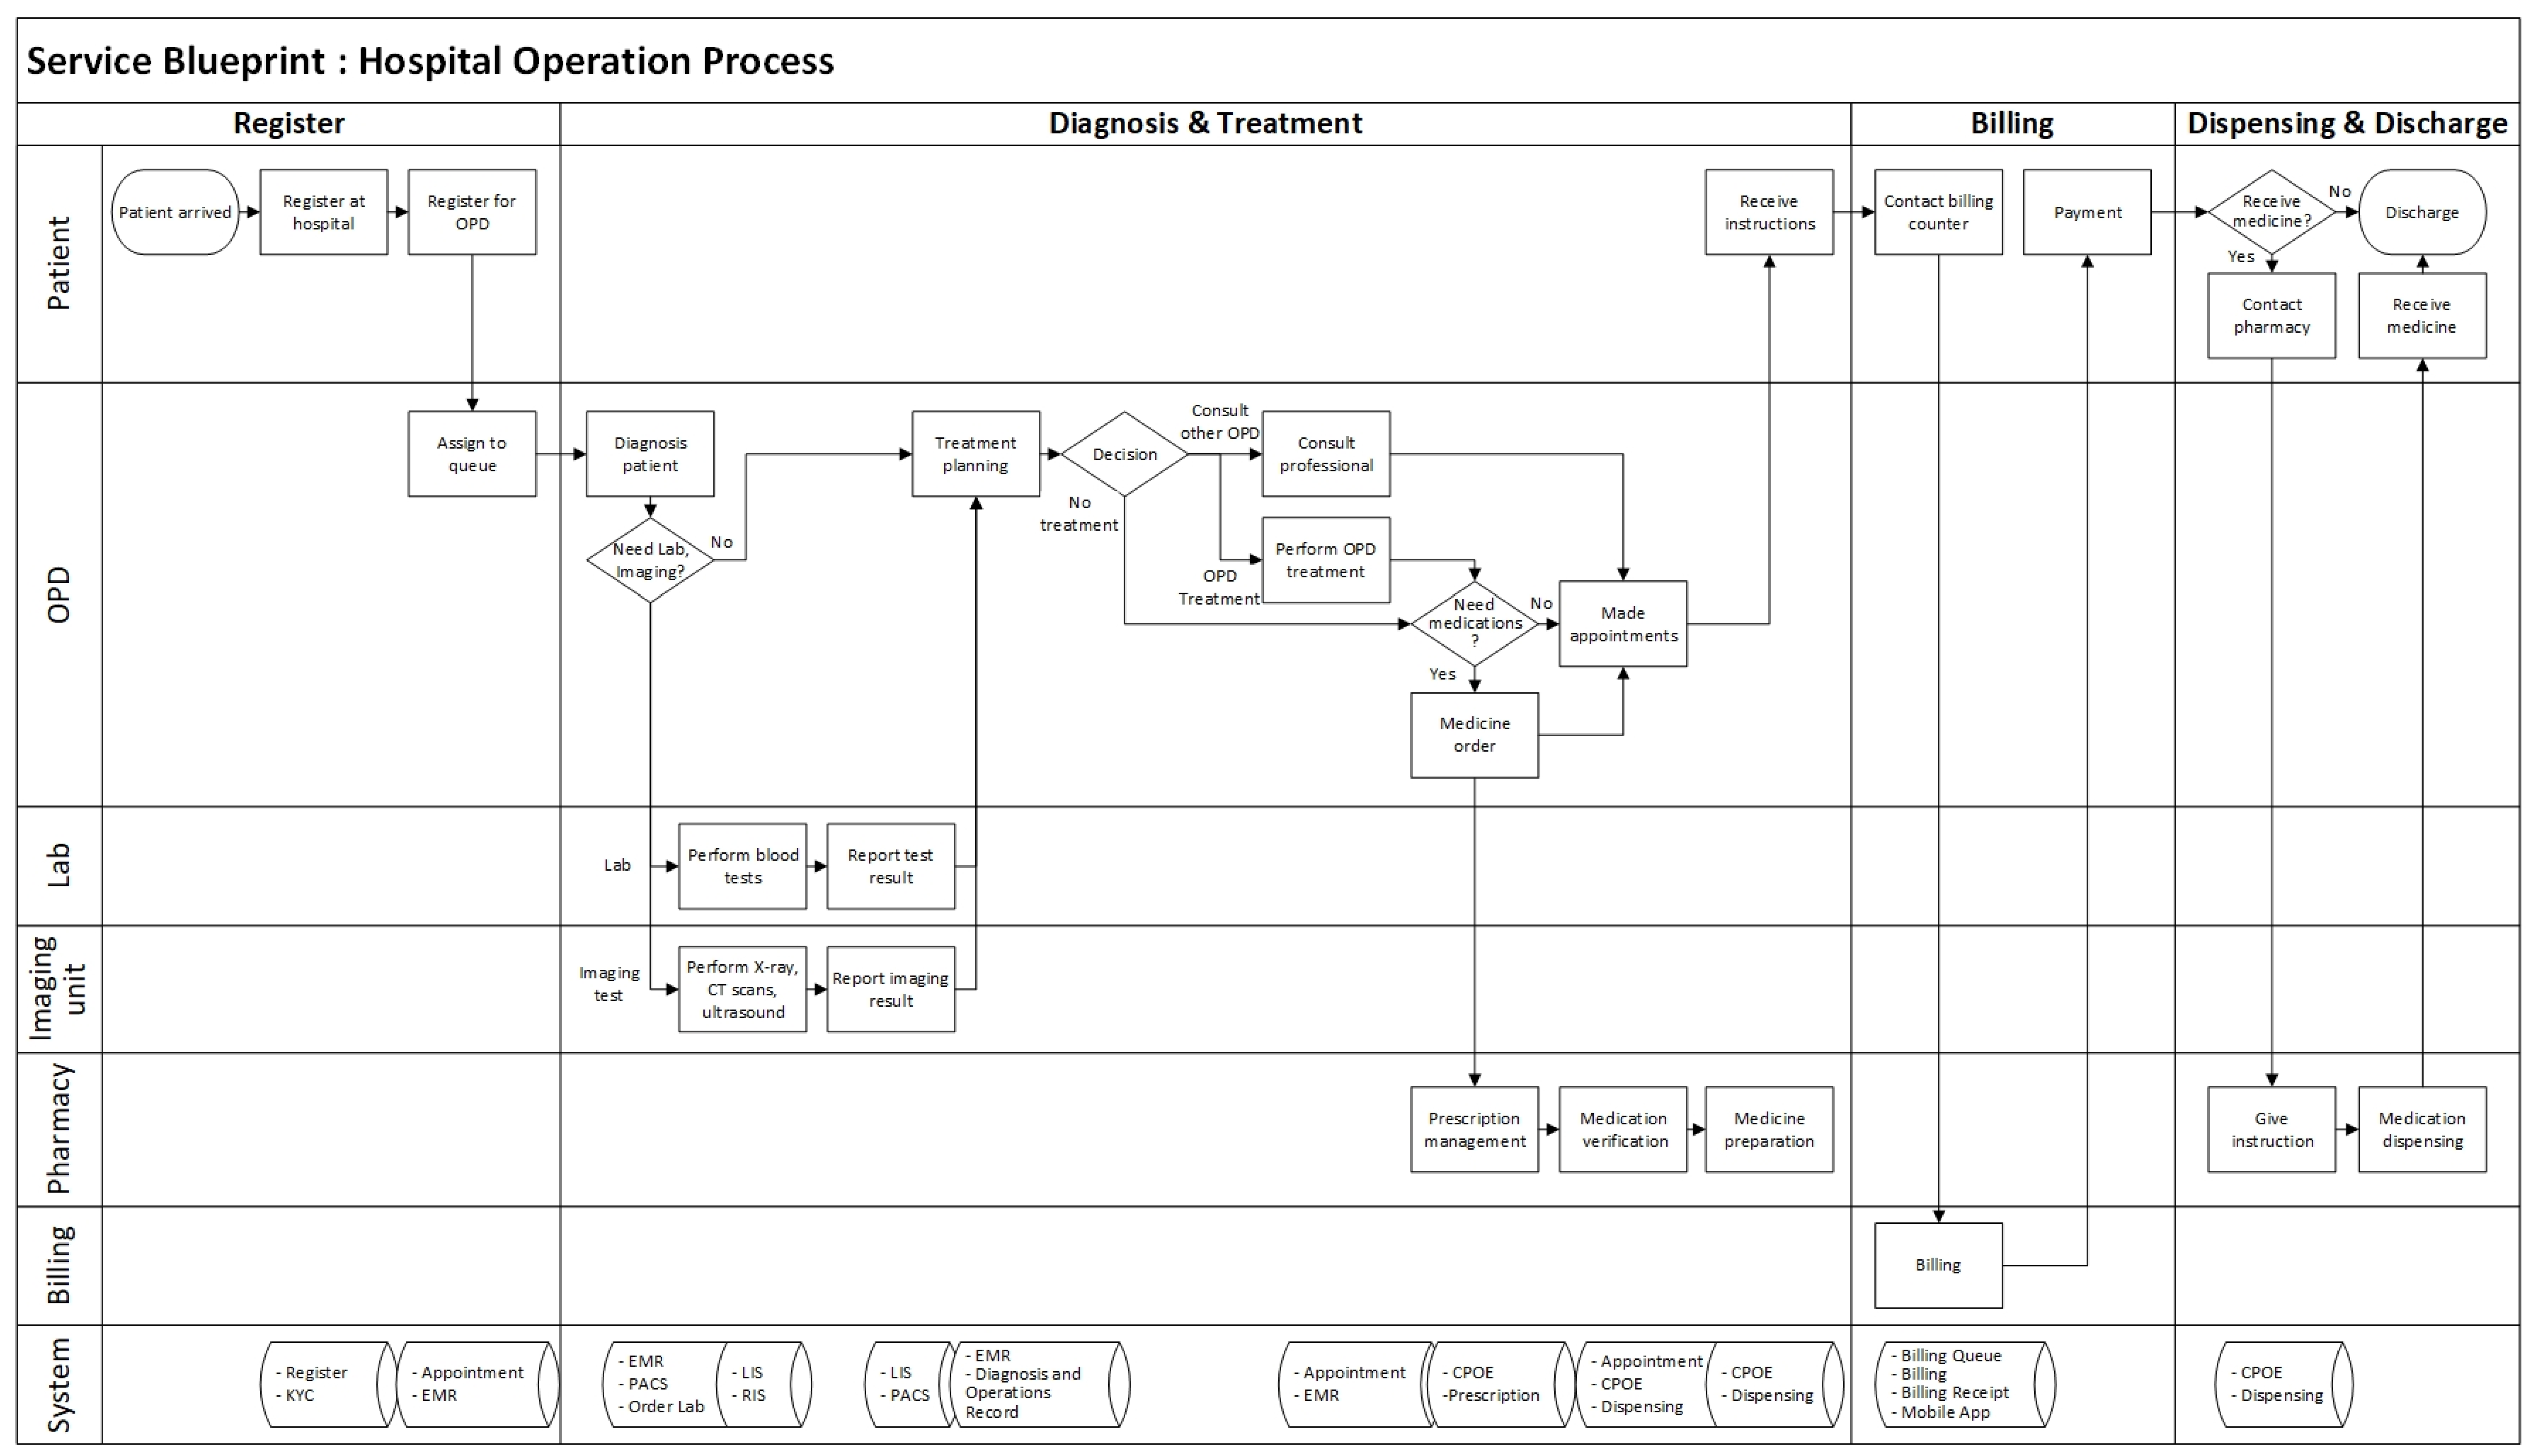
The case study hospital, a large university hospital in Thailand, delivers outpatient care through an integrated service system mapped using a service blueprint (
Figure 2). The blueprint clarifies patient–staff interactions, departmental responsibilities, and information flows across four main stages: (1) Register, (2) Diagnosis and Treatment (including Laboratory and Imaging tests), (3) Billing, and (4) Dispensing and Discharge, supported by interconnected digital subsystems.
At registration, patients are enrolled/verified and linked to the EMR, then routed via queue management; a mobile application enables online OPD registration and synchronizes appointment/EMR data to reduce onsite waiting. In diagnosis and treatment, physicians assess patients and, when necessary, request lab/imaging tests; results are transmitted to the EMR. Based on clinical review, treatment decisions are made, including cross-specialty consultation when required. If medication is needed, prescriptions are issued electronically via CPOE; otherwise, follow-up appointments are scheduled. Billing verifies charges from EMR/CPOE, processes payment at counters or via the mobile app, and generates digital receipts with updates to financial systems. In dispensing, the pharmacy performs prescription verification, medication preparation, final checks, and patient counseling; the mobile app also supports real-time medication queue tracking.
This study focuses on four OPD processes (diagnosis and treatment, laboratory and imaging tests, medication dispensing, and billing) due to their direct impact on patient experience and operational performance.
2.2. Conceptual Framework and Hypotheses
The conceptual framework of this study is developed from prior literature on value co-creation, patient satisfaction, and performance-based service quality measurement. Patient satisfaction (SAT) is used as an evaluative outcome reflecting patients’ perceptions of service quality and perceived outpatient process performance. In line with the SERVPERF approach, patient satisfaction is operationalized through five service quality dimensions, namely tangibles, reliability, responsiveness, assurance, and empathy [
18,
19,
20].
Value co-creation is conceptualized through two patient behavior constructs. Participation behavior (VCC_P) refers to in-role behaviors performed by patients during service delivery, including information seeking, information sharing, responsible behavior, and personal interaction. Citizenship behavior (VCC_C) refers to voluntary extra-role behaviors that are not formally required for service delivery, but may support the service environment, including feedback, advocacy, helping, and tolerance [
13,
32,
33]. In outpatient settings, these behaviors are relevant because patients interact with multiple service nodes and must provide information, follow instructions, communicate with staff, and respond to waiting and service handoffs across the outpatient pathway.
From a value co-creation perspective, citizenship behavior can support patient satisfaction because feedback, advocacy, helping, and tolerance reflect constructive patient engagement with the service system. These behaviors may strengthen patients’ perceived support, trust, and relational quality during service encounters [
12,
13,
15]. Accordingly, the first hypothesis is proposed as follows:
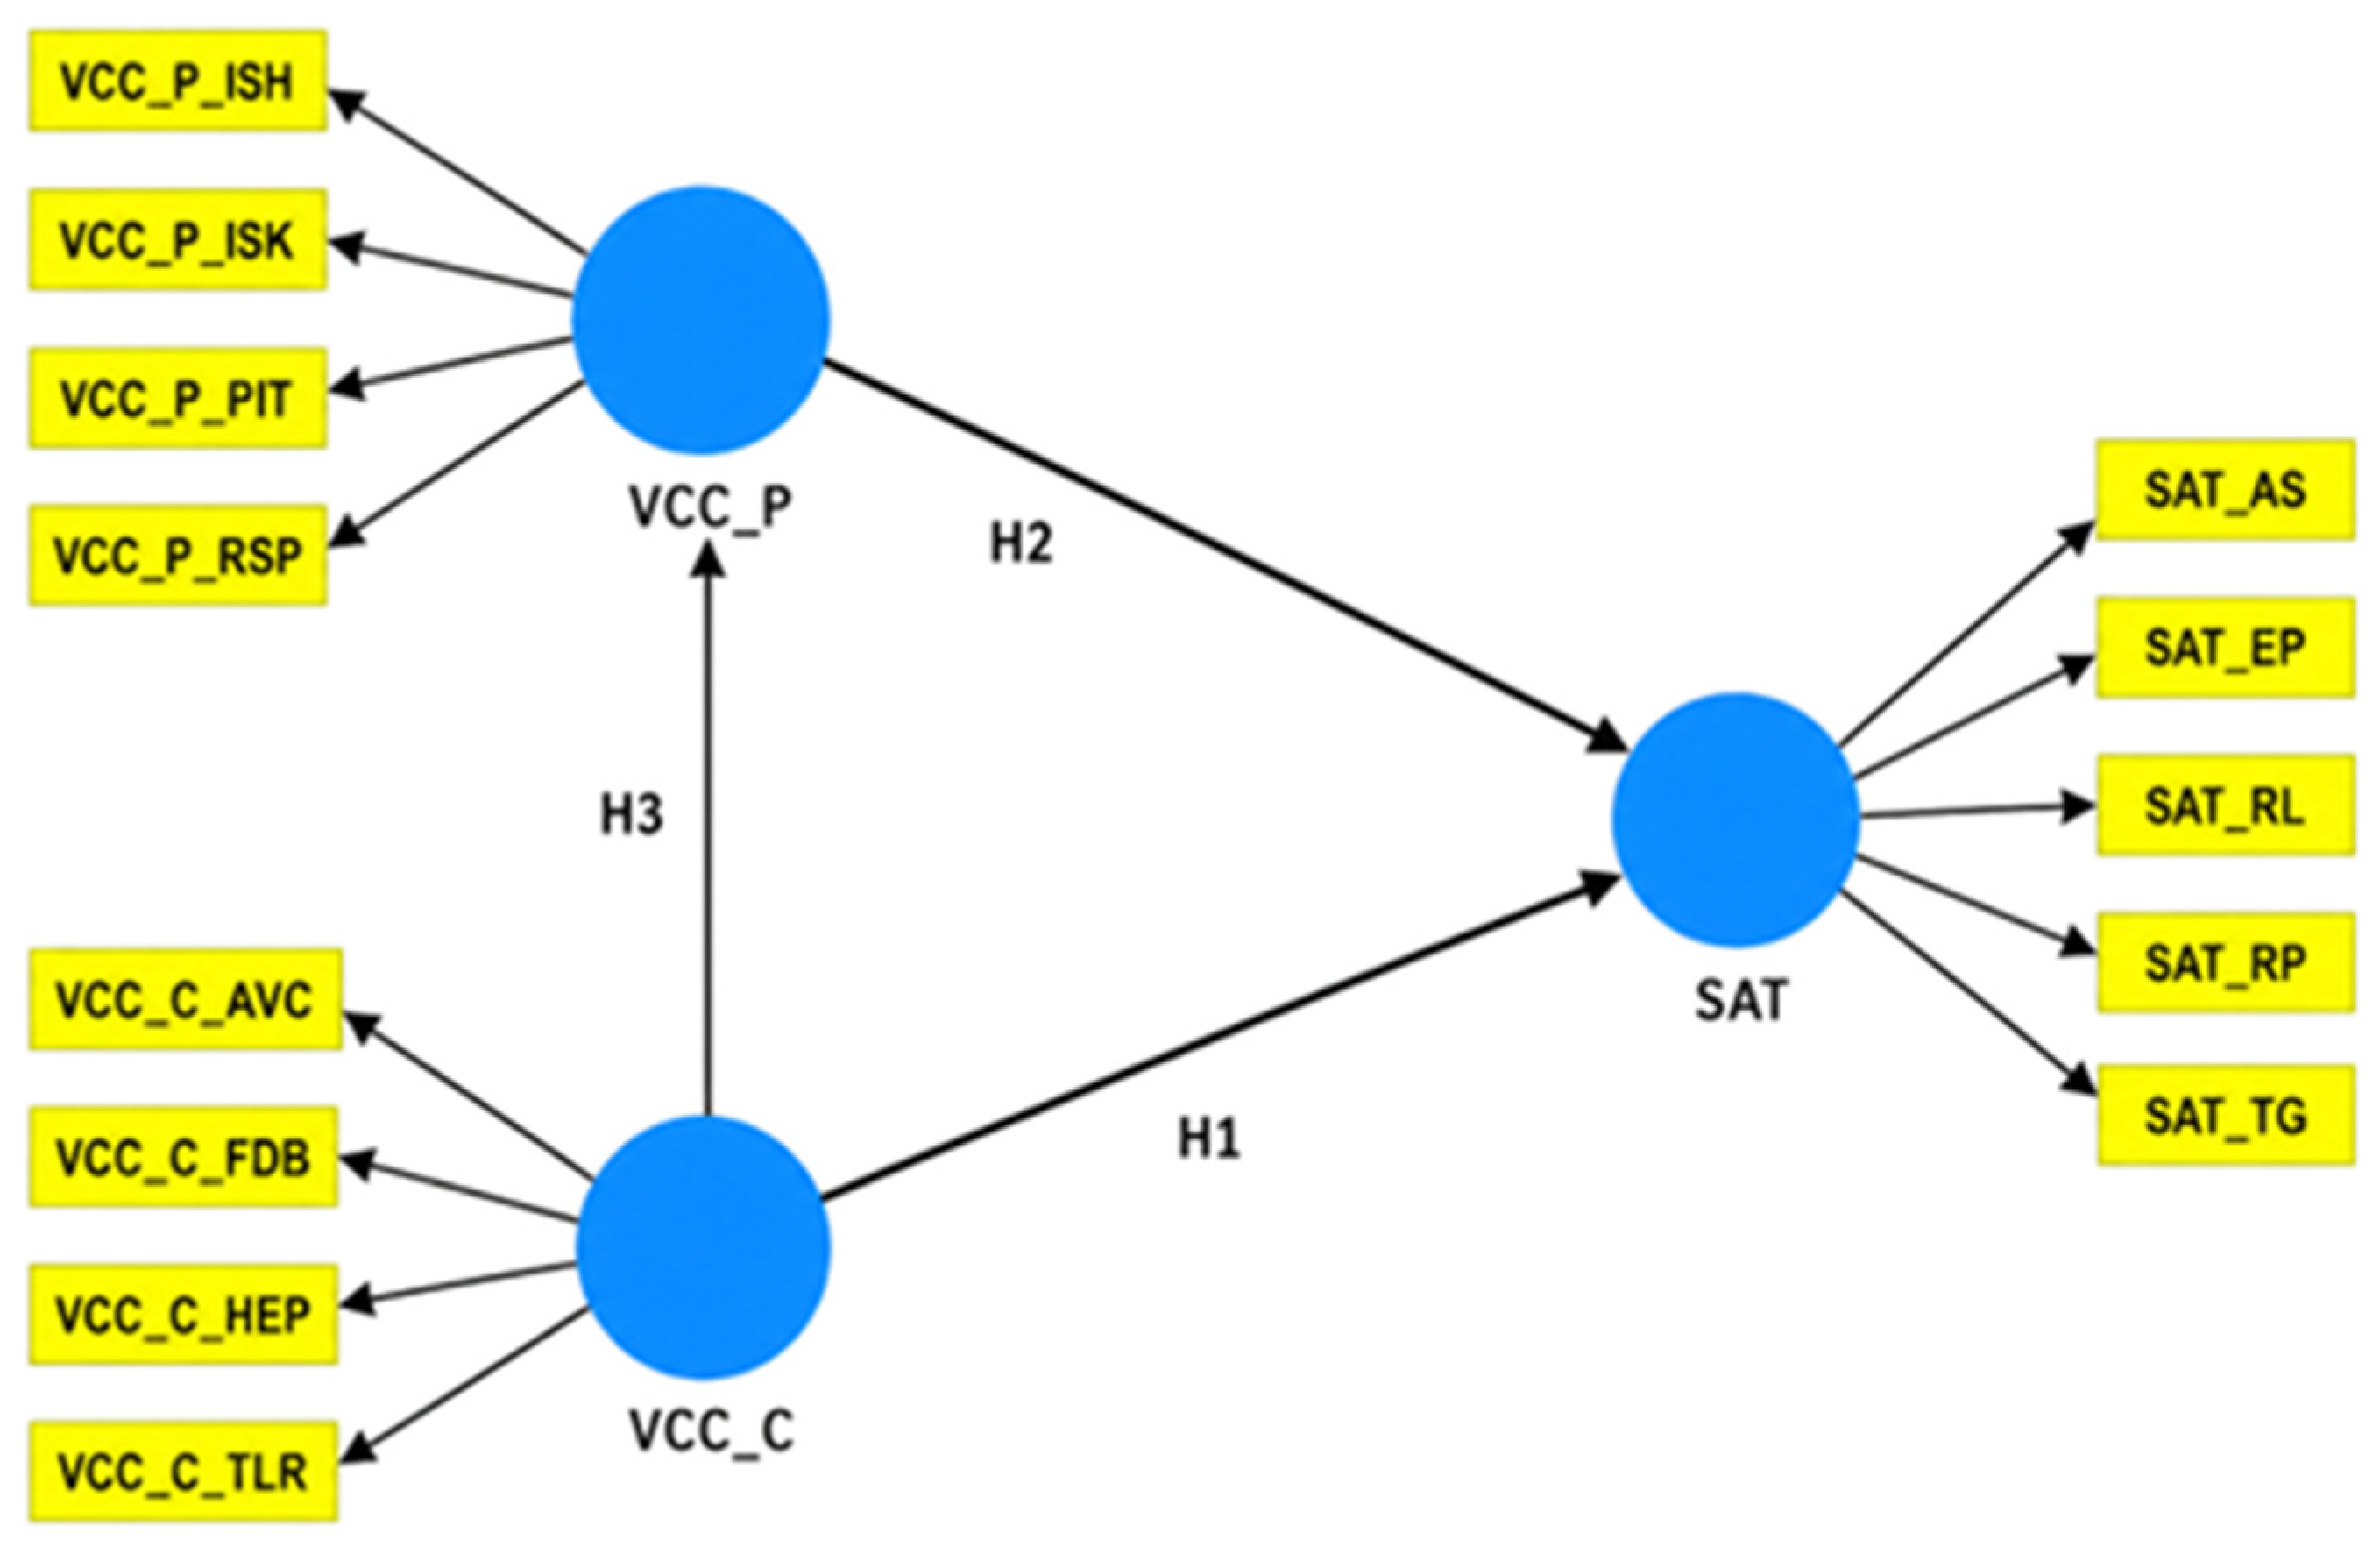
H1. Patient citizenship behavior (VCC_C) is positively associated with patient satisfaction (SAT).
Participation behavior is proposed as a mediating pathway between citizenship behavior and patient satisfaction. Patients who demonstrate citizenship behaviors may also be more willing to participate constructively in the service process by seeking information, sharing accurate information, following service requirements, and interacting appropriately with staff. These participation behaviors may then contribute to more positive evaluations of outpatient service encounters [
13,
14,
34,
35]. Therefore, the second hypothesis is proposed as follows:
H2. Patient participation behavior (VCC_P) mediates the relationship between patient citizenship behavior (VCC_C) and patient satisfaction (SAT).
Citizenship behavior may also be directly associated with participation behavior. Patients who are willing to provide feedback, show tolerance, advocate for the service, or help other patients may be more likely to engage actively and responsibly in their own service process. This relationship is consistent with value co-creation literature, which distinguishes between voluntary extra-role behaviors and required in-role participation behaviors while recognizing their interrelationship in service delivery [
13,
32,
36]. Thus, the third hypothesis is proposed as follows:
H3. Patient citizenship behavior (VCC_C) is positively associated with patient participation behavior (VCC_P).
Because outpatient departments consist of multiple service processes with different operational characteristics, the strength of these relationships may vary across processes. Diagnosis and treatment, laboratory and imaging tests, medication dispensing, and billing differ in terms of patient–staff interaction intensity, queue visibility, workflow standardization, information requirements, and handoff characteristics. These process conditions may influence how patient value co-creation behaviors are experienced and how strongly they are associated with patient satisfaction. Therefore, the following process-level hypotheses are proposed:
H4. The association between patient citizenship behavior (VCC_C) and patient satisfaction (SAT) varies across outpatient processes.
H5. The association between patient participation behavior (VCC_P) and patient satisfaction (SAT) varies across outpatient processes.
H6. The association between patient citizenship behavior (VCC_C) and patient participation behavior (VCC_P) varies across outpatient processes.
Although the hypotheses are directionally based on prior theory, all structural paths and indirect effects are evaluated using two-tailed bootstrapping tests at the 0.05 significance level. The VCC_P to SAT path is estimated as a component path required for testing the mediation hypothesis H2 and is reported in the structural model results. The proposed research framework integrating value co-creation citizenship behavior, participation behavior, and satisfaction constructs is illustrated in
Figure 3.
2.3. Population and Sampling
The study population comprised patients who used outpatient department (OPD) services at the case-study university hospital in Thailand. According to the hospital administrative records for 2020, the OPD patient population was 429,190 patients. The study focused on four outpatient processes, namely diagnosis and treatment, laboratory and imaging tests, medication dispensing, and billing, because these processes represent major service nodes that directly shape patients’ outpatient service experience.
For the process-level analyses, a balanced sample of 100 patients was collected from each outpatient process. This sampling approach was used to support comparability across the four process-specific models. A sample size of 100 per group is considered acceptable for a relatively simple PLS-SEM model and for subgroup comparison when the model contains a limited number of latent constructs and structural paths [
29,
37]. Therefore, the process-level models for G1_Diag, G2_Test, G3_Disp, and G4_Bill were estimated using unweighted samples of 100 respondents per process.
For the overall outpatient pathway model (G5_All), the four process-specific samples were combined into a pooled sample of 400 respondents. To better reflect the hospital’s actual outpatient process mix, post-stratification weights were applied according to the observed transaction shares of the four processes in 2020. The figures reported in
Table 1 represent annual process-level service transactions rather than counts of unique patients. This distinction is important because a single outpatient episode may involve movement across multiple service nodes, such as diagnosis and treatment, laboratory and imaging tests, medication dispensing, and billing, and the same patient may therefore contribute more than one transaction to the annual process totals. These shares were 28% for diagnosis and treatment, 15% for laboratory and imaging tests, 19% for medication dispensing, and 38% for billing. The corresponding weighted contributions were 112, 59, 75, and 154 cases, respectively. Thus, the process-level models were designed for balanced cross-process comparison, whereas the weighted pooled model was designed to approximate the overall outpatient pathway at the system level.
In addition to the survey data, semi-structured interviews were conducted to provide contextual interpretation of the quantitative results. For each process, two patients were selected based on extreme satisfaction scores, one with the highest satisfaction score and one with the lowest satisfaction score. This resulted in eight patient interviews across the four outpatient processes. The qualitative data were used to clarify process-specific experiences, especially issues related to waiting, communication, queue visibility, staff responsiveness, and perceived coordination.
2.4. Measures and Instruments
The study used structured questionnaires and semi-structured interviews to measure patient satisfaction and patient value co-creation behaviors across the four outpatient processes. The survey instruments were adapted to the outpatient service context and to the specific process being evaluated, namely diagnosis and treatment, laboratory and imaging tests, medication dispensing, and billing. All questionnaire items were measured using a 7-point response scale. The constructs, dimensions, operational meanings, item numbers, and measurement sources used in this study are summarized in
Table 2.
Patient satisfaction (SAT) was measured using a performance-based service quality approach based on SERVPERF. The scale covered five dimensions: tangibles, reliability, responsiveness, assurance, and empathy [
18,
19,
20]. The questionnaire included 22 items for each outpatient process. As summarized in
Table 2, these items were adapted to reflect process-specific service encounters, such as diagnosis and treatment, laboratory and imaging tests, medication dispensing, and billing.
Patient value co-creation was measured using the customer value co-creation behavior framework. Following Yi and Gong [
13], value co-creation was divided into two behavioral constructs: participation behavior (VCC_P) and citizenship behavior (VCC_C). Participation behavior refers to required in-role behaviors performed by patients during service delivery and includes information seeking, information sharing, responsible behavior, and personal interaction. Citizenship behavior refers to voluntary extra-role behaviors that may support the service environment and includes feedback, advocacy, helping, and tolerance [
13,
32,
33]. As shown in
Table 2, the value co-creation questionnaire included 29 items for each outpatient process.
Following the established literature, the dimensional structure of the study constructs was not newly derived in this research. Instead, the higher-level constructs were operationalized using the established dimensions reported in prior studies. Specifically, participation behavior was represented by information seeking, information sharing, responsible behavior, and personal interaction, while citizenship behavior was represented by feedback, advocacy, helping, and tolerance, following Yi and Gong [
13]. Similarly, patient satisfaction was operationalized through the established five-dimensional performance-based service quality structure of tangibles, reliability, responsiveness, assurance, and empathy [
18,
19,
20]. These literature-based dimensions were then used to represent the higher-level constructs in the PLS-SEM models.
The full questionnaire items are provided in the
Supplementary Materials.
Supplementary Material S1 presents the patient satisfaction questionnaire, and
Supplementary Material S2 presents the value co-creation questionnaire. In addition, semi-structured interview guides were developed to complement the survey results.
Supplementary Material S3 presents the interview guide for patient satisfaction, and
Supplementary Material S4 presents the interview guide for value co-creation. These interview guides were used to explore the reasons behind high and low satisfaction scores and to clarify how patients experienced participation and citizenship behaviors during outpatient service encounters.
Content Validity (IOC)
Content validity was established through Index of Item–Objective Congruence (IOC) ratings by three experts (senior nursing managers, service-quality executives, and academic specialists). Items were rated on a −1/0/+1 scale and retained when IOC ≥ 0.67. All SAT items achieved IOC = 0.94–0.95 and all VCC items IOC = 0.97 across processes; interview items reached IOC = 1.00, indicating excellent content validity.
2.5. Data Collection Procedures
Data were collected using two complementary procedures: a structured patient survey and semi-structured patient interviews. The quantitative survey was administered to patients who used one of the four focal outpatient processes, namely diagnosis and treatment, laboratory and imaging tests, medication dispensing, and billing. Data collection was conducted in 2022 at the case-study university hospital. Eligible respondents were outpatient service users who had completed or were completing the relevant service process and were able to provide informed consent. Because the study followed a process-specific quota approach rather than recruitment from a fixed sampling frame, a conventional response rate was not calculated.
For the quantitative survey, questionnaires were distributed to patients within each focal outpatient process until the target sample size of 100 valid responses per process was reached. The process-level sample, therefore, included 100 respondents for diagnosis and treatment, 100 respondents for laboratory and imaging tests, 100 respondents for medication dispensing, and 100 respondents for billing, yielding a total survey sample of 400 respondents. This process-specific quota design was used to support balanced comparison across outpatient processes. The overall pathway model was subsequently constructed from the combined sample and weighted according to the actual outpatient transaction shares reported in
Table 1.
The questionnaire package included two instruments: the patient satisfaction questionnaire and the value co-creation questionnaire. Respondents completed the version corresponding to the process they had experienced. The patient satisfaction questionnaire measured performance-based service quality dimensions, while the value co-creation questionnaire measured participation and citizenship behaviors. The full questionnaire items are provided in
Supplementary Materials S1 and S2.
Semi-structured interviews were conducted after the survey to provide contextual interpretation of the quantitative findings. For each outpatient process, two interviewees were selected based on extreme satisfaction scores, one with the highest satisfaction score and one with the lowest satisfaction score. This resulted in eight patient interviews across the four outpatient processes. The interviews explored reasons for satisfaction and dissatisfaction, perceptions of waiting and communication, experiences with staff responsiveness, and patient participation and citizenship behaviors during outpatient service encounters. The interview guides are provided in
Supplementary Materials S3 and S4.
The qualitative data were analyzed using content analysis. Responses were reviewed and grouped into recurring themes related to waiting time, queue visibility, communication, staff responsiveness, empathy, service transparency, and patient engagement. These qualitative findings were used to complement the survey results and to clarify process-specific interpretations, particularly where satisfaction levels differed across outpatient processes.
2.6. Data Analysis Strategy (PLS-SEM)
Data analysis was conducted using IBM SPSS 28 for preliminary statistical analysis and SmartPLS 4 for PLS-SEM estimation. The analysis proceeded in five stages: preliminary data screening, measurement model assessment, structural model assessment, multi-group analysis, and qualitative content analysis.
First, descriptive statistics were used to summarize respondent characteristics and construct scores across the four outpatient processes. The normality of SAT, VCC_P, and VCC_C was assessed using the Shapiro–Wilk test. Because the distributions of the main constructs were non-normal, Kruskal–Wallis tests were used to compare construct levels across outpatient processes, followed by Bonferroni-adjusted pairwise comparisons where appropriate.
Partial Least Squares Structural Equation Modeling (PLS-SEM) was selected as the primary analytical method because the study aimed to explain and compare patient satisfaction across process-specific outpatient models rather than to evaluate global covariance-based model fit. PLS-SEM is suitable for explanation and prediction-oriented research, performs well with non-normal data, and is appropriate for process-specific subgroup analysis with moderate sample sizes [
28,
29]. This was suitable for the present study because each process-level model included 100 respondents, and the analysis focused on comparing relative path strength, explanatory importance, and process-level stability across multiple outpatient processes. SmartPLS 4 was used for model estimation [
31].
The measurement model was assessed before the structural model. SAT, VCC_P, and VCC_C were specified as reflective latent constructs using established dimension-level indicators from the SERVPERF and customer value co-creation literature. SAT was represented by tangibles, reliability, responsiveness, assurance, and empathy. VCC_P was represented by information seeking, information sharing, responsible behavior, and personal interaction, while VCC_C was represented by feedback, advocacy, helping, and tolerance. The higher-level constructs were specified on the basis of established literature rather than newly derived dimensional structures. Accordingly, the dimension-level composite scores corresponding to the SERVPERF and customer value co-creation subdimensions were used as indicators of SAT, VCC_P, and VCC_C in the PLS-SEM models.
Internal consistency reliability was assessed using Cronbach’s alpha and composite reliability, with values of 0.70 or higher considered acceptable [
29]. Convergent validity was assessed using average variance extracted (AVE), with values of 0.50 or higher indicating adequate convergence [
29]. Discriminant validity was evaluated using the heterotrait–monotrait ratio (HTMT), with values below 0.90 considered acceptable for distinguishing related constructs [
30]. Cross-loadings were also examined to confirm that each indicator loaded more strongly on its intended construct than on other constructs. These measurement model results were assessed before interpreting the structural model.
The structural model was then evaluated using bootstrapping with 5000 resamples. All structural paths and indirect effects were tested using two-tailed significance tests at the 0.05 level. The analysis reported path coefficients, t-statistics,
p-values, R
2, f
2, and Q
2. R
2 was used to assess explanatory power, f
2 was used to evaluate effect size, and Q
2 was used to assess predictive relevance [
28,
29]. The mediation hypothesis was tested using the bootstrapped indirect effect of VCC_C on SAT through VCC_P. Although the hypotheses were directionally formulated based on prior theory, all structural paths and indirect effects were evaluated using two-tailed bootstrapping tests at the 0.05 significance level. Because H2 specifies a mediation relationship, the VCC_P → SAT path was estimated and reported as a component of the indirect pathway rather than as a separate hypothesis.
To examine whether the structural relationships differed across outpatient processes, multi-group analysis (MGA) was conducted in SmartPLS. The MGA compared the path coefficients for VCC_C → SAT, VCC_C → VCC_P, and VCC_P → SAT across the four process-specific models. It also compared the specific indirect effect of VCC_C → VCC_P → SAT across processes. This analysis was used to test whether the associations among citizenship behavior, participation behavior, and satisfaction varied across diagnosis and treatment, laboratory and imaging tests, medication dispensing, and billing.
Finally, qualitative interview data were analyzed using content analysis. Interview responses were reviewed and grouped into recurring themes related to waiting time, queue visibility, communication, staff responsiveness, empathy, service transparency, and patient engagement. The qualitative findings were used to complement and contextualize the quantitative results, particularly in explaining process-level differences in satisfaction and interpreting the operational meaning of the PLS-SEM and IPMA findings.
2.7. Indicator Importance–Performance Map Analysis (IPMA)
Importance–Performance Map Analysis (IPMA) was conducted to translate the PLS-SEM results into process-level improvement priorities [
38]. IPMA was applied with patient satisfaction (SAT) as the target construct. In this study, IPMA was used as a managerial prioritization tool to identify which patient value co-creation behaviors had relatively high explanatory importance for satisfaction but comparatively lower performance. The analysis was not intended to replace direct operational diagnosis using objective logistics indicators such as actual waiting time, throughput, queue length, or handoff delay. Rather, it was used to support interpretation of perceived outpatient process performance from the patient perspective.
In IPMA, importance refers to the total effect estimate of each construct or indicator on the target construct, SAT, whereas performance refers to the average score of each construct or indicator, rescaled to a 0 to 100 metric [
38]. Because the questionnaire used a 7-point response scale, performance values were interpreted after rescaling the observed scores from the original response range to a 0 to 100 scale. Higher performance values indicate more favorable patient evaluations of the corresponding construct or indicator. The IPMA procedure was implemented in SmartPLS 4, following the PLS-SEM results for each process-specific model and the overall pooled model [
28,
29,
31].
IPMA was conducted at two levels. At the construct level, the analysis compared the importance and performance of participation behavior (VCC_P) and citizenship behavior (VCC_C) for patient satisfaction. At the indicator level, the analysis examined the dimensions of the two value co-creation constructs. Participation behavior indicators included information seeking (ISK), information sharing (ISH), responsible behavior (RSP), and personal interaction (PIT). Citizenship behavior indicators included feedback (FDB), advocacy (AVC), helping (HEP), and tolerance (TLR). This indicator-level analysis was used to identify more specific patient-side behavioral priorities for outpatient process improvement.
The IPMA was replicated for each outpatient process, namely diagnosis and treatment (G1_Diag), laboratory and imaging tests (G2_Test), medication dispensing (G3_Disp), and billing (G4_Bill), as well as for the overall outpatient pathway model (G5_All). The process-specific maps allow comparison of improvement priorities across different outpatient service nodes, while the pooled model provides a system-level view of the overall outpatient pathway.
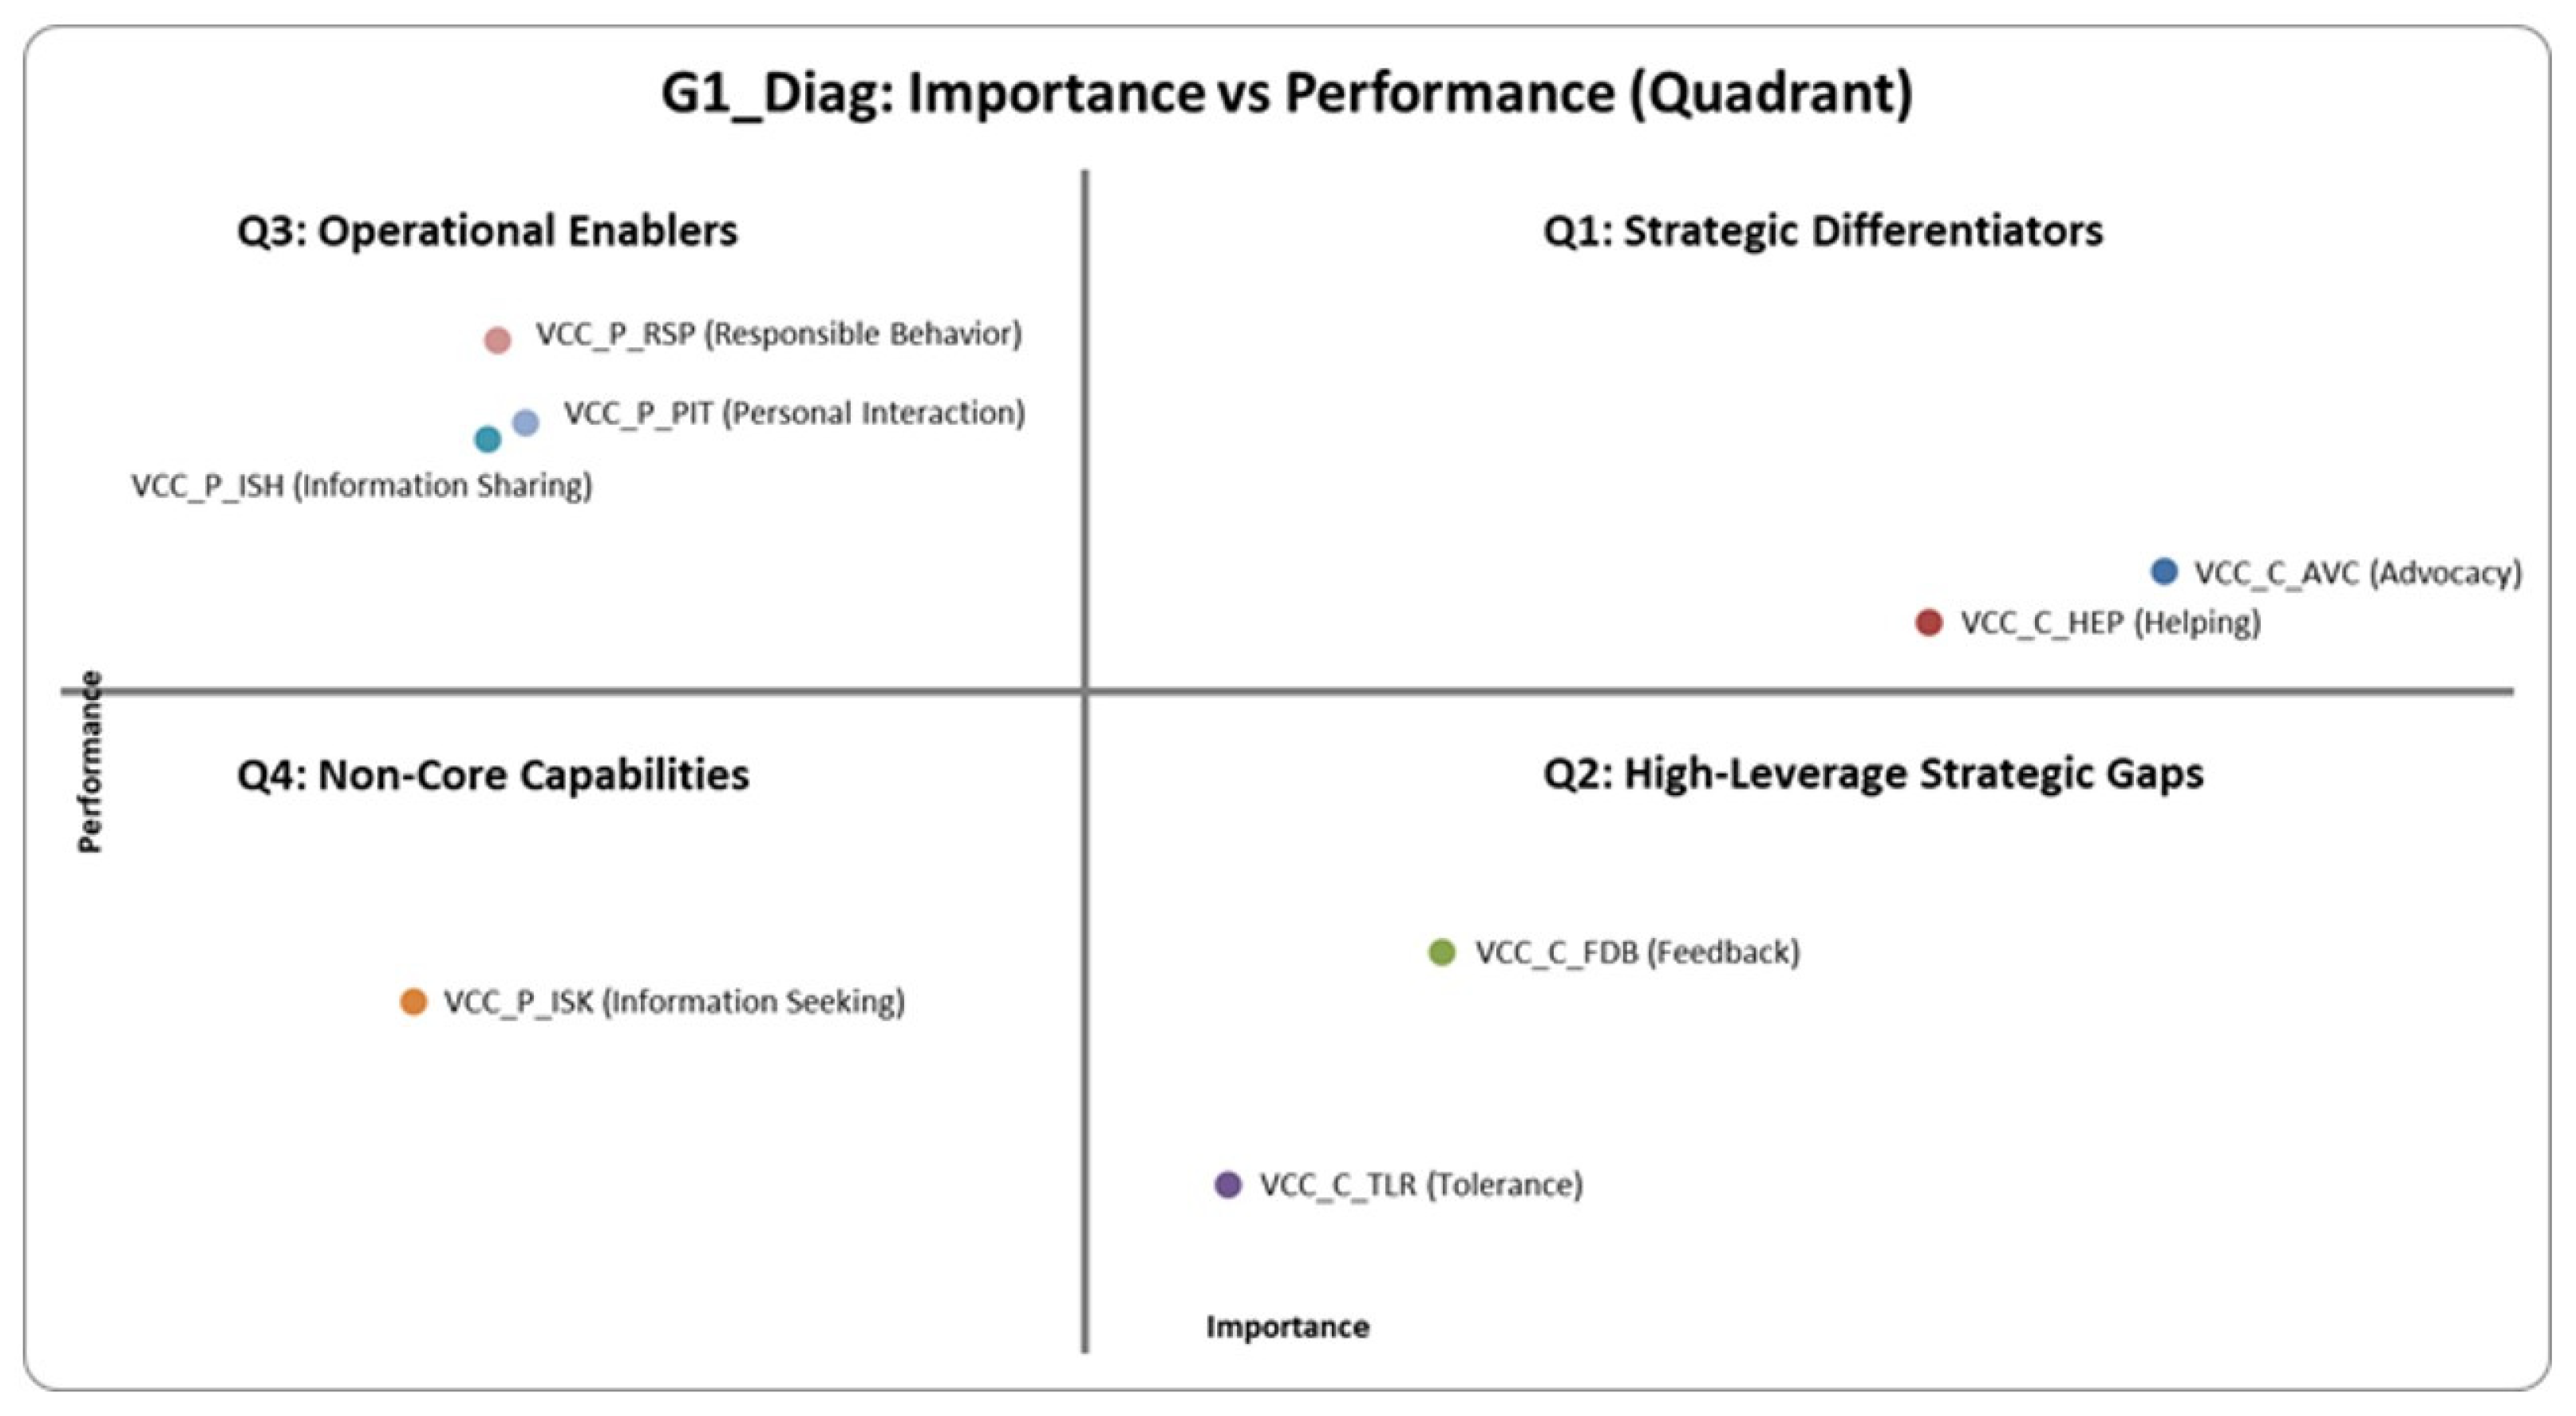
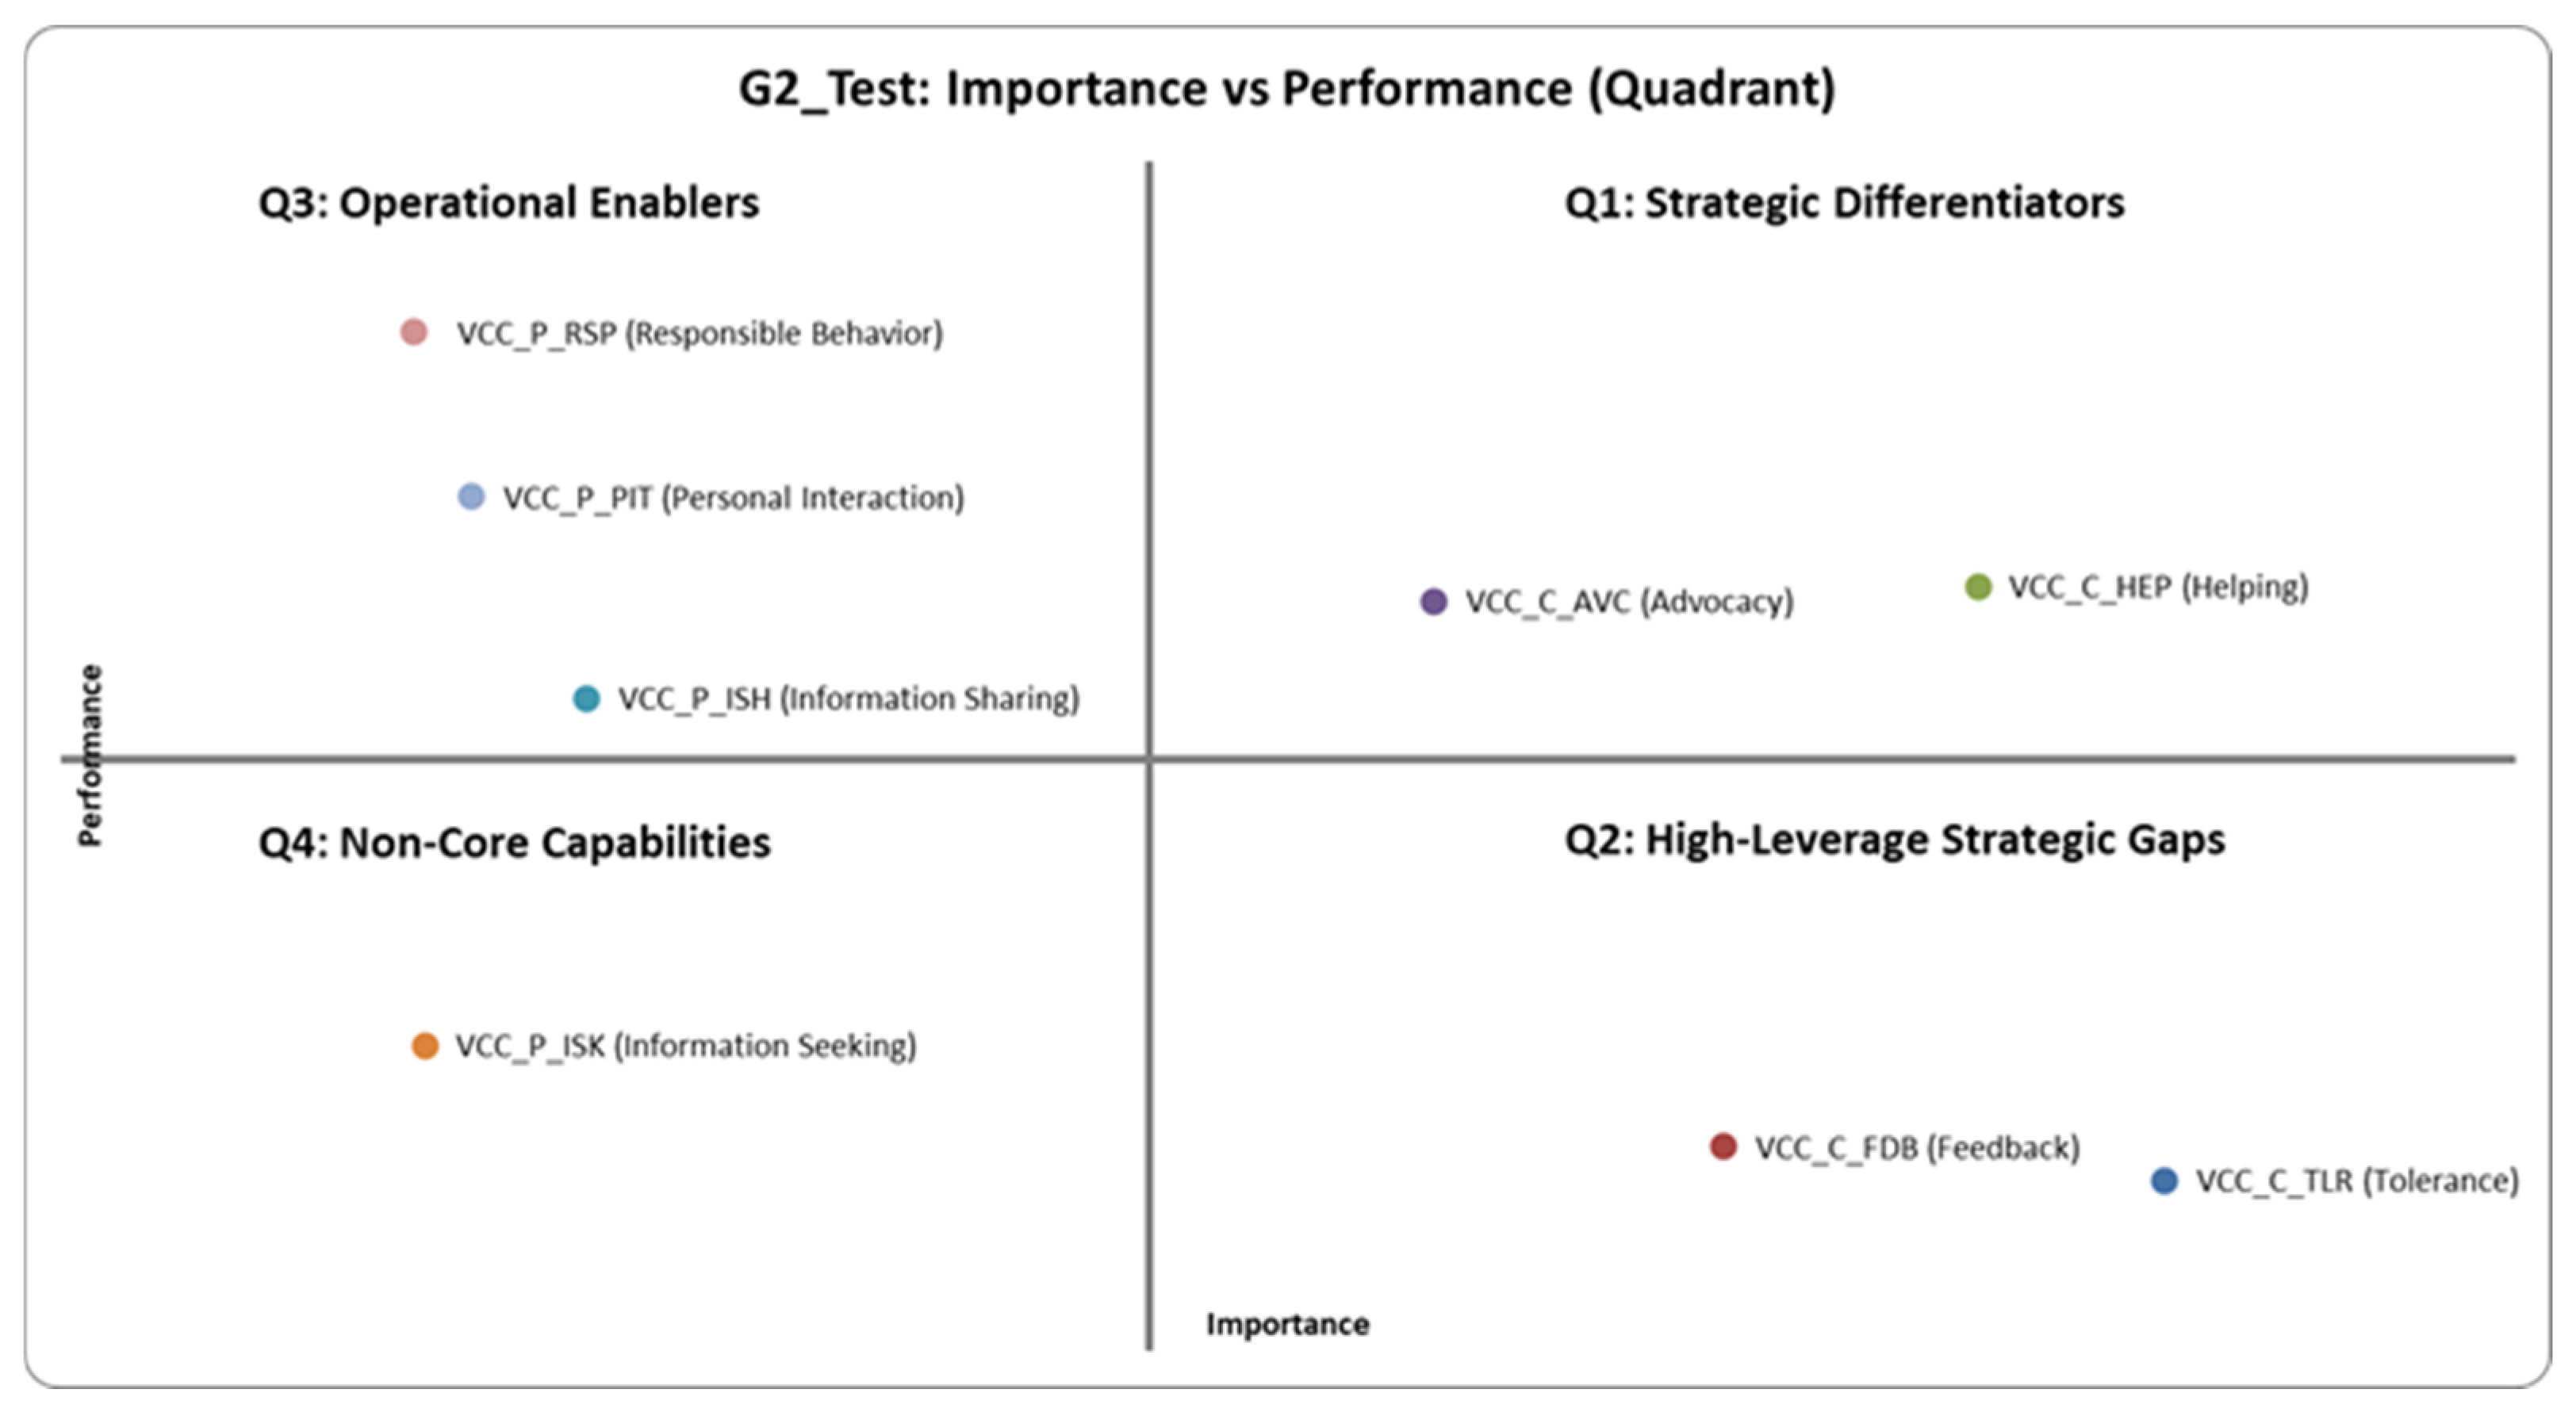
For visual interpretation, the IPMA results were presented as quadrant maps. The horizontal axis represents importance, and the vertical axis represents performance. The quadrant classification was used as a practical heuristic for prioritization. Indicators with high importance and high performance were interpreted as strengths to maintain. Indicators with high importance but lower performance were interpreted as priority areas for improvement. Indicators with lower importance but high performance were interpreted as supportive capabilities, while indicators with lower importance and lower performance were interpreted as lower-priority capabilities. The quadrant interpretation was linked back to the service blueprint to identify where improvements in queue visibility, feedback capture, handoff coordination, and process transparency could support perceived outpatient process performance.
3. Results
This section reports the empirical results in a way that supports process-level outpatient service improvement. The four outpatient processes (diagnosis and treatment, laboratory and imaging tests, medication dispensing, and billing) represent interconnected service nodes where patient flow and information flow are coordinated through multiple service handoffs. In this study, patient satisfaction is treated as an indicator of perceived outpatient process performance.
3.1. Sample Description and Preliminary Analyses
Across the four outpatient processes, namely diagnosis and treatment (G1_Diag), laboratory and imaging tests (G2_Test), medication dispensing (G3_Disp), and billing (G4_Bill), together with the overall pooled model (G5_All), the respondent profile is summarized in
Table 3. The pooled sample included 400 outpatient respondents. Process-level age, gender, and insurance profiles are reported in
Appendix A Table A1,
Table A2 and
Table A3.
Preliminary normality testing was conducted using the Shapiro–Wilk test. The results indicated that SAT, VCC_P, and VCC_C were not normally distributed across the process-specific models and the overall pooled model, with all p-values below 0.001. Therefore, non-parametric tests were used to compare construct levels across outpatient processes.
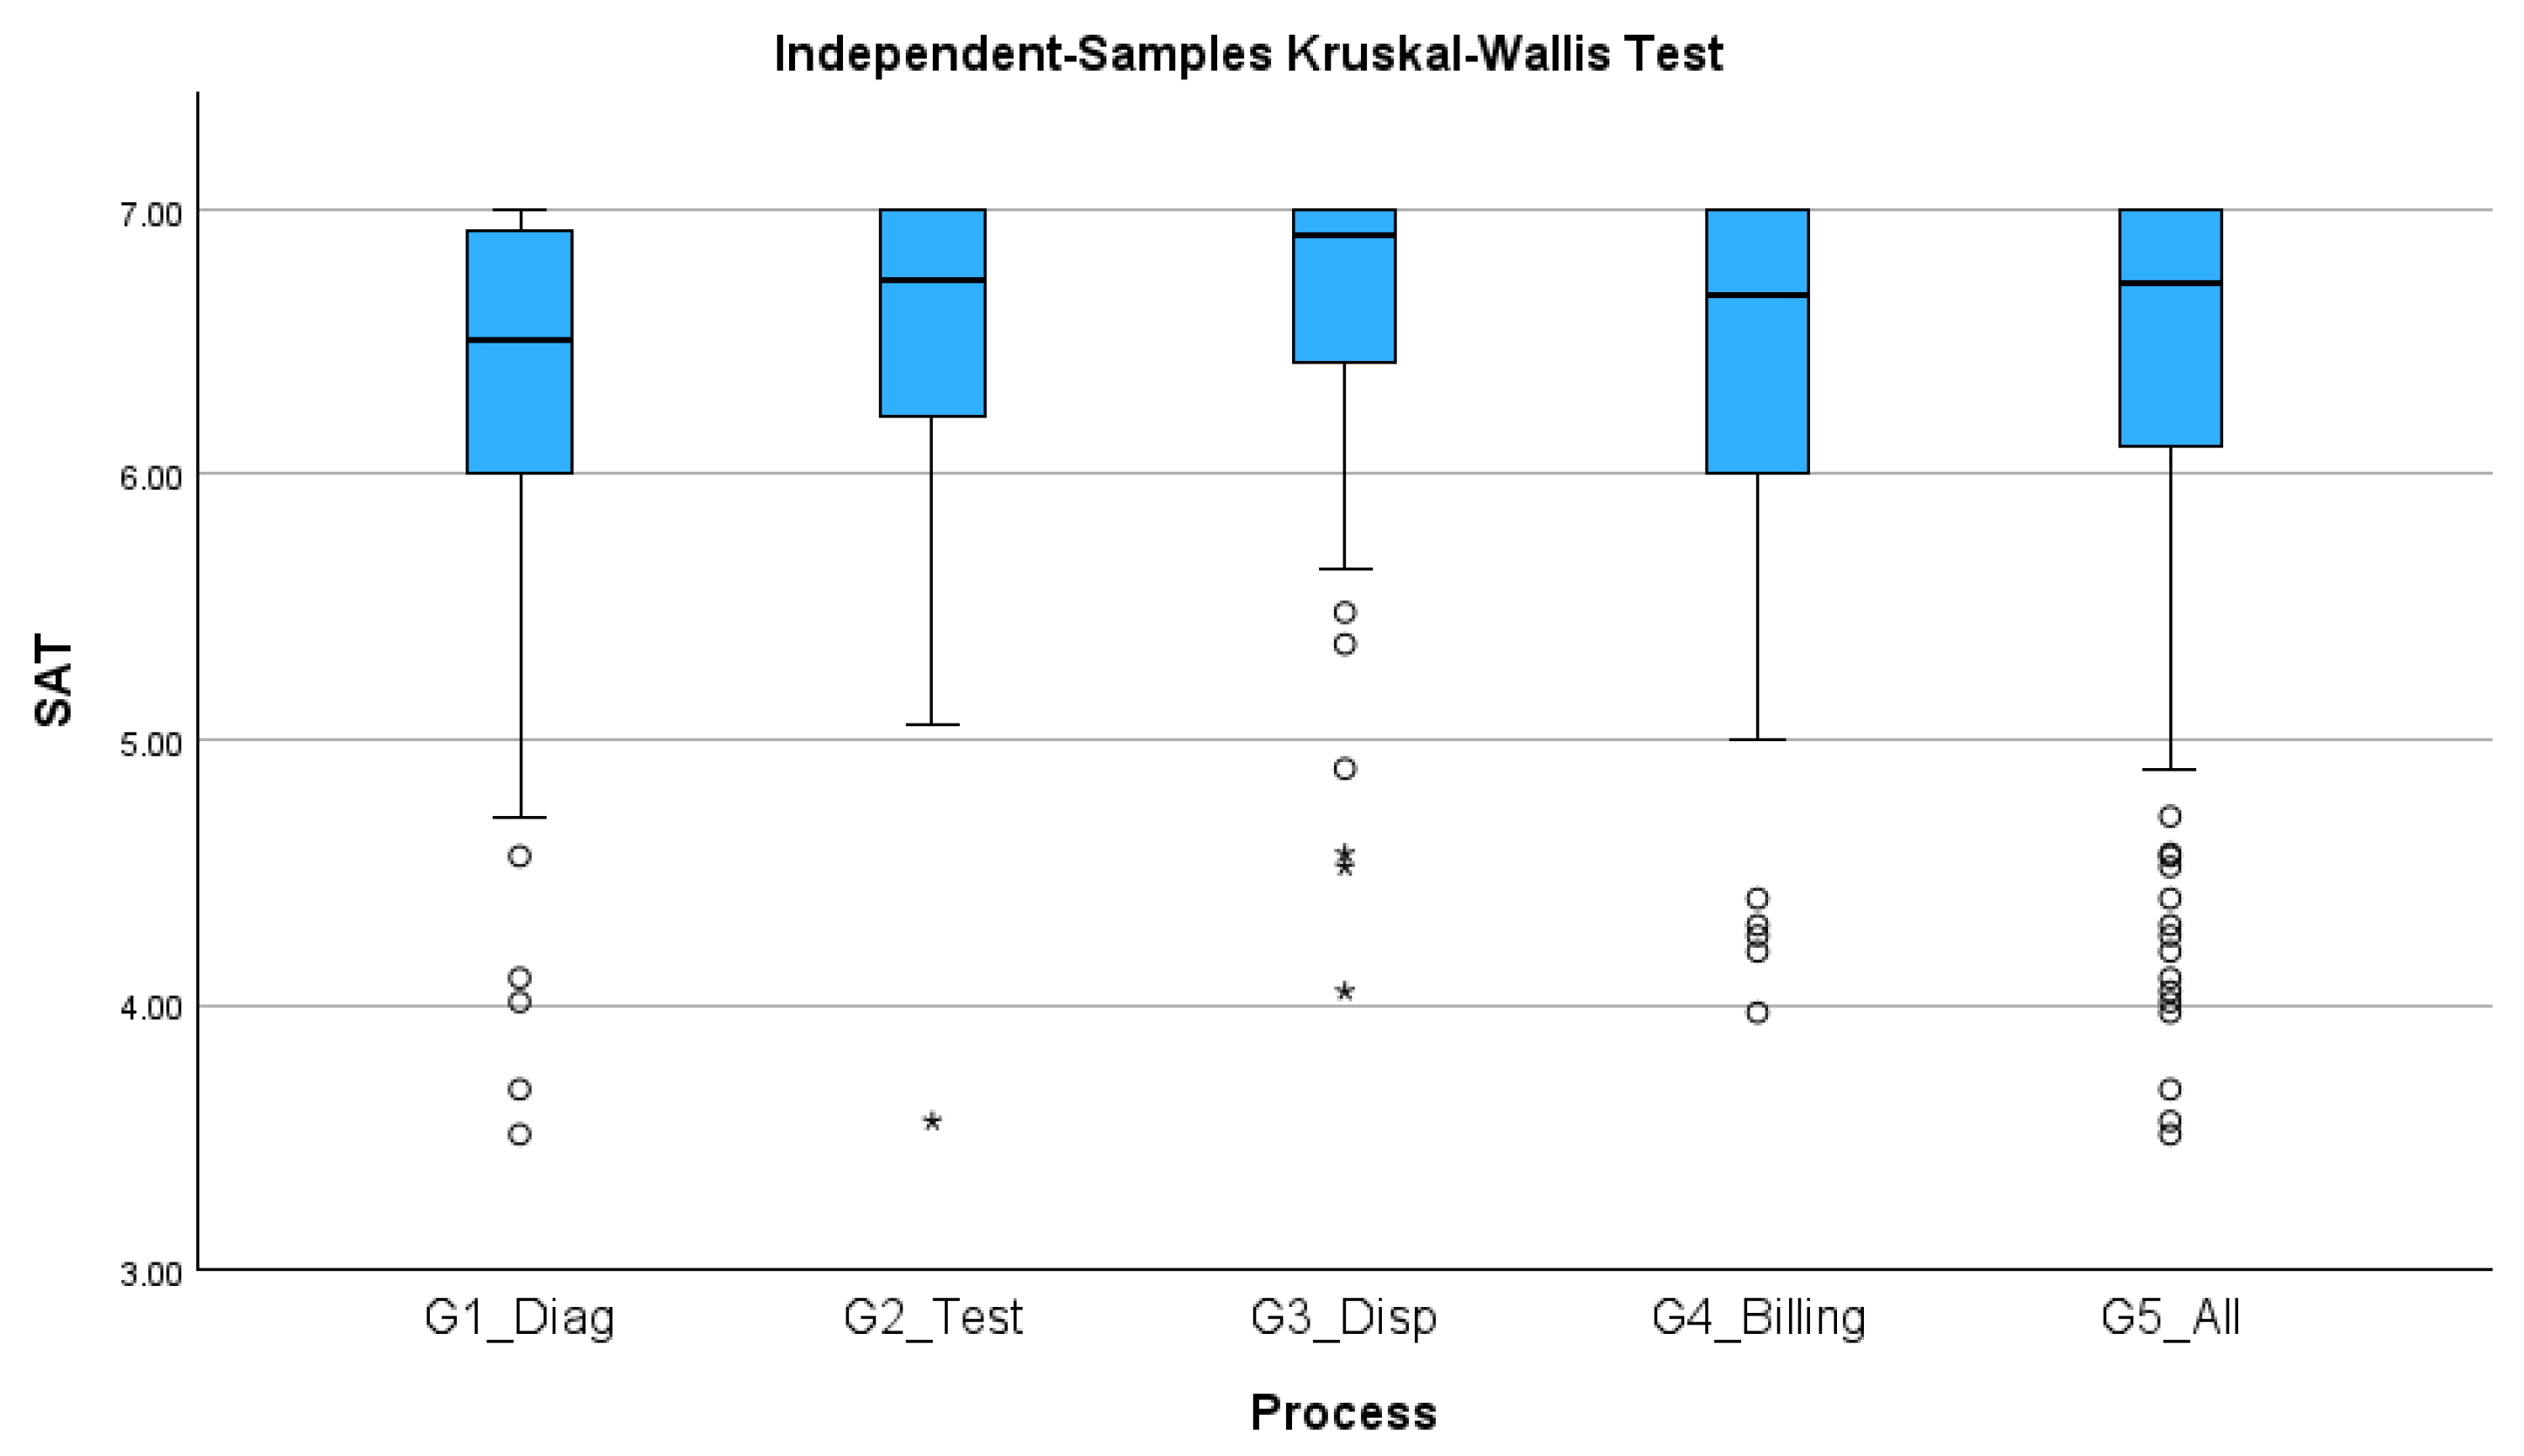
A Kruskal–Wallis test was conducted to compare patient satisfaction (SAT), participation behavior (VCC_P), and citizenship behavior (VCC_C) across processes. The results showed a statistically significant difference in SAT across processes (H = 10.808, df = 4, p = 0.029). In contrast, no statistically significant differences were found for VCC_P (H = 0.048, df = 4, p = 1.000) or VCC_C (H = 0.905, df = 4, p = 0.924). These findings indicate that patient’s reported participation and citizenship behavior levels were broadly similar across outpatient processes, whereas satisfaction levels varied by process.
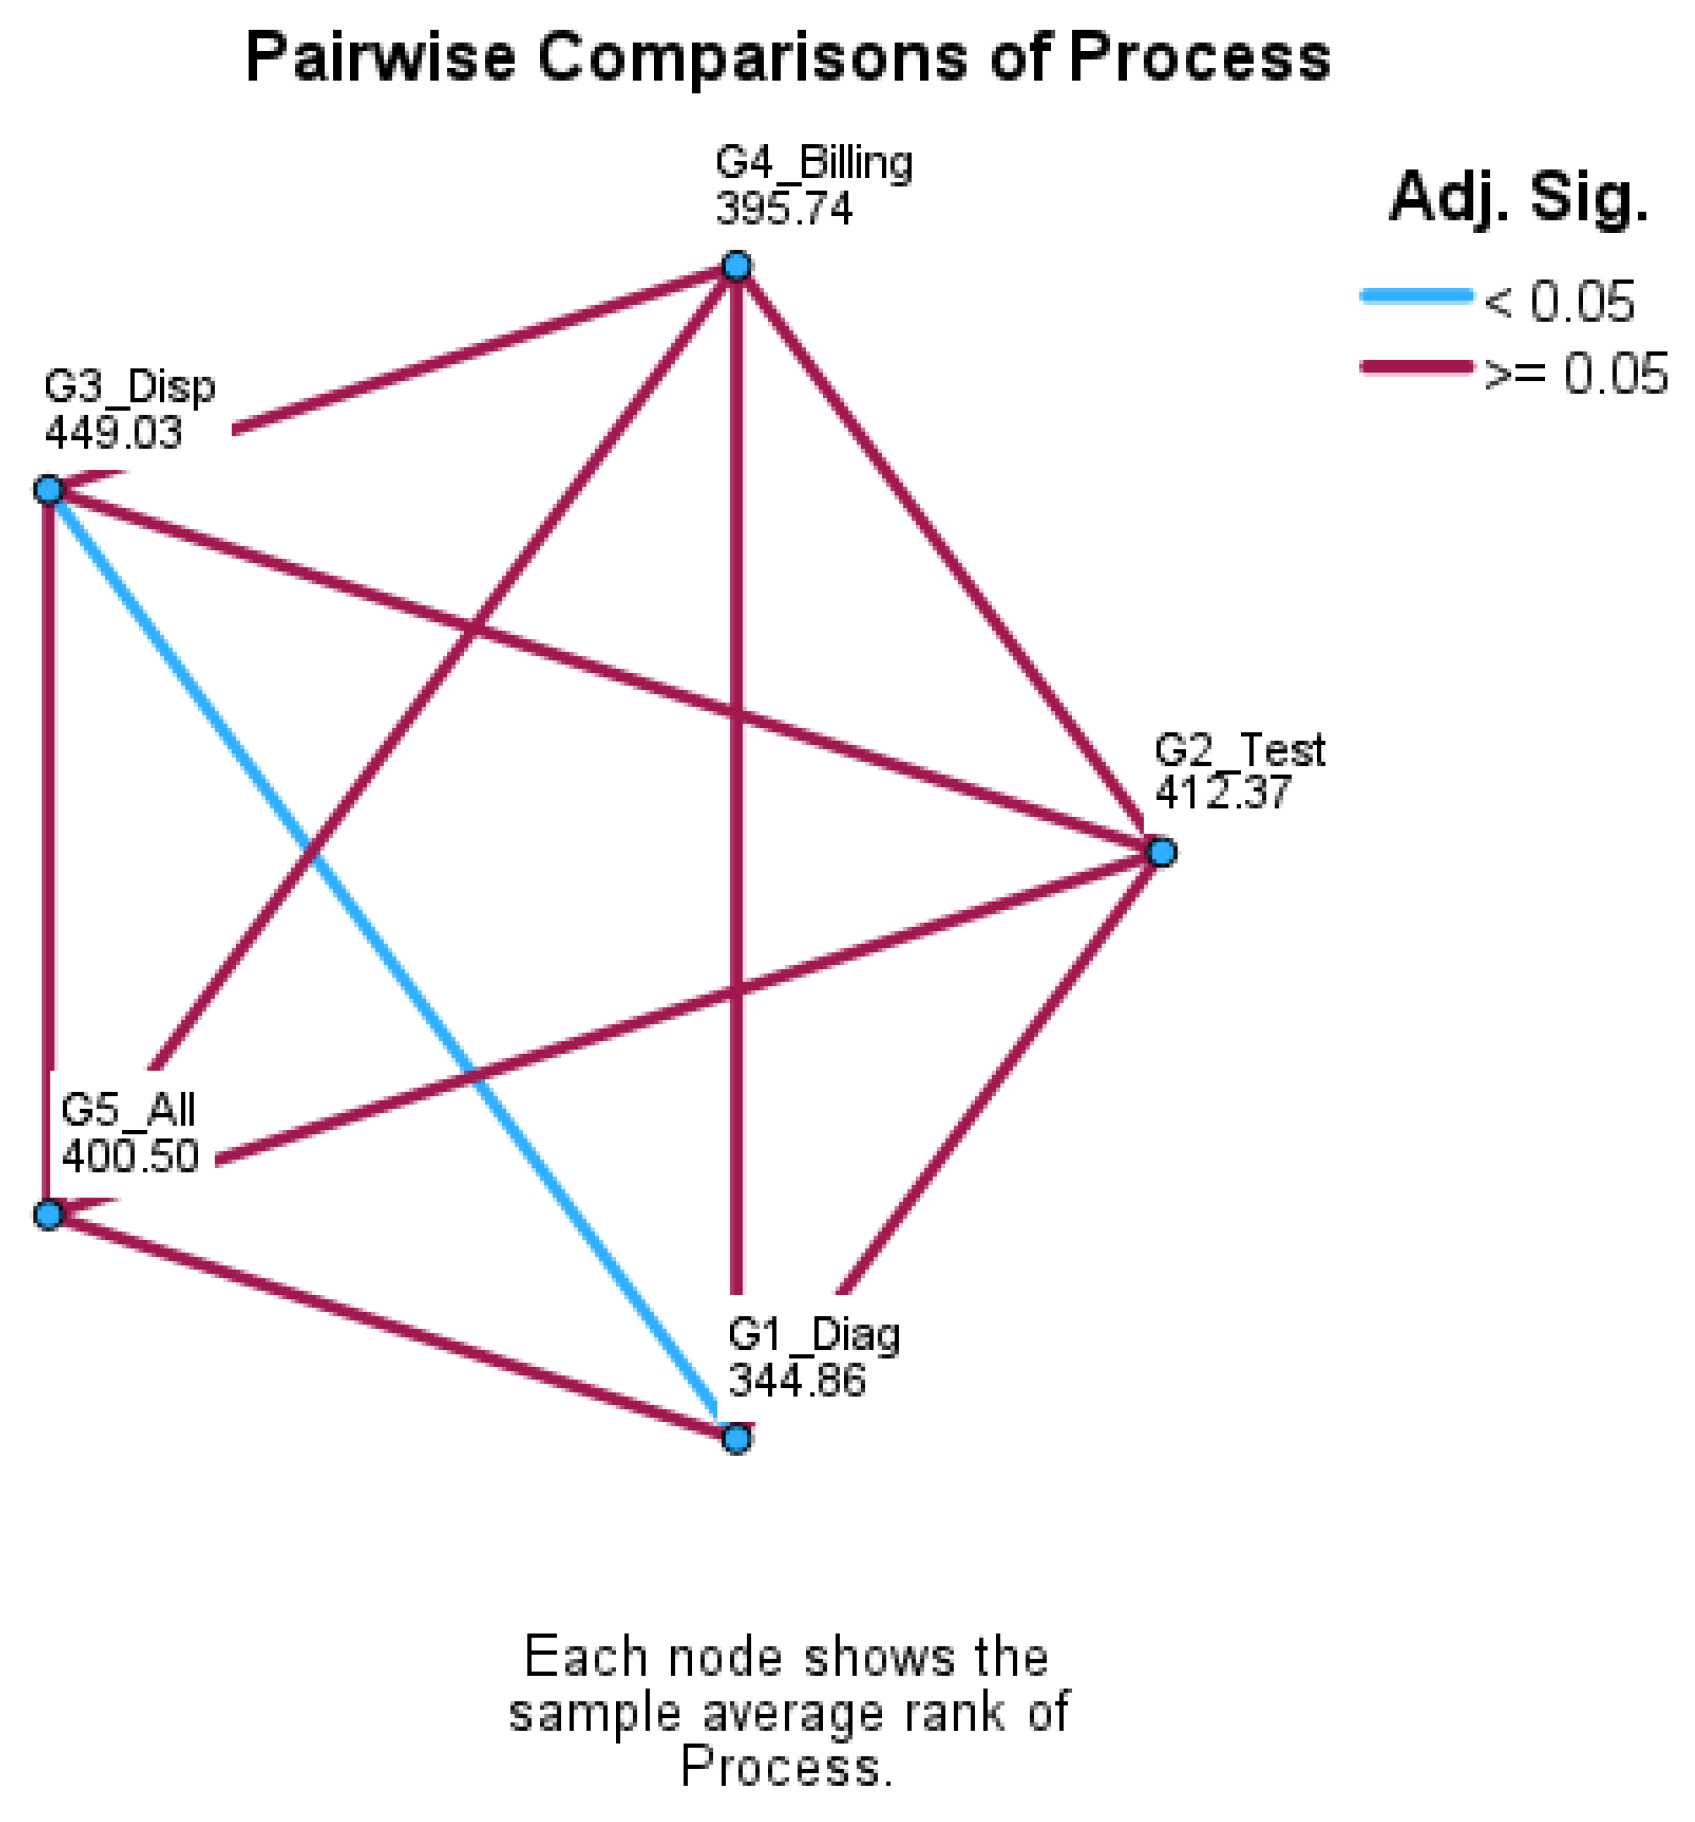
Because the omnibus Kruskal–Wallis test for SAT was significant, Bonferroni-adjusted pairwise comparisons were conducted. The pairwise results showed one statistically significant difference: SAT in diagnosis and treatment (G1_Diag) was significantly lower than SAT in medication dispensing (G3_Disp), with a standardized test statistic of −3.232 and an adjusted p-value of 0.012. No other pairwise comparison reached statistical significance after adjustment.
This result suggests that patients evaluated the medication dispensing process more favorably than the diagnosis and treatment process. This level difference is consistent with the operational context shown in the service blueprint. In the medication dispensing process, electronic prescription through CPOE, upstream medication preparation, and digital queue visibility may reduce uncertainty and perceived waiting. In contrast, the diagnosis and treatment process relies more heavily on manual queue calling in clinical rooms, which may provide less real-time visibility of patients’ queue position. However, these operational features were not modeled as independent explanatory variables. Therefore, they are interpreted as process-based contextual explanations rather than directly tested causal factors.
Overall, the preliminary analyses show an important distinction. Patient value co-creation behavior levels, represented by VCC_P and VCC_C, did not significantly differ across processes, but patient satisfaction did. This distinction supports the process-level interpretation of the study: the behavioral constructs appear stable across outpatient processes, while perceived satisfaction levels are shaped by process-specific operational conditions such as queue visibility, workflow standardization, communication, and handoff transparency.
3.2. Measurement Model Assessment
The measurement model was assessed before the structural model to ensure that the constructs were reliable and valid for subsequent hypothesis testing. The analysis evaluated internal consistency reliability, convergent validity, and discriminant validity for patient satisfaction (SAT), patient participation behavior (VCC_P), and patient citizenship behavior (VCC_C) across the four process-specific models and the overall pooled model.
SAT, VCC_P, and VCC_C were assessed using dimension-level indicators. SAT was represented by five SERVPERF dimensions, namely tangibles, reliability, responsiveness, assurance, and empathy. VCC_P was represented by four participation behavior dimensions, namely information seeking, information sharing, responsible behavior, and personal interaction. VCC_C was represented by four citizenship behavior dimensions, namely feedback, advocacy, helping, and tolerance. This approach allowed the analysis to evaluate the higher-order behavioral constructs using the validated dimension-level scores derived from the questionnaire items.
Internal consistency reliability was evaluated using Cronbach’s alpha and composite reliability. As shown in
Table 4, all constructs exceeded the recommended threshold of 0.70 across the process-specific models and the overall pooled model [
29]. Cronbach’s alpha ranged from 0.749 to 0.947, and composite reliability ranged from 0.841 to 0.960. These results indicate acceptable to excellent internal consistency for SAT, VCC_P, and VCC_C across all models.
Convergent validity was assessed using average variance extracted (AVE). All AVE values exceeded the recommended threshold of 0.50 [
29]. AVE values ranged from 0.729 to 0.826 for SAT, from 0.625 to 0.754 for VCC_P, and from 0.572 to 0.692 for VCC_C. These results indicate that the dimension-level indicators explained sufficient variance in their respective constructs.
Discriminant validity was evaluated using cross-loadings and the heterotrait–monotrait ratio (HTMT) [
30]. The cross-loading results showed that most indicators loaded more strongly on their intended constructs than on other constructs. HTMT values also supported discriminant validity for most construct pairs. However, two elevated HTMT values were observed, namely between VCC_C and VCC_P in G3_Disp (HTMT = 0.963) and between SAT and VCC_C in G4_Bill (HTMT = 0.911). These values indicate potential discriminant validity concerns in these process-specific models. Therefore, the corresponding structural relationships were interpreted cautiously.
Overall, the measurement model results provide sufficient evidence that SAT, VCC_P, and VCC_C were measured with acceptable reliability and validity across the process-specific and pooled models. The higher-order behavioral constructs, VCC_P and VCC_C, demonstrated acceptable reliability and convergent validity, supporting their use in the subsequent structural model analysis.
3.3. Structural Model and Mediation
The structural model was evaluated using bootstrapping with 5000 resamples. All direct paths and indirect effects were tested using two-tailed significance tests at the 0.05 level. The results are summarized in
Table 5.
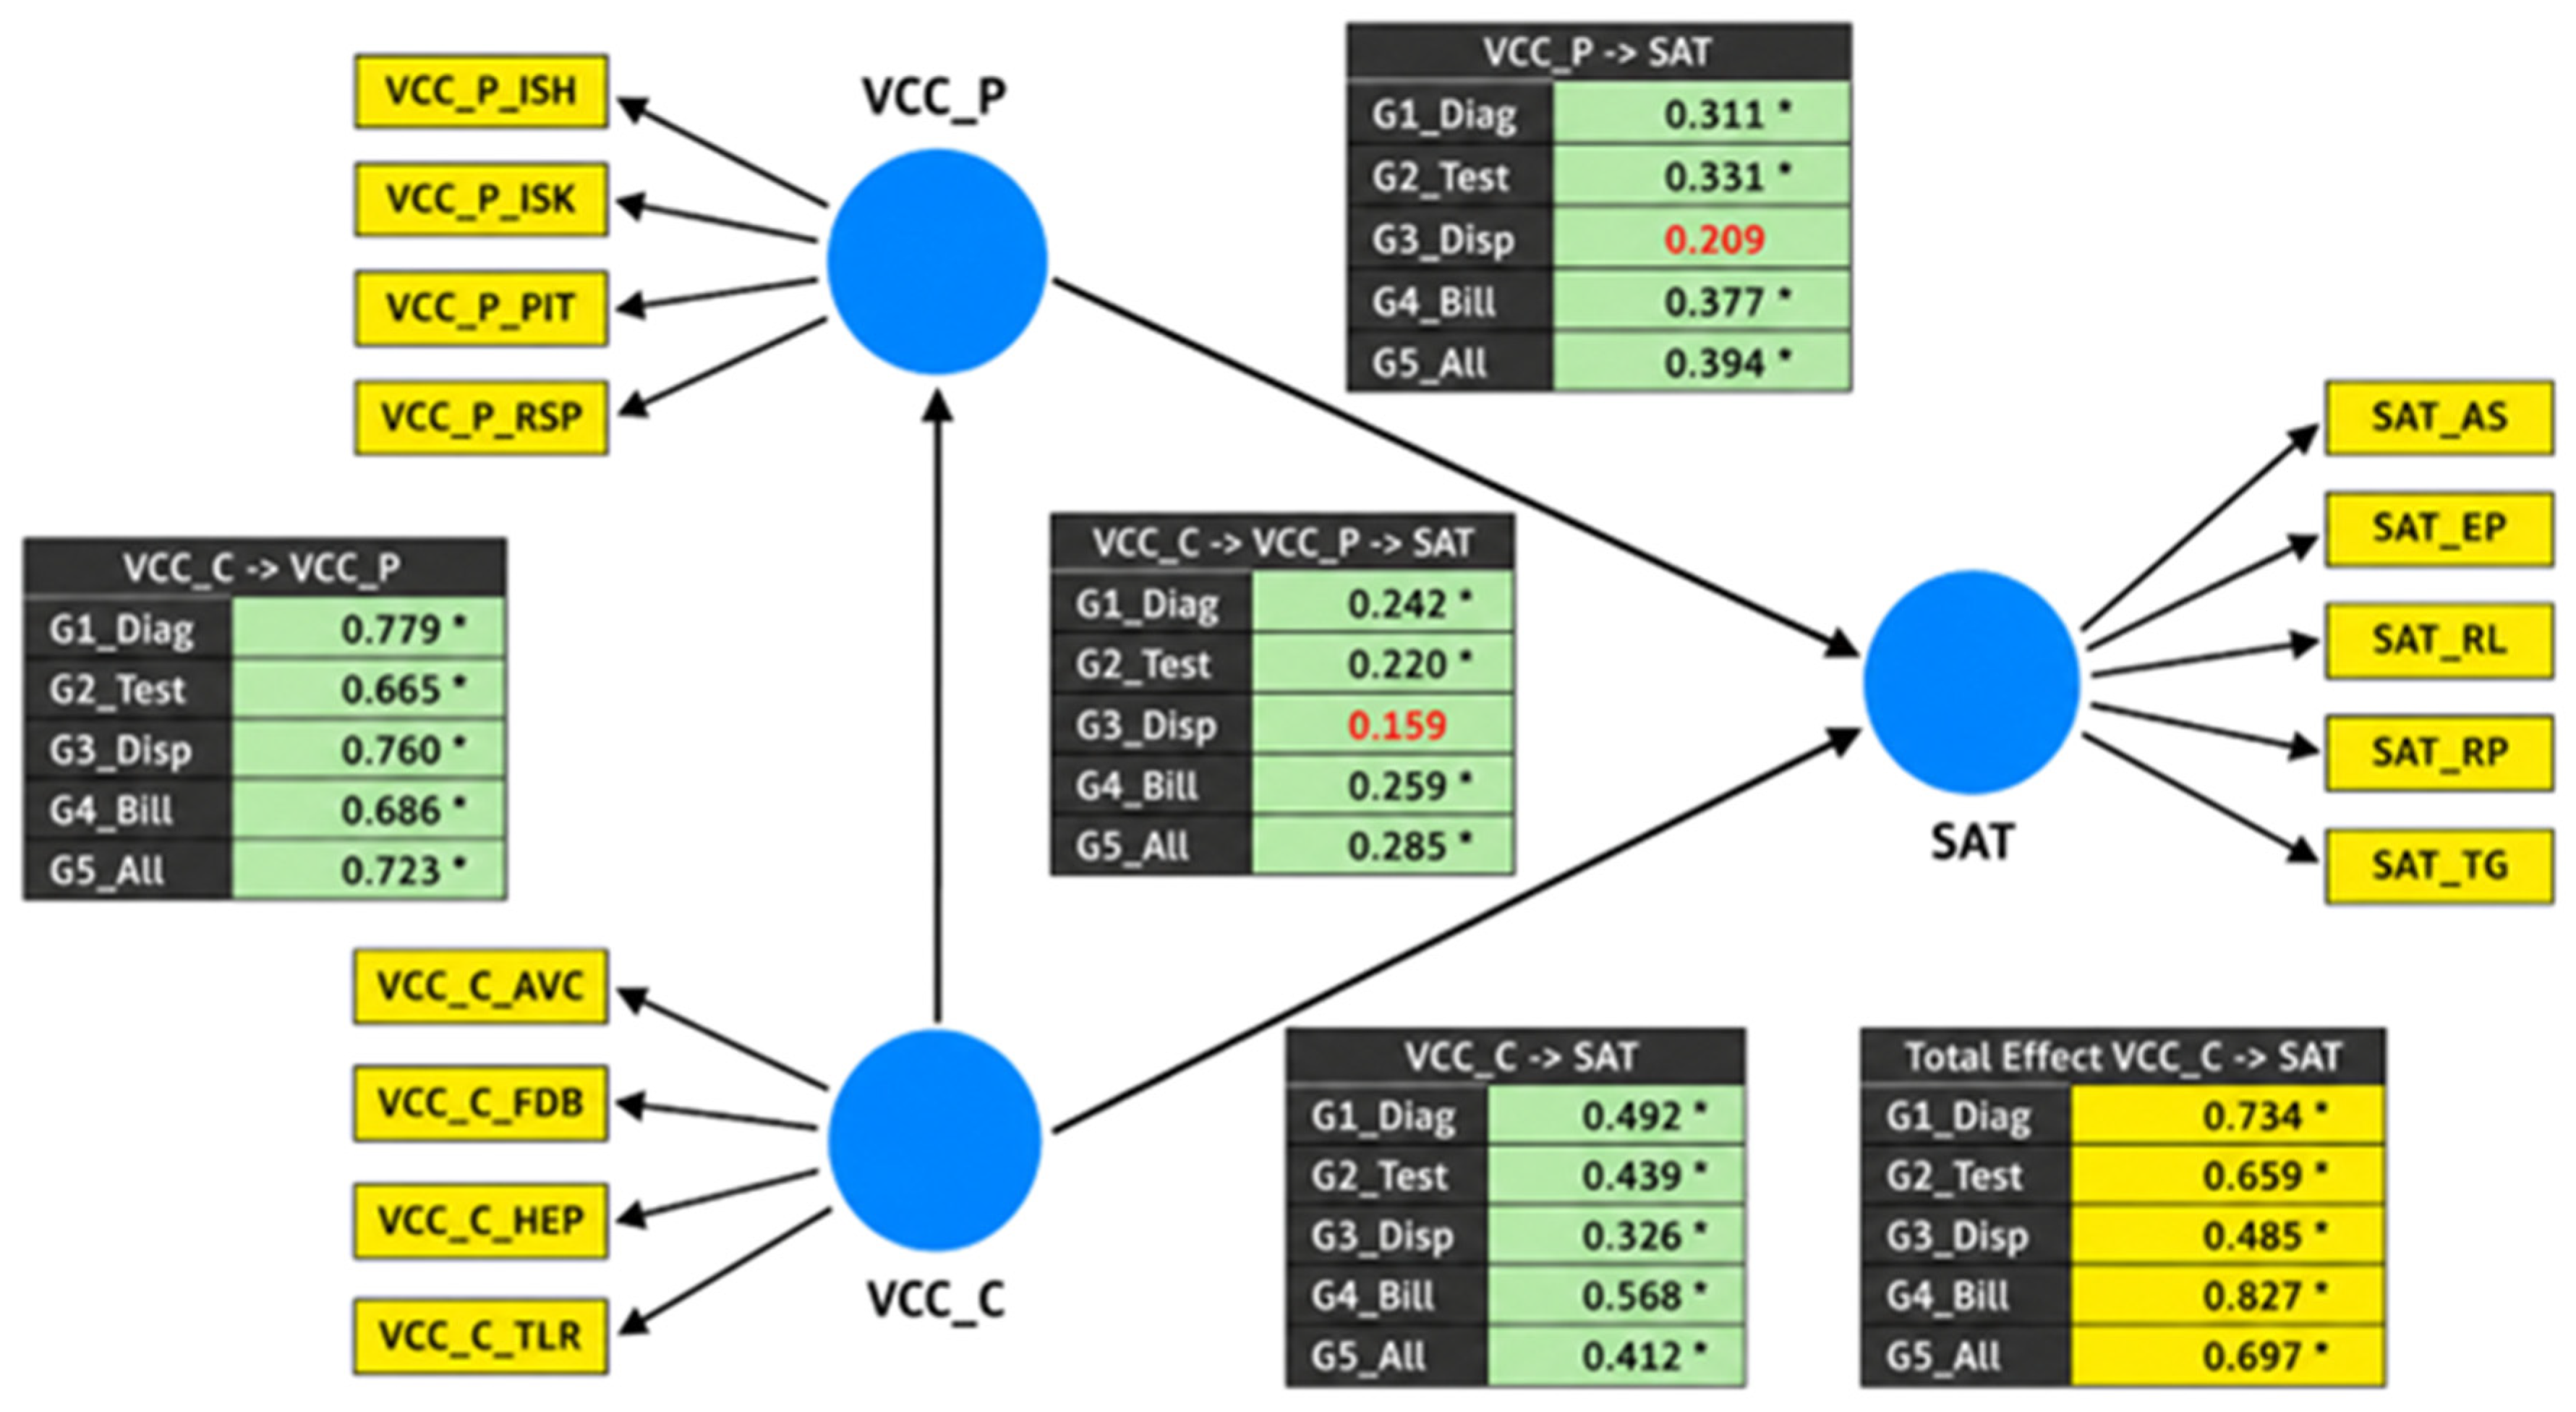
The results showed that patient citizenship behavior (VCC_C) was positively associated with patient satisfaction (SAT) across all process-specific models and the overall pooled model. The VCC_C → SAT path was significant in diagnosis and treatment (G1_Diag: β = 0.492, p = 0.002), laboratory and imaging tests (G2_Test: β = 0.439, p < 0.001), medication dispensing (G3_Disp: β = 0.326, p = 0.021), billing (G4_Bill: β = 0.568, p < 0.001), and the overall outpatient pathway model (G5_All: β = 0.412, p < 0.001). These results support H1 across all models.
The VCC_C → VCC_P path was also positive and significant across all models. The path coefficients ranged from β = 0.665 to β = 0.779 in the four process-specific models and was β = 0.723 in the overall pooled model. These findings support H3 and indicate that patients who reported stronger citizenship behaviors also tended to report stronger participation behaviors.
The VCC_P → SAT path was estimated as a component path required for testing the mediation hypothesis H2. This path was positive and significant in diagnosis and treatment (G1_Diag: β = 0.311, p = 0.039), laboratory and imaging tests (G2_Test: β = 0.331, p = 0.023), billing (G4_Bill: β = 0.377, p = 0.001), and the overall pooled model (G5_All: β = 0.394, p < 0.001). However, it was not statistically significant in medication dispensing (G3_Disp: β = 0.209, p = 0.169). This suggests that participation behavior was associated with satisfaction in most outpatient processes, but its explanatory contribution was weaker in the medication dispensing process.
The mediation hypothesis H2 was tested using the bootstrapped indirect effect of VCC_C on SAT through VCC_P. The results are shown in
Table 6. The indirect effect was statistically significant in laboratory and imaging tests (G2_Test: β = 0.220,
p = 0.033), billing (G4_Bill: β = 0.259,
p = 0.002), and the overall pooled model (G5_All: β = 0.285,
p < 0.001). In diagnosis and treatment, the indirect effect was close to the 0.05 threshold but did not reach statistical significance under the two-tailed criterion (G1_Diag: β = 0.242,
p = 0.055). In medication dispensing, the indirect effect was not significant (G3_Disp: β = 0.159,
p = 0.179). Therefore, H2 is partially supported. The mediation pattern was supported in G2_Test, G4_Bill, and G5_All, but not supported at the 0.05 two-tailed level in G1_Diag and G3_Disp.
These results suggest that participation behavior functions as a mediating pathway in several outpatient processes, but not uniformly across all processes. The non-significant mediation in medication dispensing is consistent with the non-significant VCC_P → SAT component path in that process. This pattern should be interpreted cautiously because the study is cross-sectional and the operational characteristics of dispensing, such as workflow standardization and digital queue visibility, were used for contextual interpretation rather than directly modeled as explanatory variables.
In summary, H1 was supported across all process-specific models and the overall pooled model, as VCC_C was positively associated with SAT in all models. H3 was also supported across all models, as VCC_C was positively associated with VCC_P in every outpatient process and in the overall pooled model. H2 was partially supported. The indirect pathway VCC_C → VCC_P → SAT was significant in G2_Test, G4_Bill, and G5_All, but it was not statistically significant at the 0.05 two-tailed level in G1_Diag and G3_Disp.
Model quality indices were satisfactory. In the pooled model (
Table 7), R
2 (SAT) = 0.559 and R
2 (VCC_P) = 0.523, with Q
2 values > 0 indicating predictive relevance. Process-level R
2, Q
2, and f
2 results are reported in
Appendix C Table A6,
Table A7 and
Table A8.
3.4. Multi-Group Analysis (MGA)
The MGA results were used to evaluate H4, H5, and H6, as shown in
Table 8. Detailed pairwise MGA comparisons for the direct paths and the specific indirect effect are reported in
Appendix D Table A9 and
Table A10. H4 proposed that the association between patient citizenship behavior (VCC_C) and patient satisfaction (SAT) would vary across outpatient processes. This hypothesis was not supported because all pairwise comparisons for the VCC_C → SAT path were non-significant at the 0.05 two-tailed level. H5 proposed that the association between patient participation behavior (VCC_P) and patient satisfaction (SAT) would vary across outpatient processes. This hypothesis was also not supported because no pairwise comparison for the VCC_P → SAT path reached statistical significance. H6 proposed that the association between patient citizenship behavior (VCC_C) and patient participation behavior (VCC_P) would vary across outpatient processes. This hypothesis was not supported because the VCC_C → VCC_P path was statistically stable across all pairwise process comparisons. As an additional robustness check, the specific indirect effect of VCC_C → VCC_P → SAT was also compared across processes, and all pairwise comparisons were non-significant. Taken together, these results indicate that the structural associations among citizenship behavior, participation behavior, and satisfaction were statistically stable across outpatient processes. However, this stability does not mean that all processes produced the same satisfaction levels. Rather, it suggests that the behavioral associations were invariant, while satisfaction levels were shaped by process-specific operational conditions.
3.5. Importance–Performance Map Analysis (IPMA)
IPMA was conducted with SAT as the target construct to translate the structural results into process-level improvement priorities from the patient perspective. At the construct level (
Table 9), VCC_C showed higher importance for SAT than VCC_P, whereas VCC_P showed slightly higher performance, indicating that citizenship behavior offered greater improvement leverage while participation behavior formed a relatively well-performed support layer. At the indicator level (
Table 10), two consistent priorities emerged in the overall model: Feedback (FDB) and Tolerance (TLR), which showed high importance but comparatively lower performance. Helping (HEP) and Advocacy (AVC) appeared as high-importance, high-performance strengths to maintain. Participation indicators (RSP, PIT, ISH, ISK) functioned as supportive assets. Process-specific IPMA results are provided in
Appendix E Table A11,
Table A12,
Table A13,
Table A14,
Table A15,
Table A16,
Table A17 and
Table A18.
Process specific maps reinforced this pattern:
G1 (Diagnosis): priorities = FDB, TLR; strengths = AVC, HEP; participation items supportive.
G2 (Lab/Imaging): priorities = TLR, FDB; strengths = HEP, AVC.
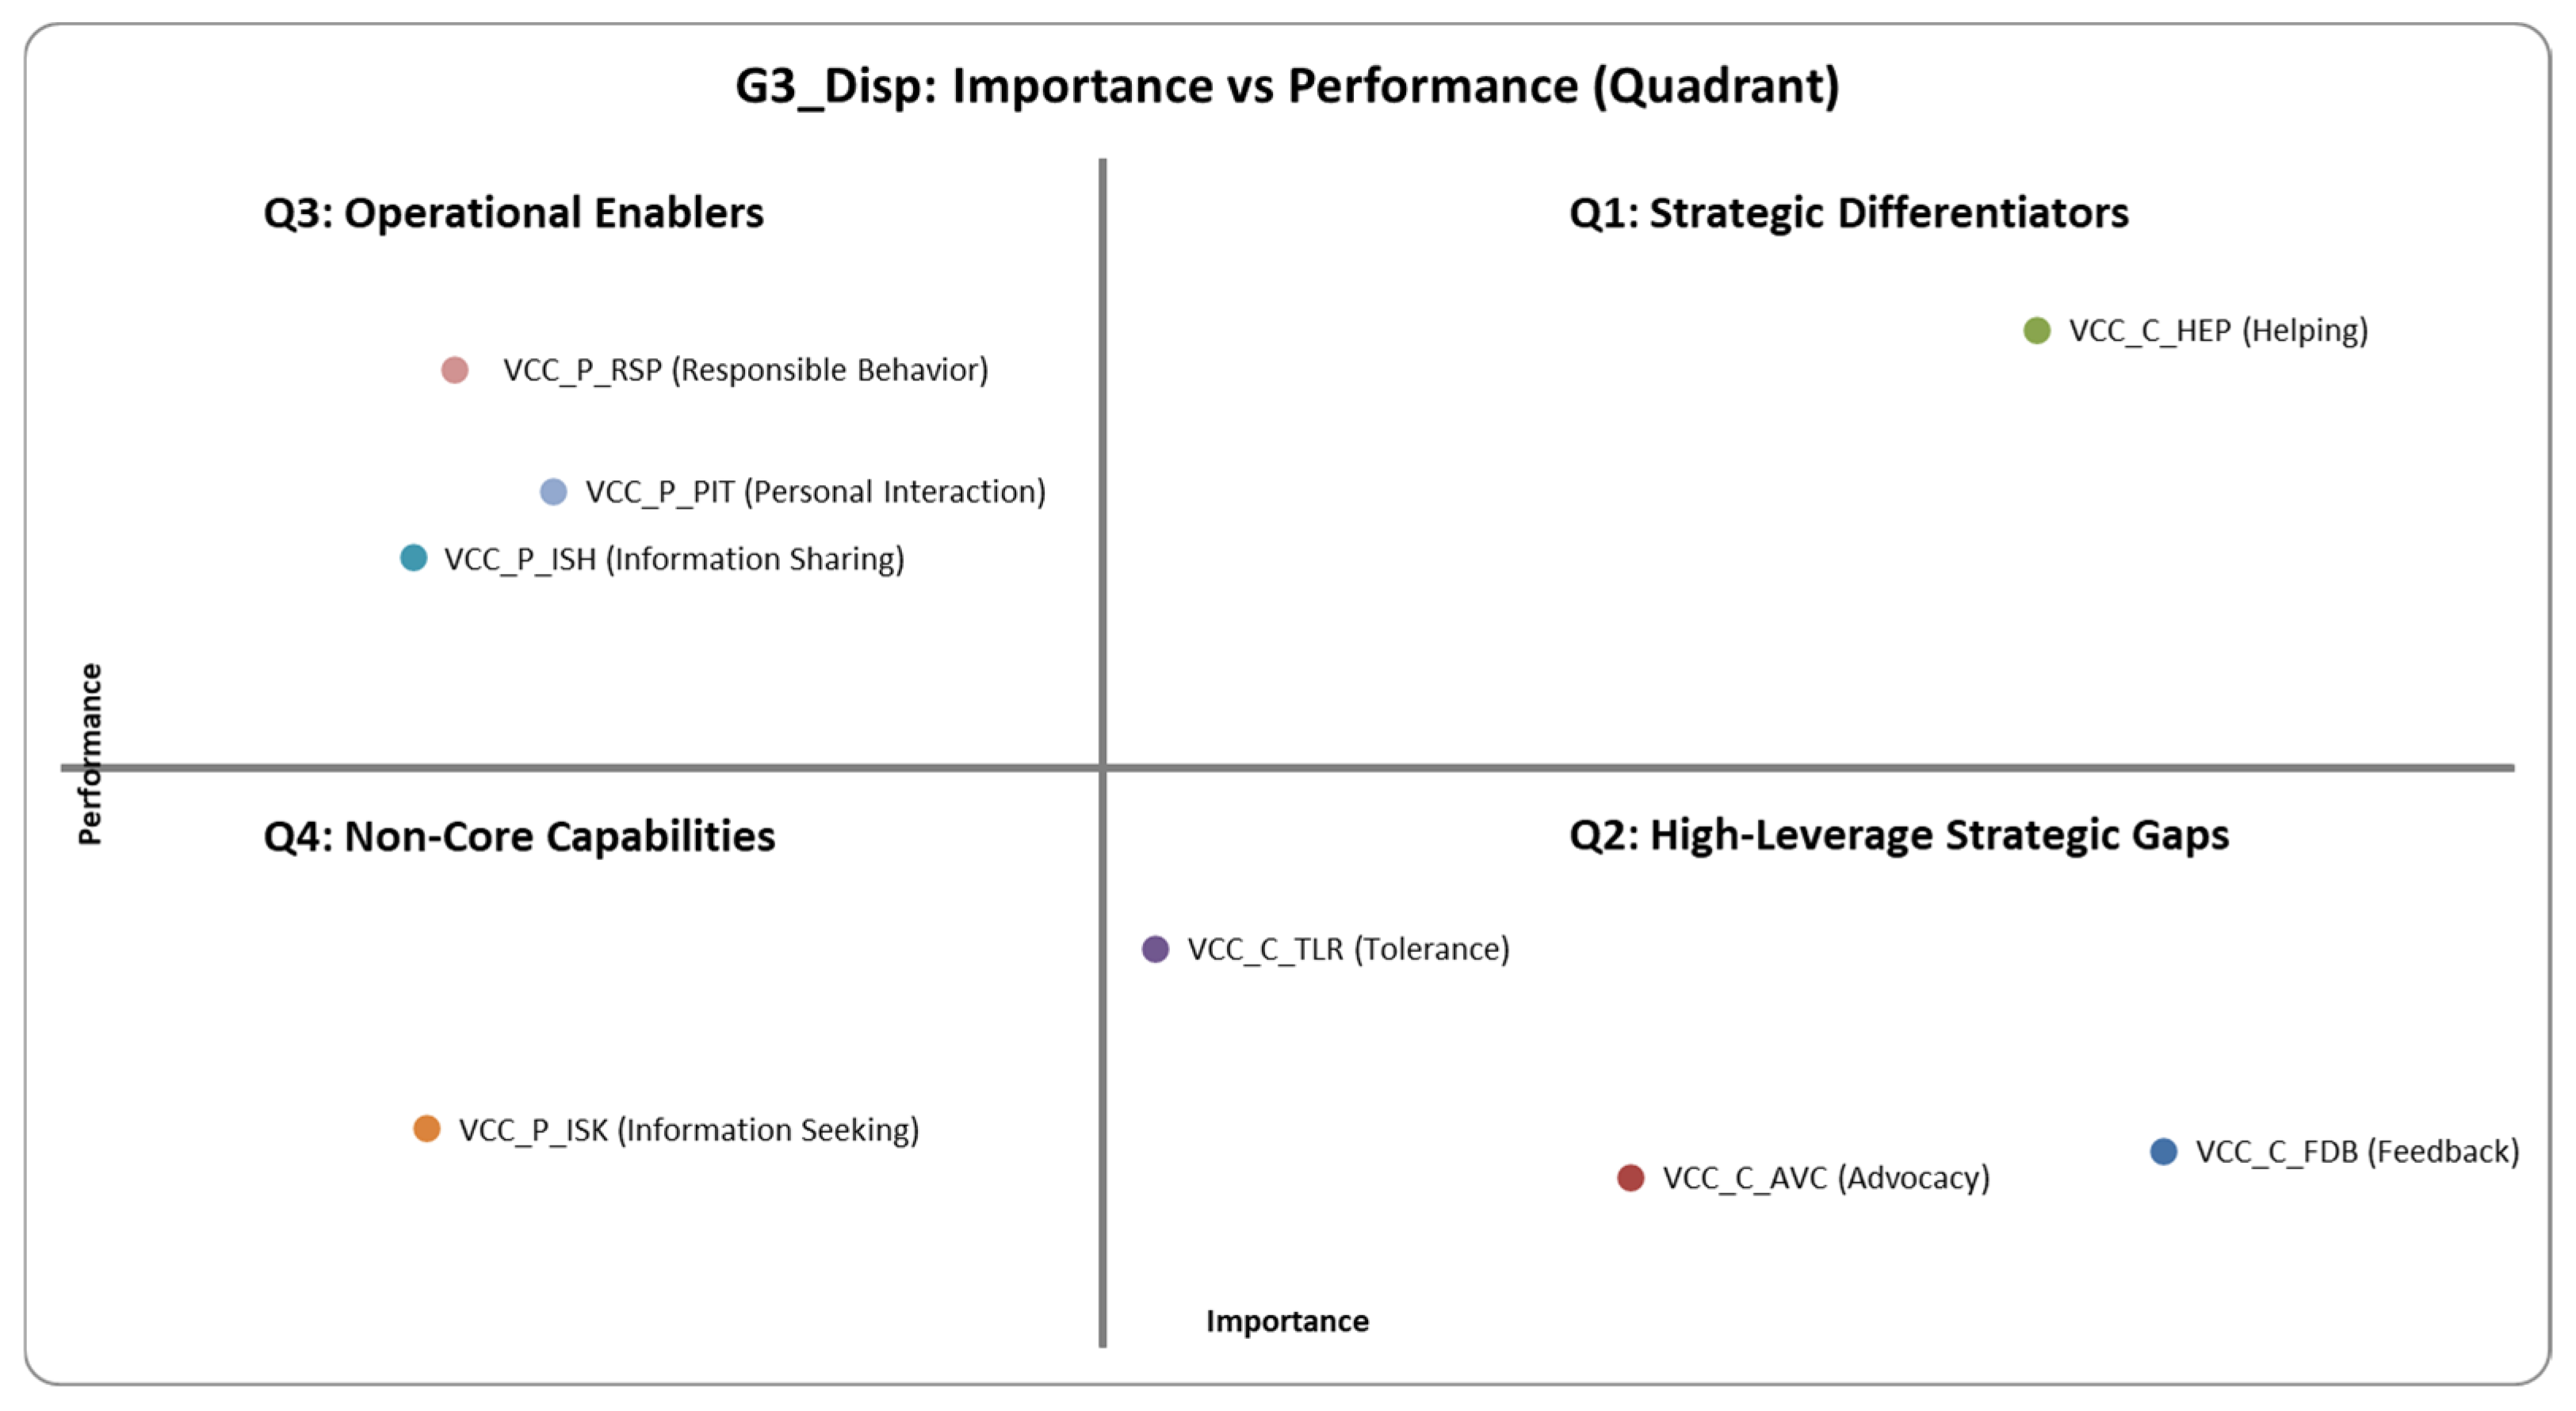
G3 (Dispensing): priorities = FDB, AVC; strength = HEP; participation items supportive.
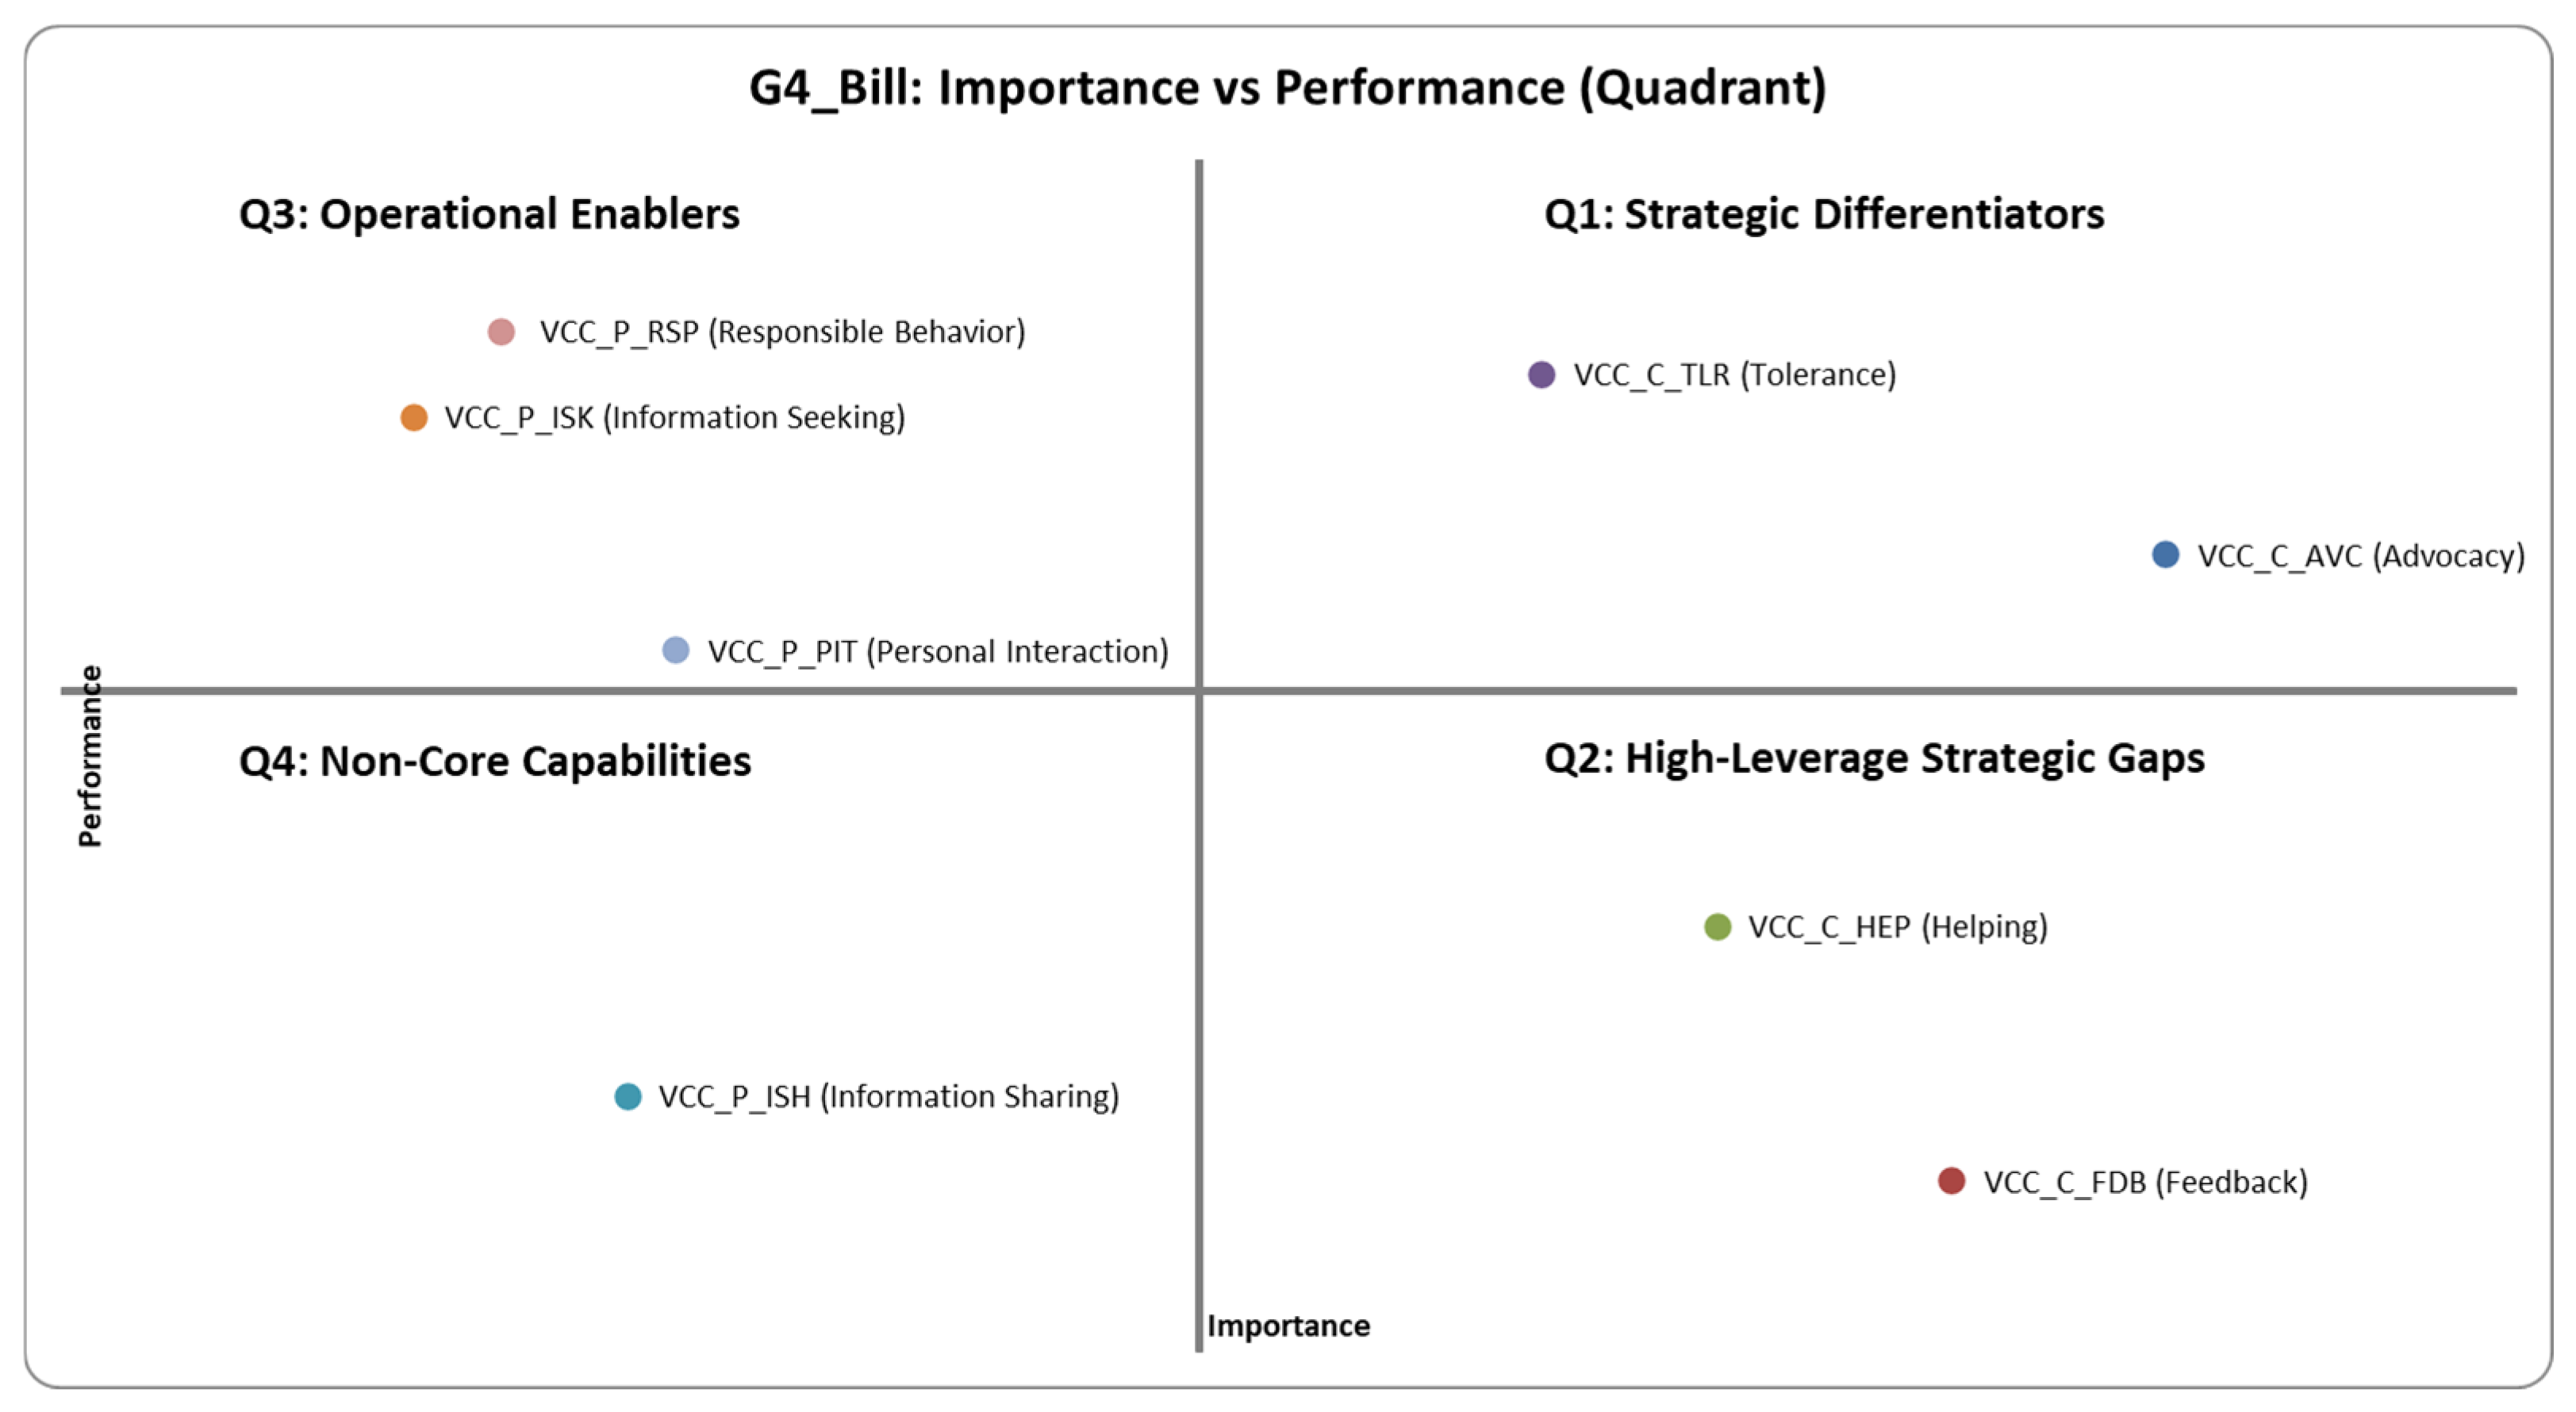
G4 (Billing): priorities = AVC, FDB; strengths = TLR, HEP.
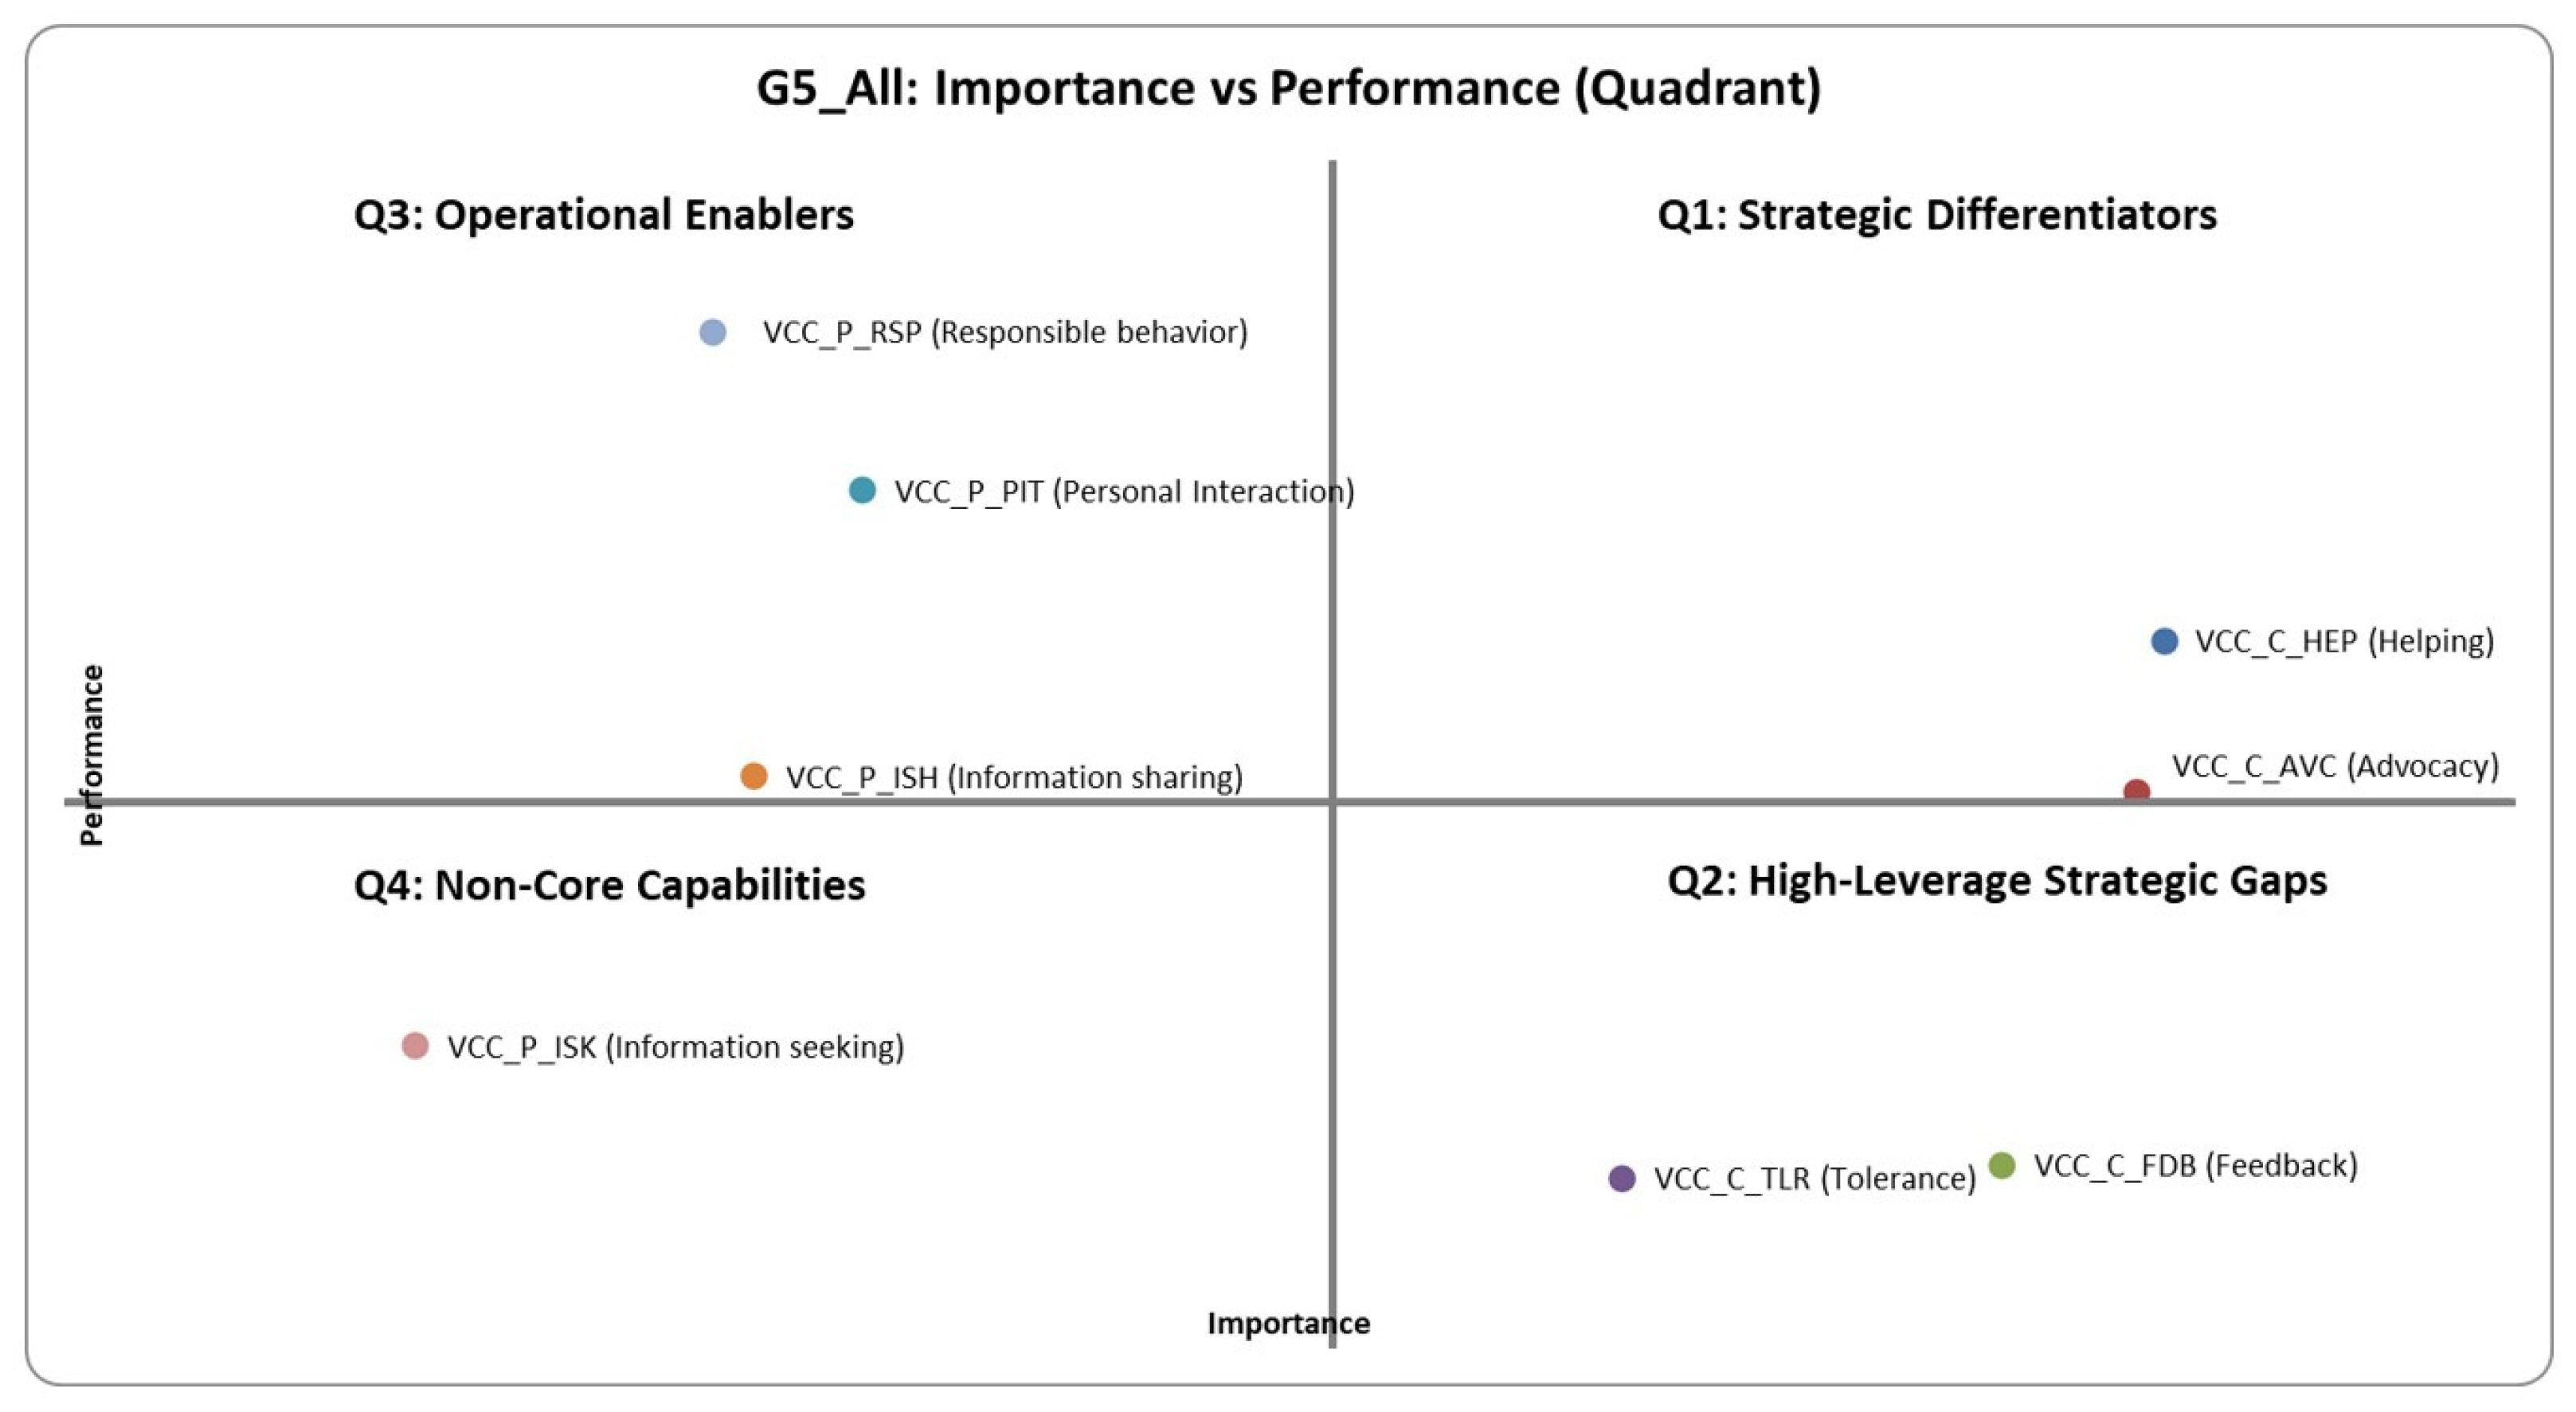
G5 (Overall, weighted): priorities = FDB, TLR; strengths = HEP, AVC.
3.6. Qualitative Findings Supporting Quantitative Results
Semi-structured interviews were conducted to complement and contextualize the quantitative findings. Eight patients were interviewed, with two patients selected from each outpatient process: one patient with the highest satisfaction score and one patient with the lowest satisfaction score. The interviews explored reasons for satisfaction and dissatisfaction, perceptions of waiting and communication, staff responsiveness, process visibility, and patient participation and citizenship behaviors during outpatient service encounters.
In the diagnosis and treatment process, the high-satisfaction case emphasized the convenience of technology-enabled appointment and check-in functions through the hospital mobile application, trust in physicians and nurses, and positive interpersonal interactions with service staff. The patient also reported willingness to provide accurate information and cooperate with clinical staff, indicating strong participation behavior. However, even this highly satisfied patient noted that the blood pressure measurement point could become delayed when patient volume was high. In contrast, the low-satisfaction case emphasized prolonged waiting despite prior mobile application check-in, inability to estimate the waiting time for consultation, insufficient explanation from the physician regarding medication concerns during pregnancy, perceived lack of empathy, and uncertainty about personal data protection. These accounts suggest that satisfaction in diagnosis and treatment is strongly shaped by waiting-time predictability, responsiveness, explanation quality, and perceived empathy.
In the laboratory and imaging process, both high and low satisfaction cases generally described the service as understandable and relatively efficient, especially for patients familiar with the hospital. The high-satisfaction case highlighted clear signage at the blood collection area, cleanliness, staff professionalism, attention to patients, and rapid service. The patient also observed that staff showed patience and care toward elderly patients and patients requiring assistance. The low-satisfaction case also reported that the process was not difficult, that waiting time was generally acceptable, and that staff were willing to answer questions. However, the interview suggested that process familiarity played an important role. Patients who had used the service for a long time did not need to search for information, whereas first-time users might still require clearer guidance. These findings indicate that the laboratory and imaging process appears relatively standardized and predictable, but wayfinding support and communication remain important for less experienced patients.
In the medication dispensing process, the high-satisfaction case strongly emphasized the benefits of electronic prescribing and online ordering by physicians, which reduced waiting time and simplified the medication receiving process. The patient also valued visible queue information, clear signs, pharmacist competence, medication explanations, and proactive actions such as opening additional dispensing channels during crowded periods. In the low-satisfaction case, however, waiting remained a major concern. The patient reported that even with electronic prescribing and mobile application support, the waiting time before the medication queue appeared on the screen could still be long, and the reason for the delay was not always clear. The patient nevertheless continued to express trust in pharmacist’s competence, appreciated pharmacist’s willingness to explain medication use, and showed tolerance by recognizing that medicine volume, stock movement, or patient volume could affect waiting. These findings support the interpretation that medication dispensing benefits from workflow standardization and information-system support, but queue-status transparency and explanation of delay remain important improvement points.
In the billing process, the high-satisfaction case emphasized convenient and rapid payment channels, clear payment counters, courteous financial staff, and proactive service recovery when payment channels became crowded, such as opening an additional counter. The patient also described active preparation of required documents and information before payment, which supported smoother service completion. In contrast, the low-satisfaction case identified several administrative friction points, including insufficiently modern or accessible payment channels, unclear signage, unexpected counter closure without explanation, slow queue calling, and uncertainty about the reason for delays. At the same time, the patient still acknowledged positive staff behaviors, such as willingness to answer questions and assist older patients. These findings indicate that billing satisfaction is closely related to transparency, queue predictability, communication during service interruptions, and the ability of staff to provide timely explanations at the final outpatient touchpoint.
Across the four outpatient processes, several cross-cutting themes emerged. First, waiting-time predictability and queue visibility were central to patients’ evaluations of perceived outpatient process performance. Patients were more satisfied when they could estimate waiting time, understand the next service step, or see their queue status. Second, digital tools such as mobile check-in, electronic prescribing, medication queue tracking, and electronic payment improved convenience, but they did not fully eliminate dissatisfaction when patients still experienced unexplained waiting or unclear process status. Third, staff responsiveness, empathy, and clear explanations were consistently important, especially in diagnosis and treatment and billing, where uncertainty and emotional concerns were more salient. Fourth, participation behaviors, such as providing accurate information, preparing documents, following instructions, and interacting politely with staff, appeared relatively stable across processes. However, information seeking varied by patient familiarity with the hospital; experienced patients often relied on prior knowledge rather than actively searching for information.
The qualitative findings also help interpret the IPMA results. Feedback and tolerance emerged as important but lower-performing priorities in the quantitative analysis. The interviews suggest that patients were often willing to tolerate delays when they understood the reason, but dissatisfaction increased when waiting, counter closure, or service delays occurred without sufficient explanation. Similarly, patients did not always actively provide feedback unless they encountered a clear problem, suggesting that feedback mechanisms may need to be made easier, more visible, and more responsive. Helping and advocacy appeared as strengths in the quantitative results, and the interviews similarly showed that positive evaluations were often linked to trust, willingness to recommend the service, appreciation of staff effort, and cooperative behavior during service encounters.
Overall, the qualitative findings support the process-level interpretation of the quantitative results. They do not establish direct causal effects of operational features such as electronic prescribing, mobile applications, queue displays, or counter management. Rather, they provide contextual evidence showing how patients interpret outpatient service processes and why satisfaction may vary across service nodes. In particular, the higher satisfaction observed in medication dispensing compared with diagnosis and treatment is consistent with patient accounts emphasizing electronic prescribing, clearer queue visibility, pharmacist communication, and more standardized workflow. Conversely, lower satisfaction in diagnosis and treatment and billing was associated with waiting uncertainty, insufficient explanation, and limited transparency during service handoffs. These findings reinforce the view that patient-side value co-creation behaviors operate within operational conditions shaped by queue visibility, handoff coordination, communication quality, and process transparency.
4. Discussion
As shown in
Figure 4 and
Table 4, the results indicate that patient citizenship behavior was positively associated with patient satisfaction across all process-specific models and the overall pooled model, while the association between patient citizenship behavior and patient participation behavior was also positive and consistently strong. The mediation results in
Table 5 further suggest that participation behavior functioned as an indirect pathway in several, but not all, outpatient processes. Taken together, these findings point to a citizenship-dominant pattern in which patient-side behavioral enablers are associated with perceived outpatient process performance, while the strength of the mediated pathway varies by process context.
The finding that citizenship behavior showed greater explanatory importance for satisfaction than participation behavior is broadly consistent with prior research showing positive associations between value co-creation and satisfaction in both general service settings and healthcare contexts [
24,
25,
26]. More specifically, the present results align with studies that characterize citizenship behavior as a voluntary extra-role repertoire involving feedback, advocacy, helping, and tolerance, and that position such behaviors as important contributors to perceived service quality and customer evaluations in complex service environments [
13,
32,
33]. In the present outpatient context, citizenship behavior remained the stronger behavioral correlate of satisfaction even when participation behavior was already well performed, suggesting that extra-role relational and cooperative behaviors may be especially salient in shaping patient evaluations of service encounters.
The positive association between citizenship behavior and participation behavior also supports the view that extra-role and in-role behaviors are interrelated in value co-creation. Patients who are more willing to provide feedback, show tolerance, advocate for the service, or help other patients may also be more likely to seek information, share relevant information, comply with service requirements, and interact constructively with staff during service delivery. This interpretation is consistent with the customer value co-creation behavior framework proposed by Yi and Gong [
13], as well as later work suggesting that customer citizenship behavior can reinforce more active participation in service encounters [
32,
36]. In this study, the VCC_C to VCC_P path was consistently strong across all process-specific models and the pooled model, indicating that citizenship behavior was associated with a broader pattern of patient engagement throughout the outpatient pathway (
Figure 4;
Table 4).
At the same time, the results suggest that participation behavior did not contribute equally across all outpatient processes. As reported in
Figure 4,
Table 4 and
Table 5, the VCC_P to SAT path was significant in diagnosis and treatment, laboratory and imaging tests, billing, and the pooled model, but it was not statistically significant in medication dispensing. The indirect pathway through participation behavior was also not significant in medication dispensing and was borderline, but not significant at the 0.05 two-tailed level, in diagnosis and treatment. This pattern should be interpreted cautiously, but it is consistent with the possibility that in more standardized and digitally supported processes, additional patient participation may have less incremental explanatory importance once workflow uncertainty has already been reduced.
One of the most important findings of the study is the distinction between structural stability and level differences across processes. The multi-group analysis showed that the structural associations among citizenship behavior, participation behavior, and satisfaction did not significantly differ across diagnosis and treatment, laboratory and imaging tests, medication dispensing, and billing. In contrast, the Kruskal–Wallis and pairwise comparison results showed that satisfaction levels did differ across processes, with diagnosis and treatment scoring significantly lower than medication dispensing (
Appendix B Table A4 and
Table A5;
Figure A1 and
Figure A2). This distinction suggests that the behavioral association pattern was statistically stable across outpatient processes, while the level at which patients evaluated those processes varied according to operational context. This interpretation is also consistent with hospital logistics studies suggesting that patient experience may differ across service nodes because of differences in pathway structure, process standardization, and the visibility of coordination across units [
6,
7].
The service blueprint in
Figure 2 provides an important contextual basis for interpreting these level differences. Diagnosis and treatment involve queue assignment, consultation, possible referral to laboratory or imaging, treatment planning, and sometimes cross-specialty consultation, all before patients proceed to later service stages. This process is therefore more exposed to uncertainty related to waiting, communication, and multiple handoffs. By contrast, medication dispensing is supported by electronic prescription entry, upstream prescription handling, medication preparation, and visible queue tracking, which together may create a more standardized and transparent patient experience. However, these operational features were not modeled as independent explanatory variables in the present study. They are therefore interpreted as process-based contextual explanations rather than directly tested causal factors.
The qualitative findings help explain why satisfaction levels differed across outpatient processes even though the structural associations among citizenship behavior, participation behavior, and satisfaction were statistically stable. Across the four processes, several recurring themes emerged. First, waiting-time predictability and queue visibility strongly shaped patient evaluations of outpatient process performance. Patients were more satisfied when they could estimate waiting time, understand service progression, and anticipate the next step in the process. Second, staff responsiveness, empathy, and explanation quality were especially important in processes characterized by greater uncertainty, particularly diagnosis and treatment and billing. Third, technology-enabled process support, such as mobile appointment functions, electronic prescribing, medication queue tracking, and digital payment channels, appeared to improve convenience and process transparency, although they did not eliminate dissatisfaction when delays remained unexplained. Overall, these qualitative patterns are consistent with the interpretation that perceived outpatient process performance depends not only on patient-side value co-creation behaviors, but also on how clearly the outpatient system communicates waiting, handoffs, and process status across service nodes.
The IPMA results add a prioritization layer to the structural findings by indicating which patient-side behaviors may offer greater leverage for improving satisfaction when interpreted together with the service blueprint and qualitative evidence. In the pooled model, citizenship behavior showed higher importance for satisfaction than participation behavior, while participation behavior showed slightly higher performance (
Table 9). At the indicator level, feedback and tolerance appeared as the main lower-performing but higher-importance priorities, whereas helping and advocacy appeared as relative strengths (
Table 10). The process-specific quadrant maps in
Figure 5,
Figure 6,
Figure 7,
Figure 8 and
Figure 9 reinforce this pattern while also showing differences in tactical emphasis across diagnosis and treatment, laboratory and imaging tests, medication dispensing, billing, and the pooled model. These patterns should not be interpreted as direct operational diagnosis. Rather, they indicate where hospitals may focus attention when seeking to improve perceived outpatient process performance through clearer queue communication, better explanation during delays, stronger feedback capture, and more transparent handoff coordination.
Overall, the discussion supports a careful positioning of the paper. The study does not measure logistics performance in a strict operational sense through objective indicators such as actual waiting time, throughput, queue length, or handoff delay. Instead, it examines how patient-side value co-creation behaviors are associated with patient satisfaction as an indicator of perceived outpatient process performance, interpreted through a service logistics perspective. Within this scope, the findings suggest that patient-side behavioral enablers and operational process conditions should be understood together: the behavioral association pattern was statistically stable across outpatient processes, while satisfaction levels varied according to process-specific operational context.
5. Implications
This study has implications for both theory and practice. Interpreted through a service logistics perspective, the results suggest that patient-side value co-creation behaviors are associated with how outpatient processes are experienced, while process-specific operational conditions influence the level at which satisfaction is realized. The implication is not that patient behavior alone determines outpatient process performance, but that behavioral enablers and operational design need to be considered together in efforts to improve perceived outpatient process performance across multiple service nodes.
5.1. Theoretical Contributions
This study makes three main theoretical contributions. First, it extends value co-creation research from an aggregate service context to a process-level outpatient setting by distinguishing among diagnosis and treatment, laboratory and imaging tests, medication dispensing, and billing as separate service nodes. This process-level framing contributes a more operationally meaningful perspective on how patient-side behaviors are associated with satisfaction in healthcare services.
Second, the study contributes to the conceptual interpretation of patient value co-creation by distinguishing between participation behavior as a stable operational foundation and citizenship behavior as a higher-leverage behavioral layer. Rather than treating all patient-side behaviors as functionally equivalent, the study shows that different forms of value co-creation may play different roles in relation to patient satisfaction in outpatient care.
Third, the study contributes to service logistics research by showing how patient satisfaction can be interpreted as an indicator of perceived outpatient process performance in a multi-handoff service system. In this respect, the study does not claim to measure logistics performance in a strict operational sense, but it demonstrates how patient-side value co-creation can be meaningfully interpreted through a service logistics perspective in healthcare operations.
5.2. Managerial Implications
The managerial implications of this study are best understood by combining the structural results, the service blueprint, the IPMA outputs, and the qualitative findings. At a general level, the results suggest that hospitals should treat patient-side value co-creation not merely as an individual behavior issue, but as something that is shaped by process design, communication, and visibility across outpatient service nodes. In practical terms, this means that hospitals should strengthen the conditions under which patients can provide constructive feedback, remain tolerant during delays, and navigate the service process with greater clarity and confidence.
Across the outpatient pathway, the most actionable priorities relate to queue visibility, explanation during delays, feedback capture, and handoff transparency. From a hospital logistics perspective, these priorities are also consistent with prior work showing that process visibility, coordination routines, and cross-unit alignment are critical for improving flow-related performance across hospital service pathways [
7,
8,
17]. The qualitative findings show that dissatisfaction increases when patients cannot estimate waiting time, do not understand why delays occur, or receive insufficient explanation during service interruptions. Conversely, patients respond more positively when process steps are visible, staff communicate clearly, and digital tools reduce uncertainty. These findings suggest that managers should prioritize better queue-status communication, more visible process progression, easier feedback channels, and clearer explanations at points where service delays or handoffs occur. Practically, this means embedding feedback capture and delay explanation at the main transition points of the outpatient pathway, especially between diagnosis and testing, treatment and billing, and prescribing and dispensing, where queue visibility and handoff transparency are most likely to shape patient experience.
Although these priorities are broadly relevant across the outpatient pathway, their tactical emphasis may differ by process. Diagnosis and treatment appear especially sensitive to waiting-time predictability, explanation quality, and empathy. Laboratory and imaging services appear relatively standardized, but still require clear wayfinding and support for less familiar users. Medication dispensing benefits from stronger workflow standardization and digital support, but still requires clearer communication when queue activation or medication preparation is delayed. Billing, as the final touchpoint of the outpatient journey, requires particular attention to predictability, service recovery, and explanation when counters close or queues slow down. In this sense, the study suggests that hospitals should combine systemwide improvement priorities with process-specific operational adjustments rather than relying on a single undifferentiated intervention approach.
5.3. Limitations of the Study
Several limitations should be considered when interpreting the findings of this study. First, the research was conducted in a single university hospital in Thailand. Although this setting provides a useful case for process-level outpatient analysis, the findings may not be directly generalizable to hospitals with different governance structures, patient populations, levels of digitalization, or operational workflows.
Second, the study used a cross-sectional design and relied primarily on patient-reported survey data. As a result, the findings should be interpreted in terms of association rather than strong causal inference. While the structural model identifies statistically meaningful relationships among citizenship behavior, participation behavior, and patient satisfaction, it does not establish temporal ordering or direct causal effects.
Third, the study examined patient satisfaction as an indicator of perceived outpatient process performance rather than measuring logistics performance in a strict operational sense. The analysis did not include objective operational indicators such as actual waiting time, queue length, throughput, handoff delay, or service lead time. Therefore, the service logistics interpretation of the findings should be understood as process-based and patient-perceived rather than as a direct measurement of operational performance.
Fourth, the study was limited to outpatient processes and did not include inpatient or emergency care. These service settings differ in their interaction intensity, urgency, workflow structure, and patient role expectations. As a result, the present findings should not be assumed to transfer directly to other hospital service contexts without further validation.
Fifth, the process-level survey design used balanced samples of 100 respondents per process to support comparison across outpatient processes, while the pooled model was weighted to approximate the hospital’s actual outpatient process mix. This design was appropriate for the analytical objectives of the study, but it also means that the process-level models were optimized for comparison rather than for population representation within each process.
Finally, the qualitative component was designed primarily to complement and contextualize the quantitative findings. Although the eight interviews provided useful insight into process-specific experiences, the qualitative sample was limited in size and was not intended to function as a standalone qualitative study. Its role was interpretive and supportive rather than exhaustive.
5.4. Suggestions for Future Research
Future research should validate the present findings across multiple hospitals and healthcare systems in order to assess contextual variation and broader generalizability. Comparative studies across public, private, teaching, and non-teaching hospitals would be especially useful for determining whether the observed citizenship-dominant pattern remains stable under different organizational and operational conditions.
Longitudinal and intervention-based research would also strengthen the evidence base. Because the present study used a cross-sectional design, future work should examine whether targeted interventions, such as improved queue visibility, more responsive feedback systems, clearer communication during delays, or redesigned handoff points, lead to sustained changes in patient satisfaction and value co-creation behaviors over time.
Future studies should also integrate objective operational metrics with patient-reported measures in order to provide a more comprehensive assessment of outpatient process performance. Indicators such as waiting-time distributions, queue length, throughput, service lead time, and handoff delay would help clarify how patient-side value co-creation behaviors relate to operational conditions and process outcomes [
4,
5].
Another useful direction would be to examine how digital service tools shape patient behavior and perceived process performance across outpatient pathways. In the present study, the qualitative findings suggest that mobile appointment systems, electronic prescribing, medication queue tracking, and digital payment channels may improve convenience and process visibility. Future research could test these process features more directly and examine whether they influence tolerance, feedback, participation behavior, and satisfaction in different outpatient contexts.
In addition, future studies could compare first-time and repeat users of outpatient services. The interview findings suggest that process familiarity may influence how patients seek information, interpret signage, and navigate service steps, particularly in laboratory and imaging services. This issue may be especially important in hospitals where outpatient pathways are complex or highly fragmented.
Finally, future research could extend the analysis to other hospital service settings, including inpatient and emergency care, where the structure of patient flow, interaction intensity, and uncertainty may differ substantially from outpatient services. Such work would help determine whether the present process-level framework is transferable beyond the outpatient context.