

Reproducibility Standards for Lean Maturity Models: Design Guidelines for Logistics Operations


Abstract
1. Introduction
2. Literature Review
2.1. Specification of the Measurement Model
2.2. What Criteria Should Maturity Models Satisfy as Measurement Instruments?
2.2.1. Opportunity—Desirability, Scope, Target Group, and Outcome Measures
2.2.2. Validity—Content Specification, Indicator Specification, Construct Validity, and Structural Integrity
2.2.3. Reliability—Observability, Responsiveness, Language Adequacy, Administrative Procedure, and Repeatability and Reproducibility
2.2.4. Generalizability—Proximal Similarity and Cross-Context Validation
2.2.5. Process Integrity—Design Justification and Continuous Improvement
2.3. Persistent Methodological Weaknesses in Maturity Model Development
2.4. Lean Maturity in Logistics and Supply Chain: An Underdeveloped Research Frontier
3. Research Methods
3.1. Data Sources and Search Criteria
3.2. Eligibility Criteria
- Were published in peer-reviewed academic journals, ensuring minimum standards of methodological transparency and scholarly scrutiny consistent with PRISMA-based systematic review practice [87].
- Assessed the degree of lean implementation or maturity, rather than only performance outcomes, consistent with the implementation/capability-based assessment category identified in the lean measurement literature [13].
- Were conference papers, books, book chapters, or non-peer-reviewed publications, as these formats do not provide the level of methodological reporting required for rigorous comparative evaluation [87].
- Reused existing lean measurement models without significant methodological modification, as inclusion of derivative instruments without independent design contribution would inflate model count without adding evaluative variance [42].
3.3. Screening and Selection Process
- Identification: Records retrieved from the four databases were compiled, and duplicates were removed.
- Screening: Titles and abstracts were screened to remove clearly irrelevant studies.
- Eligibility: Full-text articles were assessed against inclusion and exclusion criteria.
- Final inclusion: Studies meeting all criteria were retained for detailed evaluation.
3.4. Development of the Evaluation Framework (OVRGP) and Embedded Risk-of-Bias Logic
- ○
- Opportunity;
- ○
- Validity;
- ○
- Reliability;
- ○
- Generalizability;
- ○
- Process Integrity.
- OVRGP Dimensions as Bias Domains
- Opportunity (Purpose and Desirability Bias)Evaluates whether the model clearly specifies its intended logistics or supply chain value creation purpose.Bias risk: Absence of explicit business or operational desirability may result in normative or purely academic framing bias, limiting practical relevance.
- Validity (Conceptual and Construct Bias)Assesses content specification, indicator justification, formative measurement logic, and linkage to external outcome variables.Bias risk: Weak domain boundary definition, incomplete indicators, or lack of empirical construct validation introduces construct validity bias.
- Reliability (Measurement and Administration Bias)Examines observability, responsiveness, language adequacy, administrative clarity, and repeatability/reproducibility (R&R).Bias risk: Ambiguous indicators, inconsistent rating procedures, or absence of inter-rater testing increase measurement and rater bias.
- Generalizability (Context and Transferability Bias)Evaluates contextual boundary definition and evidence supporting applicability beyond the original setting.Bias risk: Overgeneralization without contextual specification introduces external validity bias.
- Process Integrity (Design and Reporting Bias)Assesses transparency of development methodology, justification of design choices, and evidence of iterative refinement.Bias risk: Limited methodological transparency or absence of refinement evidence introduces reporting and design bias.
3.5. Data Extraction, Evaluation, and Embedded Bias Assessment
- ○
- Model purpose and scope;
- ○
- Domain component definition;
- ○
- Indicator selection and justification;
- ○
- Scaling logic and maturity progression;
- ○
- Validation procedures;
- ○
- Reliability testing;
- ○
- Evidence of contextual specification;
- ○
- Documentation of design and refinement processes.
- ○
- Scores of 0–1 typically reflected a high risk of bias within the relevant OVRGP dimension.
- ○
- Scores of 2–3 indicated a moderate risk of bias due to partial fulfillment.
- ○
- Scores of 4–5 indicated low risk of bias supported by clear methodological evidence.
3.6. Synthesis and Interpretation
- ○
- Comparative performance assessment across models (RQ2);
- ○
- Identification of systematically high-bias domains (RQ3);
- ○
- Development of targeted methodological recommendations for logistics and supply chain industries (RQ4).
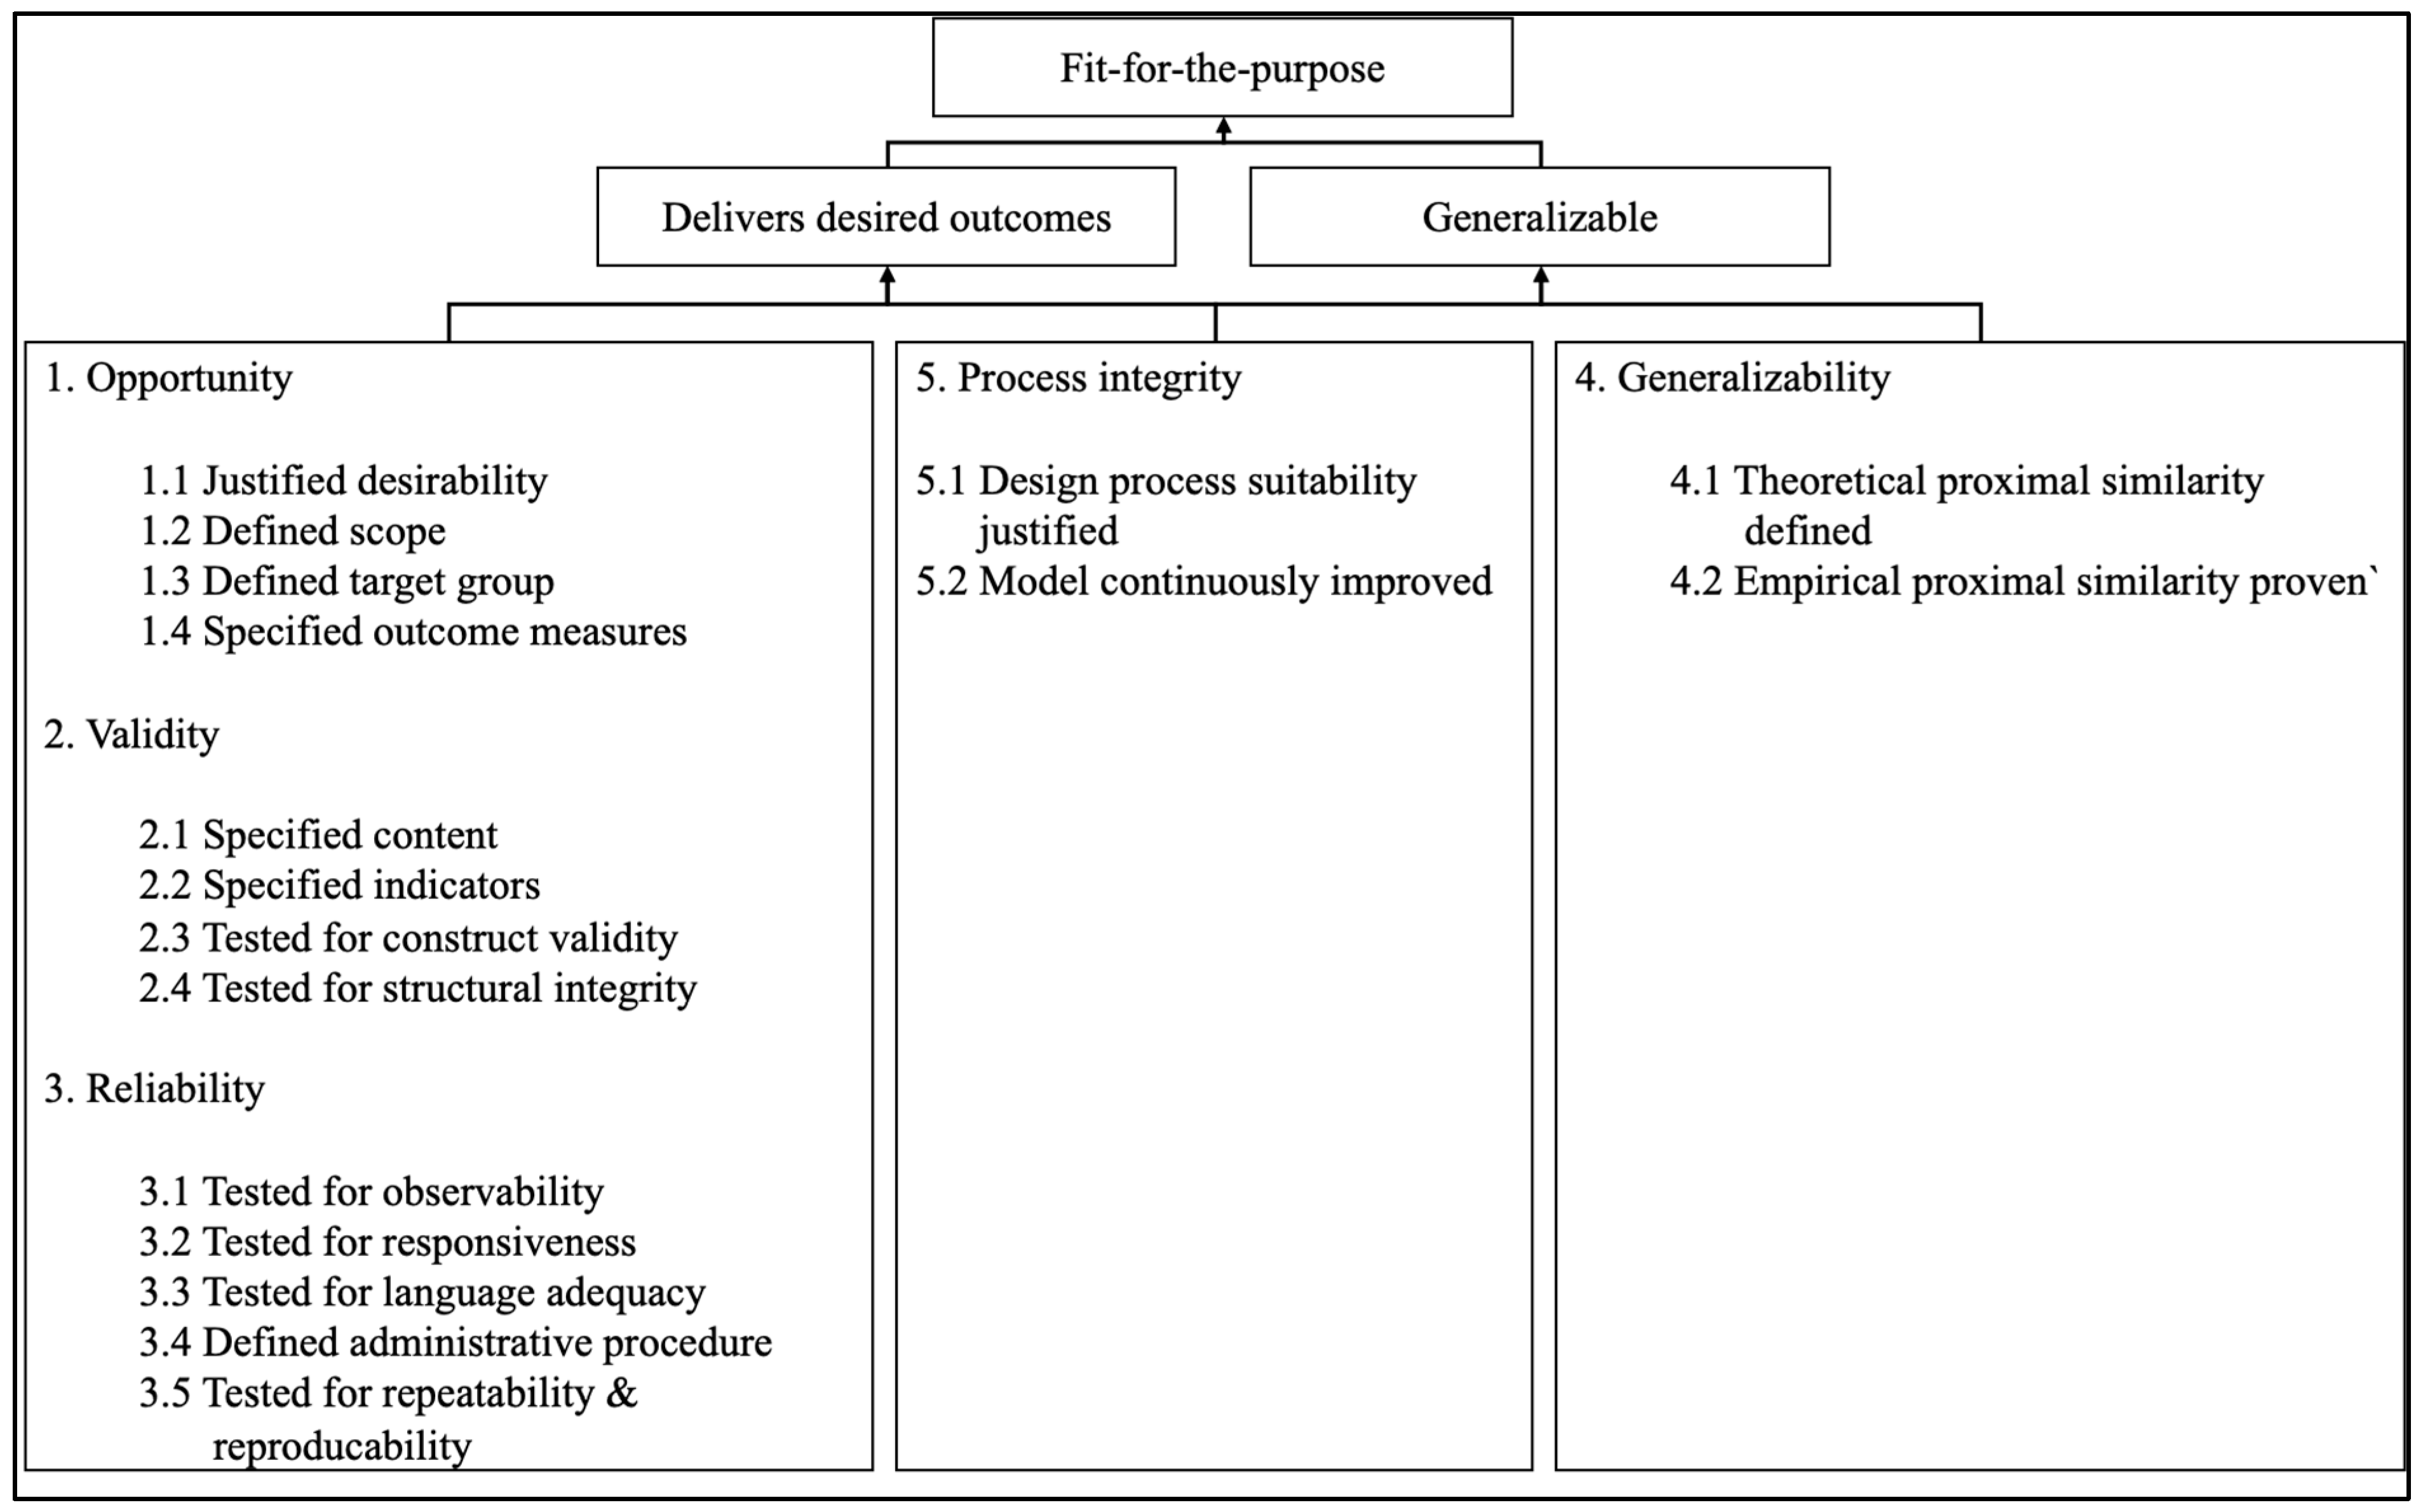
4. What Criteria Make a Lean Maturity Model Fit-for-Purpose? The OVRGP Framework
5. Evaluation Results: LMM Performance, Critical Weaknesses, and Improvement Recommendations
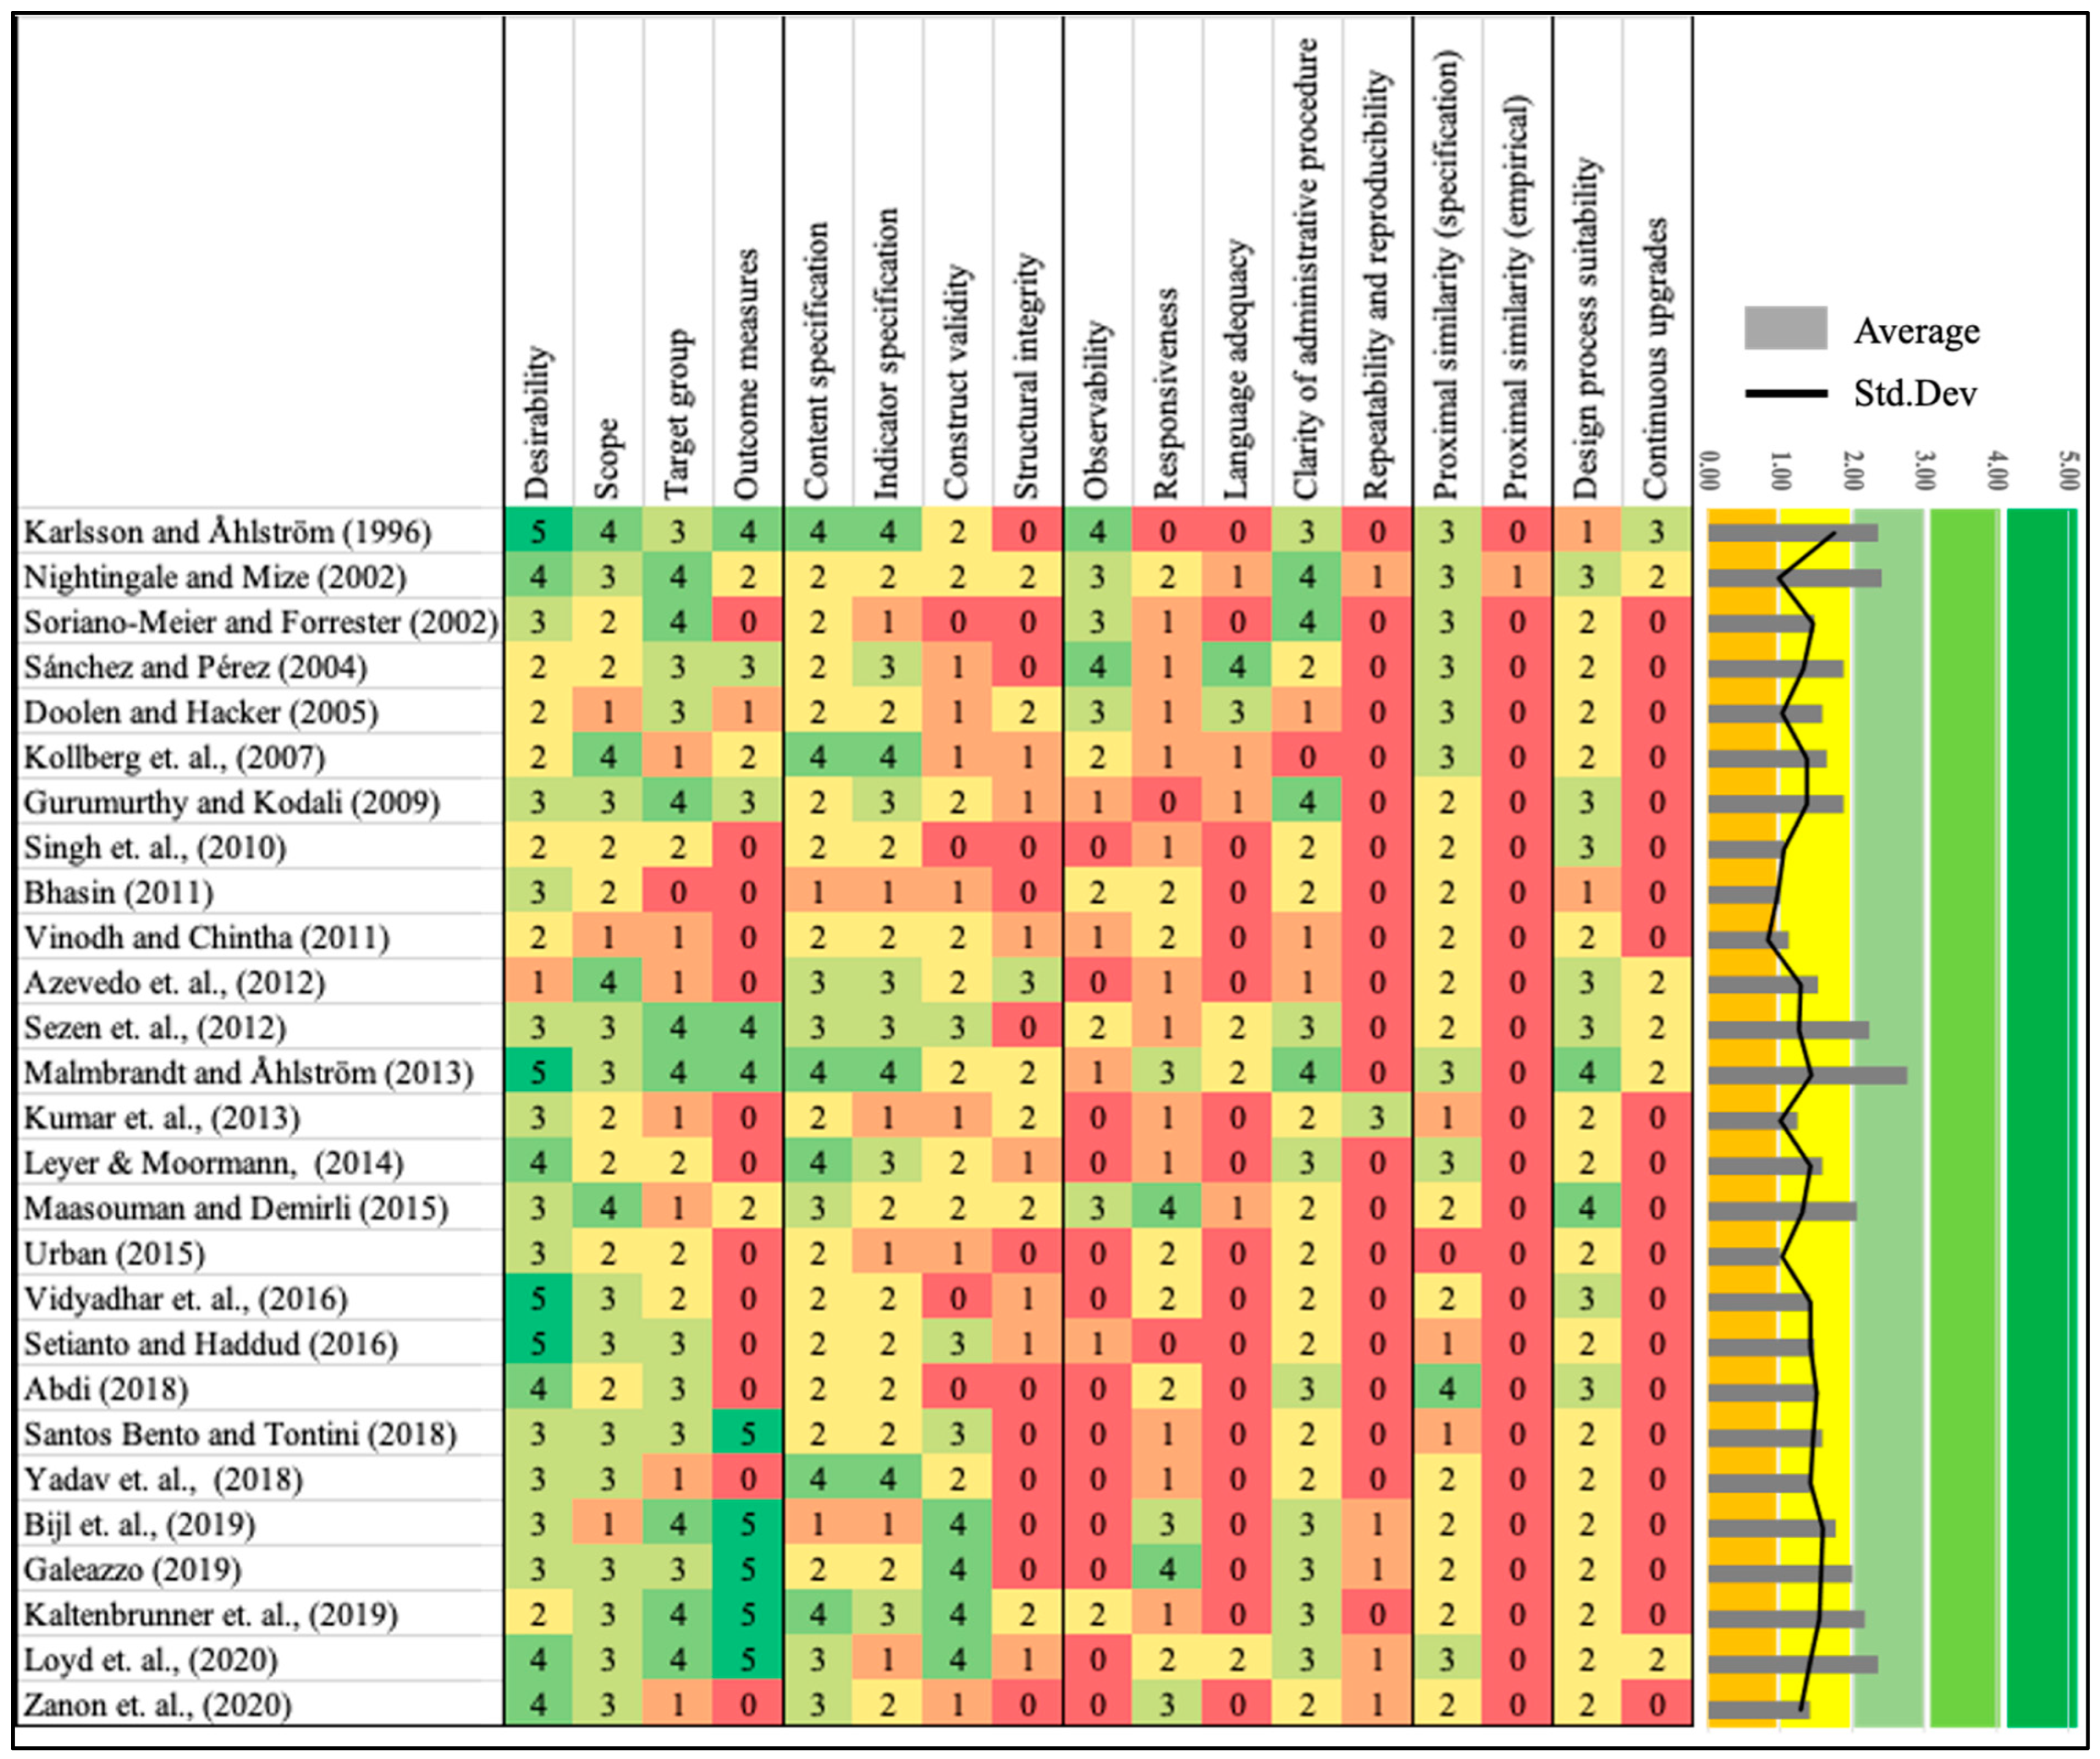
5.1. RQ2—How Do the LMMs Perform Against the OVRGP Criteria?
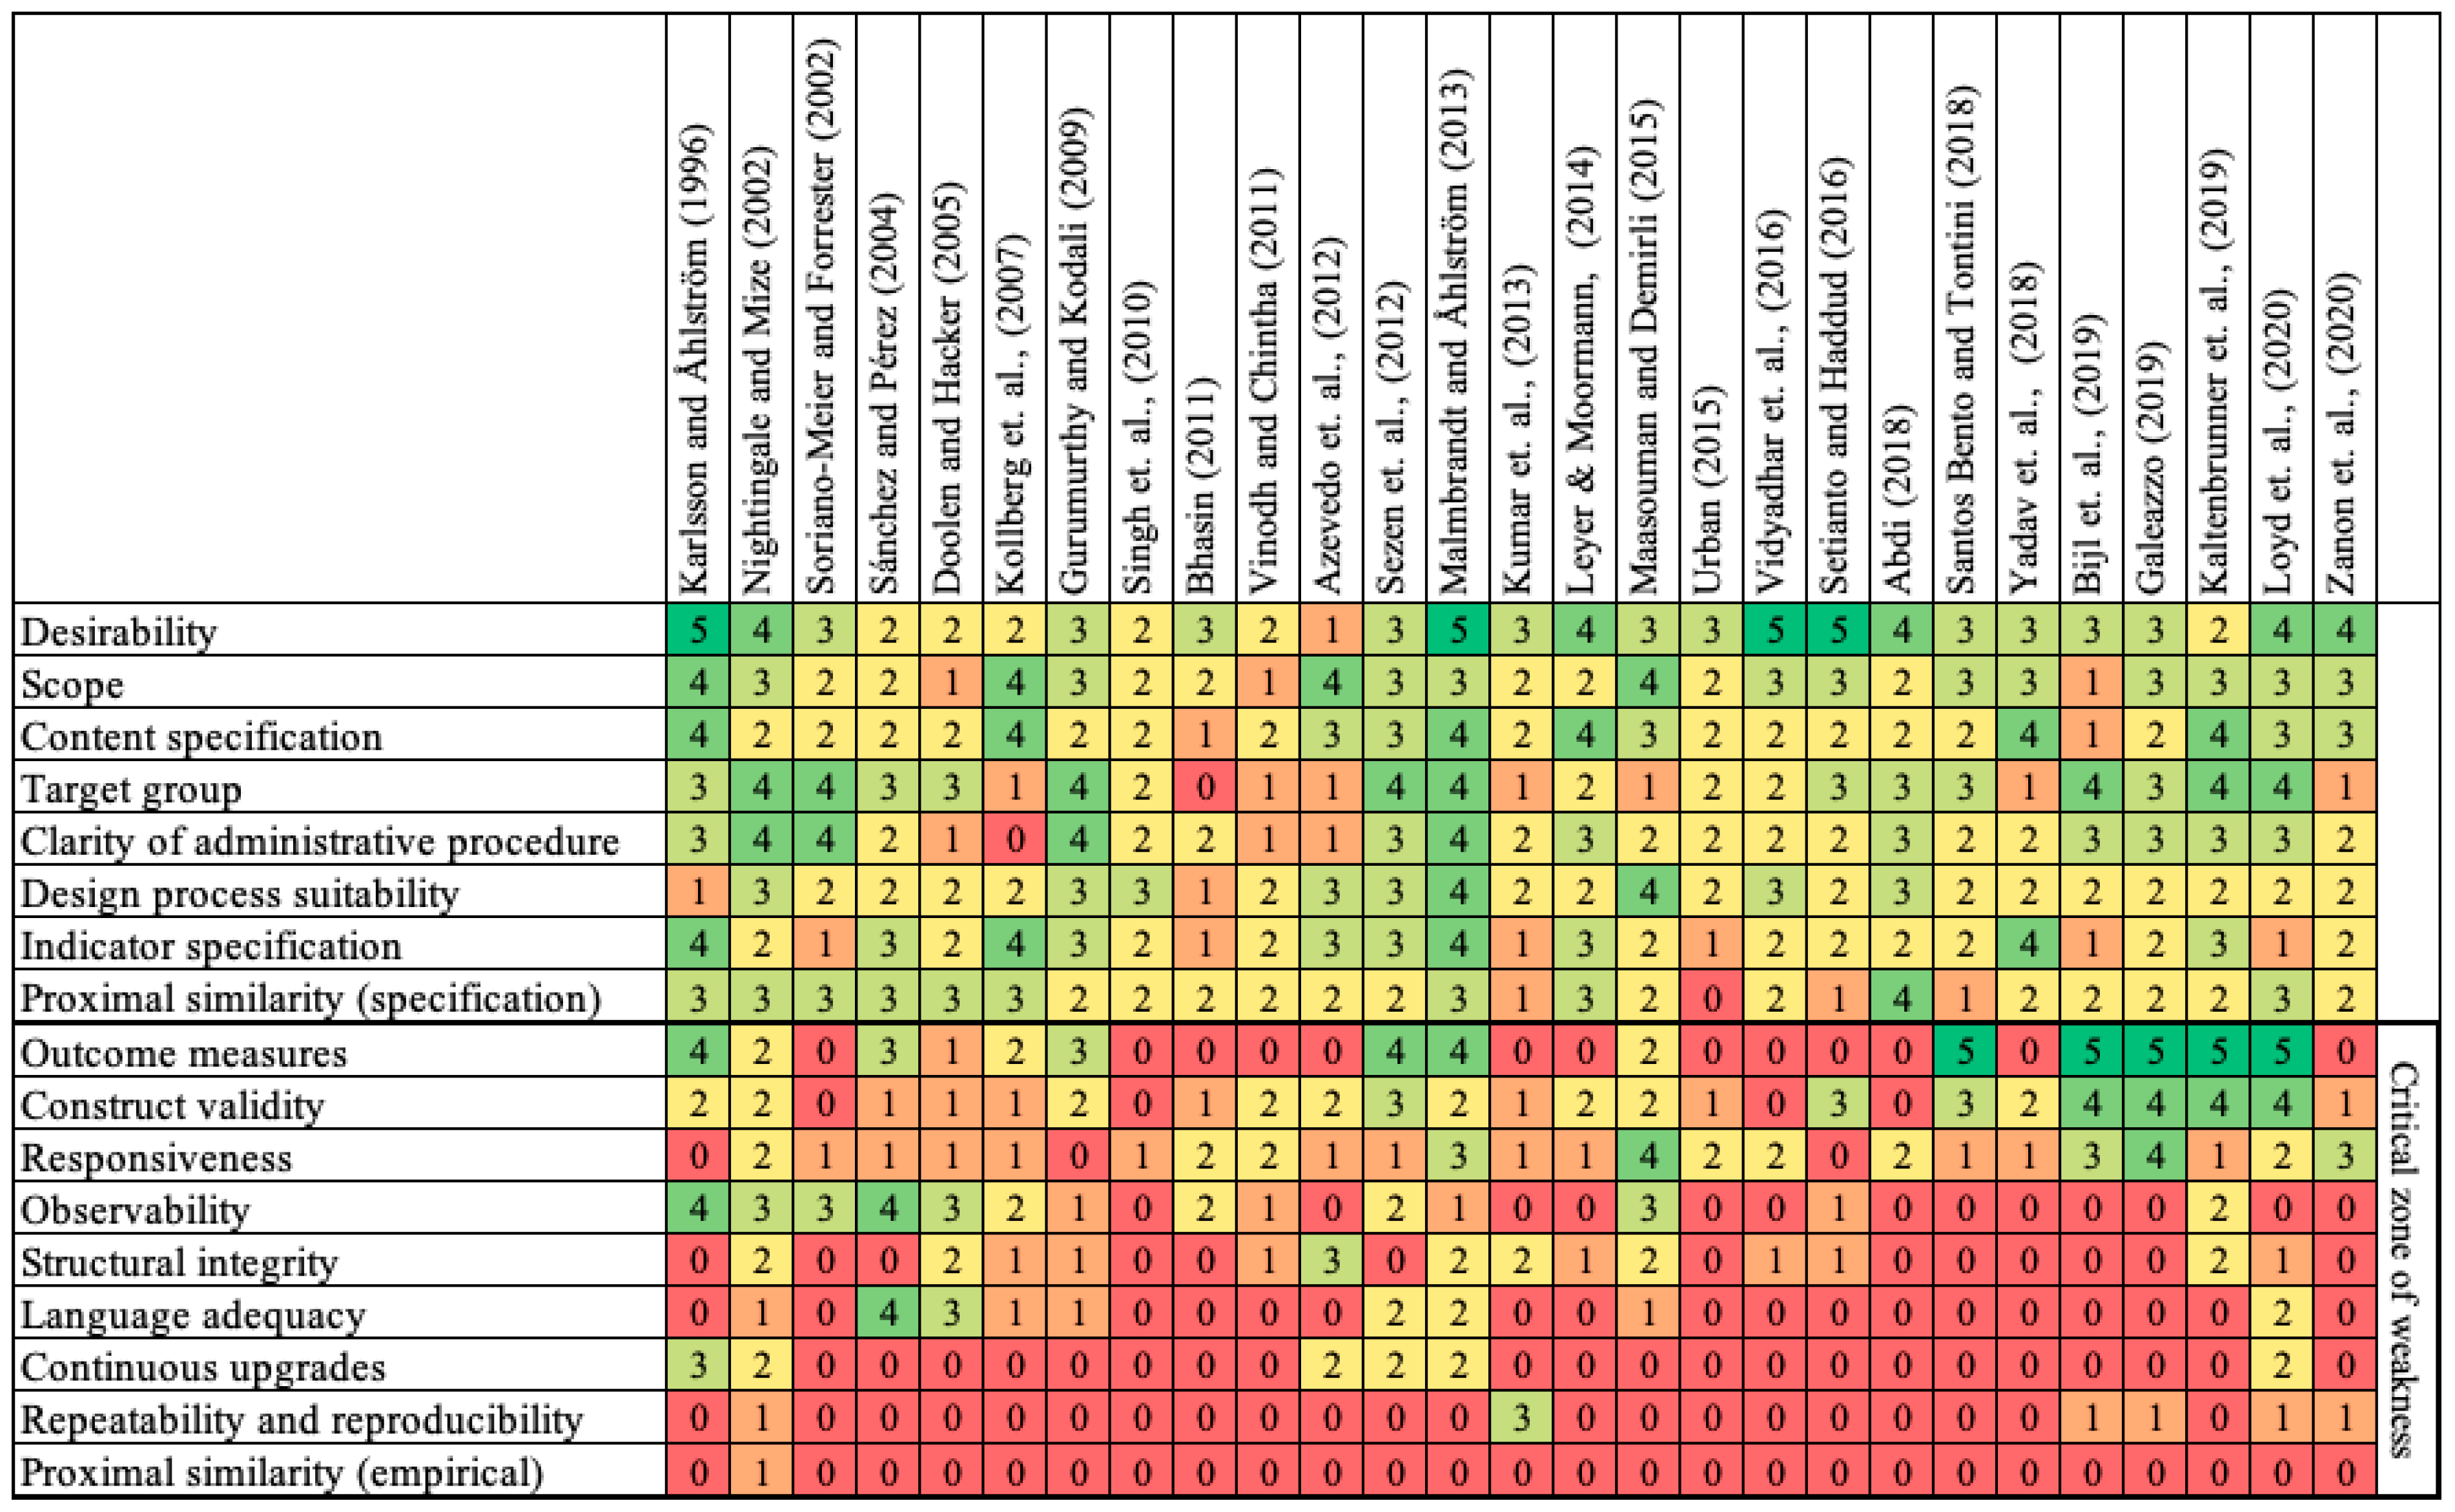
- Overall Trends
- ○
- No LMM achieved an overall average rating of 3 or above.
- ○
- Performance variability across criteria remains moderate.
- ○
- Standard deviation patterns suggest that most models exhibit systematic weaknesses across multiple dimensions, rather than isolated deficiencies.
5.2. Highest-Performing Model and Its Limitations
- ○
- Justifying business desirability;
- ○
- Defining outcome measures;
- ○
- Articulating a coherent scope.
- ○
- Construct validity relies primarily on expert opinion rather than empirical demonstration of maturity–outcome relationships.
- ○
- Structural integrity (MECE) is not formally tested.
- ○
- The inclusion of lean enablers, practices, and performance indicators within the same structural layer raises concerns of conceptual overlap and embedded cause-and-effect circularity.
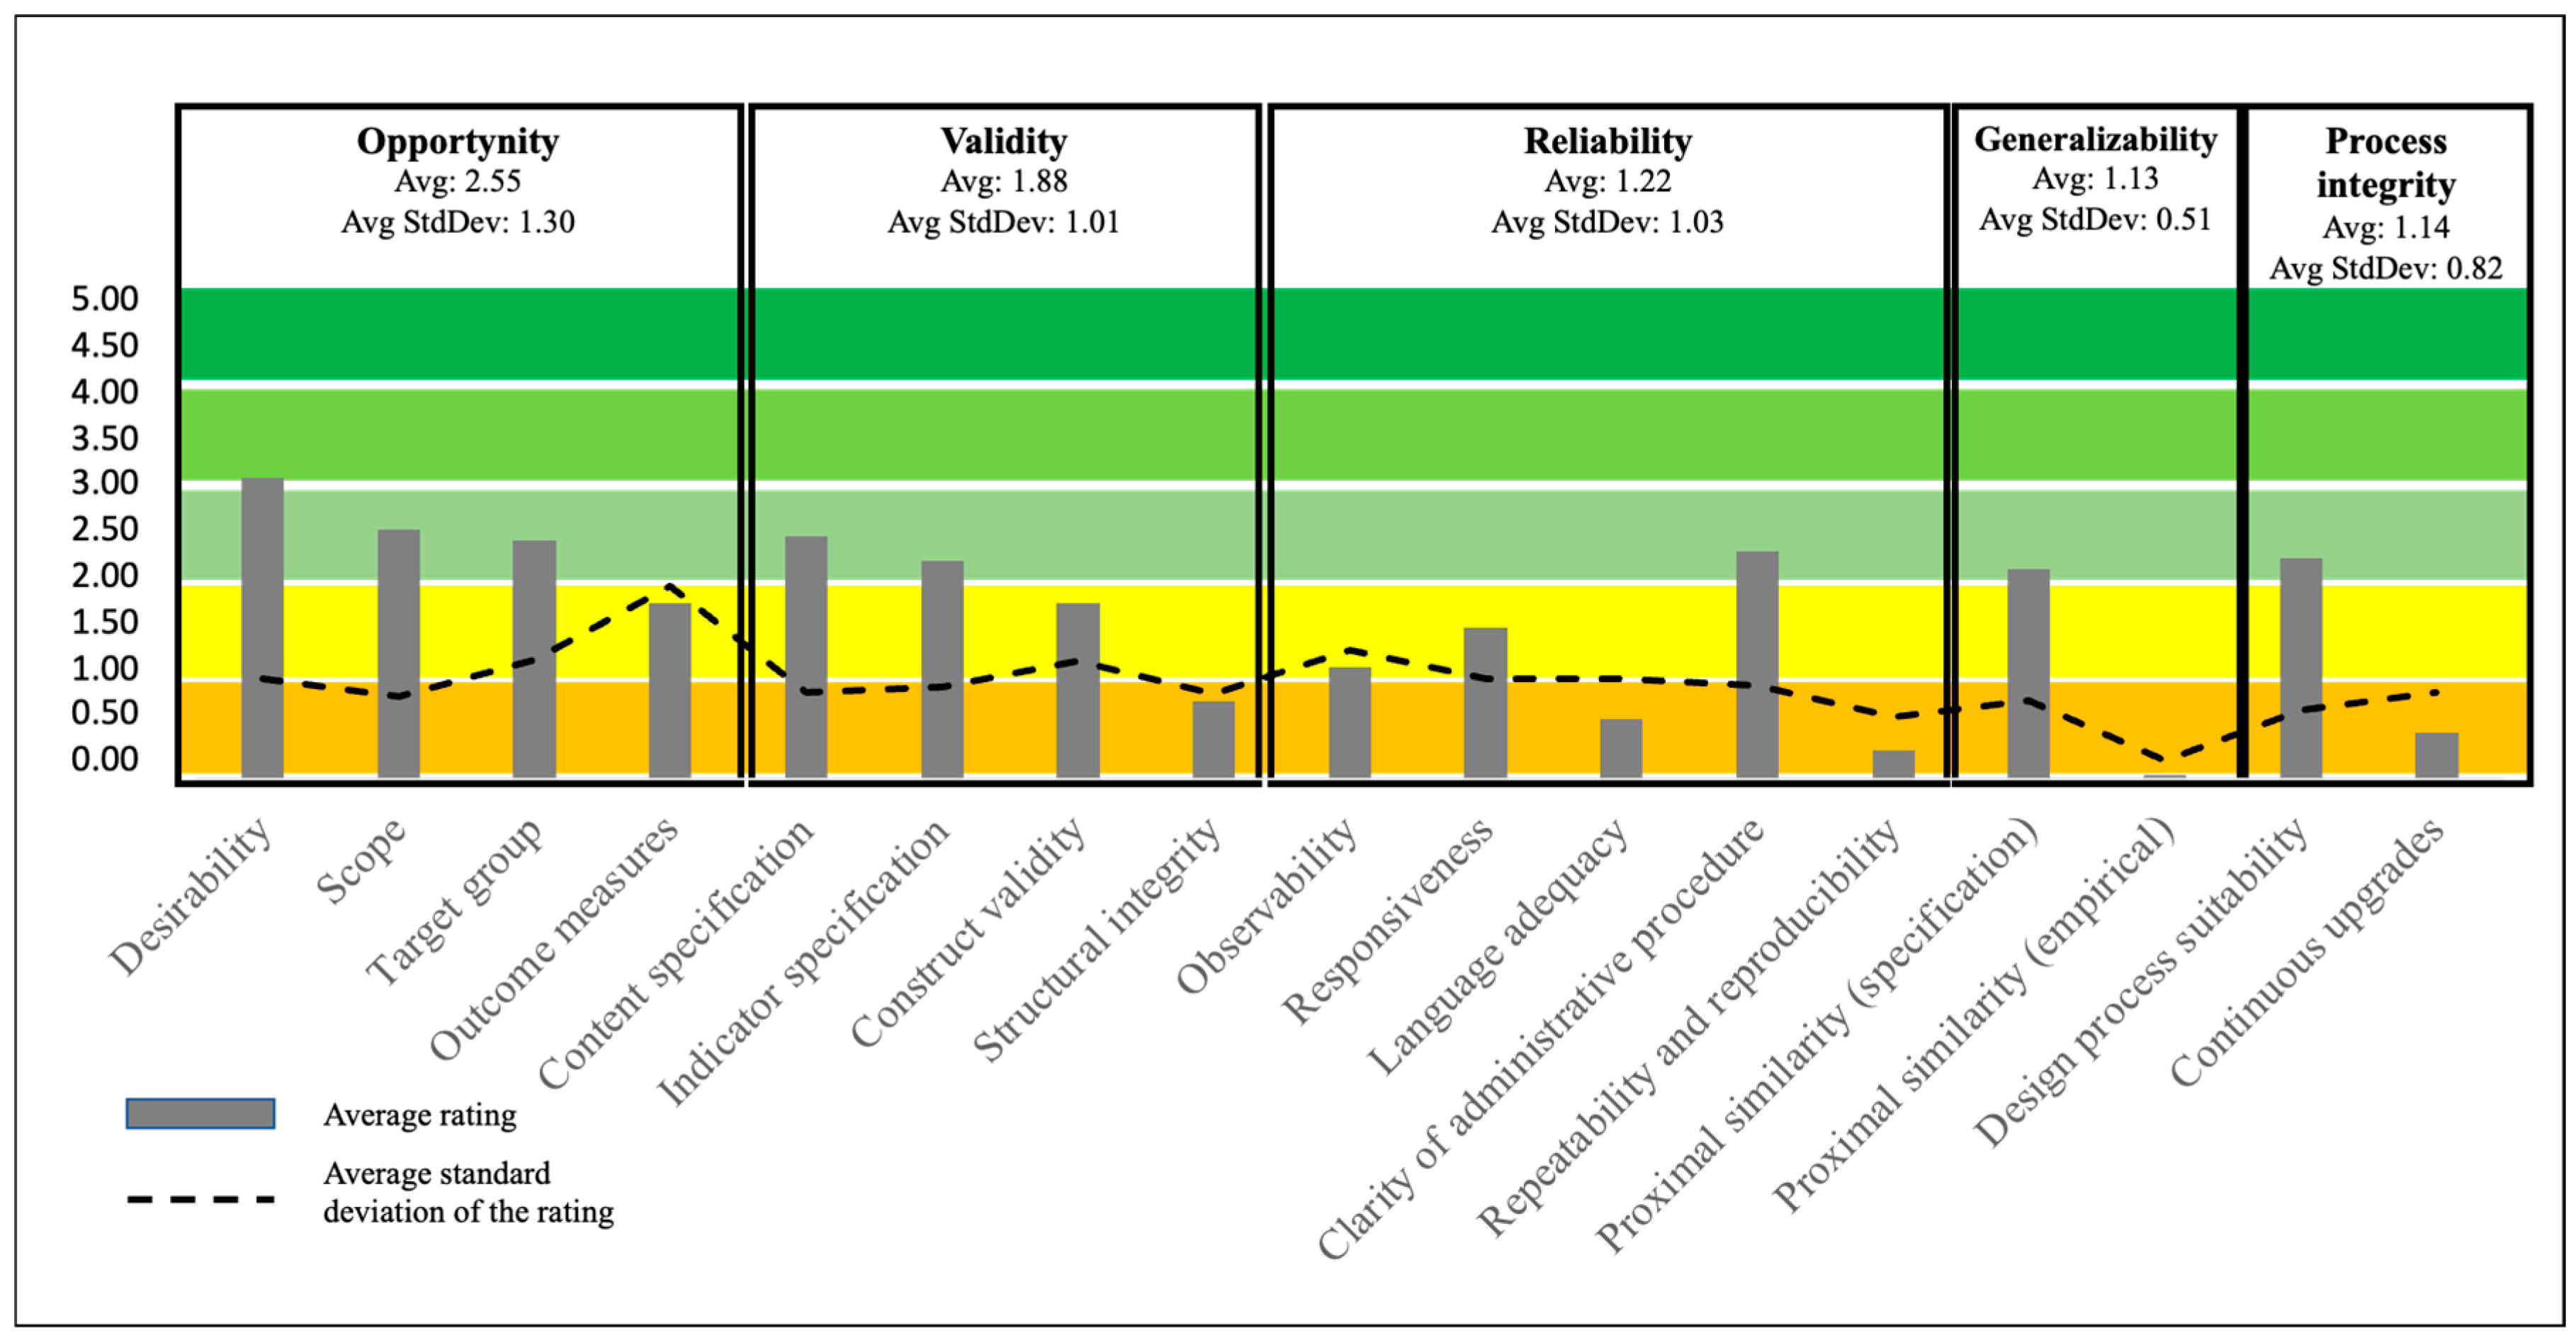
5.3. Cross-Model Patterns and Systematic Weaknesses
- 1.
- Opportunity is partially satisfied in many models, yet outcome variables are frequently underspecified, limiting construct testing.
- 2.
- Validity weaknesses are widespread, particularly regarding:
- ○
- Empirical construct validation;
- ○
- Justification of indicator inclusion;
- ○
- Testing of structural integrity (MECE).
- 3.
- Reliability is inconsistently addressed, with limited evidence of:
- ○
- Observability testing;
- ○
- Inter-rater reliability assessment;
- ○
- Repeatability and reproducibility (R&R) testing.
- 4.
- Generalizability remains the weakest dimension, as very few models demonstrate empirical validation beyond their original application context.
- 5.
- Process Integrity is often underreported, with limited transparency in design logic or iterative refinement.
- Criterion-Level Performance Patterns
- ○
- Content specification;
- ○
- Indicator specification;
- ○
- Clarity of administrative procedures;
- ○
- Theoretical definition of proximal context;
- ○
- Justification of design logic.
- Empirical Rigor as a Systematic Weakness
- ○
- Empirical construct validity;
- ○
- Structural integrity testing (MECE);
- ○
- Language adequacy testing;
- ○
- Empirical proximal similarity (cross-context validation);
- ○
- Demonstrated continuous improvement of the model.
- Variability Across Criteria
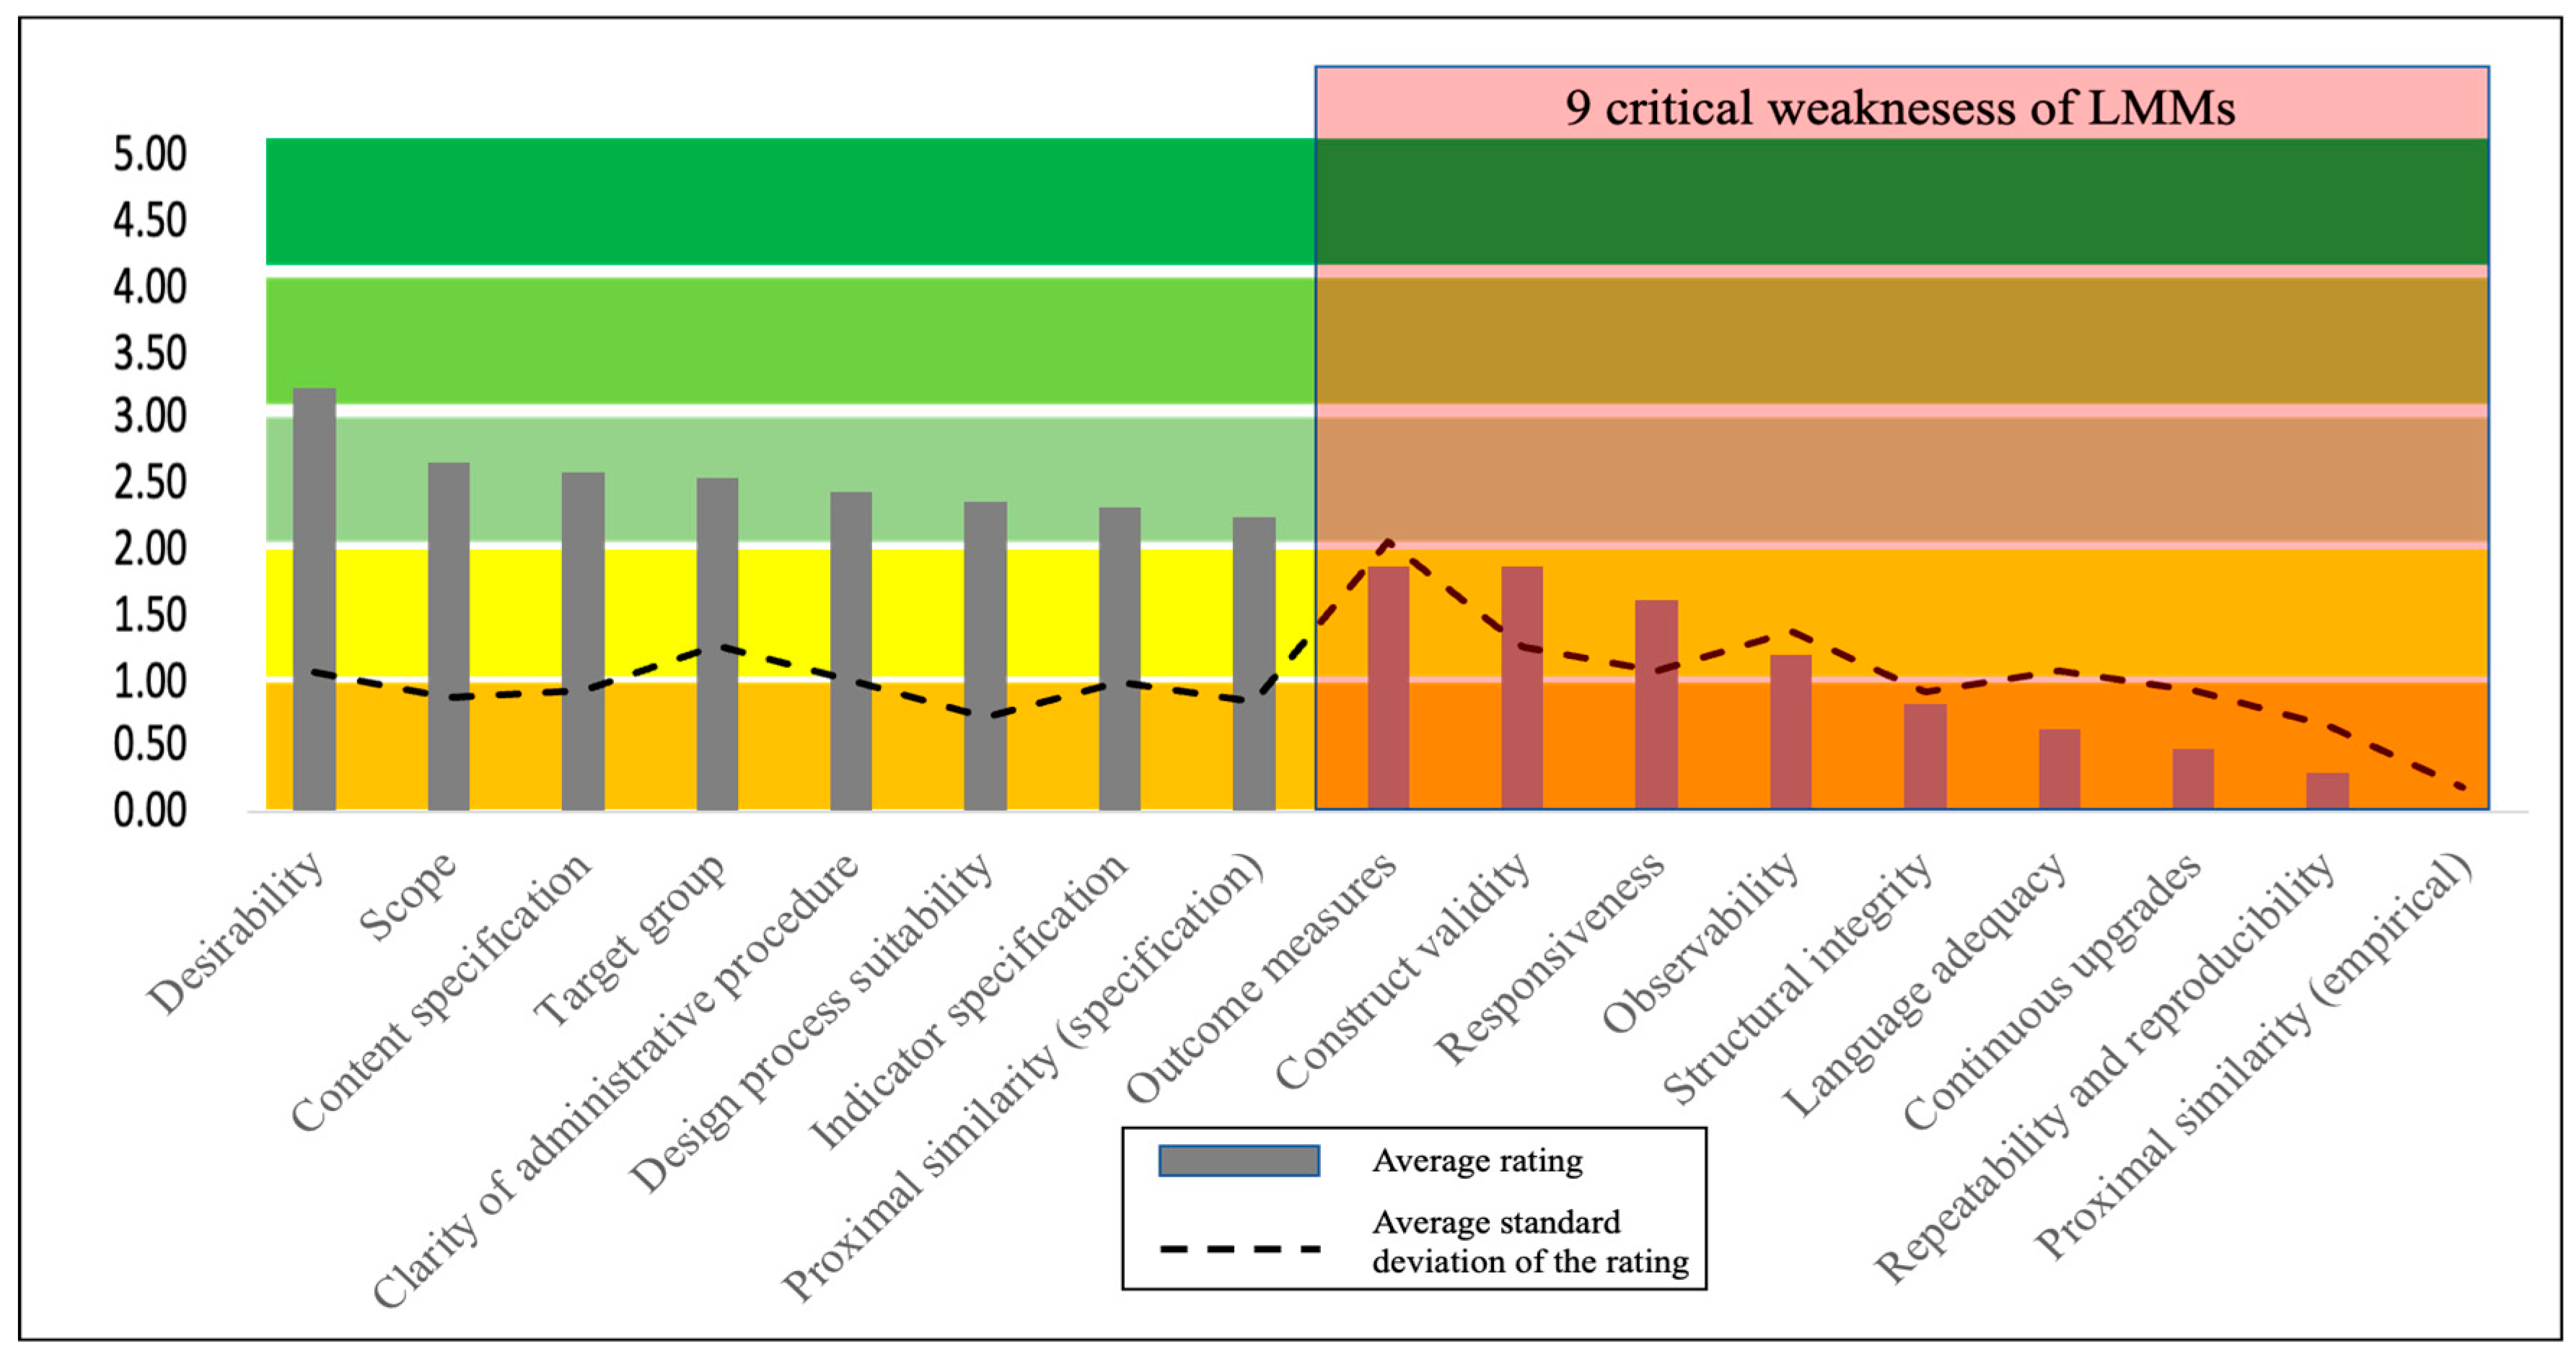
5.4. RQ3—What Are the Critical Methodological Weaknesses?
- ○
- Empirical construct validation.
- ○
- Structural integrity testing (MECE).
- ○
- Reliability testing (e.g., R&R, language adequacy.
- ○
- Empirical cross-context validation.
- ○
- Demonstrated iterative refinement.
5.5. RQ4—How Can Future Lean Maturity Models Be Improved When Developing LMMs for Logistics and Supply Chain Industries?
- Repeatability and Reproducibility (R&R)
- Empirical Proximal Similarity
6. Discussion
6.1. Theoretical Implications
6.2. Implications for Managers, Practitioners, and Policymakers
6.3. Limitations and Future Research Directions
7. Conclusions
Author Contributions
Funding
Institutional Review Board Statement
Informed Consent Statement
Data Availability Statement
Acknowledgments
Conflicts of Interest
References
- Ohno, T. Toyota Production System: Beyond Large-Scale Production; Productivity Press: Cambridge, MA, USA, 1988. [Google Scholar]
- Womack, J.; Jones, D.; Roos, D. The Machine That Changed the World; Rawson Associates: New York, NY, USA, 1990. [Google Scholar]
- Krafcik, J.F. Triumph of the lean production system. Sloan Manag. Rev. 1988, 30, 41–52. [Google Scholar]
- Karlsson, C.; Åhlström, P. Assessing changes towards lean production. Int. J. Oper. Prod. Manag. 1996, 16, 24–41. [Google Scholar] [CrossRef] [Scilit]
- Shah, R.; Ward, P.T. Defining and developing measures of lean production. J. Oper. Manag. 2007, 25, 785–805. [Google Scholar] [CrossRef] [Scilit]
- Liker, J.K.; Hoseus, M. Toyota Culture, the Heart and Soul of the Toyota Way; McGraw Hill Professional: New York, NY, USA, 2008. [Google Scholar]
- Rother, M. Toyota Kata: Managing People for Improvement, Adaptiveness, and Superior Results; McGraw-Hill: New York, NY, USA, 2010. [Google Scholar]
- Mann, D. Creating a Lean Culture, Tools to Sustain Lean Conversions, 3rd ed.; Taylor and Francis Group: Abingdon, UK, 2014. [Google Scholar]
- Baggaley, B. Using strategic performance measures to accelerate Lean performance. Cost Manag. 2006, 20, 36–45. [Google Scholar]
- Sharma, M.; Bhagwat, R. An integrated BSC-AHP approach for supply chain management evaluation. Meas. Bus. Excell. 2007, 11, 57–69. [Google Scholar] [CrossRef] [Scilit]
- Schonberger, R.J. Lean performance management (metrics don’t add up). Cost Manag. 2008, 22, 5–10. [Google Scholar]
- Pakdil, F.; Leonard, K.M. Criteria for a lean organisation: Development of a lean assessment tool. Int. J. Prod. Res. 2014, 52, 4587–4607. [Google Scholar] [CrossRef] [Scilit]
- Narayanamurthy, G.; Gurumurthy, A. Leanness assessment: A literature review. Int. J. Oper. Prod. Manag. 2016, 36, 1115–1160. [Google Scholar] [CrossRef] [Scilit]
- Cocca, P.; Marciano, F.; Alberti, M.; Schiavini, D. Leanness measurement methods in manufacturing organisations: A systematic review. Int. J. Prod. Res. 2018, 57, 5103–5118. [Google Scholar] [CrossRef] [Scilit]
- Klundt, E.; Towers, N.; Bechkoum, K. Lean and Agile Supply Strategies in Distribution Centres to Deliver Value-Added Services (VAS). Logistics 2024, 8, 67. [Google Scholar] [CrossRef] [Scilit]
- Atieh, A.A.; Abu Hussein, A.; Al-Jaghoub, S.; Alheet, A.F.; Attiany, M. The Impact of Digital Technology, Automation, and Data Integration on Supply Chain Performance: Exploring the Moderating Role of Digital Transformation. Logistics 2025, 9, 11. [Google Scholar] [CrossRef] [Scilit]
- Roman, E.-A.; Stere, A.-S.; Roșca, E.; Radu, A.-V.; Codroiu, D.; Anamaria, I. State of the Art of Digital Twins in Improving Supply Chain Resilience. Logistics 2025, 9, 22. [Google Scholar] [CrossRef] [Scilit]
- Nunes, L.J.R. Reverse Logistics as a Catalyst for Decarbonizing Forest Products Supply Chains. Logistics 2025, 9, 17. [Google Scholar] [CrossRef] [Scilit]
- Soares, G.P.; Tortorella, G.; Bouzon, M.; Tavana, M. A fuzzy maturity-based method for lean supply chain management assessment. Int. J. Lean Six Sigma 2021, 12, 1017–1045. [Google Scholar] [CrossRef] [Scilit]
- Gomaa, A.H. Boosting Supply Chain Effectiveness with Lean Six Sigma. Am. J. Manag. Sci. Eng. 2024, 9, 156–171. [Google Scholar] [CrossRef] [Scilit]
- Ferraro, S.; Leoni, L.; Cantini, A.; De Carlo, F. Trends and Recommendations for Enhancing Maturity Models in Supply Chain Management and Logistics. Appl. Sci. 2023, 13, 9724. [Google Scholar] [CrossRef] [Scilit]
- Malmbrandt, M.; Åhlström, P. An instrument for assessing lean service adoption. Int. J. Oper. Prod. Manag. 2013, 33, 1131–1165. [Google Scholar] [CrossRef] [Scilit]
- Almomani, M.A.; Abdelhadi, A.; Mumani, A.; Momani, A.; Aladeemy, M. A proposed integrated model of lean assessment and analytical hierarchy process for a dynamic road map of lean implementation. Int. J. Adv. Manuf. Technol. 2014, 72, 161–172. [Google Scholar] [CrossRef] [Scilit]
- Doolen, T.L.; Hacker, M.E. A review of lean assessment in organizations: An exploratory study of lean practices by electronics manufacturers. J. Manuf. Syst. 2005, 24, 55. [Google Scholar] [CrossRef] [Scilit]
- Gurumurthy, A.; Kodali, R. Application of benchmarking for assessing the lean manufacturing implementation. Benchmarking Int. J. 2009, 16, 274–308. [Google Scholar] [CrossRef] [Scilit]
- Diamantopoulos, A.; Winklhofer, H.M. Index construction with formative indicators: An alternative to scale development. J. Mark. Res. 2001, 38, 269–277. [Google Scholar] [CrossRef] [Scilit]
- Bollen, K.; Lennox, R. Conventional wisdom on measurement: A structural equation perspective. Psychol. Bull. 1991, 110, 305–314. [Google Scholar] [CrossRef]
- Leyer, M.; Moormann, J. How lean are financial service companies really? Empirical evidence from a large scale study in Germany. Int. J. Oper. Prod. Manag. 2014, 34, 1366–1388. [Google Scholar] [CrossRef] [Scilit]
- Pasian, B.; Sankaran, S.; Boydell, S. Project management maturity: A critical analysis of existing and emergent factors. Int. J. Manag. Proj. Bus. 2012, 5, 146–157. [Google Scholar] [CrossRef] [Scilit]
- Mettler, T. Thinking in Terms of Design Decisions When Developing Maturity Models. Int. J. Strateg. Decis. Sci. 2010, 1, 76–87. [Google Scholar] [CrossRef] [Scilit]
- Pöppelbuß, J.; Röglinger, M. What makes a useful maturity model? A framework of general design principles for maturity models and its demonstration in business process management. In Proceedings of the ECIS 2011, Helsinki, Finland, 9–11 June 2011. [Google Scholar]
- Santos-Neto, J.B.S.; Costa, A.P.C.S. Enterprise maturity models: A systematic literature review. Enterp. Inf. Syst. 2019, 13, 719–769. [Google Scholar] [CrossRef] [Scilit]
- Abdi, F. Hospital leanness assessment model: A Fuzzy MULTI-MOORA decision-making approach. J. Ind. Syst. Eng. 2018, 11, 37–59. [Google Scholar]
- Soriano-Meier, H.; Forrester, P.L. A model for evaluating the degree of leanness of manufacturing firms. Integr. Manuf. Syst. 2002, 13, 104–109. [Google Scholar] [CrossRef] [Scilit]
- Yadav, V.; Khandelwal, G.; Jain, R.; Mittal, M.L. Development of leanness index for SMEs. Int. J. Lean Six Sigma 2018, 10, 397–410. [Google Scholar] [CrossRef] [Scilit]
- Kaltenbrunner, M.; Mathiassen, S.E.; Bengtsson, L.; Engström, M. Lean maturity and quality in primary care. J. Health Organ. Manag. 2019, 33, 141–154. [Google Scholar] [CrossRef] [Scilit]
- Bagozzi, R.P. (Ed.) Structural equation models in marketing research: Basic principles. In Principles of Marketing Research; Blackwell: Oxford, UK, 1994; pp. 317–385. [Google Scholar]
- Santos Bento, G.; Tontini, G. Developing an instrument to measure lean manufacturing maturity and its relationship with operational performance. Total Qual. Manag. Bus. Excell. 2018, 29, 977–995. [Google Scholar] [CrossRef] [Scilit]
- Urban, W. The Lean Management Maturity Self-assessment Tool Based on Organizational Culture Diagnosis. Procedia Soc. Behav. Sci. 2015, 213, 728–733. [Google Scholar] [CrossRef] [Scilit]
- Vidyadhar, R.; Sudeep Kumar, R.; Vinodh, S.; Antony, J. Application of fuzzy logic for leanness assessment in SMEs: A case study. J. Eng. Des. Technol. 2016, 14, 78–103. [Google Scholar] [CrossRef] [Scilit]
- Setianto, P.; Haddud, A. A Maturity Assessment of Lean Development Practices in Manufacturing Industry. Int. J. Adv. Oper. Manag. 2016, 8, 294–322. [Google Scholar] [CrossRef] [Scilit]
- de Bruin, T.; Rosemann, M.; Freeze, R.; Kulkarni, U. Understanding the main phases of developing a maturity assessment model. In Proceedings of the Australasian Conference on Information Systems (ACIS), Sydney, Australia, 30 November–2 December 2005. [Google Scholar]
- Vinodh, S.; Chintha, S.K. Leanness assessment using multi-grade fuzzy approach. Int. J. Prod. Res. 2011, 49, 431–445. [Google Scholar] [CrossRef] [Scilit]
- Bijl, A.; Ahaus, K.; Ruël, G.; Gemmel, P.; Meijboom, B. Role of lean leadership in the lean maturity—Second-order problem-solving relationship: A mixed methods study. BMJ Open 2019, 9, e026737. [Google Scholar] [CrossRef] [Scilit] [PubMed]
- Kollberg, B.; Dahlgaard, J.J.; Brehmer, P. Measuring lean initiatives in health care services: Issues and findings. Int. J. Prod. Perform. Manag. 2007, 56, 7–24. [Google Scholar] [CrossRef] [Scilit]
- Azevedo, S.G.; Govindan, K.; Carvalho, H.; Cruz-Machado, V. An integrated model to assess the leanness and agility of the automotive industry. Resour. Conserv. Recycl. 2012, 66, 85–94. [Google Scholar] [CrossRef] [Scilit]
- Maasouman, M.A.; Demirli, K. Development of a lean maturity model for operational level planning. Int. J. Adv. Manuf. Technol. 2015, 83, 1171–1188. [Google Scholar] [CrossRef] [Scilit]
- Nightingale, D.J.; Mize, J.H. Development of a lean enterprise transformation maturity model. Inf. Knowl. Syst. Manag. 2002, 3, 15. [Google Scholar] [CrossRef] [Scilit]
- Bhasin, S. Measuring the Leanness of an organisation. Int. J. Lean Six Sigma 2011, 2, 55–74. [Google Scholar] [CrossRef] [Scilit]
- Kumar, S.; Singh, B.; Qadri, M.A.; Kumar, Y.V.S.; Haleem, A. A framework for comparative evaluation of lean performance of firms using fuzzy TOPSIS. Int. J. Prod. Qual. Manag. 2013, 11, 371. [Google Scholar] [CrossRef] [Scilit]
- Nunnally, J.C.; Bernstein, I.H. Psychometric Theory, 3rd ed.; McGraw-Hill: New York, NY, USA, 1994. [Google Scholar]
- Kimberlin, C.L.; Winterstein, A.G. Validity and reliability of measurement instruments used in research. Am. J. Health Syst. Pharm. 2008, 65, 2276–2284. [Google Scholar] [CrossRef] [Scilit]
- Pekkola, S.; Hildén, S.; Rämö, J. A maturity model for evaluating an organisation’s reflective practices. Meas. Bus. Excell. 2015, 19, 17–29. [Google Scholar] [CrossRef] [Scilit]
- Loyd, N.; Harris, G.; Gholston, S.; Berkowitz, D. Development of a lean assessment tool and measuring the effect of culture from employee perception. J. Manuf. Technol. Manag. 2020, 31, 1439–1456. [Google Scholar] [CrossRef] [Scilit]
- Diamantopoulos, A.; Siguaw, J.A. Formative versus reflective indicators in organizational measure development: A comparison and empirical illustration. Br. J. Manag. 2006, 17, 263–282. [Google Scholar] [CrossRef] [Scilit]
- Sunder, M.V.; Ganesh, L.S. Identification of the Dynamic Capabilities Ecosystem—A Systems Thinking Perspective. Group Organ. Manag. 2020, 46, 105960112096363. [Google Scholar] [CrossRef] [Scilit]
- Hauser, R.M.; Goldberger, A.S. The treatment of unobservable variables in path analysis. Sociol. Methodol. 1971, 3, 81. [Google Scholar] [CrossRef] [Scilit]
- Jöreskog, K.G.; Goldberger, A.S. Estimation of a model with multiple indicators and multiple causes of a single latent variable. J. Am. Stat. Assoc. 1975, 70, 631. [Google Scholar]
- Solli-Sæther, H.; Gottschalk, P. The Modeling Process for Stage Models. J. Organ. Comput. Electron. Commer. 2010, 20, 279–293. [Google Scholar] [CrossRef] [Scilit]
- Tarhan, A.; Turetken, O.; Reijers, H.A. Business process maturity models: A systematic literature review. Inf. Softw. Technol. 2016, 75, 122–134. [Google Scholar] [CrossRef] [Scilit]
- Singh, B.; Garg, S.K.; Sharma, S.K. Development of index for measuring leanness: Study of an Indian auto component industry. Meas. Bus. Excell. 2010, 14, 46–53. [Google Scholar] [CrossRef] [Scilit]
- Galeazzo, A. Degree of leanness and lean maturity: Exploring the effects on financial performance. Total Qual. Manag. Bus. Excell. 2019, 32, 758–776. [Google Scholar] [CrossRef] [Scilit]
- Maier, A.M.; Moultrie, J.; Clarkson, P.J. Assessing Organizational Capabilities: Reviewing and Guiding the Development of Maturity Grids. IEEE Trans. Eng. Manag. 2012, 59, 138–159. [Google Scholar] [CrossRef] [Scilit]
- Crocker, L.; Algina, J. Introduction to Classical and Modern Test Theory; Harcourt Brace Jovanovich: Orlando, FL, USA, 1986. [Google Scholar]
- Röglinger, M.; Pöppelbuß, J.; Becker, J. Maturity models in business process management. Bus. Process Manag. J. 2012, 18, 328–346. [Google Scholar] [CrossRef] [Scilit]
- Bertrand, M.; Mullainathan, S. Do people mean what they say? Implications for subjective survey data. Am. Econ. Rev. 2001, 91, 67–72. [Google Scholar] [CrossRef] [Scilit]
- Sánchez, A.M.; Pérez, M. The use of lean indicators for operations management in services. Int. J. Serv. Technol. Manag. 2004, 5, 465. [Google Scholar] [CrossRef] [Scilit]
- Maier, A.M.; Moultrie, J.; Clarkson, P.J. Developing maturity grids for assessing organisational capabilities: Practitioner guidance. In Proceedings of the 4th International Conference on Management Consulting, Academy of Management (MCD), Vienna, Austria, 11–13 June 2009. [Google Scholar]
- Zanon, L.G.; Ulhoa, T.F.; Esposto, K.F. Performance measurement and lean maturity: Congruence for improvement. Prod. Plan. Control 2020, 32, 760–774. [Google Scholar] [CrossRef] [Scilit]
- Moody, D.L.; Shanks, G.G. What makes a good data model? Evaluating the quality of entity relationship models. In Entity-Relationship Approach—ER ’94 Business Modelling and Re-Engineering; Lecture Notes in Computer Science; Springer: Berlin/Heidelberg, Germany, 1994; pp. 94–111. [Google Scholar]
- Becker, J.; Rosemann, M.; von Uthmann, C. Guidelines of Business Process Modeling. In Business Process Management; Springer: Berlin/Heidelberg, Germany, 2000; pp. 30–49. [Google Scholar]
- Woodall, W.H.; Borror, C.M. Some relationships between gage R&R criteria. Qual. Reliab. Eng. Int. 2008, 24, 99–106. [Google Scholar]
- Fleiss, J.L. Measuring nominal scale agreement among many raters. Psychol. Bull. 1971, 76, 378–382. [Google Scholar] [CrossRef] [Scilit]
- Hallgren, K.A. Computing inter-rater reliability for observational data: An overview and tutorial. Tutor. Quant. Methods Psychol. 2012, 8, 23–34. [Google Scholar] [CrossRef] [Scilit]
- Campbell, D.T. Relabeling internal and external validity for the applied social sciences. In Advances in Quasi-Experimental Design and Analysis; Trochim, W., Ed.; Jossey-Bass: San Francisco, CA, USA, 1986; pp. 67–77. [Google Scholar]
- Geertz, C. (Ed.) Thick description: Toward an interpretive theory of culture. In The Interpretation of Cultures; Basic Books: New York, NY, USA, 1973; Chapter 2. [Google Scholar]
- Lincoln, Y.; Guba, E. Naturalistic Inquiry; Sage: Beverly Hills, CA, USA, 1985. [Google Scholar]
- Becker, J.; Knackstedt, R.; Pöppelbuß, J. Developing Maturity Models for IT Management. Bus. Inf. Syst. Eng. 2009, 1, 213–222. [Google Scholar] [CrossRef] [Scilit]
- Wendler, R. The maturity of maturity model research: A systematic mapping study. Inf. Softw. Technol. 2012, 54, 1317–1339. [Google Scholar] [CrossRef] [Scilit]
- Sezen, B.; Karakadilar, I.S.; Buyukozkan, G. Proposition of a model for measuring adherence to lean practices: Applied to Turkish automotive part suppliers. Int. J. Prod. Res. 2012, 50, 3878–3894. [Google Scholar] [CrossRef] [Scilit]
- Paulk, M.C.; Curtis, B.; Chrissis, M.B.; Weber, C.V. The Capability Maturity Model for Software, version 1.1. No. CMU/SEI-93-TR-24. Software Engineering Institute: Pittsburgh, PA, USA, 1993.
- Van De Ven, A.H.; Poole, M.S. Explaining Development and Change in Organizations. Acad. Manag. Rev. 1995, 20, 510–540. [Google Scholar] [CrossRef] [Scilit]
- Monteiro, E.L.; Maciel, R.S.P. Maturity models architecture: A large systematic mapping. iSys Braz. J. Inf. Syst. 2020, 13, 110–140. [Google Scholar] [CrossRef] [Scilit]
- Reis, T.L.; Mathias, M.A.S.; de Oliveira, O.J. Maturity models: Identifying the state-of-the-art and the scientific gaps from a bibliometric study. Scientometrics 2016, 110, 643–672. [Google Scholar] [CrossRef] [Scilit]
- Vallerand, J.; Lapalme, J.; Moïse, A. Analysing enterprise architecture maturity models: A learning perspective. Enterp. Inf. Syst. 2015, 11, 859–883. [Google Scholar] [CrossRef] [Scilit]
- ISO/IEC 33004; Information Technology–Process Assessment–Requirements for Process Reference, Process Assessment, and Maturity Models. ISO: Geneva, Switzerland, 2015.
- Moher, D.; Liberati, A.; Tetzlaff, J.; Altman, D.G. Preferred reporting items for systematic reviews and meta-analyses: The PRISMA statement. PLoS Med. 2009, 6, e1000097. [Google Scholar] [CrossRef] [Scilit]
- Koo, T.K.; Li, M.Y. A guideline of selecting and reporting intraclass correlation coefficients for reliability research. J. Chiropr. Med. 2016, 15, 155–163. [Google Scholar] [CrossRef] [Scilit]
- Liker, J.K. The Toyota Way–14 Management Principles from the World’s Greatest Manufacturer; McGraw-Hill: New York, NY, USA, 2004. [Google Scholar]



| Criteria Descriptions | ||
|---|---|---|
| 1. Opportunity | 1.1 | Justified desirability 1.1.a: How measurement of maturity in the given domain (e.g., lean management) leads to business benefits should be justified. |
| 1.2 | Defined scope 1.2.a: Scope of the domain should be clearly defined by stating its boundaries. 1.2.b: If similar domains exist, a differentiation should be made (e.g., lean vs. TQM). | |
| 1.3 | Defined target group 1.3.a: Target group should be clearly defined according to where data is collected from. 1.3.b: Qualifications of the target group should be stated. 1.3.c: Qualifications of the raters should be stated when self-assessment tools are suggested. | |
| 1.4 | Specified outcome measures 1.4.a: Stated business benefits in criteria 1.1 should be converted to measurable outcome variable(s) (e.g., lead time, waste reduction, inventory reduction in lean maturity). These defined outcome variables enable testing the model for construct validity (criteria 2.2 and 2.3). | |
| 2. Validity | 2.1 | Specified content 2.1.a: Domain components that represent the construct (e.g., lean management) should be specified. 2.1.b: Content within each domain component should be clearly defined. 2.1.c: Inclusion of each domain component should be justified based on its potential positive contribution to defined outcome measures in criteria 1.4. |
| 2.2 | Specified indicators 2.2.a: The indicators specified should fully represent the specified domain components specified in criteria 2.1. 2.2.b: Inclusion of the specified indicators should be justified for their potential contribution to improving the outcome measures specified in criterion 1.4. | |
| 2.3 | Tested for construct validity 2.3.a: Theoretical construct validity should be achieved by defining the maturity stage definitions in a clear path of meaningful hierarchical progression that leads to improvement in defined outcome variables in criterion 1.4. 2.3.b: Empirical construct validity should be proven with empirical data, that progressing along the stages (maturing) is positively correlated to improvements in the defined outcome variables in criterion 1.4. | |
| 2.4 | Tested for structural integrity 2.4.a: All the specified domain components and indicators within them should be tested for mutual exclusiveness and collective exhaustiveness (MECE). | |
| 3. Reliability | 3.1 | Tested for observability 3.1.a: Specified indicators should be defined with observable artifacts. |
| 3.2 | Tested for responsiveness 3.2.a: The stage definitions should be precise in providing the rater with the ability to discriminate between the maturity levels. | |
| 3.3 | Tested for language adequacy 3.3.a: The language used in indicators and stage definitions should be understandable to the raters. | |
| 3.4 | Defined administrative procedure 3.4.a: User guidelines/administrative procedure on how the maturity model is to be used should be clearly outlined. | |
| 3.5 | Tested for repeatability and reproducibility (R&R) 3.5.a: The MM should be tested for R&R before full deployment. Gage R&R techniques used in the six sigma method or Kappa values are recommended. | |
| 4. Generalizability | 4.1 | Theoretical proximal similarity defined 4.1.a: Proximal contexts should be stated where the MM is applicable in improving the specified outcome variables. |
| 4.2 | Empirical proximal similarity proven 4.2.a Construct validity of the MM should be proven within a proximal context outside of where the construct validity has been proven in the first study. | |
| 5. Process integrity | 5.1 | Design process suitability justified 5.1.a: The design process of the MM used should clearly be stated and how the steps within the design process have ensured meeting of criteria should be justified. |
| 5.2 | Model continuously improved 5.2.a: Evidence should be provided on how the MM has been improved as a result of pre-testing or suggestions for improvement should be stated post the use in the empirical study. |
| Specified outcome measures |
| Incremental lean maturity can lead to improvements in outcomes such as waste reduction, business growth, lead-time improvement, and enhanced employee and customer satisfaction. When developing industry-specific LMMs, outcome measures should be customized to reflect sector realities, for example, perfect order rates, customer lead times, and cash-to-cash cycle time in logistics and supply chain industries. |
| Tested for construct validity |
| It remains unclear whether lean maturity is conceptually well established within the logistics and supply chain literature. Although multiple measurement approaches exist, current best practice favors generic maturity stage definitions that were largely developed in manufacturing contexts. Further research should aim to define a meaningful maturity path grounded in the progression of organizations advanced in lean implementation within logistics and supply chain environments. Toyota is often cited as the lean benchmark, yet its most instructive lessons for logistics practitioners may lie not in its production system but in its supplier development practices, inbound logistics coordination, and distribution network discipline, areas where lean maturity progression is observable and consequential. A study integrating Toyota’s supply chain journey with lessons from other organizations advanced in logistics lean capability, validated through qualified expert input, is recommended to define maturity stages for each domain component or indicator. Where such evidence is limited, generic stage definitions may serve as a pragmatic alternative. To establish construct validity, logistics and supply chain enterprises should be examined longitudinally across statistically sufficient rounds to test the relationship between incremental maturity and network-level outcome improvements. This requires systematic collection of both indicator data, such as problem-solving rates, visual management usage, lean tool application, and leadership engagement, and logistics-specific outcome data, such as perfect order rates, delivery lead times, inventory turns, and waste reduction across supply chain interfaces. Although surveys may appear convenient, they are weak in addressing observability, responsiveness, and repeatability and reproducibility. Instead, onsite observations, objective evidence collection, and validation through structured interviews across multiple supply chain sites are recommended to strengthen measurement rigor. |
| Tested for responsiveness |
| As discussed earlier, the concept of maturing in lean management has not been fully understood, and this is particularly true in logistics and supply chain contexts where lean maturity research remains nascent. In such a context, it would be difficult to establish stage definitions with high responsiveness. However, developers of LMMs can pre-test their proposed stage definitions before using them in the study. A sample of lean maturity scenarios representing different indicators, such as visual management, use of lean tools, problem-solving routines, and supply chain coordination practices, can be used to test stage definitions using a sample of qualified raters drawn from logistics and supply chain functions. |
| Tested for observability |
| Many existing LMMs define indicators at a conceptual level without specifying observable artifacts, for example, smooth information flow, team-based decision-making, and personnel interchangeability. Such abstraction makes a consistent rating difficult. Instead, indicators should be anchored in observable artifacts that enable reliable assessment. In logistics and supply chain contexts, these may include visible performance management boards at warehouse and distribution center levels, daily operational huddles across shift teams, documented root cause validation records, synchronized replenishment signals with suppliers, transparent leadership coaching schedules, cross-site lessons learned documentation, structured employee-led problem-solving practices, and supplier delivery performance review records. |
| Tested for structural integrity |
| LMMs employ diverse domain components, reflecting a lack of consensus on how lean management should be structurally decomposed. Many models use tools and practices such as JIT and Kanban as domain components, although these are not mutually exclusive and are often hierarchically embedded. Such structuring compromises MECE and limits scientific usability. Domain components should instead be grounded in lean principles, which are inherently more mutually exclusive and collectively exhaustive. Widely recognized alternatives include the four-P model [6], the five lean values [2], and Liker’s 14 principles [89]. In logistics and supply chain contexts, these principle-based frameworks can be meaningfully translated into domain components such as inbound flow management, inventory discipline, outbound fulfillment, supplier integration, information flow, and continuous improvement culture, each of which represents a distinct and non-overlapping capability area. Once expanded into indicators, MECE should be tested through a qualified expert assessment by asking whether the indicators fully represent the domain component and whether they are mutually exclusive. Indicator refinement should continue until an acceptable expert consensus is achieved. |
| Tested for language adequacy |
| As a first step, we recommend converting any lean jargon to the normal business language used in the industry context where the LMM is developed. For example, ‘the distribution center operates with heijunka-based inbound scheduling’ can be understood differently even among qualified lean experts. This can be written as ‘the distribution center receives and processes inbound shipments according to a levelled daily schedule that matches downstream demand’. Once written, these indicator statements should be tested for language adequacy by using a sample of raters before the actual investigation. |
| Model continuously improved |
| We recommend that the studies clearly state the steps taken at each phase of the design process to improve the overall fit-for-purpose. For example, showing what was refined after pre-testing the instrument for language adequacy, responsiveness, RandR, etc., and listing the weaknesses identified from the empirical study. |
| Tested for repeatability and reproducibility (RandR) |
| The recommendations provided under observability, responsiveness, and language adequacy directly contribute to ensuring increased RandR. Once the indicators are tested for these three criteria, we recommend an RandR test to verify the final measure of reliability. A set of sample scenarios drawn from realistic logistics and supply chain settings can be used among a sample group of qualified raters to pre-test for RandR. As mentioned in Table 1, Kappa values or gauge RandR tests used in the six sigma method can be used. Further, we recommend that the actual investigation be conducted with multiple raters across different supply chain functions and facility types, as this would allow testing of inter-rater reliability on the actual collected data and reveal any systematic rating differences across warehousing, transport, and supplier management contexts. |
| Empirical proximal similarity proven |
| We recommend that this criterion be achieved via a follow-up study within a specified proximal context by establishing construct validity. In logistics and supply chain research, the original study should specify the operational context for which the LMM is developed, for example, a lean maturity model for third-party logistics providers, and prove its construct validity within a selected sample of comparable organizations. To prove generalizability, a follow-up study could be conducted in a different but proximal context, for example, a similar distribution network configuration, the same logistics sector in a different geographical setting, or a comparable supply chain tier, such as tier-one supplier networks. We agree that this criterion is a relatively high expectation from an academic instrument. However, in logistics and supply chain environments where operational configurations vary considerably across industries, regions, and network structures, demonstrated cross-context validity is what distinguishes a transferable measurement instrument from a single-use diagnostic tool. Such an achievement will increase not only the academic credibility of the instrument but also its acceptance among logistics practitioners and consulting professionals seeking reliable benchmarking tools. |
| The analysis of the nine critical weaknesses demonstrates that current LMMs are conceptually articulated but empirically underdeveloped. While many models define scope and structure, few provide robust evidence of construct validity, reliability, or cross-context applicability. As shown in Table 2, strengthening lean maturity assessment requires systematic attention to outcome specification, longitudinal validation, structural integrity, and formal reliability testing. Addressing these gaps is essential for transforming LMMs from descriptive frameworks into scientifically credible instruments capable of supporting evidence-based logistics and supply chain decision-making. |
Disclaimer/Publisher’s Note: The statements, opinions and data contained in all publications are solely those of the individual author(s) and contributor(s) and not of MDPI and/or the editor(s). MDPI and/or the editor(s) disclaim responsibility for any injury to people or property resulting from any ideas, methods, instructions or products referred to in the content. |
© 2026 by the authors. Licensee MDPI, Basel, Switzerland. This article is an open access article distributed under the terms and conditions of the Creative Commons Attribution (CC BY) license.
Share and Cite
Mirihagalla, P.; Vastag, G. Reproducibility Standards for Lean Maturity Models: Design Guidelines for Logistics Operations. Logistics 2026, 10, 122. https://doi.org/10.3390/logistics10060122
Mirihagalla P, Vastag G. Reproducibility Standards for Lean Maturity Models: Design Guidelines for Logistics Operations. Logistics. 2026; 10(6):122. https://doi.org/10.3390/logistics10060122
Chicago/Turabian StyleMirihagalla, Padmaka, and Gyula Vastag. 2026. "Reproducibility Standards for Lean Maturity Models: Design Guidelines for Logistics Operations" Logistics 10, no. 6: 122. https://doi.org/10.3390/logistics10060122
APA StyleMirihagalla, P., & Vastag, G. (2026). Reproducibility Standards for Lean Maturity Models: Design Guidelines for Logistics Operations. Logistics, 10(6), 122. https://doi.org/10.3390/logistics10060122