Communication

A Method for the Rapid Measurement of Alkylresorcinols in Flour, Bread and Related Products Based on 1H qNMR

Department of Pharmacy, Laboratory of Pharmacognosy and Natural Products Chemistry, National and Kapodistrian University of Athens, 15771 Athens, Greece
*
Author to whom correspondence should be addressed.
Foods 2020, 9(8), 1025; https://doi.org/10.3390/foods9081025
Submission received: 5 July 2020 / Revised: 21 July 2020 / Accepted: 21 July 2020 / Published: 31 July 2020
(This article belongs to the Special Issue Nuclear Magnetic Resonance in Food Analysis)

Abstract

:
The main objectives of the current work were to investigate differences among flours from traditionally preserved Greek varieties of cereals, and especially those of wheat, and in parallel, to correlate those potential differences with the presence of bioactive natural ingredients. In this context, we developed a new, fast, and simple method for the measurement of total 5-alkylresorcinols in cereals and related foods by qNMR. Several types of flour (white or whole-grain) coming from wheat, i.e., Triticum dicoccum, T. monococcum, T. aestivum, T. durum and T. turgidum, corn, barley, rye and oat from a certified producer in Greece were used either as raw materials or for the production of bread, pasta and flakes. A small portion of the flour or the corresponding product was extracted with DMSO-d6. The liquid part was directly analyzed by NMR (400 MHz). The simplicity of the NMR spectrum of the total extract and the lack of overlapping peaks permitted the development of a high throughput quantitative method for the measurement of total bioactive alkylresorcinols in less than 15 min. Grains, whole grain flours and breads from old varieties of T. dicoccum and T.monococcum showed high contents of alkylresorcinols (455–1148 mg/Kg), while the same compounds were completely absent from white flour and the corresponding bread. The term high-phenolic flour is proposed to distinguish among flour types.

1. Introduction

Wheat (Triticum spp.), olive trees and grapevines are considered to be the three basic plants of the Mediterranean diet; in particular, wheat is the most important plant in the history of human nutrition in Europe and the Middle East. Although famous bioactive small molecules like resveratrol or oleocanthal have been discovered in grape and olive oil, wheat products are not similarly known, from the consumer’s perspective, as sources of health-protective ingredients. However, alkylresorcinols (ARS), an important class of phytochemicals found in wheat, have attracted the interest of scientists in the last thirty years [1,2,3].
Alkylresorcinols, 1,3-dihydroxy-5-n-alkylbenzenes, are phenolic lipids found in some plant families, as well as in some algae, sponges, fungi and bacteria [2]. The main nutritional sources of alkylresorcinols are whole grain, bran of wheat and rye, with contents that may reach 1–4 g/kg of dry material [4,5,6,7,8,9,10]. ARS are adequately absorbed [11] and have exhibited interesting bioactivities in vitro, including direct antioxidative properties, lipoxygenase inhibition, inhibition of copper-induced LDL oxidation, DNA-strand scission, colon and prostate cancer cell growth inhibition and inhibition of lipase activity in the adipose tissue cells [3,12,13]. Despite being present in high amounts in specific cereals like wheat and rye, and despite their reported bioactivities and potential role in health protection, their concentration is not widely used for the determination of grain quality or the quality of the final food products. For example, the term high-phenolic olive oil has been used as a marketing description in recent years based on the EU health claim [14] and the big variability in the phenolic content of olive oil; however, nothing similar has happened for cereals. One possible reason for this is the limited data from human nutritional intervention studies, and another is the rather complex analytical methodologies required for the selective measurement of alkylresorcinols in cereal products [4,5,6,7,8,9,10,15,16,17,18,19,20].
To overcome the challenges associated with analytical methodologies, and based on previous successful applications of high-throughput analyses of bioactive small molecules in several foods (olive oil [21], beer [22], wine [23]) or botanic extracts [24,25,26], our target is to develop a fast and simple method for the measurement of total 5-alkylresorcinols in cereals and related foods (bread, pasta, wafers etc.) by qNMR. The developed method requires a total time of less than 15 min per sample, without the use of standards, and makes it possible, for the first time, to study several Greek traditional (autochthonous) wheat species and varieties and compare them with several commercial cereals, as well as other common beans and seeds. As previously reported, huge differences were observed among whole-grain and refined flours and respective final food products; interestingly, the grains of some local wheat varieties showed some of the highest reported concentrations.

2. Materials and Methods

2.1. General

All solvents were of analytical grade (Merck). Syringaldehyde (98% purity, Sigma-Aldrich, Steinem, Germany) was used as internal standard (IS). IS solution was prepared in DMSO-d6 at a concentration of 0.5 mg/mL and kept at 4 °C. The IS solution was left to reach room temperature prior to use. The quantitative determination of alkylresorcinols was performed using NMR spectroscopy with a Bruker Avance DRX 400 MHz. The 1H-NMR spectra were processed using either the MNova (Mestrelab Research) or the TOPSPIN software (Bruker, Billerica, MA, USA).

2.2. Plant Material and Processed Products

Several types of flour (white or whole-grain) originating from different wheat species, i.e., Triticum dicoccum, T. monococcum, T. aestivum, T. durum and T. turgidum, and other cereals, i.e., Zea mays (corn), Hordeum vulgare (barley), Secale cereale (rye), Avena sativa (oat) as well as the grains of the above plants and processed products (bread, flakes, wafers, pasta) and seeds of Lens culinaris, Lathyrus clymenum, Phaseolus vulgaris, Cicer arietinum, Linum usitatissimum and Fagopyrum esculentum were obtained from a certified producer in Greece (Antonopoulos farm, Dilofo). All plants were grown in the same location and the same year to reduce the impact of pedoclimatic factors.

2.3. Extraction and Isolation
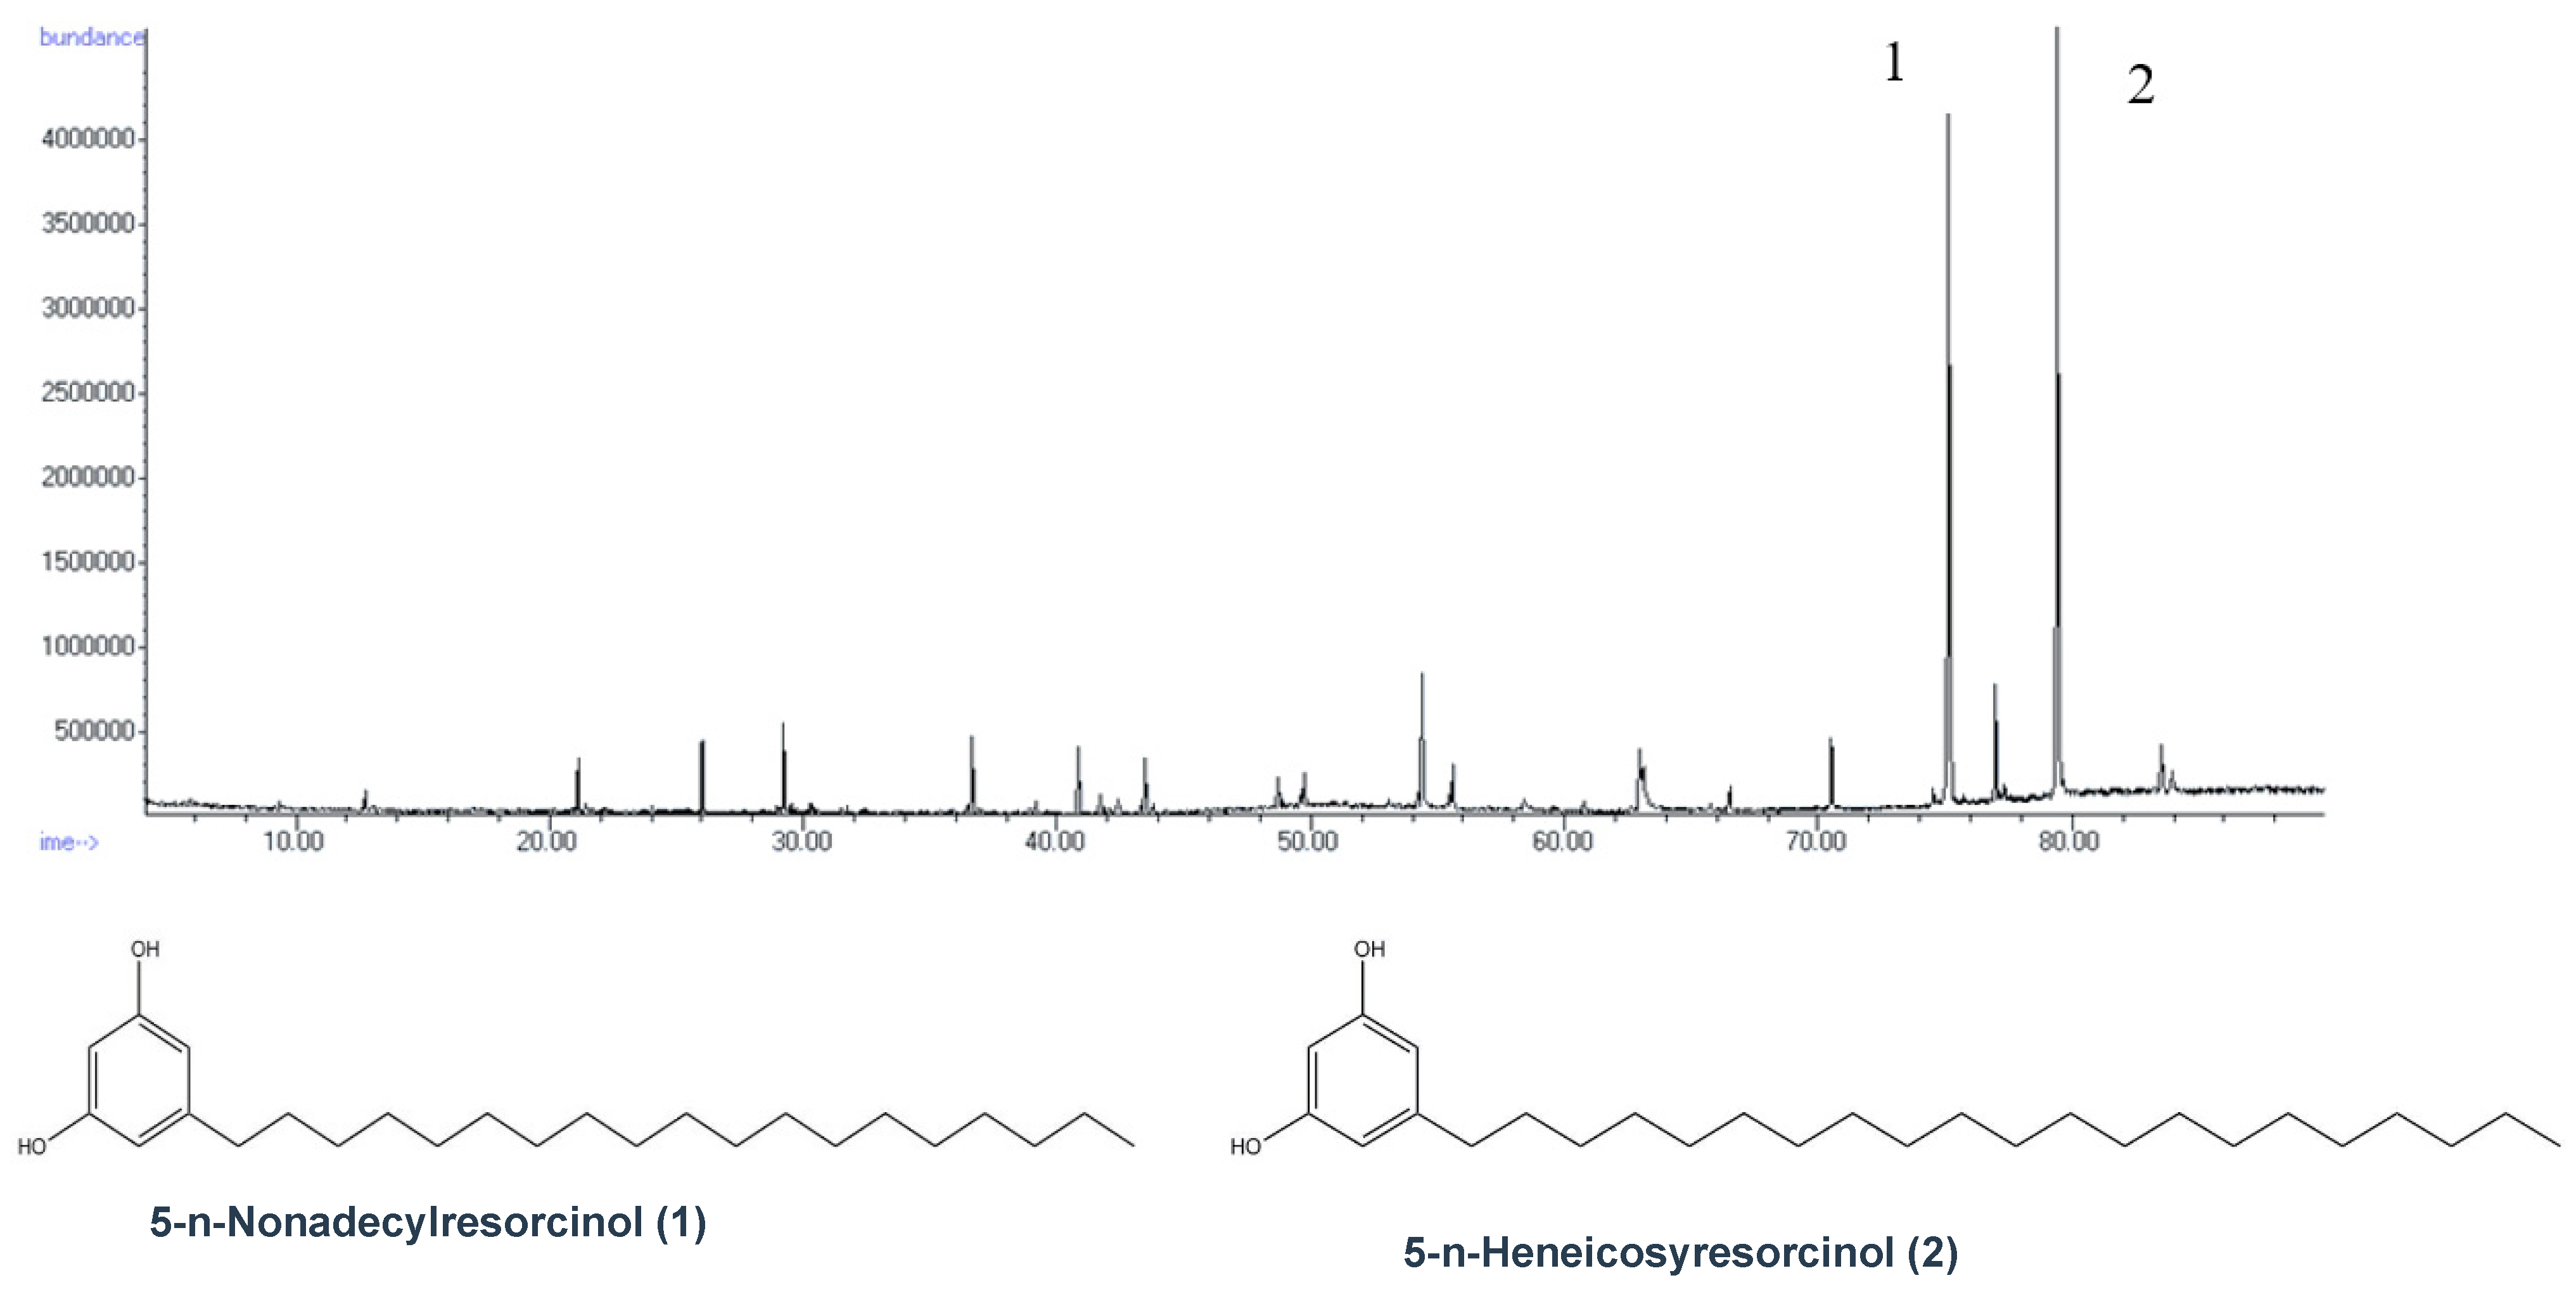
T. dicoccum whole-grain flour (100 g) was extracted in an ultrasonic bath for 20 min with CH2Cl2 (300 mL). The solvent was evaporated and the residue was submitted to column chromatography using silica gel with cyclohexane and mixtures of cyclohexane with ethyl acetate (95:5, 90:10 and 85:15). Fractions obtained with cyclohexane-ethyl acetate 85:15 were pooled and submitted to preparative TLC. The alkylresorcinol spot was identified by the intense red color appearing after spraying with vanillin in methanol/sulfuric acid and heating. The spot with Rf = 0.32 (cyclohexane-ethyl acetate-acetic acid 80/20/1) was extracted with dichloromethane and analyzed by GCMS and 1H-NMR in CDCl3, DMSO, pyridine and acetone.

2.4. GC-MS

GCMS was performed using a Hewlett Packard 6890-5973 GC-MS system operating in EI mode (equipped with a HP 5MS 30 m × 0.25 mm, 0.25 μm film thickness capillary column). Helium (1 mL/min) was used as carrier gas. The initial temperature of the column was 60 °C; it was then heated to 280 °C at a rate of 3 °C/min.

2.5. High-Throughput Extraction and NMR Analysis

A portion of the flour or the comminuted corresponding product (330 ± 0.1 mg) was extracted in an ultrasonic bath for 5 min with deuterated DMSO (1 mL) containing syringaldehyde (0.5 mg/mL) as an internal standard. The supernatant liquid part was obtained by centrifugation (5 min at 3000 rpm) and was directly transferred to a 5 mm NMR tube. Each sample was analyzed in triplicate using a standard 90 degree excitation pulse, with a pulse width of 10 μsec and a prescan delay of 6.5 μsec. All measurements were performed at 298 K. Typically, 16 scans were collected into 32 K data points over a spectral width of 0–13 ppm (5263.18 Hz) with a relaxation delay of 10 s, an acquisition time of 3.11 sec and a FID resolution of 0.32 Hz. The appropriate relaxation delay was determined by gradual increases (1, 2, 5, 8, 10, 15, 20 s until the ratio between the integration of the peak of internal standard and the peak of the target compounds remained unchanged. The matching, tuning, shimming, receiver gain adjustment as well as phasing and baseline correction were always first performed automatically and then manually to achieve the best result. Prior to Fourier transformation (FT), an exponential weighting factor corresponding to a line broadening of 0.3 Hz was applied. For the peaks of interest, accurate integration was performed manually. The concentration of ARS was measured by comparing the area of the selected signal at 6.00 ppm with that of the internal standard (IS) at 9.79 ppm, which was set as 1. The calculation of the concentration of total ARS in mmol/mg of dry material was performed using the following formula: C = [(IARS/3) × mmol I.S.]/Msample, where Msample = 330 mg and mmol I.S. = 0.5 mg/MW syringaldehyde = 0.00270. To express the concentration in mg ARS/mg of dry material, we used the average molecular weight between C19 (m/z 376) and C21 (m/z 404) alkylresorcinols.

2.6. Precision-Recovery-LOD-LOQ

The recovery was calculated by the comparison of successive extractions of samples for the studied ARS. The samples contained different levels of extractives in order to obtain unbiased results. The recovery achieved after one extraction was >95%. The intraday and interday precision was determined by analyzing three replicates of three random samples from the same day and from three different days, and the %RSD was found to be <10%. LOQ = 15 μg or 45 mg/Kg (S/N > 10) and LOD = 10 μg or 30 mg/Kg (S/N > 3).

3. Results

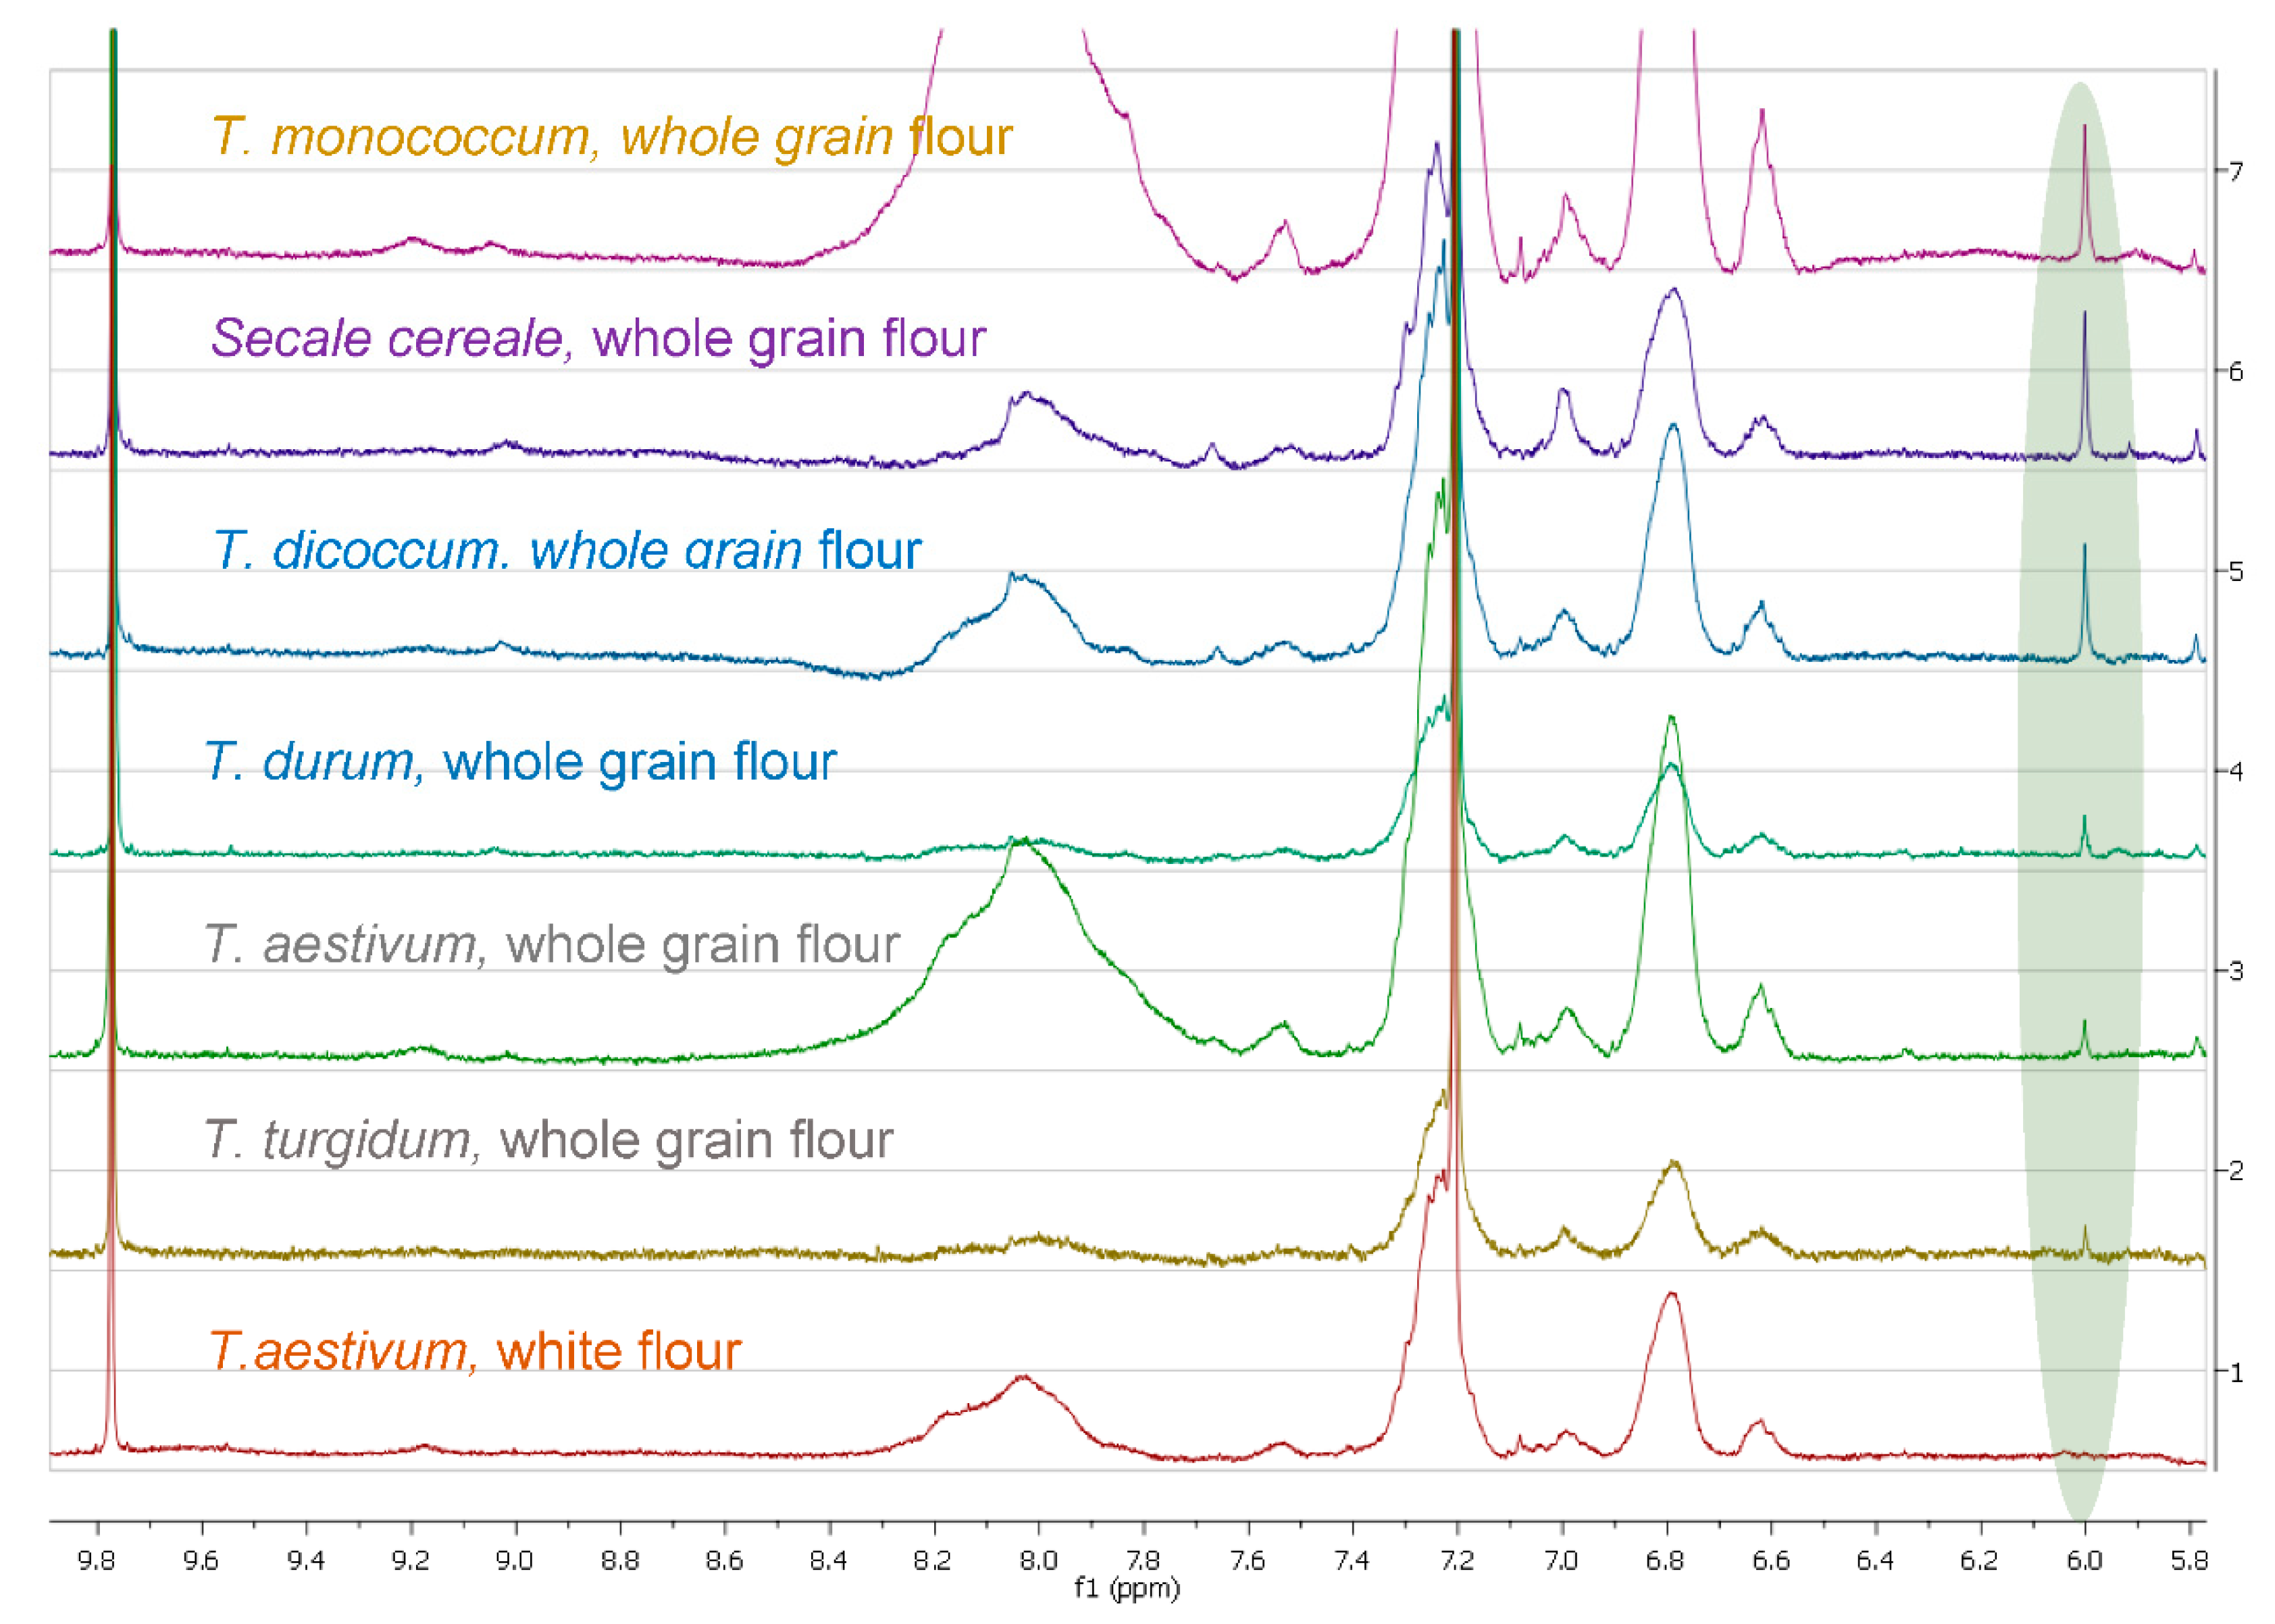
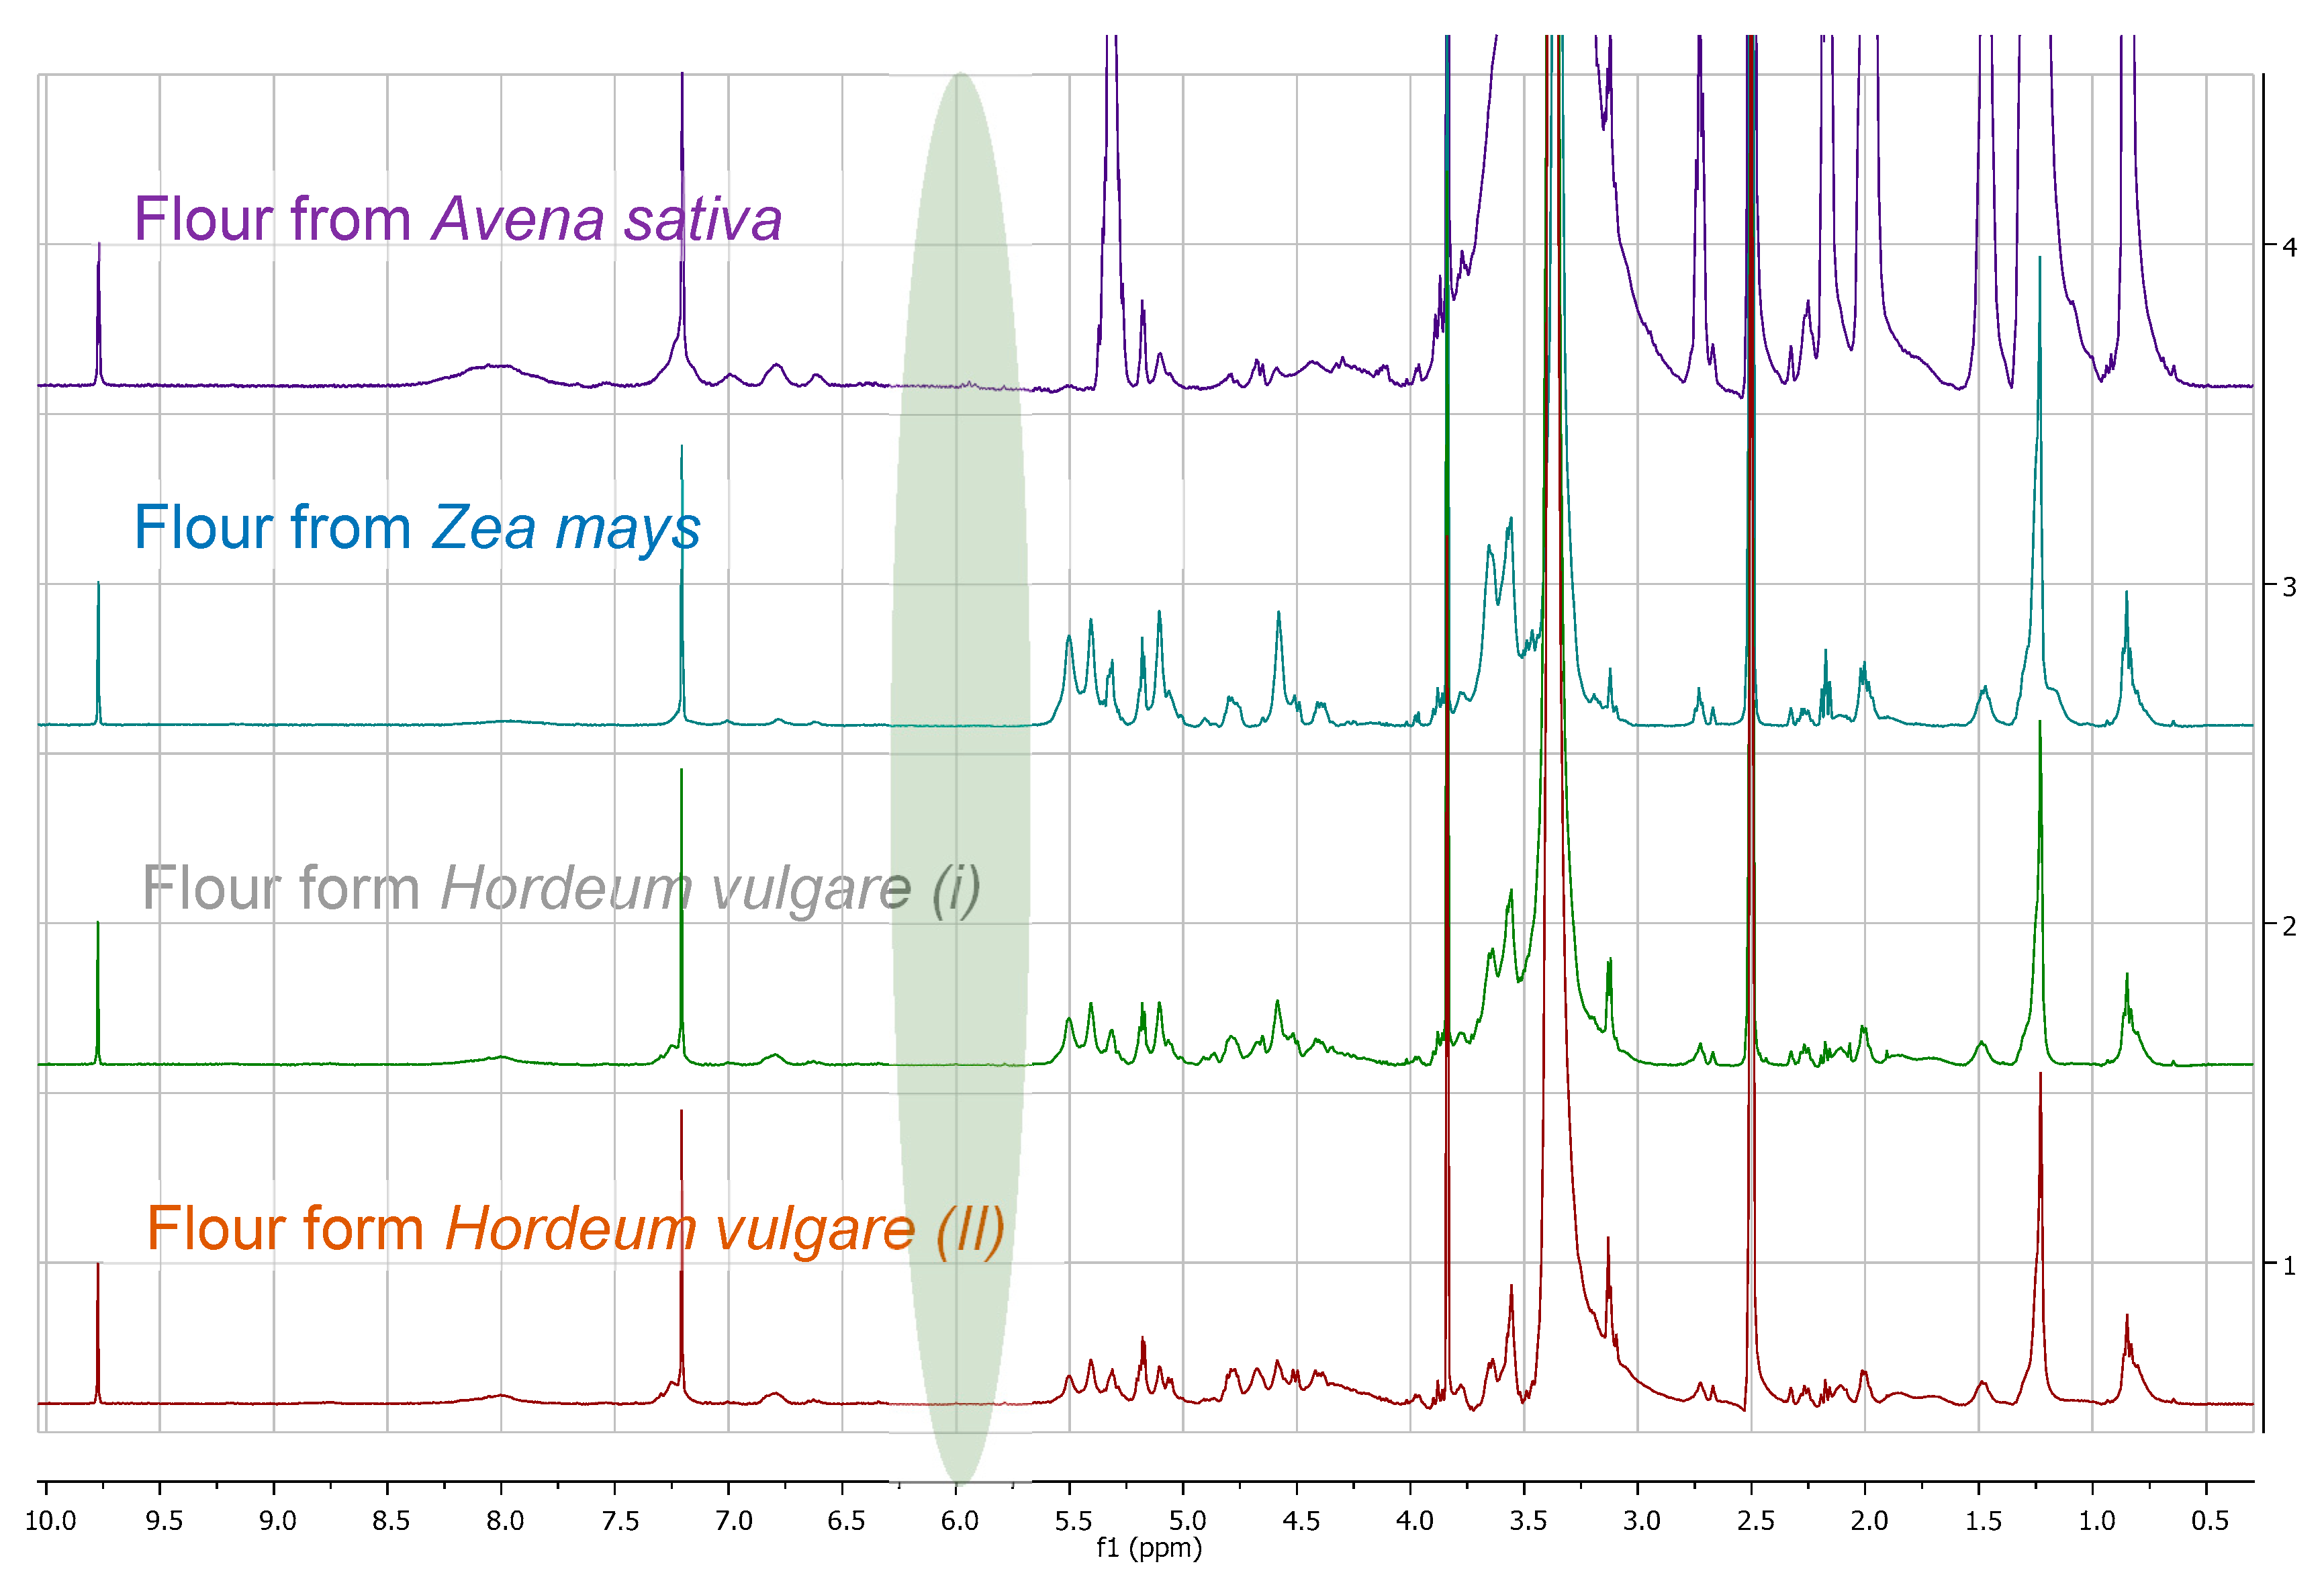
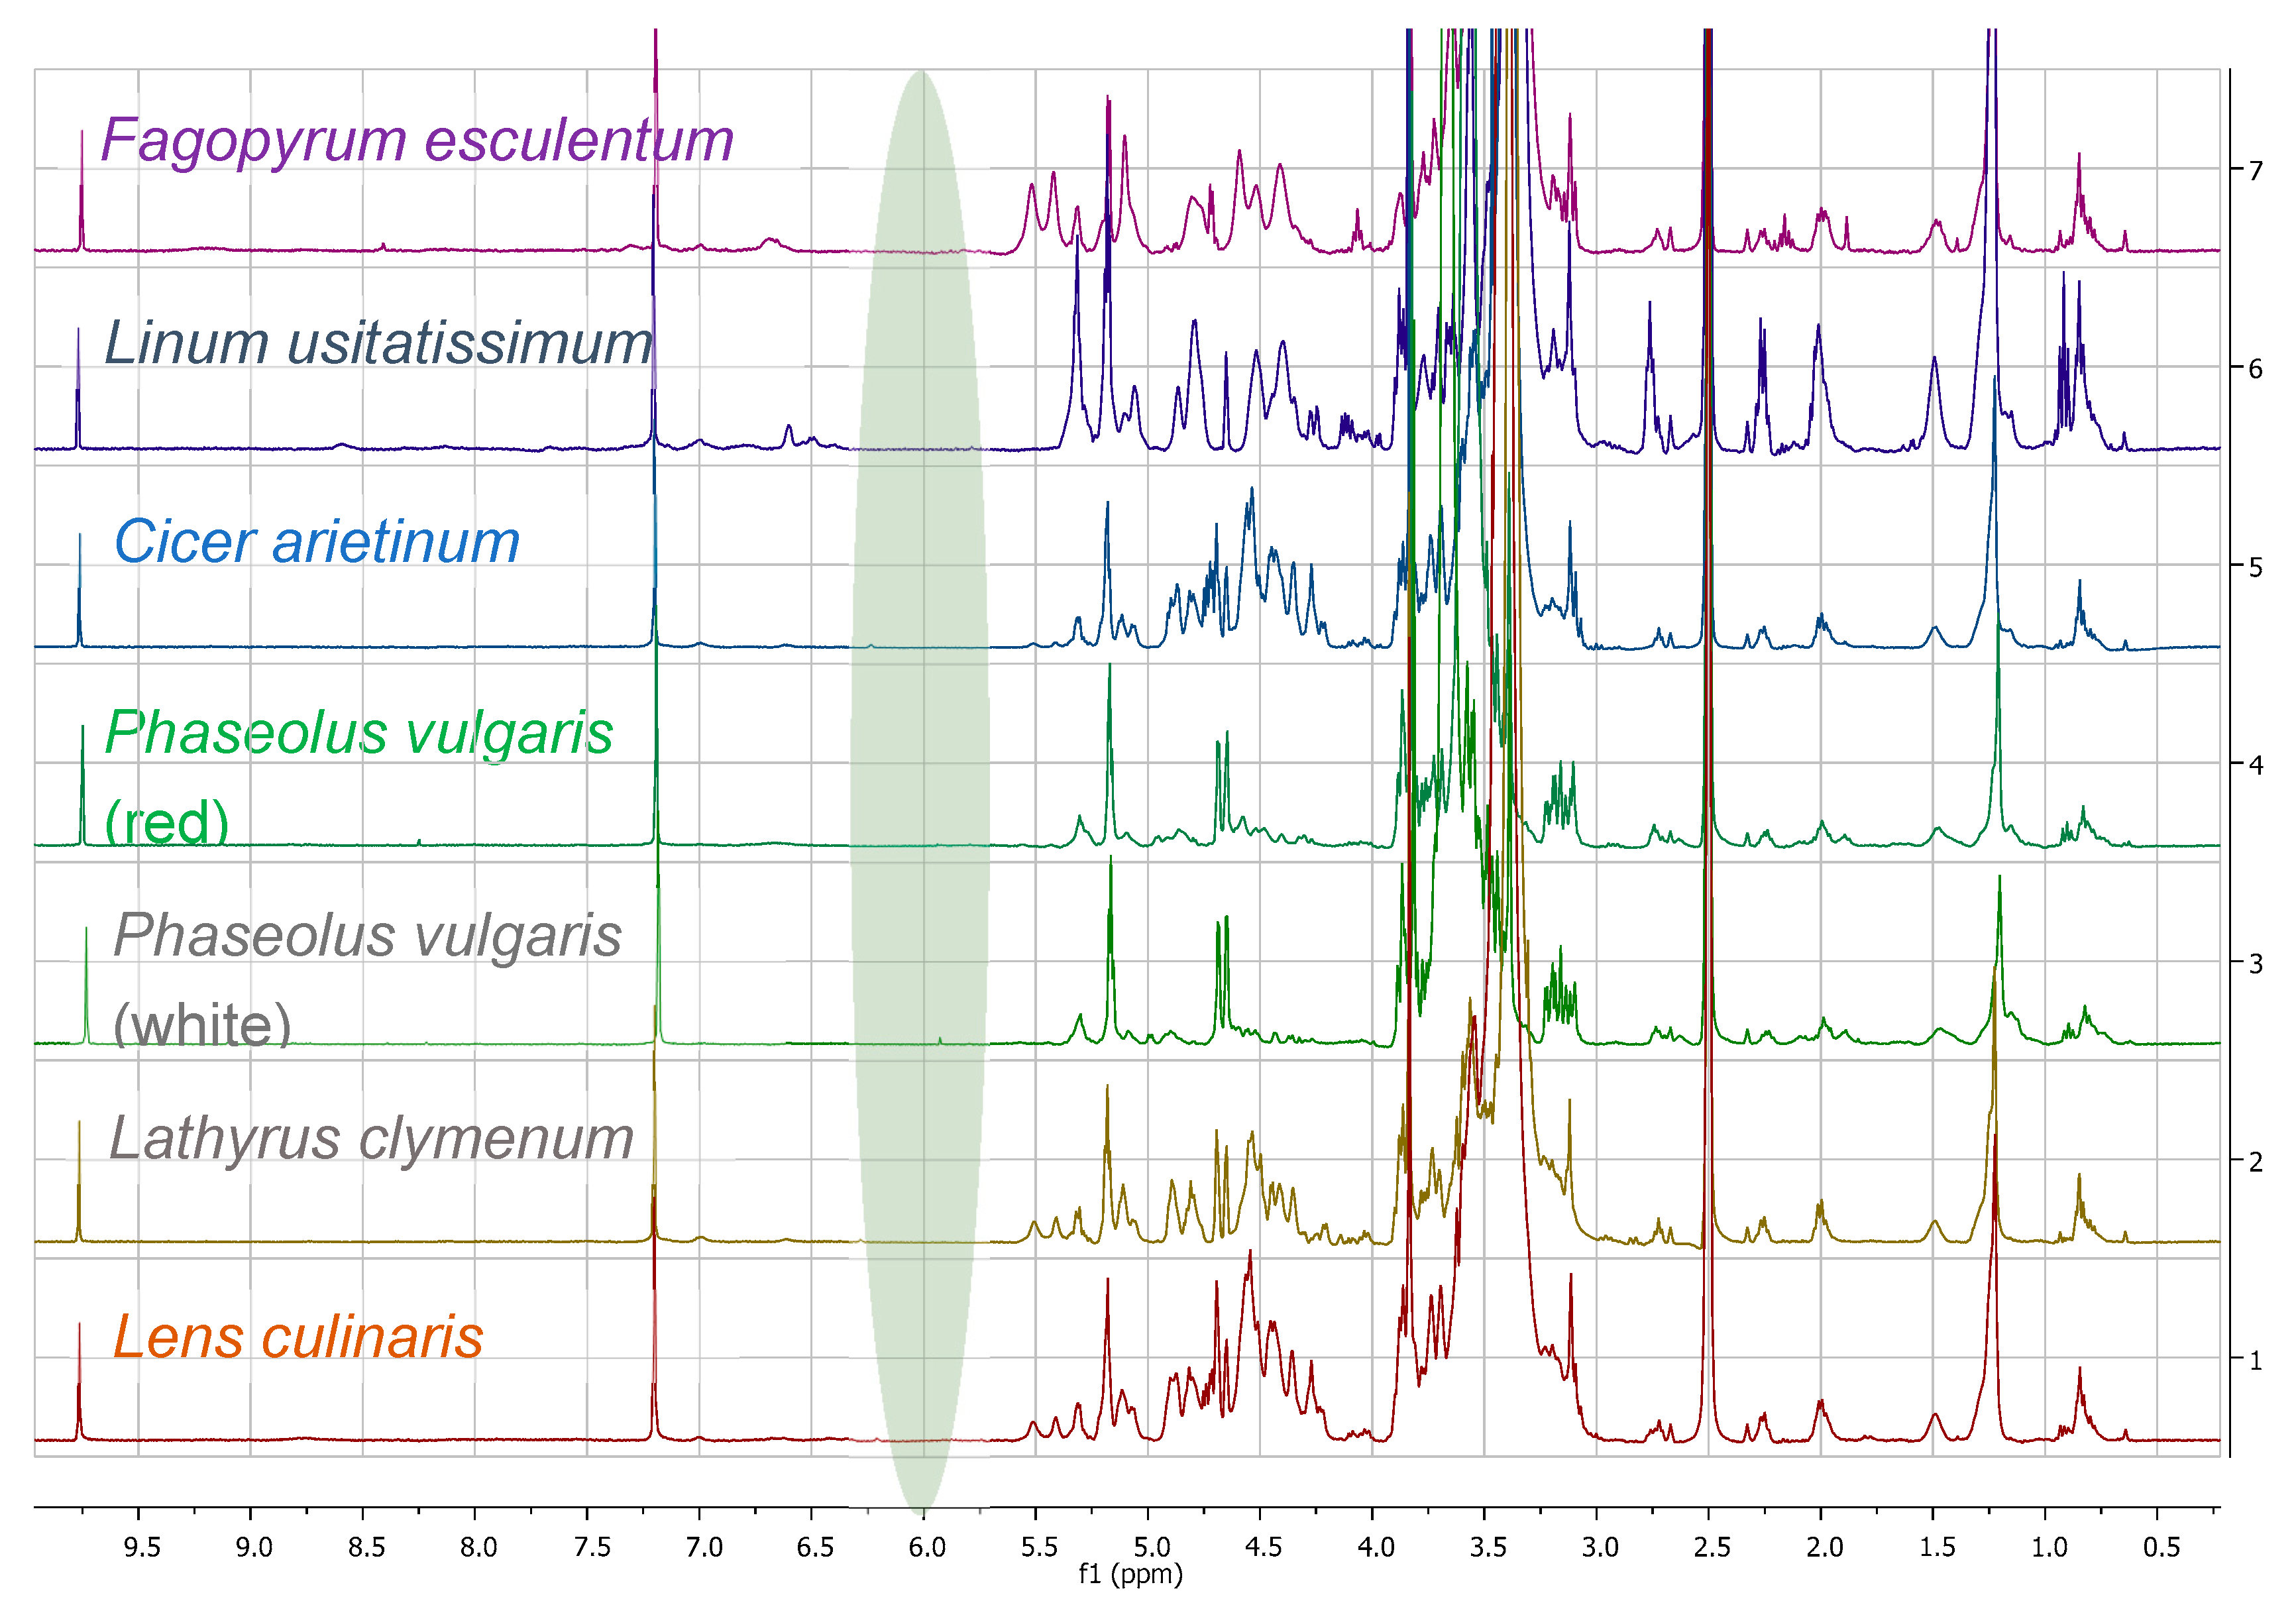
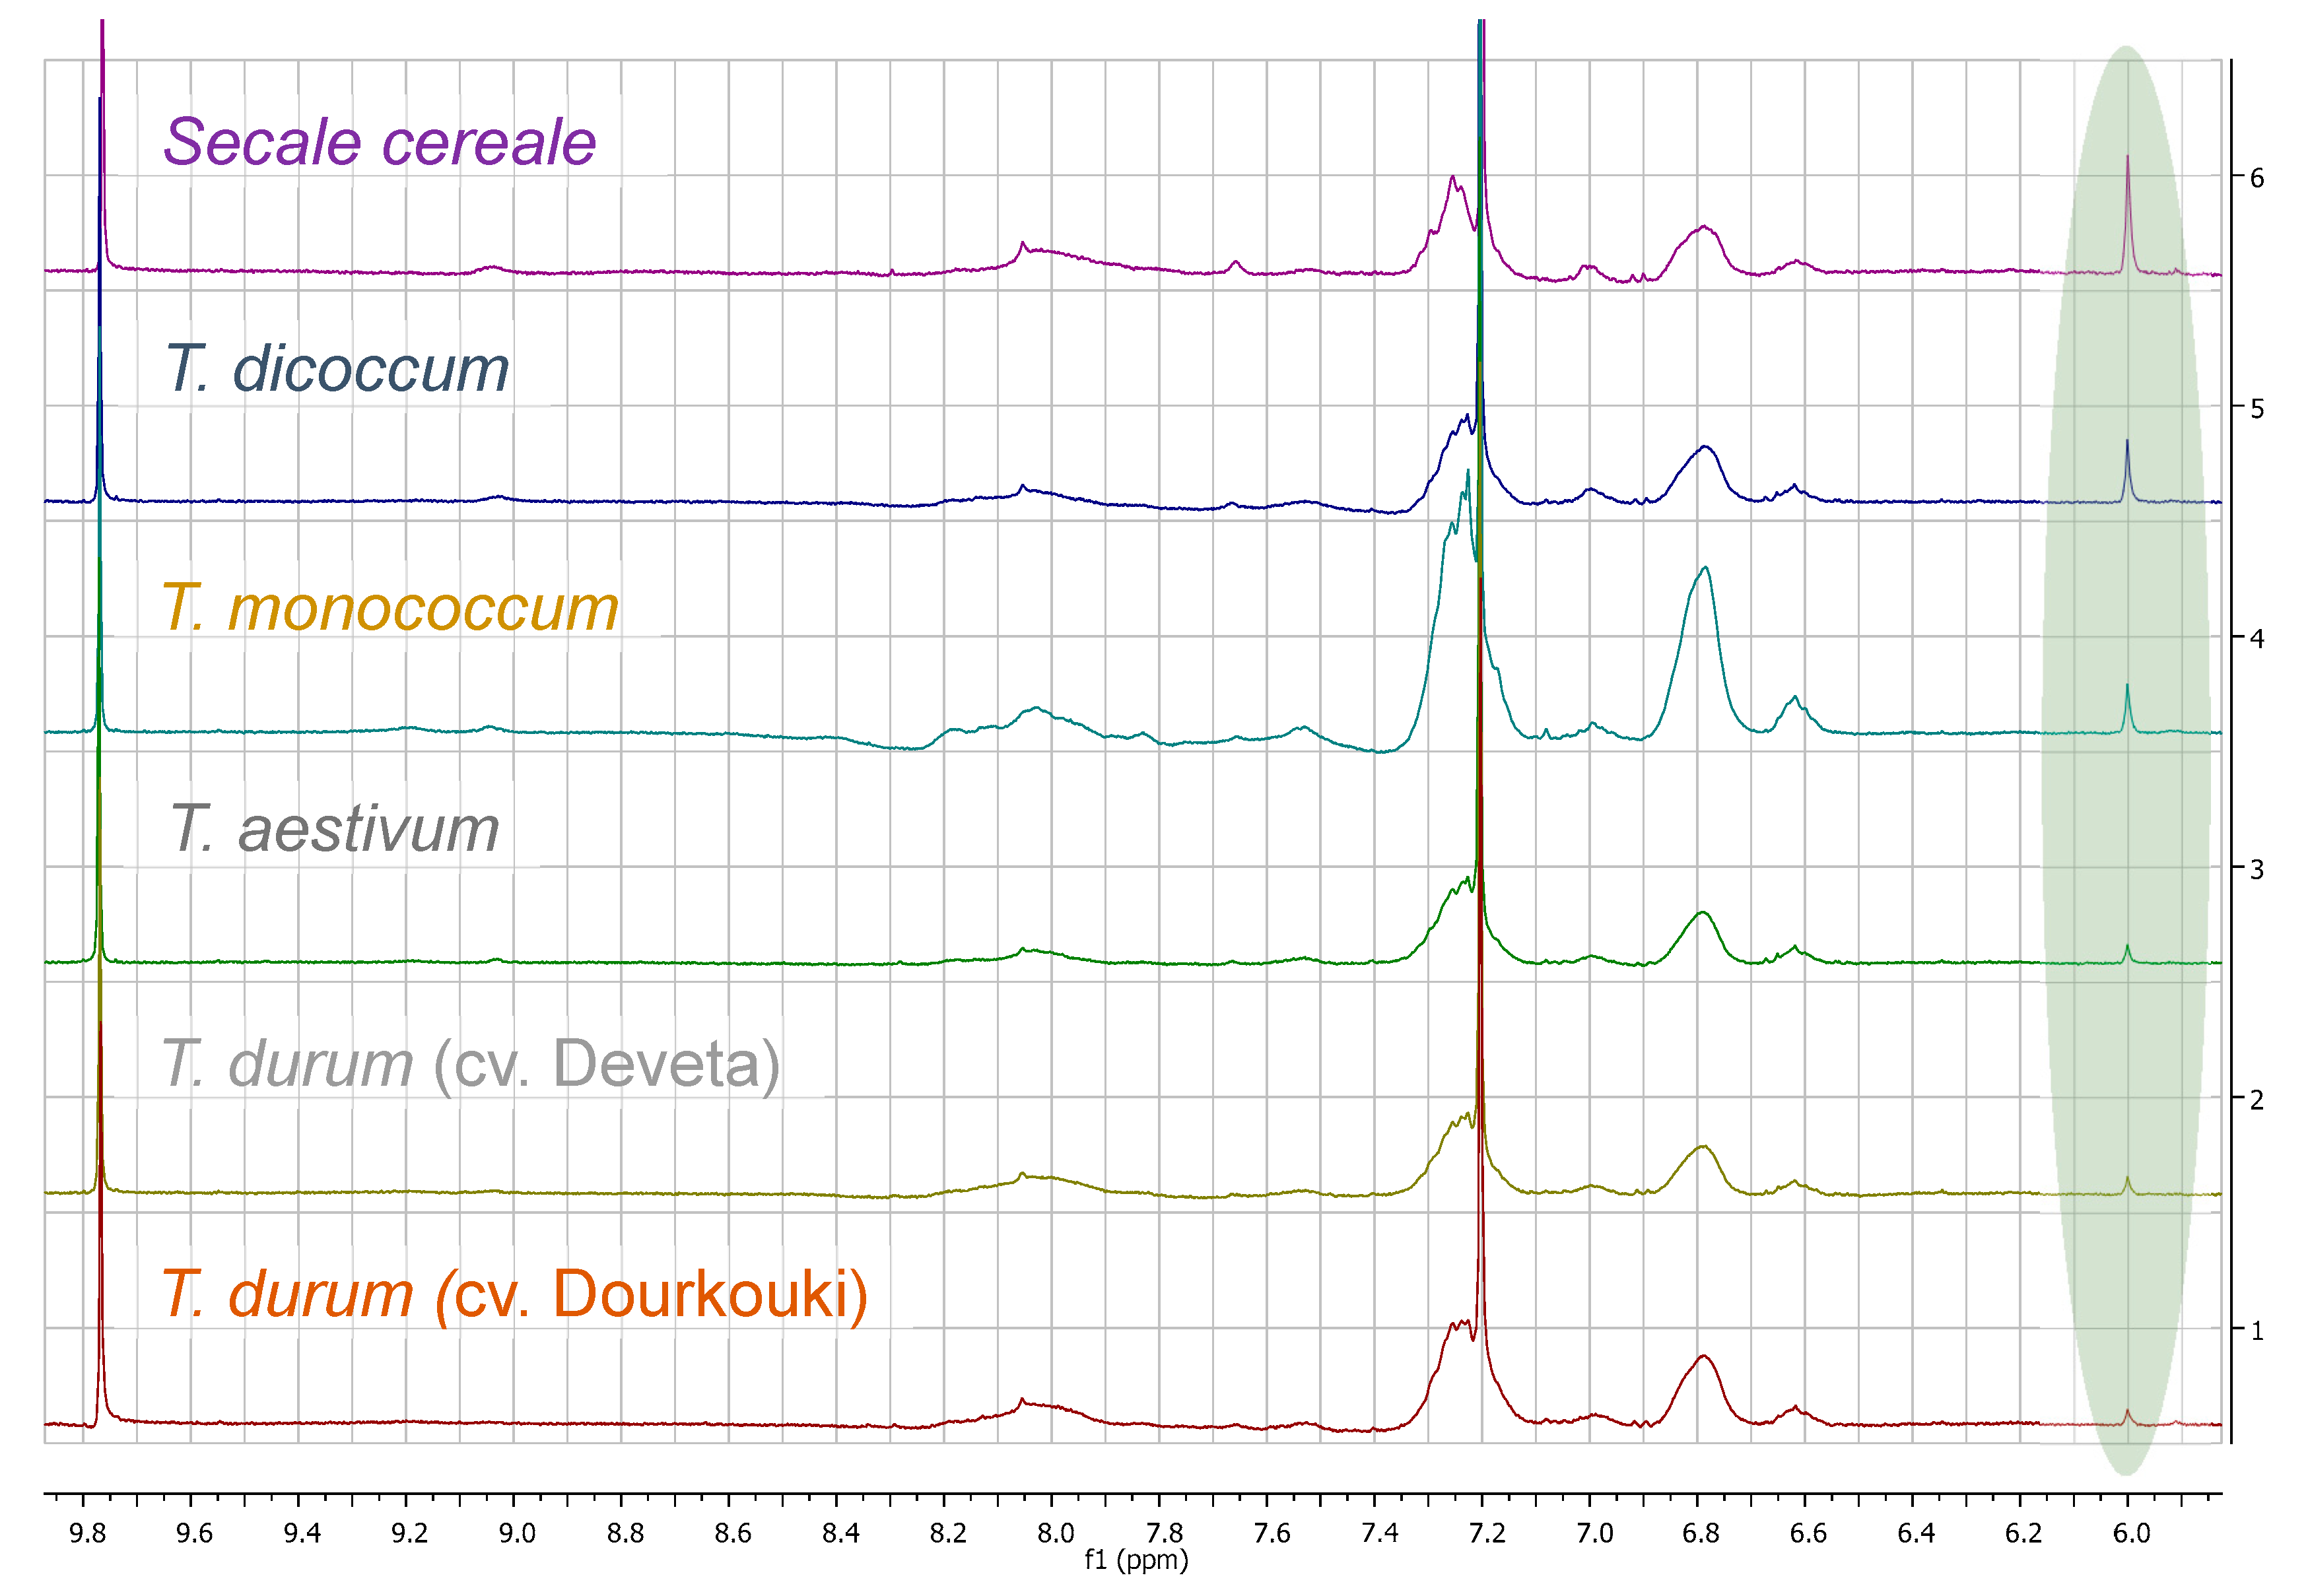
3.1. Comparison among Flour Extracts

The obtained extracts of flours using DMSO-d6 were directly recorded by 1H-NMR without any other treatment. The spectra were compared and a singlet was observed at 6.0 ppm only in wheat and rye samples (Figure 1 and Figure A1, Figure A2, Figure A3). Interestingly, it was not observed in refined (white) flours.
The same flour samples when extracted in other deuterated solvents showed more complicated spectra which precluded accurate quantitation (Figure A4 and Figure A5).

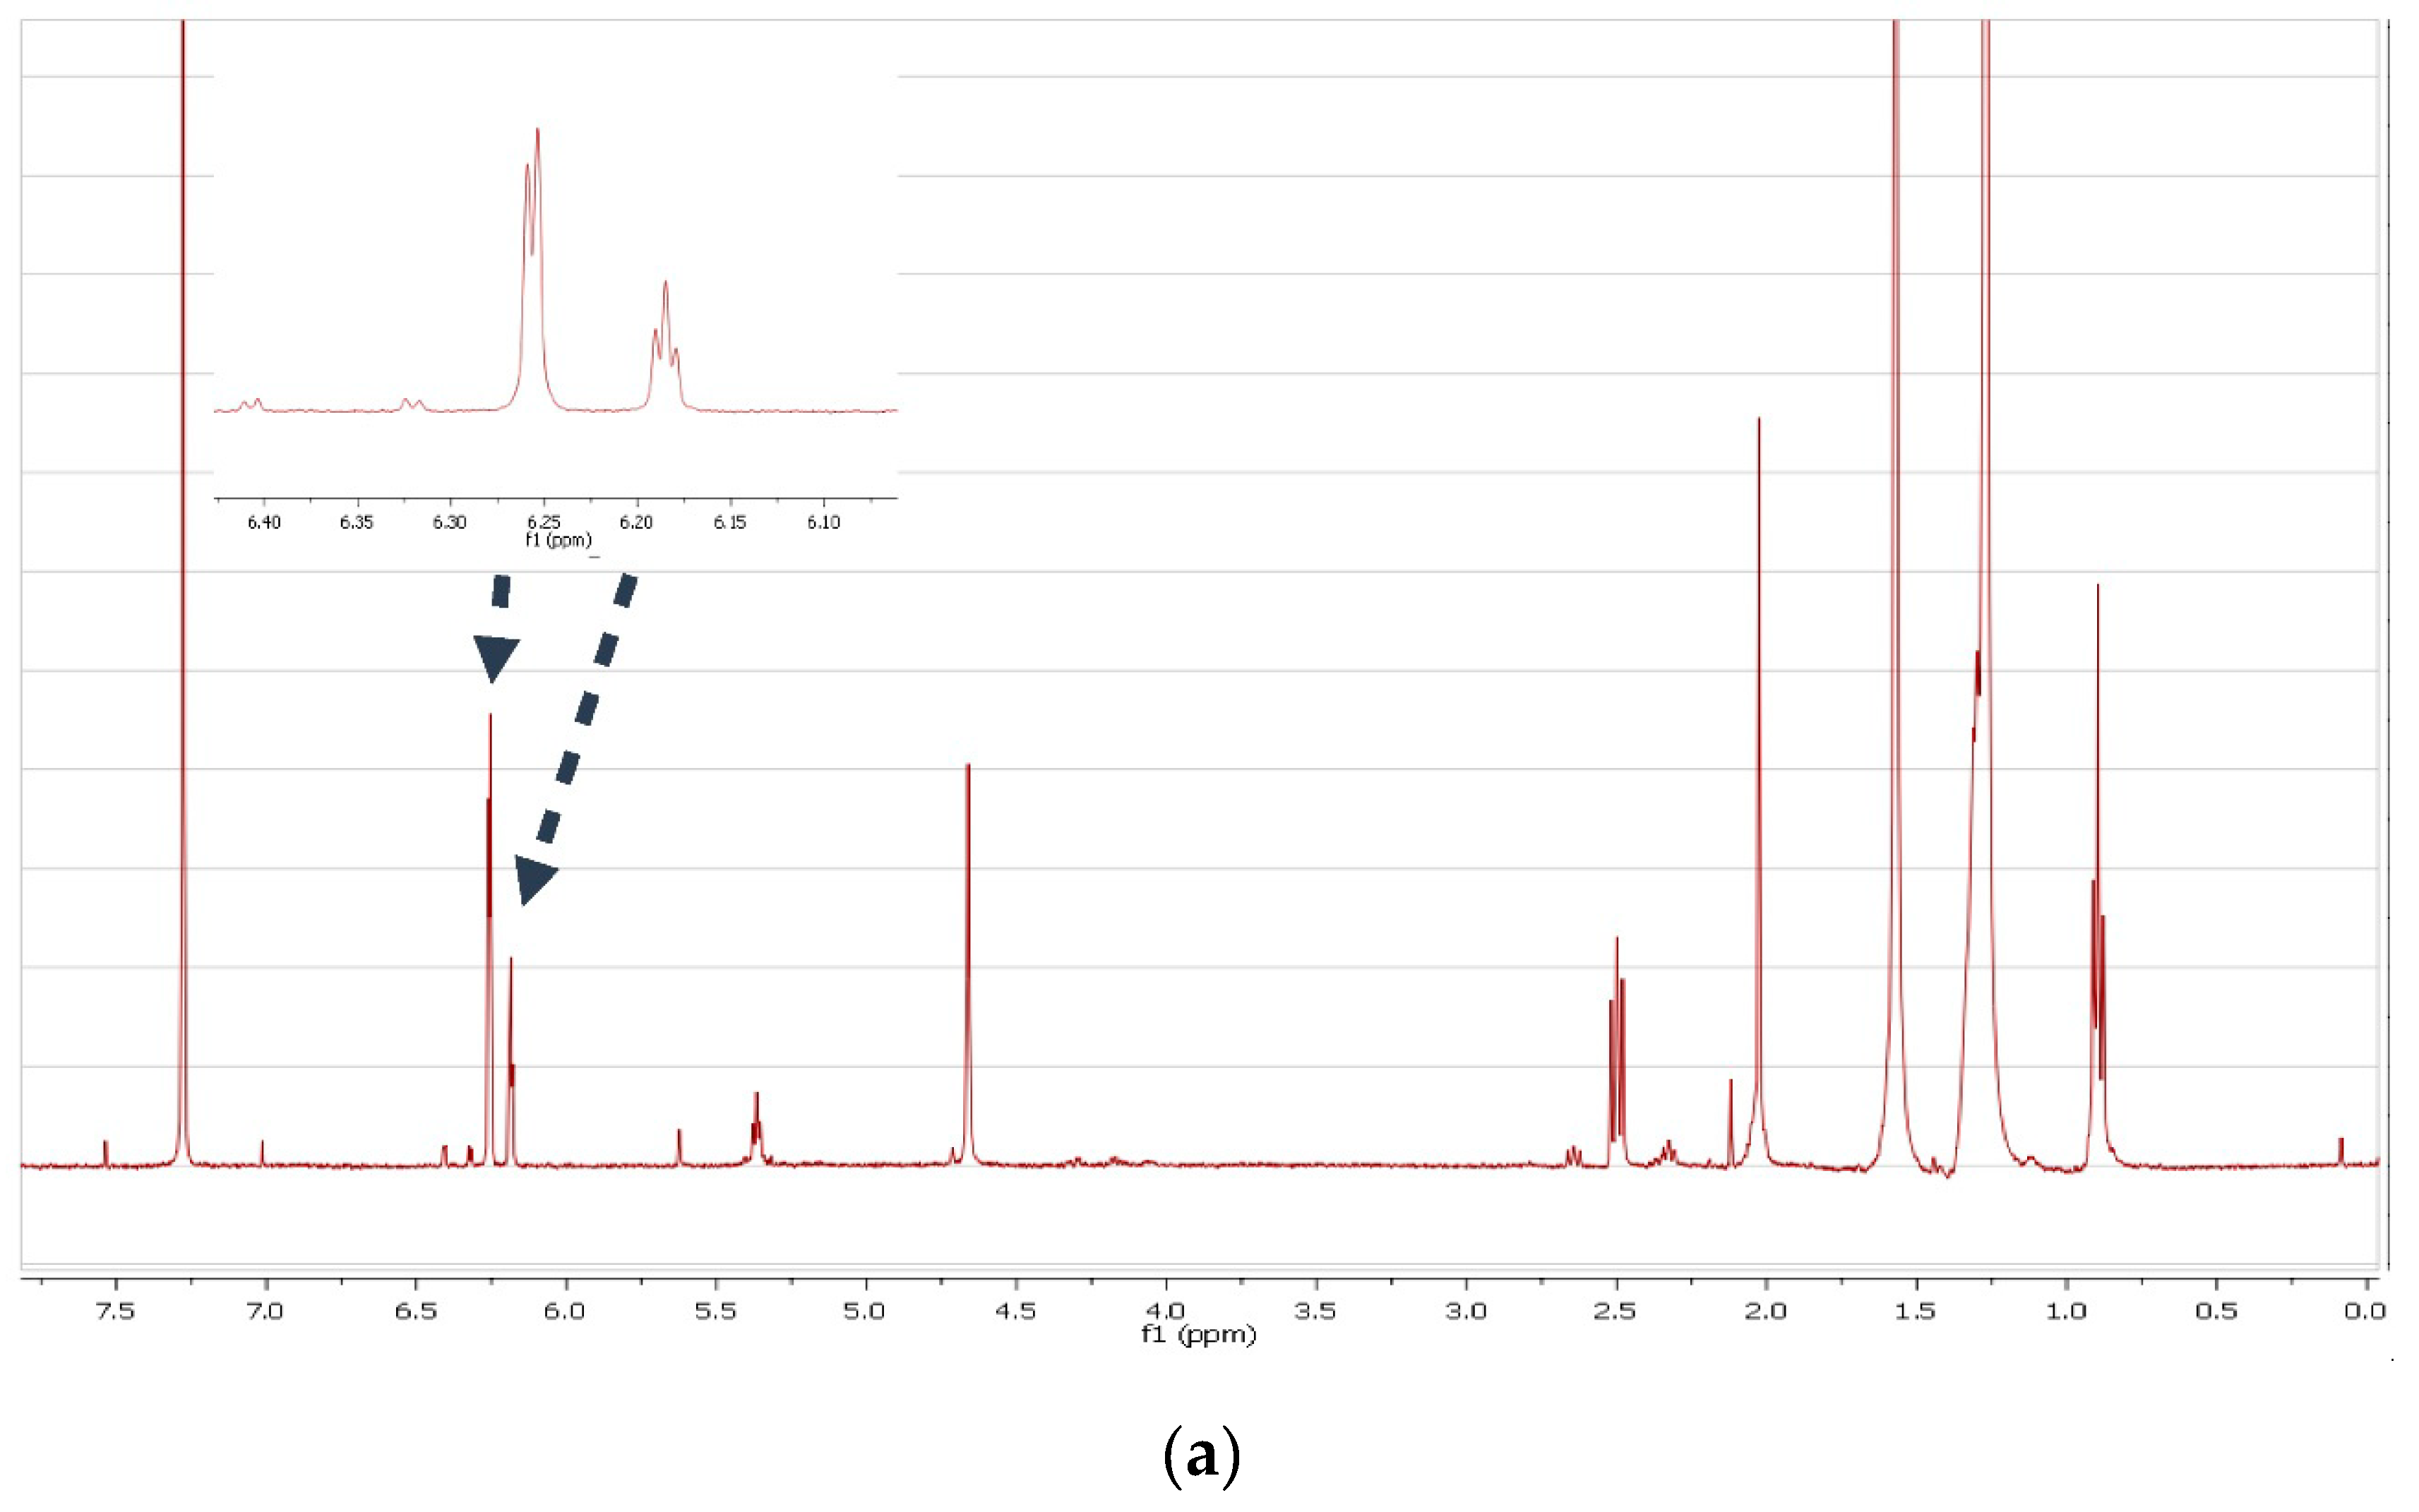
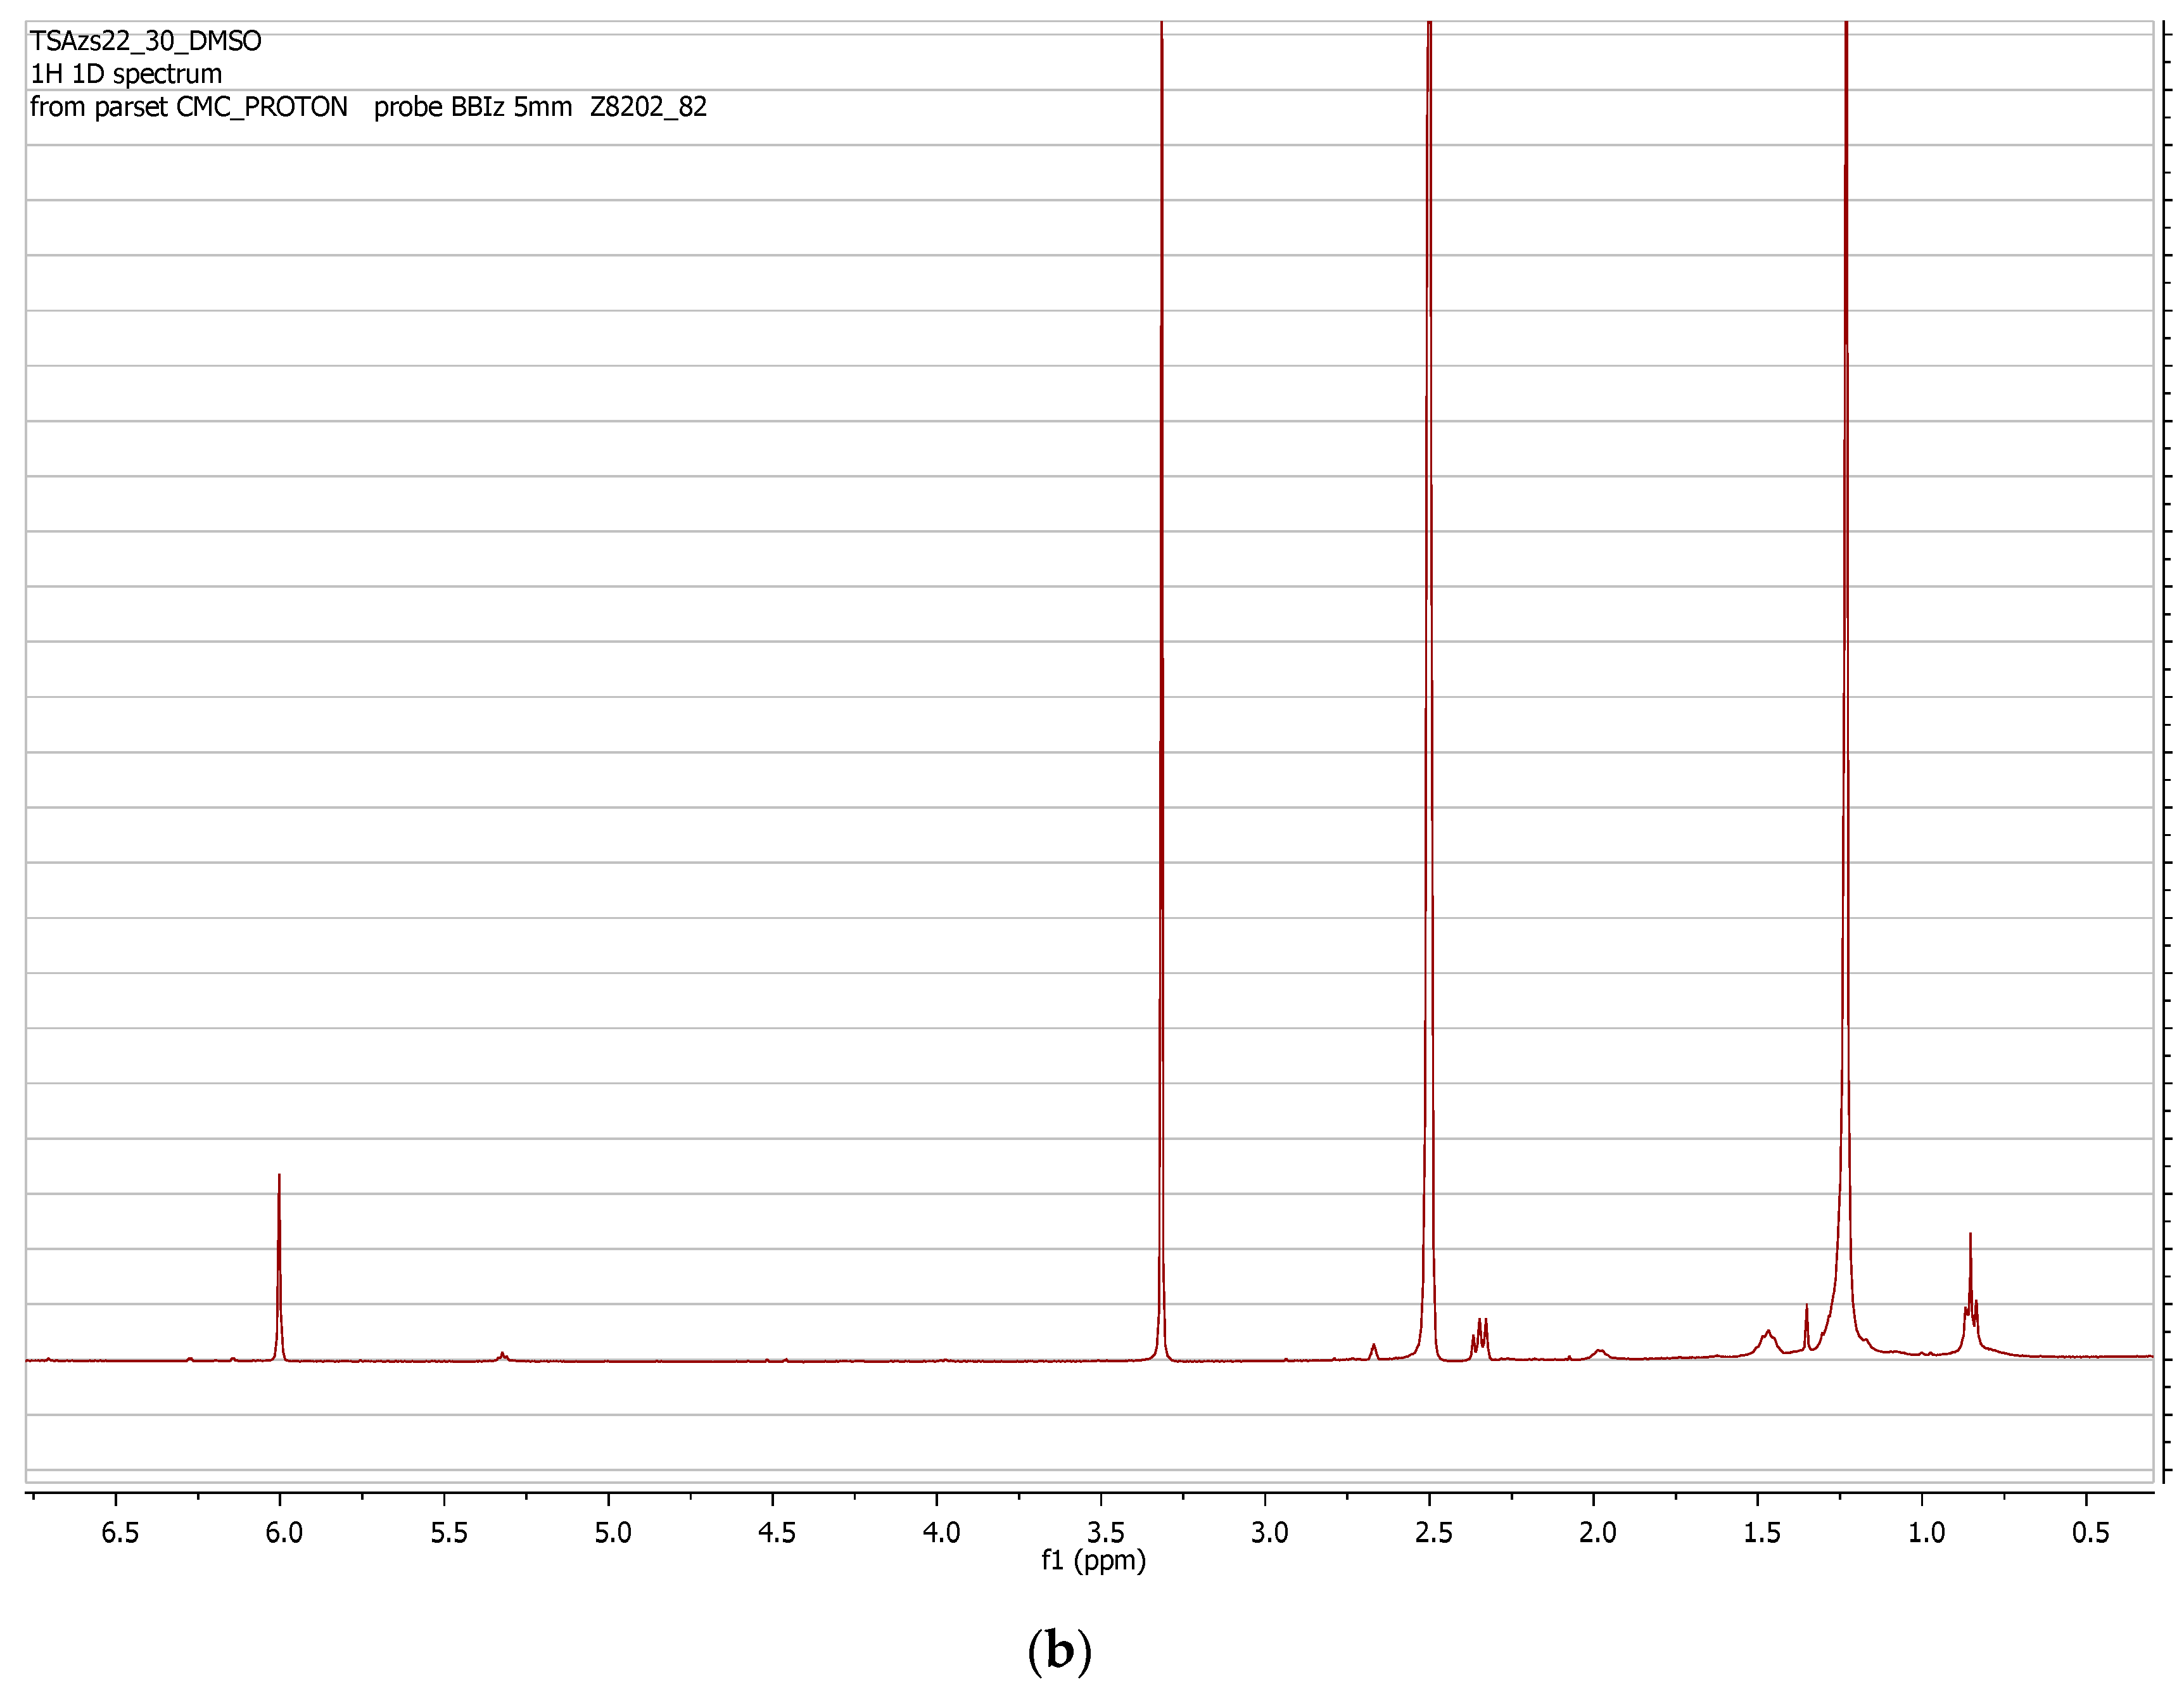
3.2. Structure Elucidation Results

Targeted fractionation and isolation of the molecules related with the peak at 6.0 ppm showed that it corresponded to 5-alkylresorcinols. The NMR spectrum in CDCl3 (Figure 2) was similar with that described in literature [12]. Interestingly, the spectrum of the same compound in DMSO (Figure 2) showed only a single peak in the aromatic region, consistent with that observed in the flour extract.
A GCMS analysis of the isolated compound showed that it was a mixture of 5-n-alkylresorcinols with a side chain ranging from C15 to C25, but predominantly from C19 and C21 (Figure 3).

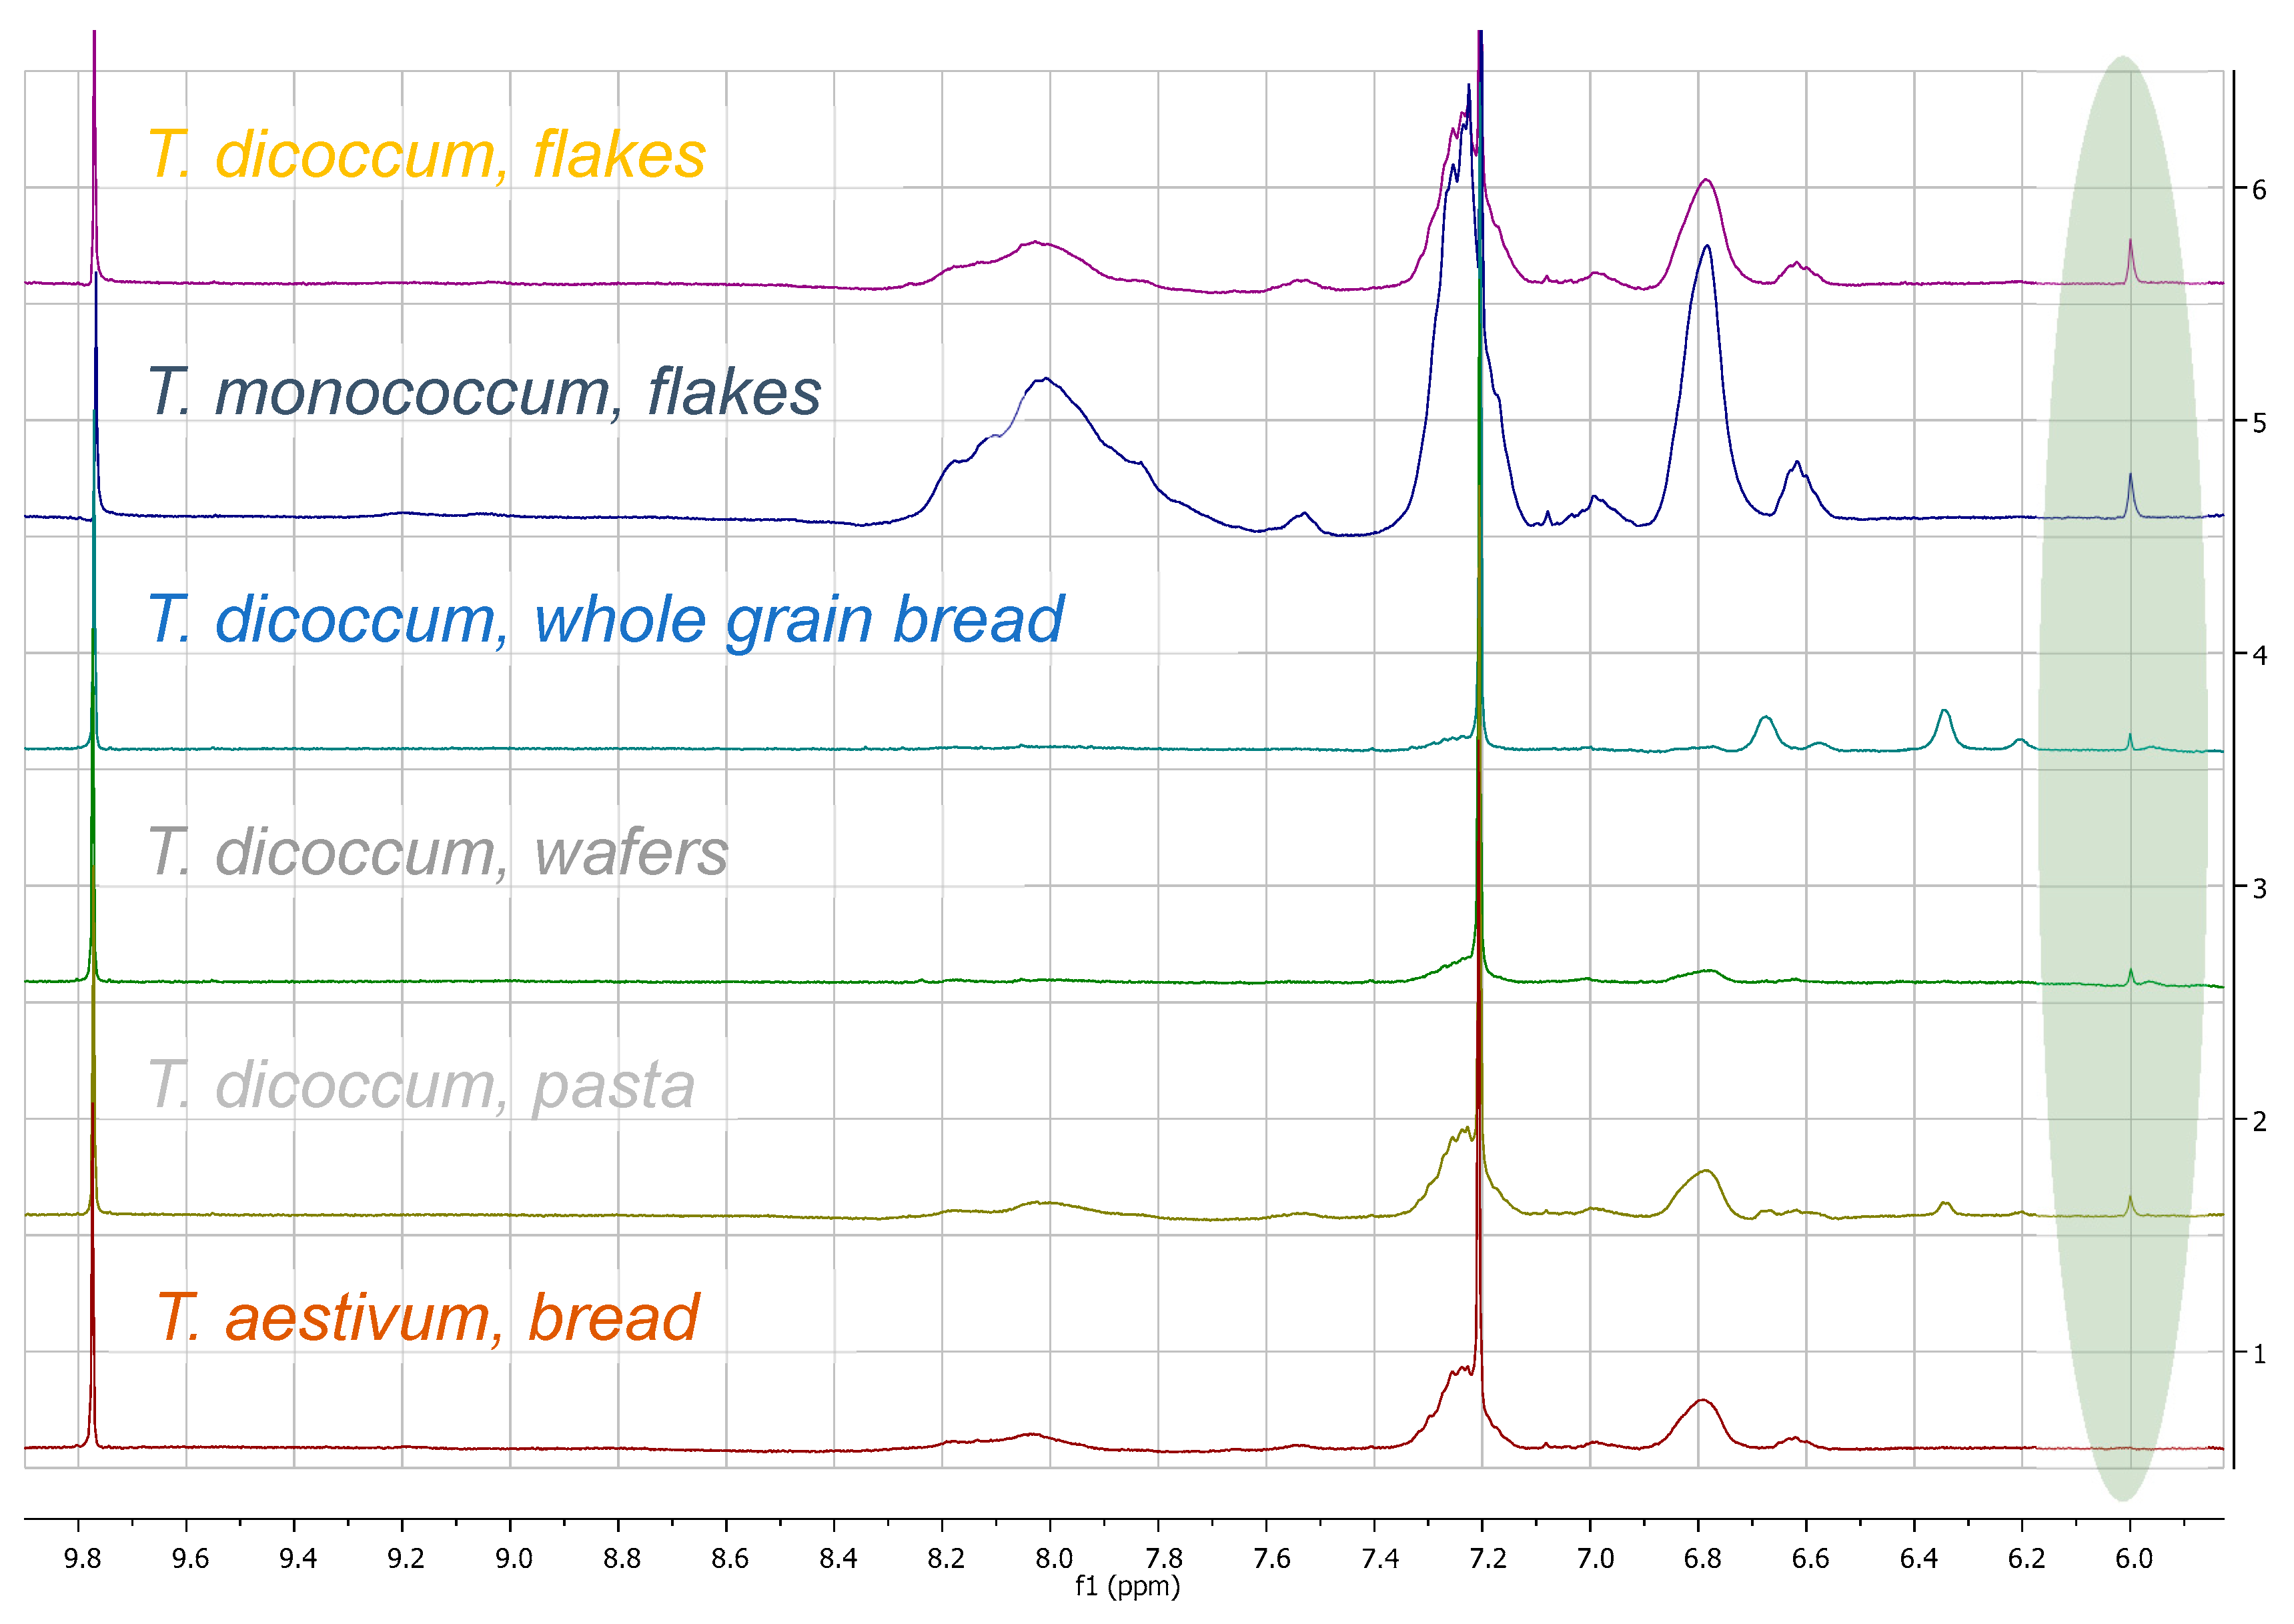
3.3. Quantitation Results

Grains, whole grain flours and breads, especially from old varieties of Triticum monococcum and T. dicoccum, showed high alkylresorcinols (ARS) contents (>450 mg/Kg), while the compounds were completely absent from white flour and all the commonly consumed corresponding types of bread.
We also found a high total alkylresorcinol content only in samples of Secale cereale flour, while no 5-alkylresorcinols could be detected in Hordeum vulgare (barley) flour, Avena sativa (oat) whole grain flour and flakes, Zea mays whole grain flour, nor in the seeds of Lens culinaris, Lathyrus clymenum, Phaseolus vulgaris, Cicer arietinum, Linum usitatissimum, Fagopyrum esculentum and Zea mays. The quantitation results are presented in Table 1.

4. Discussion

The main objectives of the current work were to investigate the possible differences among different types of flours from traditionally preserved Greek indigenous varieties of cereals, and especially those of wheat, and in parallel, to correlate those differences with the presence of bioactive natural ingredients. Based on the previous successful use of 1H-NMR for the qualitative and quantitative characterization of bioactive ingredients in olive oil, wine and beer [21,22,23], we first studied the total profile of selected flour extracts using microextraction with deuterated solvents and directly recorded the NMR spectra.
After several trials of extraction and simultaneous spectra recording with CDCl3, CD3OD, Pyridine-d5, DMSO-d6 and Acetone-d6, we found that DMSO was the most efficient solvent, presenting in parallel the clearest spectra concerning the aromatic area which showed the most significant differences. A comparison among the different spectra (Figure 1) of the flours extracted with DMSO-d6 revealed the presence of a major peak in the aromatic area (6.0 ppm) only in rye and the wheat species. Targeted isolation of the molecules corresponding to this peak using liquid chromatography and subsequent characterization by NMR and GCMS led us to attribute it to a series of 5-alkylresorcinols. Interestingly, when the NMR spectrum of the isolated compound was recorded in CDCl3, Acetone-d6 or Pyridine-d5, it presented a doublet and triplet, as described in the literature for 5-alkylresorcinols [12], corresponding to the three aromatic protons (Figure 2A); however, when it was recorded in DMSO, the spectrum was simplified, presenting only one singlet in the aromatic region (H-2,4,6) (Figure 2B). In contrast to our results, the three protons H-2,4,6 of 5-alkylresorcinols in CDCl3 [27] were reported as two singlets, and in DMSO [28] as a doublet and a triplet. An analysis of the isolated compound by GCMS revealed that it was a mixture of several alkylresorcinols with side chains ranging from C15 to C25, but predominantly from C19 and C21 (Figure 3).
The simplicity of the NMR spectrum of the total extract in DMSO and the lack of overlapping peaks from other compounds allowed us to develop a high throughput quantitative analytical method for the measurement of total alkylresorcinols. The method was based on the integration of the peak at 6.0 ppm (IARS) and comparisons with the integration of the internal standard at 9.79 ppm, which was set as 1. The calculation of the concentration of total ARS in mmol/mg of dry material was performed using the formula presented in Materials and Methods, which was based on the molar ratio between the target analyte and the internal standard, following the general guidelines presented by Pauli et al. [29] and Bharti and Roy [30]. The integration value of the singlet at 6.0 ppm was divided by 3, since it corresponded to three aromatic protons.
It should be noted that one extraction step in an ultrasonic bath for 5 min is sufficient for the quantitative recovery (>95%) of ARS. Longer extraction times or more than one cycle of extraction led to a negligible increase of the recovery, i.e., less than 5% (Figure A6).
Advantages of the qNMR method in comparison to chromatographic methods
Alkylresorcinols (ARS) have been previously investigated and quantified in several wheat products, mainly using time-consuming chromatographic methods and long extraction or pretreatment procedures [4,5,6,7,8,9,10,11,12,13,15,16,17,18,19,20]. Depending on the analyzed material (flour, grain, bread or pasta) and the analytical method (liquid or gas chromatography or colorimetry), several methods of extraction have been used, most commonly with ethyl acetate, acetone, hot propanol or propanol/water, with extraction times ranging from 3 to 48 h, followed by several filtration, evaporation and dilution or derivatization steps. In all cases, external standards of one or more ARS are necessary. Existing chromatographic methods (GCMS, HPLC-UV/DAD or LCMS) give very good results but the time of analysis ranges from 15 min to 90 min. Colorimetric methods require times ranging from 15 min to 4 h.
Our new method is the first to make possible the selective and high throughput quantitative determination of ARS in grains, flours and foods in less than 15 min per sample, including the extraction and analysis time. In addition, the most important advantages are: (i) no need for standards for target compounds; (ii) no need for derivatization; (iii) short time of extraction in ultrasonic bath (5 min); (iv) very simple procedure for the separation of the solution for analysis by centrifugation; and (v) adequate limit of detection and precision. The only limitation is that the current method cannot determine the length of the side chain, which, in some cases, is useful to differentiate rye from wheat [4,5].
Comparison among the studied cereals and other common seeds and beans
As previously reported, ARS were found only in wheat and rye, and not in other cereals. Indeed, analyses of the grains of the studied cereals, as well as several of other commonly used beans and seeds, confirmed that the main nutritional source of ARS is wheat and rye. Wheat should be considered as a primary nutritional source, especially for Mediterranean populations, since rye is consumed to a lesser extent. Until the mid-20th century, the main flour used for bread preparation was whole-grain wheat flour, usually coming from local varieties, and consequently, the traditional Mediterranean diet should be considered as a diet that is very rich in ARS. In modern days, the massive use of white (refined) flour from T. aestivum has significantly reduced the nutritional intake of ARS in Mediterranean populations.
Comparison among wheat species and previously reported ARS content in wheat grains and flour
In our study, the local, traditional variety of T. monococcum (known as “Kaploutzas”) showed the highest content of ARS in whole grain flour, i.e., even higher than the corresponding rye flour. It showed a small difference in comparison with T. dicoccum and a big difference with T. durum, T. aestivum and T. turgidum. Interestingly, the analysis of the grains showed that T. dicoccum presented the highest content of ARS (>1000 mg/Kg), close with that of T. monococcum, but again, very different from those of T. aestivum and T. durum. The results obtained herein are in agreement with previous analyses [4,6,15] concerning whole grain and refined white flours. Previous studies have also shown that the grains of T. monococcum and T. dicoccum are richer than T. aestivum and T. durum, but herein, the concentrations in local varieties of T. monococcum (925 mg/Kg) and T. dicoccum (1148 mg/Kg) were found to be much higher than what was previously reported from Germany and Hungary (391–819 mg/Kg) [4,8,17] and also from all other wheat grains reported until now, with the exception of T. timophevi (Figure A7). A comparative list of all previous studies measuring the levels of ARS in wheat grains and products is presented in Table A1.
ARS content of bread, pasta, wafers
The results obtained for T. dicoccum grains and the fact that this species is becoming popular again for baking prompted us to study the fate of ARS during the production of bread, flakes, wafers and pasta. Interestingly, all products contained significant amounts of ARS (Table 1, Figure A8). The flakes which has undergone the least processing, as expected, showed the highest content. Bread retained the majority of ARS during baking, in contrast to previous studies showing that ARS disappeared during baking. In fact, DMSO extraction and the applied analysis methods probably aided in overcoming the problems of previous methods, where interactions with starch led to poor results.

5. Conclusions

Alkylresorcinols are a class of major bioactive ingredients present in wheat flour and wheat-based products, and found in high amounts in old wheat varieties while being almost absent from the common white flours that are used for the mass production of bread nowadays. Their concentration can easily be measured by qNMR, permitting high-throughput analyses of flour and related products.

Author Contributions

Conceptualization, P.M. and E.M.; methodology, P.M., E.M., A.T.; investigation, A.T.; resources, P.M.; writing—original draft preparation, P.M.; writing—review and editing, P.M. and E.M. All authors have read and agreed to the published version of the manuscript.

Funding

This research received no external funding.

Acknowledgments

We would like to thank Antonopoulos Farm, Dilofo, Greece for offering the raw plant material and the processed products and Dan Flynn for its assistance in preparation of experimental breads.

Conflicts of Interest

The authors declare no conflict of interest.

Appendix A

Table A1 contains a comparative list of all previous studies measuring the levels of ARS in wheat grains and products. NMR spectra of analyzed seeds and beans are provided as Figure A1, Figure A2 and Figure A3. Examples of NMR spectra of extracts recorded in solvents other than DMSO are provided as Figure A4 and Figure A5. NMR spectra showing the recovery of each extraction step are provided as Figure A6. NMR spectra of wheat grains and products are provided as Figure A7 and Figure A8.
Figure A1. NMR spectra in DMSO from cereal flours without ARS.
Foods 09 01025 g0a1
Figure A2. NMR spectra in DMSO from cereal grains without ARS.
Foods 09 01025 g0a2
Figure A3. NMR spectra in DMSO from seeds and beans without ARS.
Foods 09 01025 g0a3
Figure A4. NMR spectrum of flour extract in Pyridine-d5.
Foods 09 01025 g0a4
Figure A5. NMR spectrum of flour extract in CD3OD.
Foods 09 01025 g0a5
Figure A6. 1H NMR spectrum of whole grain flour from Triticum dicoccum (ZEA®), after three successive extractions (red line 1st extraction, blue line 2nd extraction, green line 3rd extraction).
Foods 09 01025 g0a6
Figure A7. 1H-NMR spectra in d6-DMSO of extracts of grains showing the ARS peak.
Foods 09 01025 g0a7
Figure A8. 1H-NMR spectra in d6-DMSO of extracts of wheat products showing the ARS peak.
Foods 09 01025 g0a8
Table A1. Alkyresorcinols content in grains, flours and related products from wheat species reported in literature between 1988 and 2020.
ProductTriticum spp.OriginARs Content (mg/kg)Reference
whole-wheat flourTriticum spp.Finland759[6]
white wheat flour47
white wheat flour, organic44
wheat bran3225
white wheat breadnd
pasta48
T. durumFrance, Germany, and United Kingdom687[4]
T. aestivum909
T. spelta819
T. timophevi1480
T. compactum1090
T. ispahanicum982
T. polonicum951
T. paleocolchicum916
T. carthlicum876
T. sphaerococcum862
T. dicoccum819
T. dicoccoides787
T. orientale691
T. araraticum599
T. turanicum200
Commercial wheat branTriticum spp.Uppsala, Sweden2672
Commercial wheat bran based cereal1784
Commercial wheat breakfast biscuits558
Commercial whole grain wheat flour550
Commercial crusty whole grain wheat bread222
Commercial wholemeal wheat crackers179
Commercial wholemeal wheat bread142
Commercial wheat crispbread58
Commercial digestive biscuits57
Commercial white wheat flournd
Commercial white wheat breadnd
refined wheatTriticum spp.US20.9
semolinaT. durumUS71.3[17]
whole grainT. durumUS444.2
whole grainT. monococcumGermany391
whole grainT. turanicumGermany255.5
refined wheat flakes + branTriticum spp.France100.7
white wheat breadUS19.8
white wheat breadFrance28
refined wheat tortillaUS13.6
refined wheat crackersUS16.8
refined wheat dry toastItaly34.2
WG wheat breadUS277.5
WG wheat rollUS467
WG wheat dry toastItaly193
WG wheat dry toastFrance192.8
refined wheat pastaUS44
refined wheat pasta (raw)US53.5
refined wheat pasta (cooked)US58
refined wheat pastaItaly49.5
WG wheat pastaItaly201.2
WG wheat pastaUS237.5
WG wheat pasta 4 (raw)US348.9
WG wheat pasta 4 (cooked)US380.3
WG wheat pastaNetherlands383.1
WG wheat pastaItaly214.2
KernelT. durumAustria251–475[10]
France447–467
Kazakstan488–618
Russia483
Spain401–526
Sweden407–490
Commercial pastaSweden215–270
KernelT. aestivum springGermany663–862[18]
T. aestivum winter591–1077
T. durum springAustria430–797
T. durum winter554–675
Whole GrainT. aestivum winterSweden432–634[5]
T. aestivum spring227–353
wheat branT. aestivum2211 ± 605
white wheat flourT. aestivumnd
Commercial white breadTriticum spp.Latvia24.7–26.8[19]
Commercial white bread with seeds26.4–27.7
Commercial white breadFinland24.9–30.8
whole-grain wheatT. aestivumPoland586–943[7]
whole-grain wheat ground565–879
wheat bran2388–3186
Commercial whole-wheat flourTriticum spp.258–269
Commercial breakfast wheat cereals131–671
Commercial soft wheat bread0–23
breadT. spelta390
whole-grain breadTriticum spp.140–497
Wheat GrainT. speltaHungary427–605[8]
T. durum327–399
T.monococcum399–595
T.dicoccum444–581
T. aestivum spring341–416
T. aestivum winter340–410
GrainsT. durumHungary370 ± 100–452 ± 138[16]
T. aestivum spring494 ± 79–536 ± 111
T. aestivum winter500 ± 114–655 ± 142
GrainsT. aestivum winterSweden600[1]
BranT. aestivumChina697–1732[13]
White flourT. speltaChina31.8[15]
organic white wheat flourTriticum spp.China26.3
white wheat flourChina29.9–34.7
white wheat flourSweden13.5–27.6
semolinaChina46.6
brown wheat flourChina98.1- 215.6
Whole grain wheat flourChina285.4–660.3
organic whole grain wheat flourChina488.9
Whole grain wheat flourIndia138.4–345.5
Whole grain white wheatChina555.5
grainsT. speltaChina455.3
flourT. speltaSweden507.3
Whole grain wheat pasta China40.8
Whole grain wheat pastaTriticum spp.Italy313.7–340.5
Whole grain wheat pastaUnited Kingdom422.8–608.5
nd: non detected.

References

  1. Gohil, S.; Pettersson, D.; Salomonssona, A. Analysis of Alkyl- and Alkenylresorcinols in Triticale. J. Sci. Food Agric. 1988, 45, 43–52. [Google Scholar] [CrossRef]
  2. Kozubek, A.; Tyman, J.H.P. Resorcinolic lipids, the natural non-isoprenoid phenolic amphiphiles and their biological activity. Chem. Rev. 1999, 99, 1–26. [Google Scholar] [CrossRef]
  3. Landberg, R.; Marklund, M.; Kamal-Eldin, A.; Aman, P. An update on alkylresorcinols-Occurrence, bioavailability, bioactivity and utility as biomarkers. J. Funct. Foods 2014, 7, 77–89. [Google Scholar] [CrossRef]
  4. Ross, A.B.; Shepherd, M.J.; Schüpphaus, M.; Sinclair, V.; Alfaro, B.; Kamal-Eldin, A.; Aman, P. Alkylresorcinols in Cereals and Cereal Products. J. Agric. Food Chem. 2003, 51, 4111–4118. [Google Scholar] [CrossRef] [PubMed]
  5. Chen, Y.; Ross, A.B.; Aman, P.; Kamal-Eldin, A. Alkylresorcinols as Markers of Whole Grain Wheat and Rye in Cereal Products. J. Agric. Food Chem. 2004, 52, 8242–8246. [Google Scholar] [CrossRef] [PubMed]
  6. Mattila, P.; Pihlava, J.M.; Hellström, J. Contents of phenolic acids, alkyl- and alkenylresorcinols, and avenanthramides in commercial grain products. J. Agric. Food Chem. 2005, 53, 8290–8295. [Google Scholar] [CrossRef] [PubMed]
  7. Kulawinek, M.; Jaromin, A.; Kozubek, A.; Zarnowski, R. Alkylresorcinols in Selected Polish Rye and Wheat Cereals and Whole-Grain Cereal Products. J. Agric. Food Chem. 2008, 56, 7236–7242. [Google Scholar] [CrossRef] [PubMed]
  8. Andersson, A.; Kamal-Eldin, A.; Fras, A.; Boros, D.; Aman, P. Alkylresorcinols in Wheat Varieties in the HEALTHGRAIN Diversity Screen. J. Agric. Food Chem. 2008, 56, 9722–9725. [Google Scholar] [CrossRef]
  9. Nyström, L.; Lampi, A.M.; Andersson, A.A. Phytochemicals and dietary fiber components in rye varieties in the HEALTHGRAIN Diversity Screen. J. Agric. Food Chem. 2008, 56, 9758–9766. [Google Scholar] [CrossRef]
  10. Landberg, R.; Kamal-Eldin, A.; Andersson, R.; Aman, P. Alkylresorcinol Content and Homologue Composition in Durum Wheat (Triticum durum) Kernels and Pasta Products. J. Agric. Food Chem. 2006, 54, 3012–3014. [Google Scholar] [CrossRef]
  11. Landberg, R.; Linko, A.M.; Kamal-Eldin, A.; Vessby, B.; Adlercreutz, H.; Aman, P. Human plasma kinetics and relative bioavailability of alkylresorcinols after intake of rye bran. J. Nutr. 2006, 136, 2760–2765. [Google Scholar] [CrossRef] [PubMed] [Green Version]
  12. Zhu, Y.; Soroka, D.N.; Sang, S. Synthesis and inhibitory activities against colon cancer cell growth and proteasome of alkylresorcinols. J. Agric. Food Chem. 2012, 60, 8624–8631. [Google Scholar] [CrossRef] [PubMed]
  13. Liu, J.; Hao, Y.; Wang, Z.; Ni, F.; Wang, Y.; Gong, L.; Sun, B.; Wang, J. Identification, quantification and anti-inflammatory activity of 5-n-alkylresorcinols from 21 different wheat varieties. J. Agric. Food Chem. 2018, 66, 9241–9247. [Google Scholar] [CrossRef] [PubMed]
  14. European Commission. Commission Regulation (EU) No 432/2012 of 16 May 2012 Establishing a List of Permitted Health Claims Made on Foods, Other than those Referring to the Reduction of Disease Risk and to Children’s Develop-Ment and HealthText with EEA Relevance; European Commission: Brussels, Belgium, 2012. [Google Scholar]
  15. Ross, A.B.; Kochhar, S. Rapid and Sensitive Analysis of Alkylresorcinols from Cereal Grains and Products Using HPLC—Coularray-Based Electrochemical Detection. J. Agric. Food Chem. 2009, 57, 5187–5193. [Google Scholar] [CrossRef]
  16. Landberg, R.; Andersson, A.A.M.; Åman, P.; Kamal-Eldin, A. Comparison of GC and colorimetry for the determination of alkylresorcinol homologues in cereal grains and products. Food Chem. 2009, 113, 1363–1369. [Google Scholar] [CrossRef]
  17. Ross, A.B. Analysis of Alkylresorcinols in Cereal Grains and Products Using Ultrahigh-Pressure Liquid Chromatography with Fluorescence, Ultraviolet, and CoulArray Electrochemical Detection. J. Agric. Food Chem. 2012, 60, 8954–8962. [Google Scholar] [CrossRef]
  18. Knödler, M.; Most, M.; Schieber, A.; Carle, R. A novel approach to authenticity control of whole grain durum wheat (Triticum durum Desf.) flour and pasta, based on analysis of alkylresorcinol composition. Food Chem. 2010, 118, 177–181. [Google Scholar] [CrossRef]
  19. Meija, L.; Samaletdin, A.; Koskela, A.; Lejnieks, A.; Lietuvietis, V.; Adlercreutz, H. Alkylresorcinols in Latvian and Finnish breads. Integr. J. Food Sci. Nutr. 2013, 64, 117–121. [Google Scholar] [CrossRef]
  20. Sampietro, D.A.; Jimenez, C.M.; Belizán, M.M.; Vattuone, M.A.; Catalán, C.A.N. Development and validation of a micromethod for fast quantification of 5-n-alkylresorcinols in grains and whole grain products. Food Chem. 2013, 141, 3546–3551. [Google Scholar] [CrossRef]
  21. Karkoula, E.; Skantzari, A.; Melliou, E.; Magiatis, P. Direct measurement of oleocanthal and oleacein levels in olive oil by quantitative 1H NMR. Establishment of a new index for the characterization of extra virgin olive oils. J. Agric. Food Chem. 2012, 60, 11696–11703. [Google Scholar] [CrossRef]
  22. Manoukian, P.; Melliou, E.; Liouni, M.; Magiatis, P. Identification and quantitation of benzoxazinoids in wheat malt beer by qNMR and GC–MS. LWT Food Sci. Technol. 2016, 65, 1133–1137. [Google Scholar] [CrossRef]
  23. Nikolantonaki, M.; Magiatis, P.; Waterhouse, A.L. Direct analysis of free and sulfite-bound carbonyl compounds in wine by two-dimensional quantitative proton and carbon nuclear magnetic resonance spectroscopy. Anal. Chem. 2015, 87, 10799–10806. [Google Scholar] [CrossRef] [PubMed]
  24. Fernandez-Pastor, I.; Luque-Muñoz, A.; Rivas, F.; Medina-O’Donnell, M.; Martinez, A.; Gonzalez-Maldonado, R.; Haidour, A.; Parra, A. Quantitative NMR analysis of L -Dopa in seeds from two varieties of Mucuna pruriens. Phytochem. Anal. 2019, 30, 89–94. [Google Scholar] [CrossRef] [PubMed] [Green Version]
  25. Tanaka, R.; Inagaki, R.; Sugimoto, N.; Akiyama, H.; Nagatsu, A. Application of a quantitative 1H-NMR (1H-qNMR) method for the determination of geniposidic acid and acteoside in Plantaginis semen. J. Nat. Med. 2017, 71, 315–320. [Google Scholar] [CrossRef] [PubMed]
  26. Çiçek, S.S.; Girreser, U.; Zidorn, C. Quantification of the total amount of black cohosh cycloartanoids by integration of one specific 1H NMR signal. J. Pharm. Biomed. Anal. 2018, 155, 109–115. [Google Scholar] [CrossRef] [PubMed]
  27. Iwatsuki, K.; Akihisa, T.; Tokuda, H.; Ukiya, M.; Higashihara, H.; Mukainaka, T.; Iizuka, M.; Hayashi, Y.; Kimura, Y.; Nishino, H. Sterol ferulates, sterols, and 5-alk(en)ylresorcinols from wheat, rye, and corn bran oils and their inhibitory effects on Epstein−Barr virus activation. J. Agric. Food Chem. 2003, 51, 6683–6688. [Google Scholar] [CrossRef] [PubMed]
  28. Wu, L.-Q.; Yang, C.-G.; Yang, L.-M.; Yang, L.-J. Ultrasound-assisted Wittig reaction and synthesis of 5-alkyl- and 5-alkenyl-resorcinols. J. Chem. Res. 2009, 2009, 183–185. [Google Scholar] [CrossRef]
  29. Pauli, G.F.; Gödecke, T.; Jaki, B.U.; Lankin, D.C. Quantitative 1H NMR. Development and potential of an analytical method: An update. J. Nat. Prod. 2012, 75, 834–851. [Google Scholar] [CrossRef] [Green Version]
  30. Bharti, S.K.; Roy, R. Quantitative 1H NMR spectroscopy. Trends Anal. Chem. 2012, 35, 5–26. [Google Scholar] [CrossRef]
Figure 1. 1H-NMR spectra in DMSO-d6 of flour extracts. The highlighted peak corresponds to the total 5-alkylresorcinols.
Foods 09 01025 g001
Figure 2. 1H-NMR spectrum of the fraction containing the isolated ARS in CDCl3 (a) and in DMSO (b).
Foods 09 01025 g002aFoods 09 01025 g002b
Figure 3. GC chromatogram of the isolated compounds.
Foods 09 01025 g003
Table 1. Concentration of total alkylresorcinols in flours, grains and processed products.
SampleARS mg/KgARS mmol/Kg
Flours
T. monococcum, whole-grain flour638 ± 321.64 ± 0.08
Secale cereale, whole-grain flour574 ± 231.47 ± 0.06
T. dicoccum, whole-grain flour510 ± 301.31 ± 0.07
T. durum, whole-grain flour191 ± 60.49 ± 0.02
T. aestivum, whole-grain flour121 ± 50.33 ± 0.01
T. turgidum, whole-grain flour63 ± 30.16 ± 0.01
T. aestivum, white-flourNDND
Wheat grains
T. dicoccum1148 ± 582.95 ± 0.15
T. monococcum925 ± 742.37 ± 0.19
T. aestivum255 ± 230.65 ± 0.06
T. durum (cv.deveta)255 ± 120.65 ± 0.03
T. durum (cv.dourouki)191 ± 40.49 ± 0.01
Processed products
T. dicoccum Bread from whole-grain flour455 ± 321.17 ± 0.08
T. dicoccum Flakes1090 ± 542.79 ± 0.14
T. dicoccum Wafers351 ± 140.9 ± 0.04
T. dicoccum Pasta330 ± 100.85 ± 0.03
T. monococcum Flakes1084 ± 972.78 ± 0.25
T. aestivum Bread from white flourNDND
ND: not detected.

