Article

An Artificial Intelligence Approach for Italian EVOO Origin Traceability through an Open Source IoT Spectrometer

1
Consiglio per la Ricerca in Agricoltura e l’analisi dell’economia Agraria (CREA)—Centro di Ricerca Ingegneria e Trasformazioni Agroalimentari, Via della Pascolare 16, 00015 Monterotondo (Rome), Italy
2
Consiglio per la Ricerca in Agricoltura e l’analisi dell’economia Agraria (CREA)—Centro di Ricerca Olivicoltura, Frutticoltura e Agrumicoltura, Contrada Li Rocchi Vermicelli 83, 87036 Rende (CS), Italy
*
Author to whom correspondence should be addressed.
Foods 2020, 9(6), 834; https://doi.org/10.3390/foods9060834
Submission received: 8 June 2020 / Accepted: 17 June 2020 / Published: 25 June 2020
(This article belongs to the Special Issue Extra Virgin Olive Oil Quality, Safety, and Authenticity)

Abstract

:
Extra virgin olive oil (EVOO) represents a crucial ingredient of the Mediterranean diet. Being a first-choice product, consumers should be guaranteed its quality and geographical origin, justifying the high purchasing cost. For this reason, it is important to have new reliable tools able to classify products according to their geographical origin. The aim of this work was to demonstrate the efficiency of an open source visible and near infra-red (VIS-NIR) spectrophotometer, relying on a specific app, in assessing olive oil geographical origin. Thus, 67 Italian and 25 foreign EVOO samples were analyzed and their spectral data were processed through an artificial intelligence algorithm. The multivariate analysis of variance (MANOVA) results reported significant differences (p < 0.001) between the Italian and foreign EVOO VIS-NIR matrices. The artificial neural network (ANN) model with an external test showed a correct classification percentage equal to 94.6%. Both the MANOVA and ANN tested methods showed the most important spectral wavelengths ranges for origin determination to be 308–373 nm and 594–605 nm. These are related to the absorption of phenolic components, carotenoids, chlorophylls, and anthocyanins. The proposed tool allows the assessment of EVOO samples’ origin and thus could help to preserve the “Made in Italy” from fraud and sophistication related to its commerce.

Graphical Abstract

1. Introduction

Extra virgin olive oil (EVOO) represents one of the most important ingredients of the Mediterranean diet, being used by most of the countries within the Mediterranean basin, owing to its excellent qualities and sensory properties ascribable to the fruits of olive trees (Olea europaea L.) [1]. The qualitative characteristics and the taste of EVOO are largely influenced by the olive plant varieties, the geographical origin, and the agronomic and production techniques employed as well. [2]. Recently, the consumption of EVOO has increased worldwide, even outside the Mediterranean and European countries (for example, India, Russia, China, and Australia). This trend demonstrates an increasing interest of both the producers and the consumers on the quality of food and calls for proper geographical identification and traceability of EVOOs [3].
The price of EVOO is on average 4–5 times higher than other vegetable oils. This is due to the higher production costs and to its higher nutritional and organoleptic properties. Therefore, the higher cost should in principle help to ensure high quality standards. On the other hand, the consumer is increasingly oriented towards the purchase of genuine food products with certified geographical origin [4]. In order to preserve the EVOO origin, the European Commission has established two types of certification relative to geographical origin and identification, namely the protected designation of origin (PDO) and the protected geographical indication (PGI) [4]. The definition of PGI refers to agricultural products and foodstuffs for which at least one stage of the production process must be carried out within a defined geographical area. For PDO, on the other hand, the entire production cycle must take place in a specific area. PGI labelling, therefore, focuses on quality and specific characteristics related to geographical origin [5]. As reported by the production regulations, in order to obtain the PDO certification, several conditions must be met such as a specific percentage of olive cultivars employed, well-defined cultivation practices, limited geographical areas of production, and specific characteristics regarding chemical and sensory properties of the final product. However, at the moment, to the best of our knowledge, there are no analytical parameters allowing a post hoc test on the actual geographical origin of PDO EVOOs. As a consequence, chemical and physical analyses are currently of limited use in the EVOO geographical certification [6].
Italy is one of the most important countries in the world in terms of olive oil supply and demand. Moreover, while the country boasts a large number of designations of origin labels, in total there are indeed forty-two PDOs of EVOO, the geographical indications, PGIs, exist for a limited number of three. The most active regional Italian realities are mainly located in the southern part of the peninsula, namely the region of Sicily with six PDOs and one PGI, Puglia with five PDOs, and Campania and Calabria with three PDOs each; however, there are also two important Italian central regions, such as Lazio and Tuscany, with four PDOs and one PGI, and five PDOs and one PGI, respectively [7].
Unfortunately, nowadays, one of the most common counterfeits to the detriment of the producer is the falsification of the EVOO geographical origin. Despite the great commitment and work of the authorities, counterfeiting is highly relevant for both the internal market and the global one, with difficulties in identifying and adopting convenient and reliable solutions. Indeed, due to lack of incentives, and often complex management to comply with, the technologies promoting product traceability are often difficult to implement.
Given the presence of consumers not aware of the fakes, an increasing number of low-quality olive oils often end up on the table, being not easily identifiable. The problems do not only concern consumers but also producers who operate correctly who are not economically damaged by the irregular practices of other companies [7]. Nevertheless, this type of counterfeiting causes enormous damages to the “Made in Italy” products’ image and to the economy of the country.
Fake EVOO bottles often report on the label incorrect information about the product or even refer to a totally different oil.
The “Made in Italy” products are represented by a set of values enabling the consumer to distinguish them from the foreign ones. However, sometimes their advertisement is used to lead the consumer to pay an even higher price for fake qualities relative to a forged product [8]. Thus, the consumer must also be aware of the differences between fake and authentic products, being guided through tools that allow them to distinguish “what is” from “what appears to be” [4].
However, within a globalized market, the fight against these counterfeits cannot be solely based on the enhancement of consumers’ awareness on the peculiarities and qualities that distinguish the “Made in Italy” from other products. Useful tools to contend with counterfeiting are those ensuring traceability [9], namely, the “possibility of reconstructing and following the path of a food in all phases of production, transformation and distribution” [10]. Therefore, traceability systems (technological and informative) are needed to strengthen and update a reliable information flow along the whole supply chain, simplifying consumers’ access to information. An infotracing traceability system can integrate information related to product quality with that regarding its traceability (physical and documentary), taking advantage of an online information system [9]. As reported by Violino et al. [11], EVOO traceability is not only important to define olive oil origin, but it is fundamental for the protection against fraud. In addition, innovative tools (e.g., radio frequency identification (RFID), near field communication (NFC), and QR code technologies in combination with blockchain systems) can be commercially implemented to verify the processes and could aid in controlling the quality of virgin olive oil. An example is represented by the use of the blockchain system (a distributed database of records in the form of encrypted blocks), where the developed online information (transactions) can be protected to proof against eventual alteration and fraud [12].
Nowadays, the traceability of food products has become a priority for both consumers, who are increasingly careful to buy healthy higher quality food, and producers. Indeed, traceability can guarantee the quality of raw materials, product certification, allow a rapid identification of problematic product lots, and permit the implementation of control systems to prevent fraud. Finally, food traceability is crucial to enhance transparency for a safer internationalization of the EVOO market, with consequent fair growth of the sector [13].
In the last decade, several analytical techniques have been developed to help the identification of olive oil [14,15], and about 200 compounds, out of hundreds, have been proved to be useful as compositional markers for traceability purposes of EVOO [16]. Compositional markers include both major and minor components. State of the art EVOO traceability approaches for geographical origin assessment are represented by major components determination (e.g., triacylglycerols, triglycerides, and fatty acids), stable isotopic ratio (e.g., 13C/12C in combination with 18O/16O), and multi-element characterization through the application of different multivariate statistical techniques [3]. Those commonly used for data analysis are cluster analysis, multidimensional scaling, artificial neural networks (ANNs), and partial least squares discriminant analysis (PLSDA).
The multi-element analysis carried out by Benincasa et al. [17] allowed for a correct classification of all the organic virgin olive oils under investigation collected from different Italian regions; however, as often visible in similar studies, the method showed a high, but not excellent, percentage of correct classifications. Another example is given by the stable isotope analysis made by Portarena et al. [18], reporting an r ranging from 0.76 to 0.80 in distinguishing the compositions of Italian monovarietal olive oils.
Numerous analytical techniques have focused on targeted approaches for the identification and quantification of pre-defined compounds, or classes of compounds. These include gas and liquid chromatography (GC and HPLC) coupled with mass spectrometry (MS) [19,20], nuclear magnetic resonance (NMR) spectroscopy [21], infrared spectroscopy [22], fluorescence [23], inductively coupled plasma mass spectrometry (ICP-MS) [17], and DNA-based methods [24]. Conversely, limited literature is available about the assessment of olive oil adulteration using non-targeted classification approaches, focusing on the detection of all compounds in a sample without a priori knowledge of chemical entities comparable with the reference of the pure sample fingerprint profile [25,26].
Recently, fundamental research has focused on the development of non-destructive techniques to reduce the use of solvents and reagents. This is done taking into account an international context of convergence towards higher environmental sustainability and an increased human health consciousness [27]. Among various non-destructive solutions aiming to fulfill these needs, near infrared spectroscopy (NIRS) has made major achievements. NIRS, paired with chemometric techniques, were satisfactorily used for olive oil authentication and screening [28,29,30,31,32,33]. Generally, using both software and hardware, open source infostructure solutions potentially result in significant cost reduction, making the scientific tools available for a wider audience [34]. Following this path, results such as the prediction of qualitative parameters, the evaluation of indices of different fruit and vegetable products [35], the authentication of olive oil according to the variety and geographical origin [36], and the detection of adulteration through acidic composition [37] were achieved using visible/near-infrared (VIS-NIR) spectroscopy.
The aim of this work was to assess the actual geographical origin of EVOOs labeled on the market as Italian and test the potential efficiency of an open source VIS-NIR device for traceability purposes. Indeed, the device could produce results for olive oil authentication (according to its variety and origin) and for the detection of fraud in a fraction of time and potentially on a much higher sampling number with respect to conventional analytical methods. In detail, the study pursued the goal of analyzing 92 Italian and foreign EVOO samples produced in 2018 and 2019. The samples were purchased from large commercial retailers and directly from olive mills (to ensure the true origin of the product). The spectral data were analyzed with an artificial intelligence model based on neural networks.

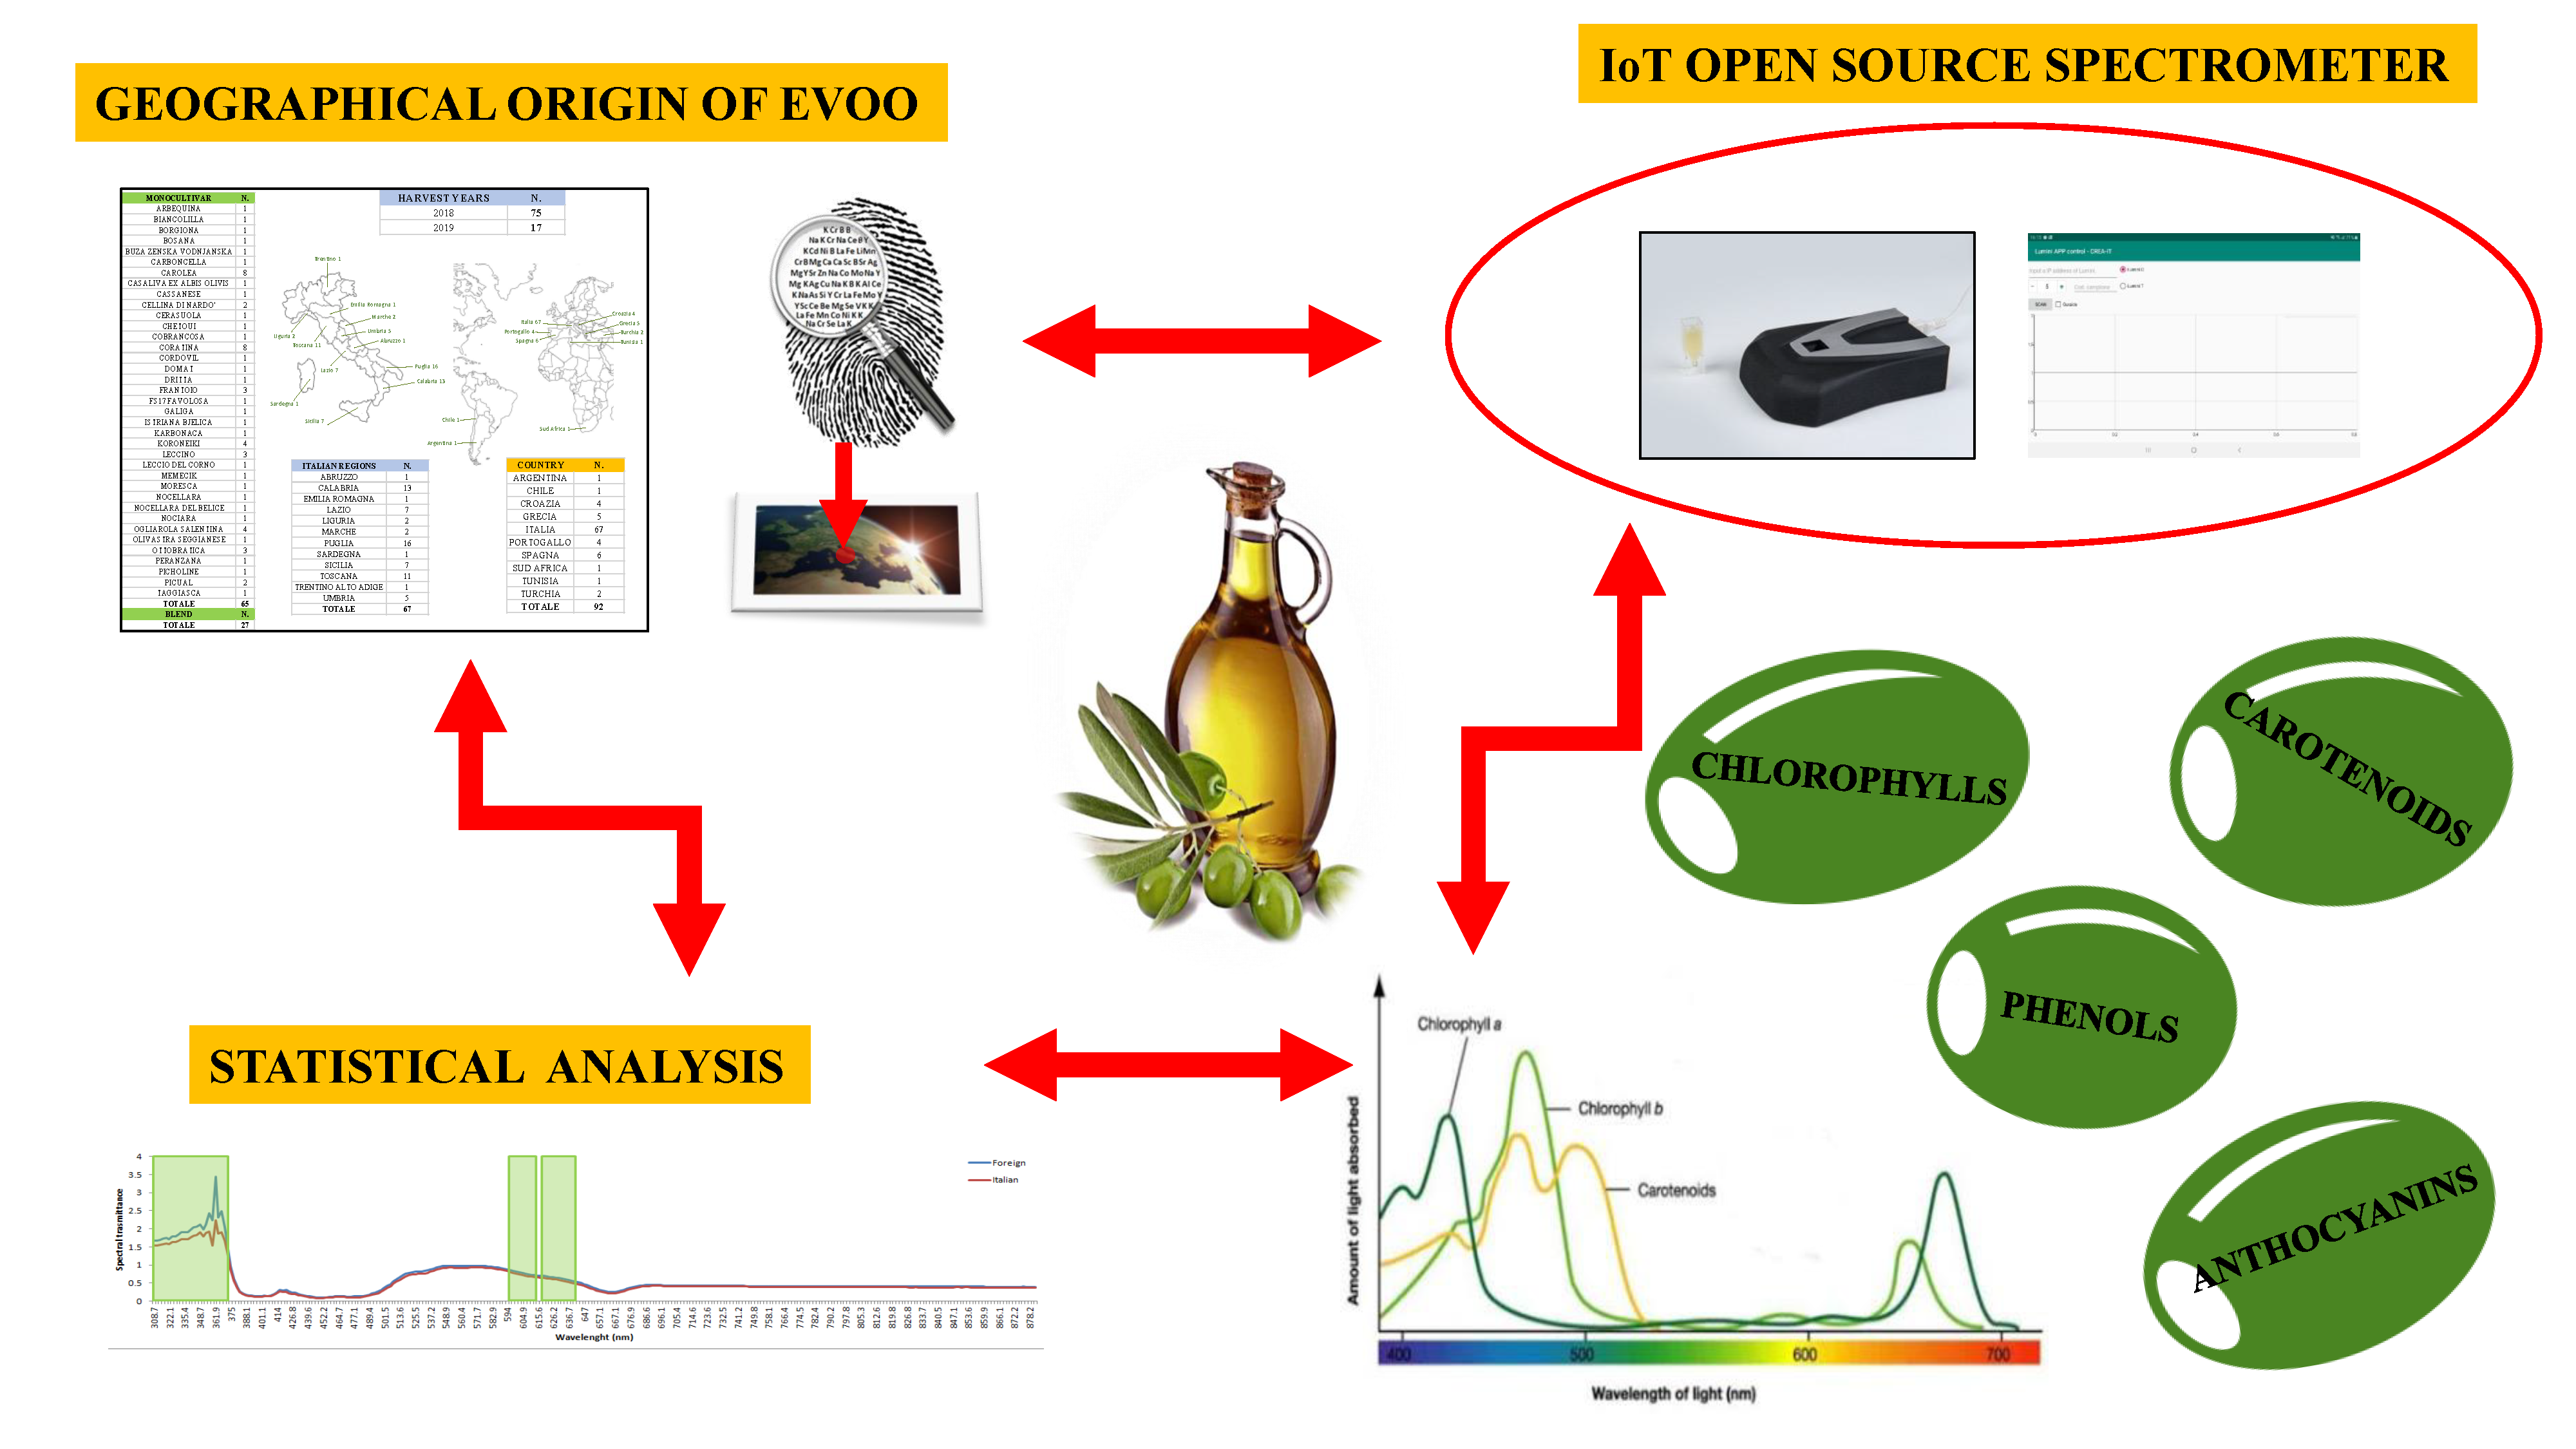
2. Materials and Methods
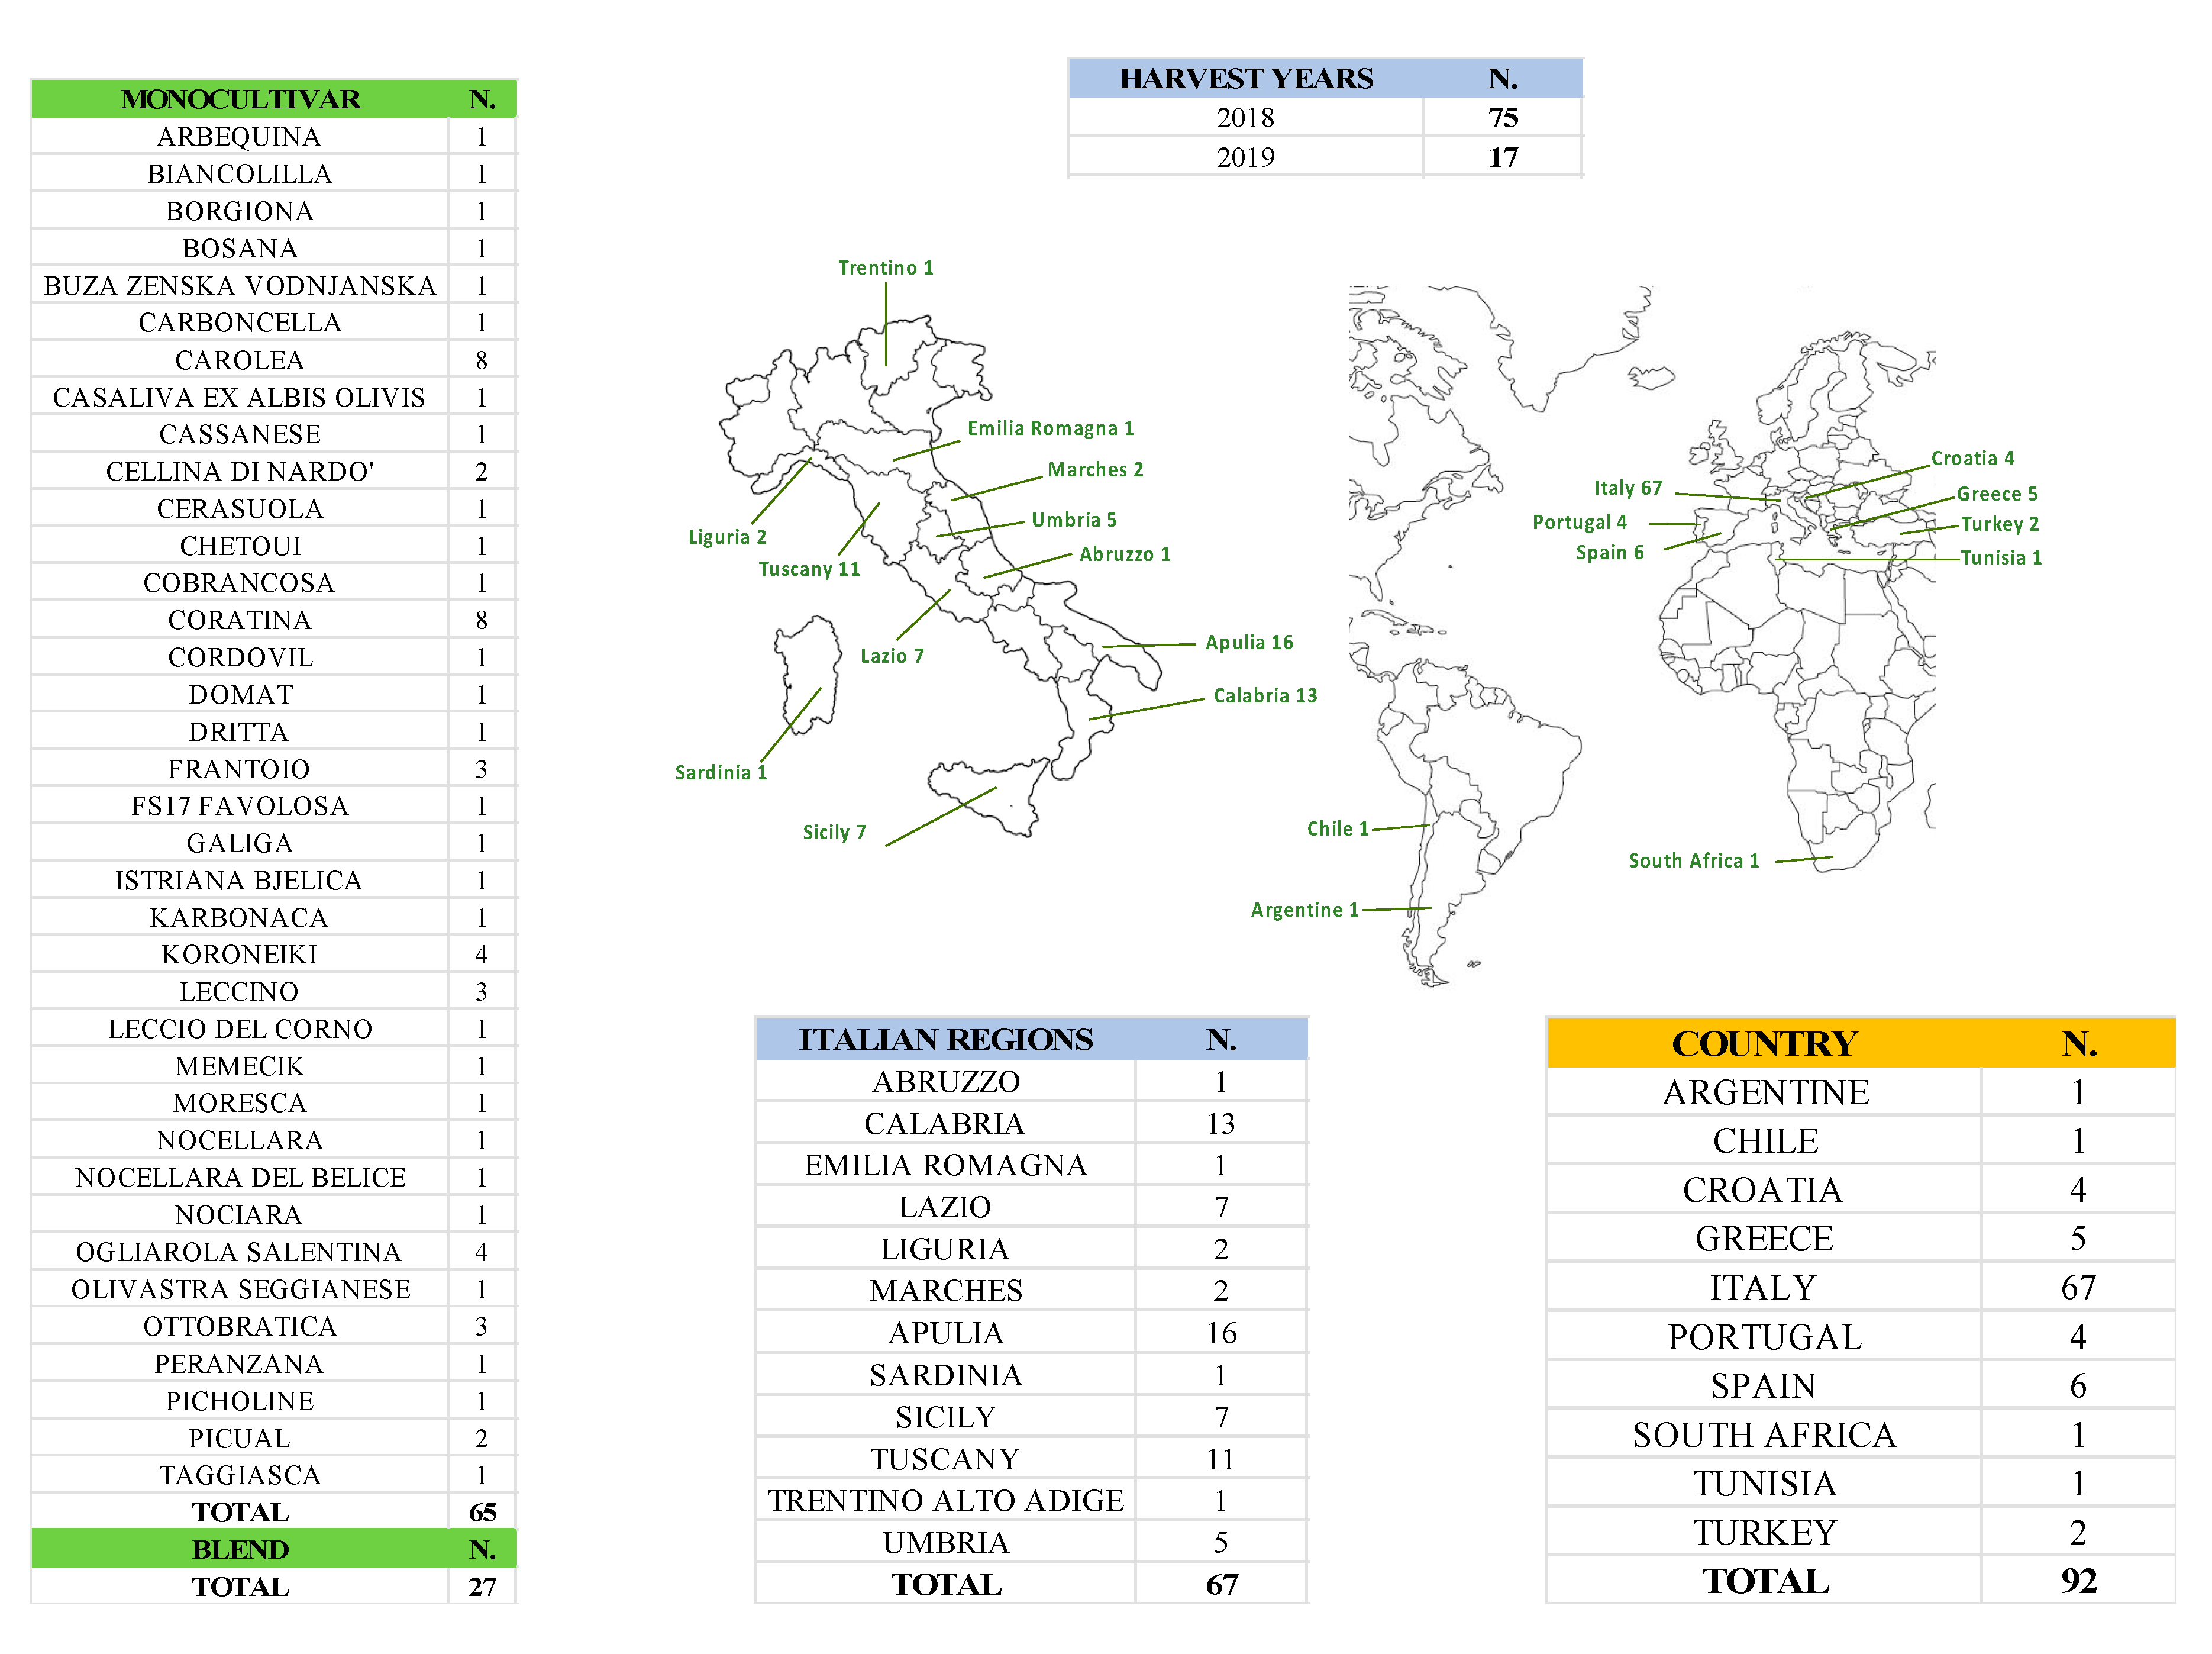
2.1. EVOO Samples

The study analyzed a total of 92 samples of Italian and foreign extra virgin olive oil (EVOO) owing to different cultivars, monovarietal (65) and blend (27), produced in two harvest years (2018 and 2019) (Figure 1).
The tested samples were bought from large retailers and directly from mills. Some samples were acquired specifically from the mills of the areas of Apulia, Calabria, and Sicily to ensure their origin. Other samples were sent, on a voluntary base, directly by the producers willing to participate in the research.

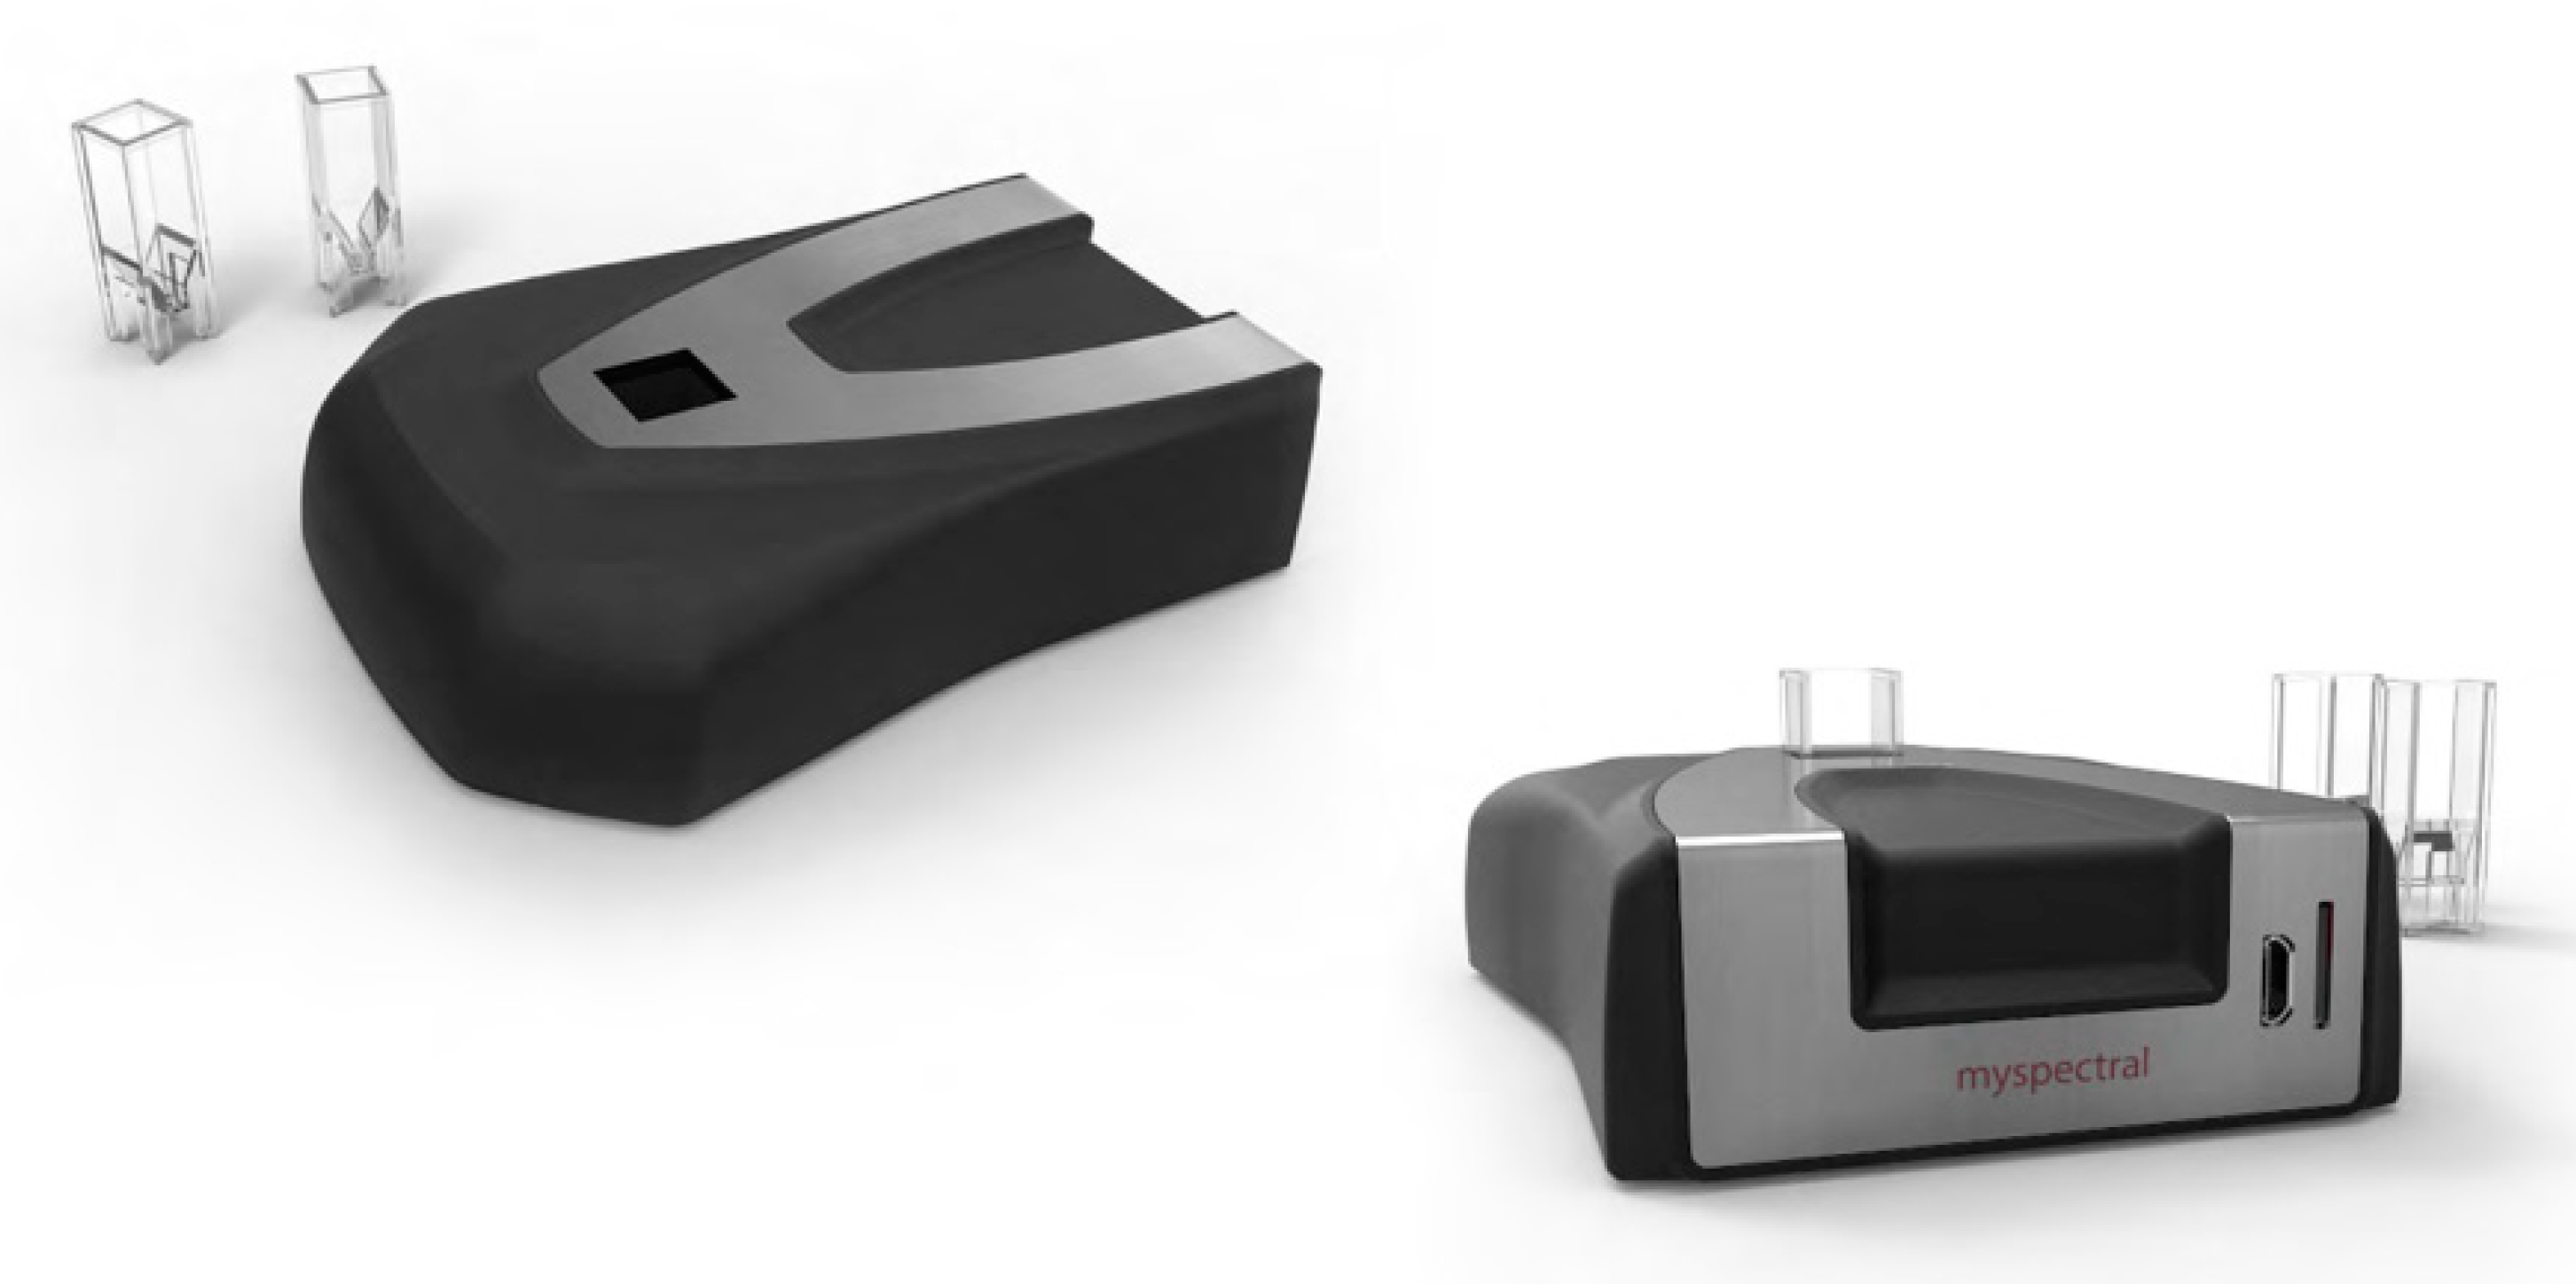
2.2. The Open Source IoT Spectrometer

The analyzed samples were stored and kept during the analyses at a controlled temperature of 16 °C. The samples, owing to the 2018 harvest campaign, were analyzed between March and May 2019 while those produced in the 2019 harvest campaign were analyzed between February and March 2020. The samples were scanned with a VIS-NIR spectrometer measuring and acquiring the spectral reflectance signatures for the EVOO samples for consequent qualitative evaluation. From each oil container (bottle or can) of the same sample, 12 spectral readings were acquired and afterwards averaged. The device used was the ultra-compact VIS-NIR spectrophotometer (Figure 2) Lumini C (Myspectral Ltd., Cambridge, MA, USA), able to measure spectral reflectance or absorbance. The device is small, light, low-cost, and open source. The spectral ranges covered 340–890 nm with an optical resolution equal to 8 nm and wavelength accuracy equal to 0.5 nm. The spectrophotometer is powered through a USB cable and stores data on connected cabled devices or on an internal micro SD card using a dedicated slot. For appropriate acquisition of the spectral signature, in relation to the sample reflectance characteristics, the acquisition can be set at different integration times. The system is equipped with its own internal illumination system.
A specific app was developed to manage and simplify the acquisition procedures. The software provided with the spectrophotometer, as commonly happens with open source technologies, was quite poor in terms of features and did not originally provide an appropriate historicization system for multiple acquisitions. For this reason, an app was developed and implemented. A screenshot of the app is reported in Figure 3.
The app was engineered considering two kinds of functions. The first (upper side of Figure 3) enables the configuration parameters of the instrument, such as the IP address, to connect the tablet to the device, the type of tool (in this case is Lumini C), the exposure time expressed in milliseconds (ms), and the sample’s name to be archived. The second (lower side of Figure 3), graphically represents the acquired spectrum for each scan. When a new sample name is entered, the graphic area is reset, ready to display the new spectra. This helps in case of incomplete or bad acquisition since it avoided losing samples’ values during the acquisition campaign. The app was developed using the Android environment and it is based on a client-server paradigm; on the client side there is the app, and on the server side there is the database for real-time storage of the spectrum and the node.js server to which the Lumini C is connected (Figure 4). The app software implements control mechanisms for the data stored on the database; these are essential since the data stored originally onboard within a microSD are now stored to a remote database. Through this mechanism, the data loss is minimized. In case of communication problems among the devices, the app notifies the problem and does not display the spectrum just acquired, allowing for a new scanning process.

2.3. Statistical Analysis

The multivariate matrix of Italian and foreign EVOO samples was analyzed with a 50–50 multivariate analysis of variance (MANOVA) procedure [38], a generalized multivariate Anova method based on principal component analysis (PCA) standardized data. The MANOVA was conducted in order to highlight significant differences between Italian and foreign VIS-NIR matrices. Adjusted p-values were conducted on a rotation testing based on 99,999 simulated datasets. The contribution of the variables was extracted for each rotation test [39].
An artificial intelligence approach was then applied in order to evaluate the possibility to classify Italian EVOOs and distinguish them from the foreign ones on the base of the 288 spectral transmittance values acquired through the VIS-NIR device. To do this, a multilayer feed forward artificial neural network (MLFN) was designed using a single hidden layer architecture with sigmoid hidden and SoftMax output neurons. The ANN was trained with the Bayesian regularization back propagation algorithm [40,41], as implemented in the deep learning MATLAB (The MathWorks, Inc., MA, USA) toolbox. The dataset was partitioned using 60 percent of the samples (55) as a training set and the rest as a test set (37). The test set was used to validate the model. This partitioning (equal for each soil group) was optimally chosen with the Euclidean distances calculated by the algorithm reported by Kennard and Stone [42], selecting parameters without a priori knowledge of a regression model. The cost function was minimized using the root mean squared (RMS) normalized error performance function with a 10−8 threshold on the gradient. In order to extract the most informative spectral transmittance values among the 288 acquired, in distinguishing Italian EVOO from foreign ones, it also conducted an analysis to study the feature importance. The hidden layer matrix (10 nodes × 288 variables) was a posteriori analyzed considering its elementwise absolute value. From the matrix was extracted the maximum value for each variable (e.g., column) obtaining a 1 × 288 row vector. The top 40 most significant spectral frequencies were chosen. The larger the value, the more relevant was the contribution to the ANN model. The model was developed using the MATLAB 9.7 R2019b Deep Learning Toolbox.

3. Results and Discussion

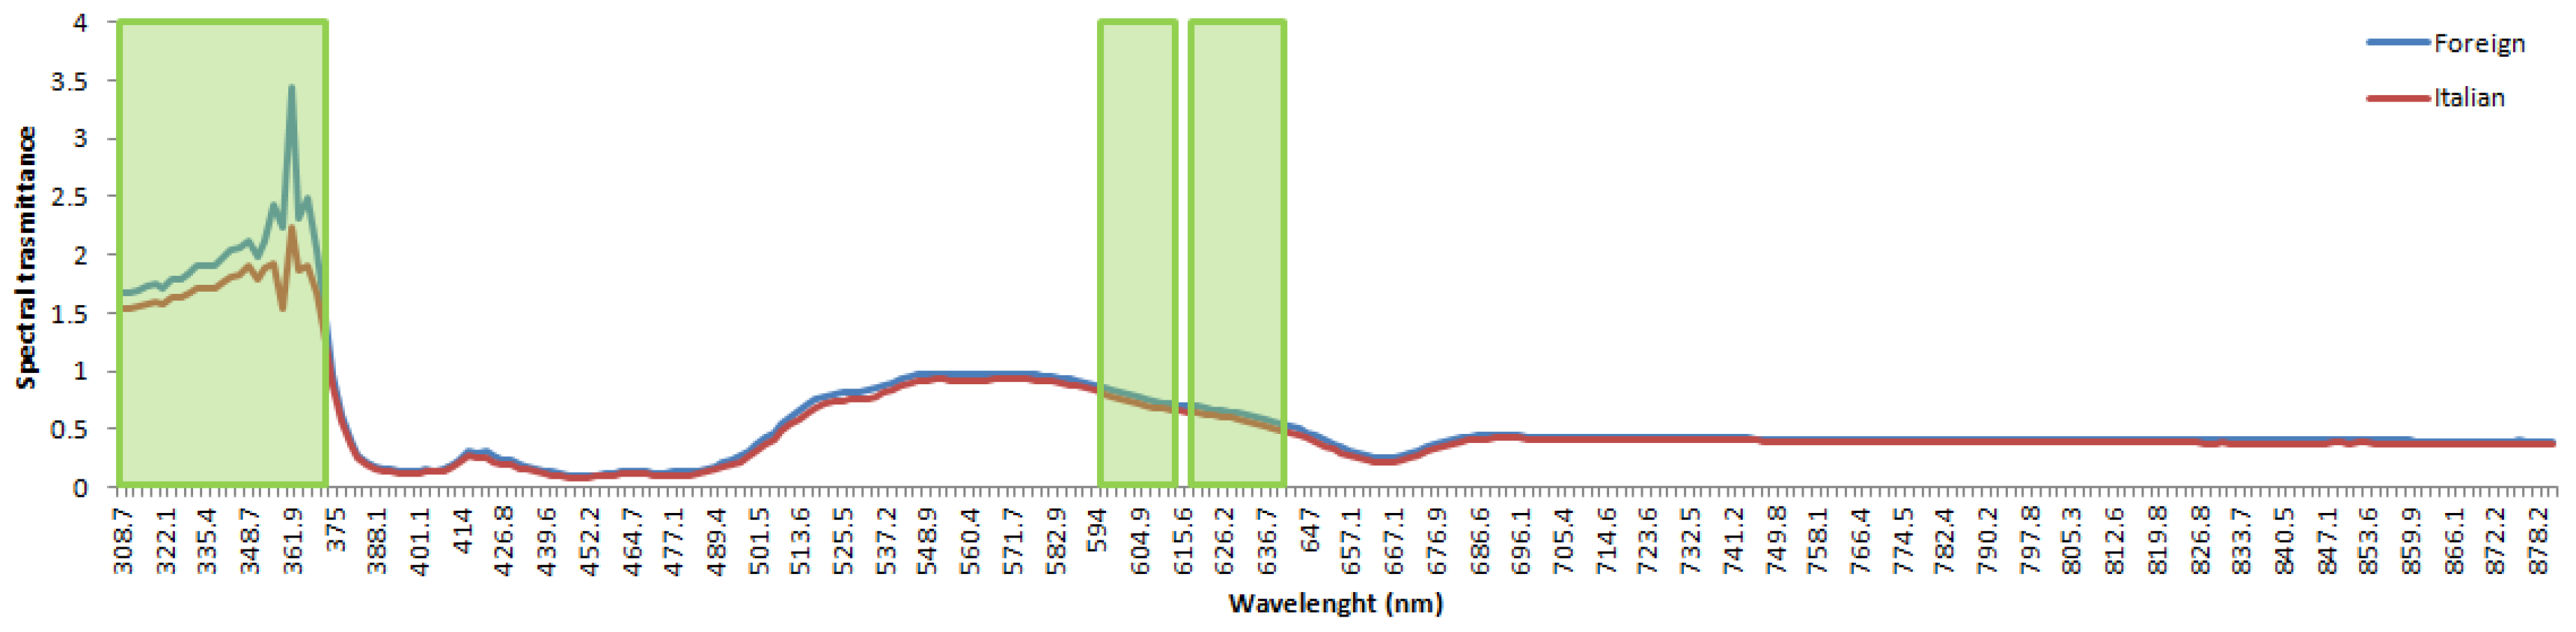
3.1. Artificial Intelligence Modeling Based on VIS-NIR Spectra

The MANOVA (50–50 MANOVA procedure) reported significant differences (p < 0.001) between the two Italian and foreign EVOO VIS-NIR matrices. The results of the analysis are reported in Table 1.
The ANN trained had a hidden layer size of 10 nodes and the algorithm converged after 976 iterations. Table 2 reports the characteristics and principal results of the ANN model used to predict Italian vs. foreign EVOO on the base of 288 VIS-NIR spectral transmittance data. All the 55 EVOOs in the training set were correctly classified. In testing, only five out of 37 samples were misclassified. These five samples consisted of two Italian commercial monocultivars (Coratina from Apulia and Taggiasca from Liguria) and three foreign blends from Greece, Argentina, and Croatia. Overall, 87 out of 92 samples (94.6%) were correctly classified.
The confusion matrix of the test set is reported in Table 3.
Overall, VIS-NIR spectroscopy analyses showed significant differences between Italian and foreign samples. From the results obtained through the ANN analysis, only five samples out of 37 were misclassified, e.g., two Italian commercial monocultivars (Coratina from Apulia and Taggiasca from Liguria) and three foreign blends (from Greece, Argentina, and Croatia). Probably, the two Italian samples were misclassified because of their uncertain geographical origin, considering that they are commercial oils. All the samples bought directly from the mills (noncommercial) were correctly classified. The off diagonal elements of the test confusion matrix (Table 3) are reported in Table 4.
Generally, machine learning relies on the amount of data for good modeling, where more data correspond to a modeling approach with increased robustness and performance. For this reason, even if the overall accuracy of the model is almost 90% and the convergence threshold of 10-8 on the RMS error gradient is very strict, the small size of the dataset (made of 92 samples) is not enough to validate the model. On the other hand, the high accuracy obtained despite the small dataset returns the reliability of the correlation observed [43].
The present work considered 67 Italian EVOOs and 25 foreign ones (two harvesting years: 2018 and 2019). However, it must be considered that other work using different methods to authenticate EVOO geographical origin were developed using a number of samples comparable and sometimes lower than that presented in this work. As reported by Bucci et al. [44], the data set for the statistical analysis was constructed on the results of the chemical analyses performed on 153 EVOOs (years of harvesting: 1997–1999), but finally only the samples produced in 1999 (53 oils) were analyzed in the laboratory. In the work conducted by Portarena et al. [45], they analyzed the isotopic composition and carotenoid content of 38 EVOOs from seven regions along the Italian coast using isotope ratio mass spectrometry (IRMS) and resonance Raman spectroscopy (RRS). The correlation between color and pigment content is well known in the literature [46]: the crushing of very green olives produces a typical green colored oil due to the high content in chlorophyll; if olives are more mature, carotenoids will prevail, determining a yellow-gold colored oil. Additionally, as the maturation progresses, the content and profile of phenolic compounds will also be affected: crushing green olives will result in an oil characterized by a higher content of phenolic acids, phenolic alcohols, oleuropein, and secoiridoids, whereas oils produced with dark brown olives will have a high content of anthocyanins, water-soluble plant pigments that take on different colors: red, blue, or violet [47,48].

3.2. Feature Importance

Observing the top 40 MANOVA rotation test’s most important variables (e.g., spectral lengths), the most informative ones ranged within the following frequencies: 308–373 nm, 594–612 nm, and 617–641 nm. The average VIS-NIR spectral data of foreign and Italian EVOOs are reported in Figure 5 together with the higher importance spectral values extracted with the aforementioned MANOVA rotation test.
Consequently, the 40 most important features extracted through the ANN procedure (e.g., spectral lengths), ranged within the following frequencies: 308–378 nm, 415–422 nm, 474–507 nm, 564–570 nm, and 596–605 nm. The average VIS-NIR spectral data of both Italian and foreign samples, together with the higher importance spectral values in terms of ANN feature importance, are reported in Figure 6.
The two feature importance approaches, MANOVA and ANN, evidenced common ranges of higher importance, which were: 308–373 nm and 594–605 nm. These spectral bands represent portions of the visible spectral range. The color of an oil is, therefore, due to the combination and proportion of its pigments [49]. These molecules do not depend only on the characteristics of the fruits (Olea europaea L.), the extraction processes used to produce the oil, and the conservation conditions [50] but, also, on weather and pedo-climate conditions [51]. Therefore, the relationship between the stage of ripeness and pigment content in EVOO could be, indeed, very important for further authentication studies [52].
The molecular structure of chlorophylls and, in particular, the planar structure of the tetrapyrrolic macrocycle coordinated by a magnesium ion, Mg++, is responsible for the absorption of visible light in the green region. Chlorophyll a gives a greenish-blue coloration, while chlorophyll b determines a yellowish-green color. The sensitivity of chlorophylls to extreme temperature and pH allows the formation of several distinct derivatives such as pheophytins, chlorophyllides, and pheophorbides. During the olive oil extraction process, the release of acids may cause pheophytinization reactions in the chlorophyll fraction, increasing the oils’ pheophytin content. The conversion of chlorophylls to Mg2+ free derivatives, such as pheophytins, where the Mg++ ion is replaced by two H+ ions, causes oil color changes over time [53,54,55]. Pheophytin a is present in greater quantities than pheophytin b. If olive oil is not well preserved, pheophytins can transform further, degrading to pyro pheophytin [55]. These latter can be considered an index of an aging oil. In addition to chlorophyll derivatives, pigments in extra virgin olive oil include carotenoids, the majority of which are lutein and carotene. Carotenoids are isoprenoid compounds with a hydrocarbon structure with various double bonds, C–C, which are responsible for their interesting properties as antioxidants [56]. Carotenoids can be further divided into carotenes (which contain only carbon and hydrogen atoms) and xanthophylls (which also contain oxygen atoms).
The spectra of olive oils analyzed in this work agree with those reported in the literature [57,58,59,60,61].
The peaks occurring in the range between 308 and 380 nm are mostly due to phenolic components [62]. In detail, we found the peak at around 350 nm, the absorption zone of flavones, present in the EVOO absorbance spectrum useful to distinguish Italian EVOOs from foreign ones. Flavonoids are plant secondary metabolites with different phenolic structures. These compounds are mostly used to generate pigments, which play an important role in the colors of plants producing yellow or red/blue pigmentation. Flavonoids such as apigenin, apigenin-7-O-glucoside, luteolin, luteolin-7-O-glucoside, luteolin-4-O-glucoside, diosmetin, quercetin, and quercetin-3-rutinoside are present in olive oils and contribute to the health benefits of consumers. The antioxidant and cellular damage repairing properties that make them useful for preventing cancer, cardiovascular disease, and degenerative diseases in general have been widely studied [63]. The main factors that contribute to their increase in the oil is the maturity index of the fruits and the degree of grinding and the malaxation conditions of the paste during the extraction processes of the oil [64].
The peaks occurring in the range between 415 and 422 nm are due to the compounds absorbing dark blue colored light, mainly carotenoids, as well as pheophytin a, pheophorbide a, and pyro pheophytin a [59], and are characterized by a yellow color.
The peaks occurring in the range between 474 and 507 nm are due to the compounds absorbing green/yellow colored light, and correspond to carotenoids, such as astaxanthin and canthaxanthin. In any case, the major carotenoids in olive oil are β-carotene and lutein, both of them providing several health benefits. Lutein exhibits antioxidant and anti-inflammatory activity protecting against DNA damage [65].
Moreover, the peaks occurring in the range between 564 and 570 nm and between 594 and 605 nm are due to the compounds absorbing orange colored light, characterized by purple/violet and green/blue colors, respectively, and corresponding to chlorophylls and anthocyanins.

4. Conclusions

Spectroscopic techniques paired to chemometric analyses are widely used to authenticate and differentiate edible oils. Most spectroscopic methods tend to focus on the major compounds of the saponifiable fraction of an oil, and only a few have been concentrating on the contents of minor compounds, such as pigments and antioxidants. The European community has not yet accepted many of the scientific community’s indications concerning minor compounds, which, by law, are not taken into consideration for the definition of EVOOs’ authenticity. However, many of the minor compounds are present in significant amounts only in EVOOs, and their quantification could greatly help the oil industry. Although further analysis will be needed to expand the case studies on olive oils, this work provides a clear indication of how pigment and antioxidant contents are crucial for the authentication and definition of the quality parameters of an EVOO. In detail, we found that the peak at about 360 nm and the broad band around 550 nm present in the EVOO absorbance spectrum can be used to distinguish Italian EVOO from foreign ones. As opposite to expensive and time-consuming chromatographic methods, procedures relying on (open source) spectroscopic instruments are cheap (less than 1000 €) and do not require sample preprocessing. Moreover, being fast, these techniques can be used to assess a huge collection of samples within a reasonable time. The quantitative analysis of pigments can take place directly at production sites and stores, through portable tools that are easy to use, even by non-expert staff. The trained ANN used to classify the samples according to their optical spectra can be easily implemented on an app for immediate classification. The development of simple and reliable methods that can verify the authenticity and guarantee the quality of agri-food products is crucial. Encouragingly, this type of analysis would be very beneficial for the producers themselves as well as consumers. Indeed, these techniques can score comparable precision with respect to the more expensive and time-consuming traditional ones. Moreover, since their application cost relies entirely on the instrumental budget, and not on reagent or other expensive consumable materials, they can be applied to a high number of samples and thus, in case of supposed fraud, can be used as pre-screening tools leading to time and economic optimization.

Author Contributions

Conceptualization, F.P. and C.C.; data curation, C.C., S.V., and L.O.; formal analysis, C.C., S.V., and L.O.; funding acquisition, F.P. and C.C.; investigation, S.V., F.P., L.O., C.B., and C.C.; methodology, S.F., S.V., L.O., and C.C.; project administration, C.C.; software, S.F. and L.O.; supervision, F.P. and C.C.; validation, L.O. and C.C.; visualization, L.O., C.B., and C.C.; writing—original draft, S.V., F.A., C.B., F.P., and C.C.; writing—review and editing, F.P. and S.V. All authors have read and agreed to the published version of the manuscript.

Funding

This research was funded by the Italian Ministry of Agriculture (MiPAAF), grant number D.M. n.12479 of project INFOLIVA.

Acknowledgments

The authors would like to acknowledge all the farms which sent the EVOO to be analyzed and Sara Yazji for illuminating discussions on the VIS-NIR absorbance spectra.

Conflicts of Interest

The authors declare no conflict of interest.

References

  1. Benito, M.; Oria, R.; Sánchez-Gimeno, A.C. Characterization of the olive oil from three potentially interesting varieties from Aragon (Spain). Food Sci. Technol. Int. 2010, 16, 523–530. [Google Scholar] [CrossRef] [PubMed]
  2. Bevilacqua, M.; Bucci, R.; Magrì, A.D.; Magrì, A.L.; Marini, F. Tracing the origin of extra virgin olive oils by infrared spectroscopy and chemometrics: A case study. Anal. Chim. Acta 2012, 717, 39–51. [Google Scholar] [CrossRef] [PubMed]
  3. Chiavaro, E.; Cerretani, L.; Di Matteo, A.; Barnaba, C.; Bendini, A.; Iacumin, P. Application of a multidisciplinary approach for the evaluation of traceability of extra virgin olive oil. Eur. J. Lipid Sci. Technol. 2011, 113, 1509–1519. [Google Scholar] [CrossRef]
  4. Violino, S.; Pallottino, F.; Sperandio, G.; Figorilli, S.; Antonucci, F.; Ioannoni, V.; Fappiano, D.; Costa, C. Are the innovative electronic labels for extra virgin olive oil sustainable, traceable, and accepted by consumers? Foods 2019, 8, 529. [Google Scholar] [CrossRef] [Green Version]
  5. Girelli, C.R.; Del Coco, L.; Zelasco, S.; Salimonti, A.; Conforti, F.L.; Biagianti, A.; Barbini, D.; Fanizzi, F.P. Traceability of “Tuscan PGI” extra virgin olive oils by 1H NMR metabolic profiles collection and analysis. Metabolites 2018, 8, 60. [Google Scholar] [CrossRef] [Green Version]
  6. Cosio, M.S.; Ballabio, D.; Benedetti, S.; Gigliotti, C. Geographical origin and authentication of extra virgin olive oils by an electronic nose in combination with artificial neural networks. Anal. Chim. Acta 2006, 567, 202–210. [Google Scholar] [CrossRef]
  7. Ferronato, M. Il Mercato dell’Olio di Oliva Made in Italy Tra Vulnerabilità ed Eccellenza. Bachelor’s Thesis, Università Ca’Foscari, Venezia, Italy, 2016. [Google Scholar]
  8. Cappelli, L.; D’ascenzo, F.; Ruggieri, R.; Rossetti, F.; Scalingi, A. The attitude of consumers towards “Made in Italy” products. An empirical analysis among Italian customers. Manag. Mark. Chall. Knowl. Soc. 2019, 14, 31–47. [Google Scholar] [CrossRef] [Green Version]
  9. Violino, S.; Antonucci, F.; Pallottino, F.; Cecchini, C.; Figorilli, S.; Costa, C. Food traceability: A term map analysis basic review. Eur. Food Res. Technol. 2019, 1–11. [Google Scholar] [CrossRef]
  10. European Commission. Regulation (EC) No 178/2002 of the European parliament and of the council. Laying down the general principles and requirements of food law, establishing the European Food Safety Authority and laying down procedures in matters of food safety. Off. J. Eur. Union 2002, 31, 1–24. [Google Scholar]
  11. Violino, S.; Pallottino, F.; Sperandio, G.; Figorilli, S.; Ortenzi, L.; Tocci, F.; Vasta, S.; Imperi, G.; Costa, C. A full technological traceability system for extra virgin olive oil. Foods 2020, 9, 624. [Google Scholar] [CrossRef]
  12. Antonucci, F.; Figorilli, S.; Costa, C.; Pallottino, F.; Raso, L.; Menesatti, P. A review on blockchain applications in the agri-food sector. J. Sci. Food Agric. 2019, 99, 6129–6138. [Google Scholar] [CrossRef] [PubMed]
  13. Espiñeira, M.; Santaclara, F.J. What is food traceability. In Advances in Food Traceability Techniques and Technologies; Woodhead Publishing: Cambridge, UK, 2016; pp. 3–8. [Google Scholar]
  14. Perri, E.; Benincasa, C. Olive oil traceability. In Olive Germplasm: The Olive Cultivation, Table and Olive Oil Industry in Italy; Muzzalupo, I., Ed.; IntechOpen: London, UK, 2012; pp. 265–286. [Google Scholar]
  15. Ou, G.; Hu, R.; Zhang, L.; Li, P.; Luo, X.; Zhang, Z. Advanced detection methods for traceability of origin and authenticity of olive oils. Anal. Methods 2015, 7, 5731–5739. [Google Scholar] [CrossRef]
  16. Aparicio, R.; García-González, D.L. Olive oil characterization and traceability. In Handbook of Olive Oil; Springer: Boston, MA, USA, 2013; pp. 431–478. [Google Scholar]
  17. Benincasa, C.; Lewis, J.; Perri, E.; Sindona, G.; Tagarelli, A. Determination of trace element in Italian virgin olive oils and their characterization according to geographical origin by statistical analysis. Anal. Chim. Acta 2007, 585, 366–370. [Google Scholar] [CrossRef] [PubMed]
  18. Portarena, S.; Farinelli, D.; Lauteri, M.; Famiani, F.; Esti, M.; Brugnoli, E. Stable isotope and fatty acid compositions of monovarietal olive oils: Implications of ripening stage and climate effects as determinants in traceability studies. Food Control 2015, 57, 129–135. [Google Scholar] [CrossRef]
  19. Benincasa, C.; Romano, E.; Pellegrino, M.; Perri, E. Characterization of phenolic profiles of Italian single cultivar olive leaves (Olea europaea L.) by mass spectrometry. Mass Spectrom. Purif. Tech. 2018, 4, 2. [Google Scholar] [CrossRef]
  20. Mohamed, M.B.; Guasmi, F.; Alia, S.B.; Radhouani, F.; Faghim, J.; Triki, T.; Grati, K.N.; Baffi, C.; Lucini, L.; Benincasa, C. The LC-MS/MS characterization of phenolic compounds in leaves allows classifying olive cultivars grown in South Tunisia. Biochem. Syst. Ecol. 2018, 78, 84–90. [Google Scholar] [CrossRef]
  21. Rotondo, A.; Mannina, L.; Salvo, A. Multiple Assignment Recovered Analysis (MARA) NMR for a direct food labeling: The case study of olive oils. Food Anal. Methods 2019, 12, 1238–1245. [Google Scholar] [CrossRef]
  22. Hirri, A.; Gammouh, M.; Gorfti, A.; Kzaiber, F.; Bassbasi, M.; Souhassou, S.; Balouki, A.; Oussama, A. The use of Fourier transform mid infrared (FT–MIR) spectroscopy for detection and estimation of extra virgin olive oil adulteration with old olive oil. Sky J. Food Sci. 2015, 4, 60–66. [Google Scholar]
  23. Merás, I.D.; Manzano, J.D.; Rodríguez, D.A.; de la Peña, A.M. Detection and quantification of extra virgin olive oil adulteration by means of autofluorescence excitation-emission profiles combined with multi-way classification. Talanta 2018, 178, 751–762. [Google Scholar]
  24. Kumar, S.; Kahlon, T.; Chaudhary, S. A rapid screening for adulterants in olive oil using DNA barcodes. Food Chem. 2011, 127, 1335–1341. [Google Scholar] [CrossRef]
  25. Tengstrand, E.; Rosén, J.; Hellenäs, K.E.; Aberg, K.M. A concept study on non-targeted screening for chemical contaminants in food using liquid chromatography-mass spectrometry in combination with a metabolomics approach. Anal. Bioanal. Chem. 2013, 405, 1237–1243. [Google Scholar] [CrossRef] [Green Version]
  26. Knolhoff, A.M.; Croley, T.R. Non-targeted screening approaches for contaminants and adulterants in food using liquid chromatography hyphenated to high resolution mass spectrometry. J. Chromatogr. A 2016, 1428, 86–96. [Google Scholar] [CrossRef] [PubMed]
  27. Vlek, C.; Steg, L. Human behavior and environmental sustainability: Problems, driving forces, and research topics. J. Soc. Issues 2007, 63, 1–19. [Google Scholar] [CrossRef]
  28. Mossoba, M.M.; Azizian, H.; Fardin-Kia, A.R.; Karunathilaka, S.R.; Kramer, J.K.G. First application of newly developed FT-NIR spectroscopic methodology to predict authenticity of extra virgin olive oil retail products in the USA. Lipids 2017, 52, 443–455. [Google Scholar] [CrossRef] [PubMed]
  29. Jiménez-Carvelo, A.M.; Osorio, M.T.; Koidis, A.; González-Casado, A.; Cuadros-Rodríguez, L. Chemometric classification and quantification of olive oil in blends with any edible vegetable oils using FTIR-ATR and Raman spectroscopy. LWT Food Sci. Technol. 2017, 86, 174–184. [Google Scholar] [CrossRef] [Green Version]
  30. Nenadis, N.; Tsimidou, M. Perspective of vibrational spectroscopy analytical methods in on-field/official control of olives and virgin olive oil. Eur. J. Lipid Sci. Technol. 2017, 119. [Google Scholar] [CrossRef]
  31. Karunathilaka, S.R.; Kia, A.R.F.; Srigley, C.; Chung, J.K.; Mossoba, M.M. Nontargeted, rapid screening of extra virgin olive oil products for authenticity using near-infrared spectroscopy in combination with conformity index and multivariate statistical analyses. J. Food Sci. 2016, 81, 2390–2397. [Google Scholar] [CrossRef] [PubMed]
  32. Cayuela, J.A.; García, J.F. Sorting olive oil based on alpha-tocopherol and total tocopherol content using Near-Infra-Red Spectroscopy (NIRS) analysis. J. Food Eng. 2017, 202, 79–88. [Google Scholar] [CrossRef] [Green Version]
  33. Costa, A.F.; Coelho, M.J.; Gambarra, F.F.; Bezerra, S.R.; Harrop, R.K.; Ugulino, M.C. NIR spectrometric determination of quality parameters in vegetable oils using PLS and variable selection. Food Res. Int. 2008, 41, 341–348. [Google Scholar]
  34. Eskin, M.G.; Torabfam, M.; Psillakis, E.; Cincinelli, A.; Kurt, H.; Yüce, M. Real-time water quality monitoring of an artificial lake using a portable, affordable, simple, arduino-based open source sensor. Environ. Eng. 2019, 6, 7–14. [Google Scholar] [CrossRef]
  35. Beghi, R.; Buratti, S.; Giovenzana, V.; Benedetti, S.; Guidetti, R. Electronic nose and visible-near infrared spectroscopy in fruit and vegetable monitoring. Rev. Anal. Chem. 2017, 36, 36. [Google Scholar] [CrossRef]
  36. Galtier, O.; Dupuy, N.; Le Dreau, Y.; Ollivier, D.; Pinatec, C.; Kister, J.; Artaud, J. Geographic origins and compositions of virgin olive oils determinated by chemometric analysis of NIR spectra. Anal. Chem. Acta 2006, 595, 136–144. [Google Scholar] [CrossRef]
  37. Azizian, H.; Mossoba, M.M.; Fardin-Kia, A.R.; Delmonte, P.; Karunathilaka, S.R.; Kramer, J.K.G. Novel, rapid identification, and quantification of adulterants in extra virgin olive oil using near-infrared spectroscopy and chemometrics. Lipids 2015, 50, 705–718. [Google Scholar] [CrossRef]
  38. Langsrud, O. 50–50 Multivariate analysis of variance for collinear responses. J. R. Stat. Soc. Ser. D 2002, 51, 305–317. [Google Scholar] [CrossRef]
  39. Infantino, A.; Zaccardelli, M.; Costa, C.; Ozkilinc, H.; Habibi, A.; Peever, T. A new disease of grasspea (Lathyrus sativus) caused by Ascochyta lentis var. lathyri. Int. J. Plant Pathol. 2016, 541–548. [Google Scholar]
  40. MacKay, D.J.C. Bayesian interpolation. Neural Comput. 1992, 4, 415–447. [Google Scholar] [CrossRef]
  41. Foresee, F.D.; Martin, T.H. Gauss-Newton approximation to Bayesian learning. In Proceedings of the International Joint Conference on Neural Networks IEEE, Houston, TX, USA, 12 June 1997; Volume 3, pp. 1930–1935. [Google Scholar]
  42. Kennard, R.W.; Stone, L.A. Computer aided design of experiments. Technometrics 1969, 11, 137–148. [Google Scholar] [CrossRef]
  43. Banko, M.; Brill, E. Scaling to very large corpora for natural language disambiguation. In Proceedings of the 39th Annual Meeting on Association for Computational Linguistics, Toulouse, France, 6–11 July 2001; pp. 26–33. [Google Scholar]
  44. Bucci, R.; Magrí, A.D.; Magrí, A.L.; Marini, D.; Marini, F. Chemical authentication of extra virgin olive oil varieties by supervised chemometric procedures. J. Agric. Food Chem. 2002, 50, 413–418. [Google Scholar] [CrossRef]
  45. Portarena, S.; Baldacchini, C.; Brugnoli, E. Geographical discrimination of extra-virgin olive oils from the Italian coasts by combining stable isotope data and carotenoid content within a multivariate analysis. Food Chem. 2017, 215, 1–6. [Google Scholar] [CrossRef]
  46. Giuliani, A.; Cerretani, L.; Cichelli, A. Chlorophylls in olive and in olive oil: Chemistry and occurrences, critical. Food Sci. Nutr. 2011, 51, 678–690. [Google Scholar] [CrossRef]
  47. El Sohaimy, A.A.S.; El-Sheikh, H.M.; Refaay, M.T.; Zaytoun, A.M. Effect of harvesting in different ripening stages on olive (Olea europaea) oil quality. Am. J. Food Technol. 2016, 11, 1–11. [Google Scholar] [CrossRef]
  48. Aprile, A.; Negro, C.; Sabella, E.; Luvisi, A.; Nicolì, F.; Nutricati, E.; Vergine, M.; Miceli, A.; Blando, F.; De Bellis, L. Antioxidant activity and anthocyanin contents in olives (cv. Cellina di Nardò) during ripening and after fermentation. Antioxidants 2019, 8, 138. [Google Scholar] [CrossRef] [Green Version]
  49. Mínguez-Mosquera, M.I.; Gandul-Rojas, B.; Garrido-Fernández, J.; Gallardo-Guerrero, L. Pigments present in virgin olive oil. J. Am. Oil Chem. Soc. 1990, 67, 192–196. [Google Scholar] [CrossRef]
  50. Criado, M.N.; Motilva, M.J.; Goni, M.; Romero, M.P. Comparative study of the effect of the maturation process of olive fruit on the chlorophyll and carotenoid fractions of drupes and virgin olive oils of Arbequina variety in Spain. Food Chem. 2007, 100, 748–755. [Google Scholar] [CrossRef]
  51. Ramírez-Anaya, J.; Samaniego-Sánchez, C.; Castañeda-Saucedo, M.C.; Villalón-Mir, M.; López-García de la Serrana, H. Phenols and the antioxidant capacity of Mediterranean vegetables prepared with extra virgin olive oil using different domestic cooking techniques. Food Chem. 2015, 188, 430–438. [Google Scholar] [CrossRef]
  52. Roca, M.; Minguez-Mosquera, M.I. Change in the natural ratio between chlorophylls and carotenoids in olive fruit during processing for virgin olive oil. J. Am. Oil Chem. Soc. 2001, 78, 133–138. [Google Scholar] [CrossRef]
  53. Schwartz, S.J.; Woo, S.L.; Von Elbe, J.H. High-performance liquid chromatography of chlorophylls and their derivatives in fresh and processed spinach. J. Agric. Food Chem. 1981, 29, 533–535. [Google Scholar] [CrossRef]
  54. Aitzetmüller, K. Chlorophyll-abbauprodukte in pflanzlichen ölen. Eur. J. Lipid Sci. Technol. 1989, 91, 99–105. (In German) [Google Scholar] [CrossRef]
  55. Gertz, C.; Fiebig, H.J. Pyropheophytin a—Determination of thermal degradation products of chlorophyll a in virgin olive oil. Eur. J. Lipid Sci. Technol. 2006, 108, 1062–1065. [Google Scholar] [CrossRef]
  56. Jaswir, I.; Noviendri, D.; Hasrini, R.F.; Octavianti, F. Carotenoids: Sources, medicinal properties and their application in food and nutraceutical industry. J. Med. Plant Res. 2011, 5, 7119–7131. [Google Scholar]
  57. Harwood, J.; Aparicio, R. (Eds.) Handbook of Olive Oil: Analysis and Properties; Springer: New York, NY, USA, 2000. [Google Scholar]
  58. Psomiadou, E.; Tsimidou, M. Pigments in Greek virgin olive oils: Occurrence and levels. J. Sci. Food Agric. 2001, 81, 640–647. [Google Scholar] [CrossRef]
  59. Moyano, M.J.; Melendez, A.J.; Alba, J.; Heredia, F.J. A comprehensive study on the colour of virgin olive oils and its relationship with their chlorophylls and carotenoids indexes (I): CIEXYZ non-uniform colour space. Food Res. Int. 2008, 41, 505–512. [Google Scholar] [CrossRef]
  60. Giuffrida, D.; Salvo, F.; Salvo, A.; Cossignani, L.; Dugo, G. Pigments profile in monovarietal virgin olive oils from various Italian olive varieties. Food Chem. 2011, 124, 1119–1123. [Google Scholar] [CrossRef]
  61. Domenici, V.; Ancora, D.; Cifelli, M.; Serani, A.; Veracini, C.A.; Zandomeneghi, M. Extraction of pigment information from near-UV vis absorption spectra of extra virgin olive oils. J. Agric. Food Chem. 2014, 62, 9317–9325. [Google Scholar] [CrossRef]
  62. Fuentes, E.; Baez, M.E.; Bravo, M.; Cid, C.; Labra, F. Determination of total phenolic content in olive oil samples by UV-visible spectrometry and multivariate calibration. Food Anal. Methods 2012, 5, 1311–1319. [Google Scholar] [CrossRef]
  63. Murphy, K.J.; Walker, K.M.; Dyer, K.A.; Bryan, J. Estimation of daily intake of flavonoids and major food sources in middle-aged Australian men and women. Nutr. Res. 2019, 61, 64–81. [Google Scholar] [CrossRef]
  64. Torres, A.; Espínola, F.; Moya, M.; Alcalá, S.; Vidal, A.M.; Castro, E. Assessment of phenolic compounds in virgin olive oil by response surface methodology with particular focus on flavonoids and lignans. LWT 2018, 90, 22–30. [Google Scholar] [CrossRef]
  65. Qiao, Y.Q.; Jiang, P.F.; Gao, Y.Z. Lutein prevents osteoarthritis through Nrf2 activation and down regulation of inflammation. Arch. Med. Sci. AMS 2018, 14, 617–624. [Google Scholar] [CrossRef] [Green Version]
Figure 1. Monocultivar and blend extra virgin olive oil (EVOO) samples.
Foods 09 00834 g001
Figure 2. VIS-NIR ultra-compact spectrophotometer Lumini C Myspectral using standard cuvette holder for absorbance spectrophotometry.
Foods 09 00834 g002
Figure 3. Screenshot of the Lumini app control CREA-IT for spectrophotometric acquisitions of EVOO samples.
Foods 09 00834 g003
Figure 4. Block diagram of the Lumini C acquisition system via Android app.
Foods 09 00834 g004
Figure 5. Mean VIS-NIR spectral data: Italian (red line), foreign (blue line). Higher importance spectral values extracted with the MANOVA rotation test are evidenced with green rectangles.
Foods 09 00834 g005
Figure 6. Mean VIS-NIR spectral data: Italian (red line), foreign (blue line). Higher importance spectral values in terms of artificial neural network (ANN) feature importance are evidenced with green rectangles.
Foods 09 00834 g006
Table 1. MANOVA results based on Italian and foreign EVOO samples.
SourceDFexVarSS nPC nBu exVarPC exVarBU p-Value
Italian vs. Foreign10.042762420.83210.005056
Error900.95724
DF, degrees of freedom; exVarSS, explained variances based on sums of squares; nPC, number of principal components used for testing; nBu, number of principal components used as buffer components; exVarPC, variance explained by nPC components; exVarBU, variance explained by (nPC+nBU) components; p-value, the result from 50–50 MANOVA testing.
Table 2. Characteristics and principal results of the multilayer feed forward artificial neural network (MLFN) model (training and internal test) in predicting the classification of Italian vs. foreign EVOO: number of cases, training time, number of trials, and percentage of bad predictions.
Training (60%)
Number of Cases55
Number of hidden layers1
Number of nodes10
Training time1:26:02
Number of trials976
% bad predictions0.0
Testing (40%)
Number of cases37
% bad predictions (N)13.51 (5)
Table 3. Confusion matrix of the test set of the MLFN model used in predicting the classification of Italian vs. foreign EVOO. The correctly classified samples are reported on the main diagonal of the matrix.
ItalianForeignTotal
Italian25224
Foreign378
Table 4. Off diagonal elements of the test confusion matrix reported in Table 3.
OriginCultivarCommercial
ItalyCoratinaYes
ItalyTaggiascaYes
GreeceKoroneikiYes
ArgentinaCoratinaYes
CroatiaKarbonakaYes

