Mineral Elements in the Raw Milk of Several Dairy Farms in the Province of Alberta


Abstract
1. Introduction
2. Materials and Methods
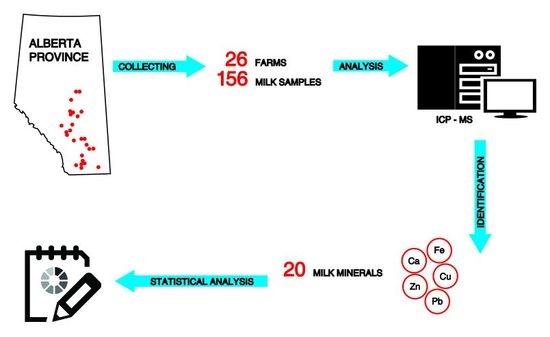
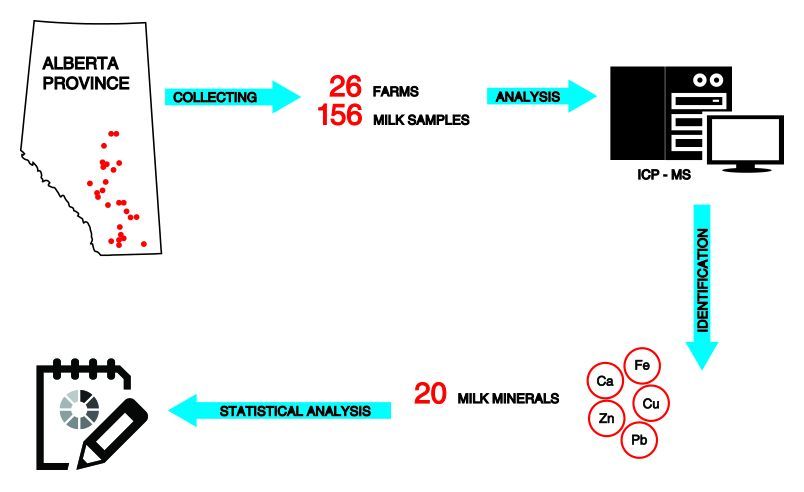
2.1. Milk Sample Collection
2.2. Mineral Identification and Quantification
2.3. Statistical Analysis
- Xw is weighted mean
- is weighted variance
- sdw is standard deviation of weighted mean
- sew is standard error of weighted mean
- x1, x2, xr are the individual samples
- n1, n2, nr are individual sample sizes of x1, x2, xr, respectively
- N is total sample size (N = n1 + n2 + nr)
- are individual sample variances
- r is number of observations for each element
- x1, x2 are weighted means
- n1, n2 are numbers of observations
- are weighted variances
- n1, n2, are numbers of observations
3. Results
4. Discussions
5. Conclusions
Author Contributions
Funding
Acknowledgments
Conflicts of Interest
References
- Herwig, N.; Stephan, K.; Panne, U.; Pritzkow, W.; Vogl, J. Multi–element screening in milk and feed by SF–ICP–MS. Food Chem. 2011, 124, 1223–1230. [Google Scholar] [CrossRef]
- Roncada, P.; Piras, C.; Soggiu, A.; Turk, R.; Urbani, A.; Bonizzi, L. Farm animal milk proteomics. J. Proteom. 2012, 75, 4259–4274. [Google Scholar] [CrossRef] [PubMed]
- Miciński, J.; Zwierzchowski, G.; Kowalski, I.M.; Szarek, J. Health–promoting properties of selected milk components. J. Elem. 2013, 18, 165–186. [Google Scholar] [CrossRef]
- Ross, E.M.; Rajan, M.P.; Wesley, S.G. Milk minerals in cow milk with special reference to elevated calcium and its radiological implications. Radiat. Prot. Environ. 2012, 35, 64–68. [Google Scholar] [CrossRef]
- Suturović, Z.; Kravić, S.; Milanović, S.; Ðurović, A.; Brezo, T. Determination of heavy metals in milk and fermented milk products by potentiometric stripping analysis with constant inverse current in the analytical step. Food Chem. 2014, 155, 120–125. [Google Scholar] [CrossRef] [PubMed]
- Zwierzchowski, G.; Ametaj, B.N. Minerals and heavy metals in the whole raw milk of dairy cows from different management systems and countries of origin: A meta-analytical study. J. Agric. Food Chem. 2018, 66, 6877–6888. [Google Scholar] [CrossRef]
- Jan, A.T.; Azam, M.; Siddiqui, K.; Ali, A.; Choi, I.; Haq, Q.M.R. Heavy metals and human health: Mechanistic insight into toxicity and counter defense system of antioxidants. Int. J. Mol. Sci. 2015, 16, 29592–29630. [Google Scholar] [CrossRef]
- Forman, J.; Silverstein, J. Organic Foods: Health and Environmental Advantages and Disadvantages. Pediatrics 2012, 130, e1406–e1415. [Google Scholar] [CrossRef]
- Husáková, L.; Urbanová, I.; Šrámková, J.; Konečná, M.; Bohuslavová, J. Multi–element analysis of milk by ICP-oa-TOF-MS after precipitation of calcium and proteins by oxalic and nitric acid. Talanta 2013, 106, 66–72. [Google Scholar] [CrossRef]
- Australian National Health and Medical Research Council. Nutrient Reference Values for Australia and New Zealand. Available online: https://www.nrv.gov.au/nutrients (accessed on 2 September 2018).
- Agency for Toxic Substances and Disease Registry. Available online: https://www.atsdr.cdc.gov/ (accessed on 2 September 2018).
- World Health Organization; Food and Agricultural Organization of the United Nations. Vitamin and Mineral Requirements in Human Nutrition, 2nd ed. Available online: https://www.who.int/nutrition/publications/micronutrients/9241546123/en/ (accessed on 17 August 2018).
- European Food Safety Authority. Summary Report on Dietary Reference Values for Nutrients; EFSA: Parma, Italy, 2017; p. e15121. [Google Scholar] [CrossRef]
- Alberta Agriculture and Forestry. Available online: https://www1.agric.gov.ab.ca/$department/deptdocs.nsf/all/beef1710#alberta (accessed on 28 October 2018).
- Woo, S.J.; Maeng, Y.S. Nutrition of Milk and Dairy Products; Hyo Il: Seoul, Korea, 1998; pp. 161–164. [Google Scholar]
- Battestin, L.; Tacla, R.M.B.; Tiboni, E.B.; Freitas, R.J.S.; Stertz, S.C. Análise de cálcio em diferentes tipos de bebidas. Acad. Vis. 2002, 3, 79–86. [Google Scholar] [CrossRef]
- Yoo, S.H.; Kang, S.B.; Park, J.H.; Lee, K.S.; Kim, J.M.; Yoon, S.S. Effect of heat-treat methods on the soluble calcium levels in the commercial milk products. Korean J. Food Sci. Anim. Resour. 2013, 33, 369–376. [Google Scholar] [CrossRef]
- Withers, P.J.A.; Peel, S.; Mansbridge, R.M.; Chalmers, A.C.; Lane, S.J. Transfers of phosphorus within three dairy farming systems receiving varying inputs in feeds and fertilizers. Nutr. Cycl. Agroecosyst. 1999, 55, 63–75. [Google Scholar] [CrossRef]
- Gustafson, G.M.; Salomon, E.; Jonsson, S. Barn balance calculations of Ca, Cu, K, Mg, Mn, N, P, S and Zn in a conventional and organic dairy farm in Sweden. Agric. Ecosyst. Environ. 2007, 119, 160–170. [Google Scholar] [CrossRef]
- Gustafson, G.M.; Salomon, E.; Jonsson, S.; Steineck, S. Fluxes of K, P, and Zn in a conventional and an organic dairy farming system through feed, animals, manure, and urine—A case study at Öjebyn, Sweden. Eur. J. Agron. 2003, 20, 89–99. [Google Scholar] [CrossRef]
- Gabryszuk, M.; Słoniewski, K.; Sakowski, T. Macro-and micro-elements in milk and hair of cows from conventional vs. organic farms. Anim. Sci. Pap. Rep. 2008, 26, 199–209. [Google Scholar]
- Shalit, U.; Maltz, E.; Silanikove, N.; Berman, A. Water, sodium, potassium, and chlorine metabolism of dairy cows at the onset of lactation in hot weather. J. Dairy Sci. 1991, 74, 1874–1883. [Google Scholar] [CrossRef]
- Qin, L.Q.; Wang, X.P.; Li, W.; Tong, X.; Tong, W.J. The minerals and heavy metals in cow’s milk from China and Japan. J. Health Sci. 2009, 55, 300–305. [Google Scholar] [CrossRef]
- Linn, J. Impact of minerals in water on dairy cows. WCDS Adv. Dairy Technol. 2006, 18, 235–247. [Google Scholar]
- Smart, M.E.; Gudmundson, J.; Christensen, D.A. Trace Mineral Deficiencies in Cattle: A Review. Can. Vet. J. 1981, 22, 372–376. [Google Scholar]
- Pawluk, S.; Bayrock, L.A. Some Characteristics and Physical Properties of Alberta Tills; Research Council of Alberta: Edmonton, AB, Canada, 1969; Volume 26. [Google Scholar]
- Card, S.; Cathcart, J.; Huang, J. The Micronutrient and Trace Element Status of Crops Grown on the Alberta Soil Quality Benchmark Sites; AESA Soil Quality Monitoring Program; Alberta Agriculture, Food and Rural Development, Conservation and Development Branch, 2005. Available online: https://www.semanticscholar.org/paper/The-Micronutrient-and-Trace-Element-Status-of-Crops-Card-Cathcart/c40fdcc5d93b5866c71bd34f506b04afde443d84 (accessed on 25 June 2019).
- Alberta Environment and Parks. Soil Remediation Guidelines for Boron: Environmental and Human Health; Land Policy Branch, Policy and Planning Division, 2015; p. 146. Available online: https://open.alberta.ca/dataset/d82ddd03-5063-43cb-87fe-849e389f2b1c/resource/ef723e60-e447-4b07-ab9a-b4c99b5e0e9f/download/soilremediationguidelinesboron-2016.pdf (accessed on 25 June 2019).
- Patra, R.C.; Swarup, D.; Kumar, P.; Nandi, D.; Naresh, R.; Ali, S.L. Milk trace elements in lactating cows environmentally exposed to higher level of lead and cadmium around different industrial units. Sci. Total Environ. 2008, 404, 36–43. [Google Scholar] [CrossRef]
- Oestreicher, P.; Cousins, R.J. Copper and zinc absorption in the rat: Mechanism of mutual antagonism. J. Nutr. 1985, 115, 159–166. [Google Scholar] [CrossRef] [PubMed]
- Khaniki, G.R.J. Chemical contaminants in milk and public health concerns: A review. Int. J. Dairy Sci. 2007, 2, 104–115. [Google Scholar]
- Król, J.; Litwińczuk, Z.; Brodziak, A.; Kędzierska-Matysek, M. Content of selected essential and potentially toxic trace elements in milk of cows maintained in Eastern Poland. J. Elem. 2012, 17, 597–608. [Google Scholar] [CrossRef]
- Mann, G.R.; Duncan, S.E.; Knowlton, K.F.; Dietrich, A.D.; O’Keefe, S.F. Effects of mineral content of bovine drinking water: Does iron content affect milk quality? J. Dairy Sci. 2013, 96, 7478–7489. [Google Scholar] [CrossRef] [PubMed]
- Rodríguez, E.M.R.; Sanz Alaejos, M.; Díaz Romero, C. Mineral Concentrations in Cow’s Milk from the Canary Island. J. Food Comp. Anal. 2001, 4, 419–430. [Google Scholar] [CrossRef]
- Hermansen, J.E.; Badsberg, J.H.; Kristensen, T.; Gundersen, V. Major and trace elements in organically or conventionally produced milk. J. Dairy Res. 2005, 72, 362–368. [Google Scholar] [CrossRef]
- Zhai, X.W.; Zhang, Y.L.; Qi, Q.; Bai, Y.; Chen, X.L.; Jin, L.J.; Ma, X.G.; Shu, R.Z.; Yang, Z.J.; Liu, F.J. Effects of molybdenum on sperm quality and testis oxidative stress. Syst. Biol. Reprod. Med. 2013, 59, 251–255. [Google Scholar] [CrossRef]
- Wang, H.W.; Zhou, B.H.; Zhang, S.; Guo, H.W.; Zhang, J.L.; Zhao, J.; Tian, E.J. Reproductive toxicity in male mice after exposure to high molybdenum and low copper concentrations. Toxicol. Ind. Health 2016, 32, 1598–1606. [Google Scholar] [CrossRef]
- Trumbo, P.; Yates, A.A.; Schlicker, S.; Poos, M. Dietary Reference Intakes: Vitamin A, Vitamin K, Arsenic, Boron, Chromium, Copper, Iodine, Iron, Manganese, Molybdenum, Nickel, Silicon, Vanadium, and Zinc. J. Acad. Nutr. Diet. 2001, 101, 294–301. [Google Scholar]
- Fieve, R.R.; Meltzer, H.L. Proceedings: Rubidium salts--toxic effects in humans and clinical effects as an antidepressant drug. Psychopharmacol. Bull. 1974, 10, 38–50. [Google Scholar]
- Meltzer, H.L.; Fieve, R.R. Rubidium in psychiatry and medicine: An overview. In Current Developments in Psychopharmacology; Essman, W.B., Valzelli, L., Eds.; Spectrum Publications: Holliswood, NY, USA, 1975; Volume 1, pp. 203–242. [Google Scholar]
- Placidi, G.; Lenzi, A.; Lazzerini, F.; Dell’Osso, L.; Cassano, G.B.; Akiskal, H.S. Exploration of the clinical profile of rubidium chloride in depression: A systematic open trial. J. Clin. Psychopharmacol. 1988, 8, 184–188. [Google Scholar] [CrossRef] [PubMed]
- Brundusino, A.O.; Cairoli, S. The pharmacological action of rubidium chloride in depression. Minerva Psichiatr. 1996, 37, 45–49. [Google Scholar] [PubMed]
- Chellan, P.; Sadler, P.J. The elements of life and medicines. Philos. Trans. R. Soc. A 2015, 373, 20140182. [Google Scholar] [CrossRef] [PubMed]
- Osacky, M.; Geramian, M.; Ivey, D.G.; Liu, Q.; Etsell, T.H. Influence of Nonswelling Clay Minerals (Illite, Kaolinite, and Chlorite) on Nonaqueous Solvent Extraction of Bitumen. Energy Fuels 2015, 29, 4150–4159. [Google Scholar] [CrossRef]
- Campbell, L.M.; Fisk, A.T.; Wang, X.; Köck, G.; Muir, D.C.G. Evidence for biomagnification of rubidium in freshwater and marine food webs. Can. J. Fish. Aquat. Sci. 2005, 62, 1161–1167. [Google Scholar] [CrossRef]
- National Research Council. Selenium in Nutrition: Revised Edition. 1983. Available online: https://www.ncbi.nlm.nih.gov/books/NBK216727/pdf/Bookshelf_NBK216727.pdf (accessed on 28 October 2018).
- Gaucheron, F. Milk minerals, trace elements, and macroelements. In Milk and Dairy Products in Human Nutrition: Production, Composition and Health, 1st ed.; Park, Y.W., Haenlein, G.F.W., Eds.; John Wiley & Sons: Chichester, UK, 2013; pp. 172–199. [Google Scholar]
- Yanardag, R.; Orak, H. Selenium content of milk and milk products of Turkey II. Biol. Trace Elem. Res. 1999, 68, 79–95. [Google Scholar] [CrossRef] [PubMed]
- Agency for Toxic Substances and Disease Registry. Toxicological Profile for Strontium. 2004. Available online: https://www.atsdr.cdc.gov/toxprofiles/tp159.pdf (accessed on 28 October 2018).
- Emsley, J. An A–Z guide to the elements. In Nature’s Building Blocks; Oxford University Press: Oxford, UK, 2011; p. 507. [Google Scholar]
- Dudas, M.J.; Pawluk, S. Heavy metals in cultivated soils and in cereal crops in Alberta. Can. J. Soil Sci. 1977, 57, 329–339. [Google Scholar] [CrossRef]
- Tchounwou, P.B.; Yedjou, C.G.; Patlolla, A.K.; Sutton, D.J. Heavy metals toxicity and the environment. In Molecular, Clinical and Environmental Toxicology; EXS; Springer Nature: Basel, Switzerland, 2012; Volume 101, pp. 133–164. [Google Scholar]
- Smedley, P.L.; Kinniburgh, D.G. A review of the source, behaviour and distribution of arsenic in natural waters. Appl. Geochem. 2002, 17, 517–568. [Google Scholar] [CrossRef]
- Lemay, T.G. Arsenic Concentrations in Quaternary Drift and Quaternary-Tertiary Buried Channel Aquifers in the Athabasca Oil Sands (In Situ) Area, Alberta—EUB/AGS Geo-Note; Alberta Energy and Utilities Board: 2002; Volume 41. Available online: https://ags.aer.ca/publications/GEO_2002_04.html (accessed on 25 June 2019).
- Anderson, R.A.; Polansky, M.M.; Bryden, N.A.; Canary, J.J. Supplemental-chromium effects on glucose, insulin, glucagon, and urinary chromium losses in subjects consuming controlled low-chromium diets. Am. J. Clin. Nutr. 1991, 54, 909–916. [Google Scholar] [CrossRef]


| Macromineral | Northern | SD | n | Central | SD | n | Southern | SD | n | p-value |
| Calcium | 38,519 | 5941 | 48 | 37,078 | 7760 | 66 | 38,784 | 10,118 | 42 | NS |
| Magnesium | 7148 | 1353 | 48 | 6644 | 1448 | 66 | 6659 | 1348 | 42 | NS |
| Phosphorus | 44,072 | 8960 | 48 | 42,965 | 8134 | 66 | 43,852 | 9057 | 42 | NS |
| Potassium | 43,701 | 4942 | 48 | 43,417 | 6437 | 66 | 44,040 | 4835 | 42 | NS |
| Sodium | 31,200 | 6711 | 48 | 31,923 | 8169 | 66 | 31,420 | 6459 | 42 | NS |
| Micromineral | Northern | SD | n | Central | SD | n | Southern | SD | n | p-value |
| Boron | 28.58 a | 5.13 | 48 | 30.74 | 7.91 | 65 | 38.80 b | 8.58 | 42 | p < 0.05 |
| Cobalt | 0.04 | 0.01 | 48 | 0.05 | 0.02 | 66 | 0.04 | 0.01 | 42 | NS |
| Copper | 0.92 | 0.38 | 48 | 0.91 | 0.74 | 66 | 0.96 | 0.46 | 42 | NS |
| Iron | 4.05 | 1.59 | 48 | 4.90 | 3.72 | 65 | 5.06 | 1.93 | 42 | NS |
| Manganese | 0.58 | 0.18 | 48 | 0.55 | 0.20 | 66 | 0.50 | 0.18 | 42 | NS |
| Molybdenum | 0.53 | 0.09 | 48 | 0.51 | 0.18 | 66 | 0.51 | 0.12 | 42 | NS |
| Rubidium | 43.65 a | 12.12 | 48 | 22.60 b | 5.59 | 66 | 20.69 b | 3.10 | 42 | p < 0.05 |
| Selenium | 1.06 | 0.16 | 48 | 1.31 | 0.83 | 66 | 1.11 | 0.26 | 42 | NS |
| Strontium | 7.31 | 1.79 | 48 | 6.76 | 2.31 | 66 | 5.31 | 1.99 | 42 | NS |
| Zinc | 71.25 | 16.25 | 48 | 68.88 | 20.24 | 66 | 73.90 | 25.23 | 40 | NS |
| Heavy metal | Northern | SD | n | Central | SD | n | Southern | SD | n | p-value |
| Aluminium | 1.301 | 0.407 | 47 | 1.449 | 1.018 | 66 | 0.998 | 0.310 | 42 | NS |
| Arsenic | 0.106 a | 0.014 | 48 | 0.123 | 0.172 | 66 | 0.088 b | 0.017 | 42 | p < 0.05 |
| Cadmium | 0.001 | 0.000 | 48 | 0.002 | 0.003 | 66 | 0.002 | 0.000 | 42 | NS |
| Chromium | 5.227 | 0.558 | 48 | 4.949 | 1.953 | 66 | 4.664 | 1.880 | 42 | NS |
| Lead | 0.003 | 0.002 | 48 | 0.004 | 0.003 | 66 | 0.004 | 0.001 | 42 | NS |
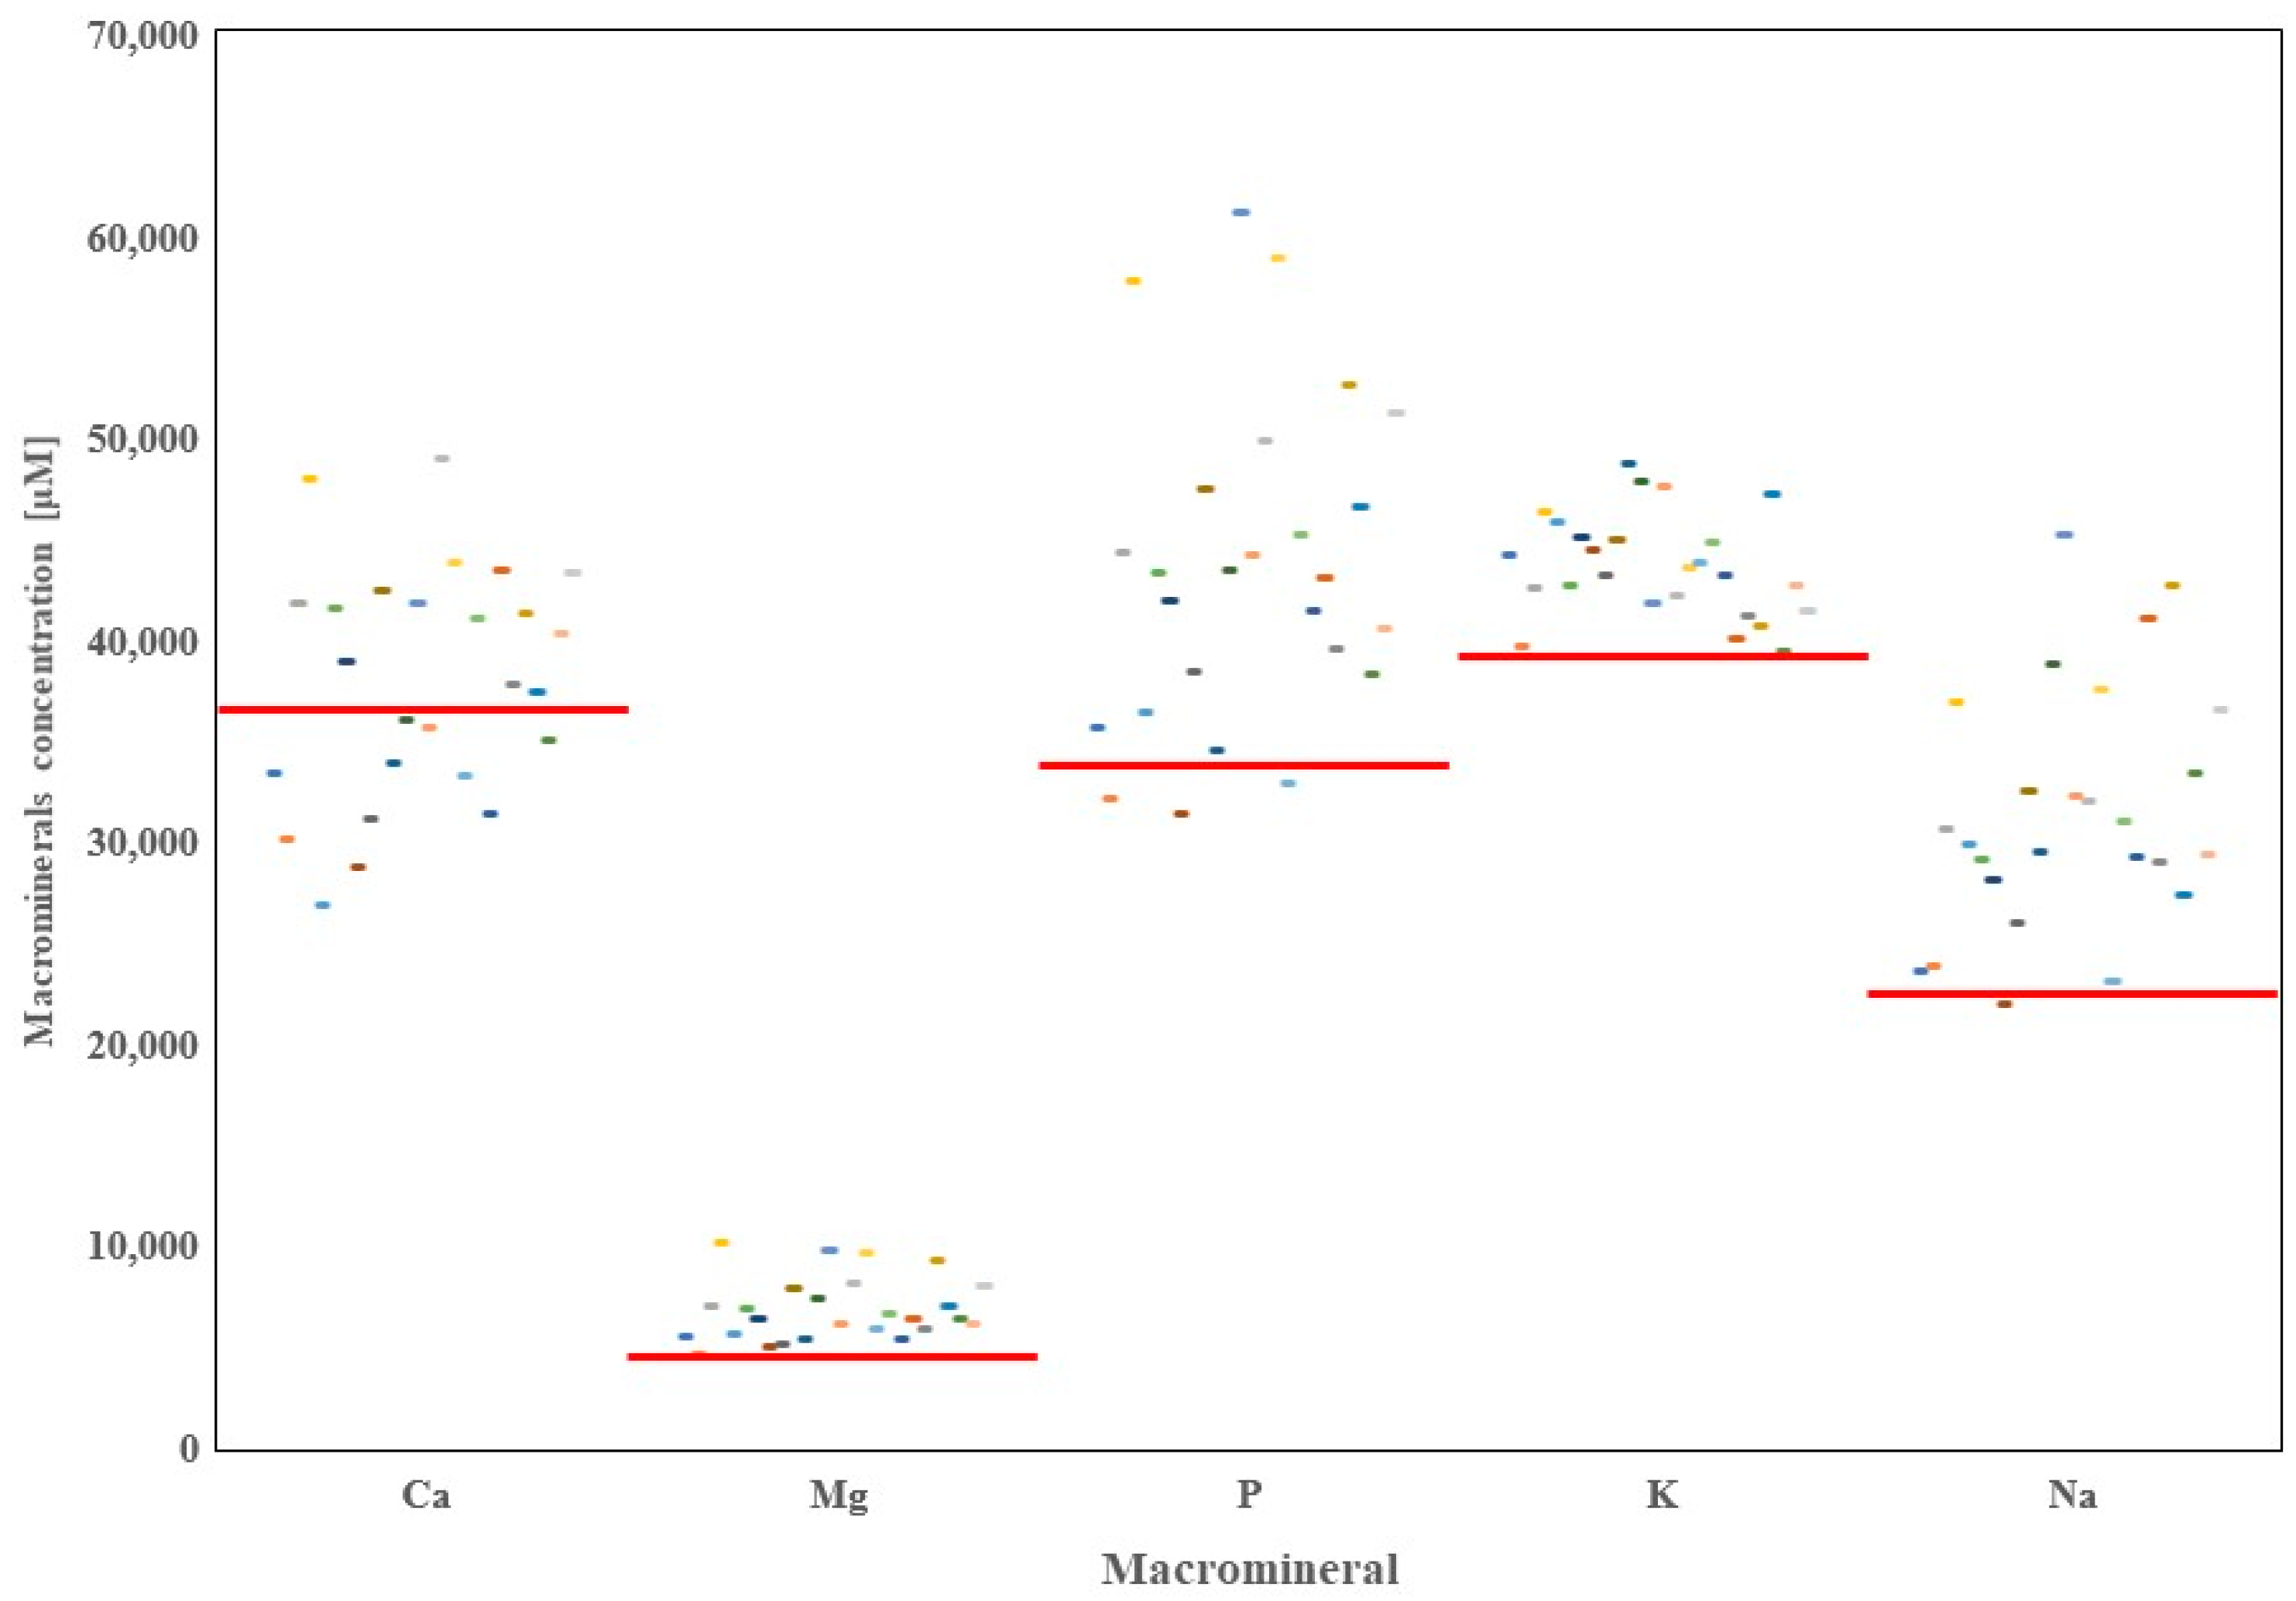
| Macromineral | Canada | SD | n | Min | Max | World * | SD | n | Min | Country | Max | Country | p-value |
| Calcium | 37,980 | 7327 | 156 | 26,904 | 47,955 | 36,632 | 5476 | 3345 | 2096 | Czech Republic | 242,016 | Austria | NS |
| Magnesium | 6803 a | 1248 | 156 | 4625 | 10,166 | 4792 b | 911 | 3,274 | 2350 | Poland | 38,272 | Germany | p < 0.05 |
| Phosphorus | 43,545 a | 7873 | 156 | 31,394 | 61,148 | 34,093 b | 6544 | 818 | 13,691 | Poland | 271,230 | Germany | p < 0.05 |
| Potassium | 43,672 a | 4920 | 156 | 39,396 | 48,730 | 39,332 b | 5939 | 3001 | 21,893 | Czech Republic | 371,355 | Austria | p < 0.05 |
| Sodium | 31,565 a | 6453 | 156 | 21,954 | 45,160 | 22,516 b | 4900 | 2986 | 12,049 | Czech Republic | 130,492 | Germany | p < 0.05 |
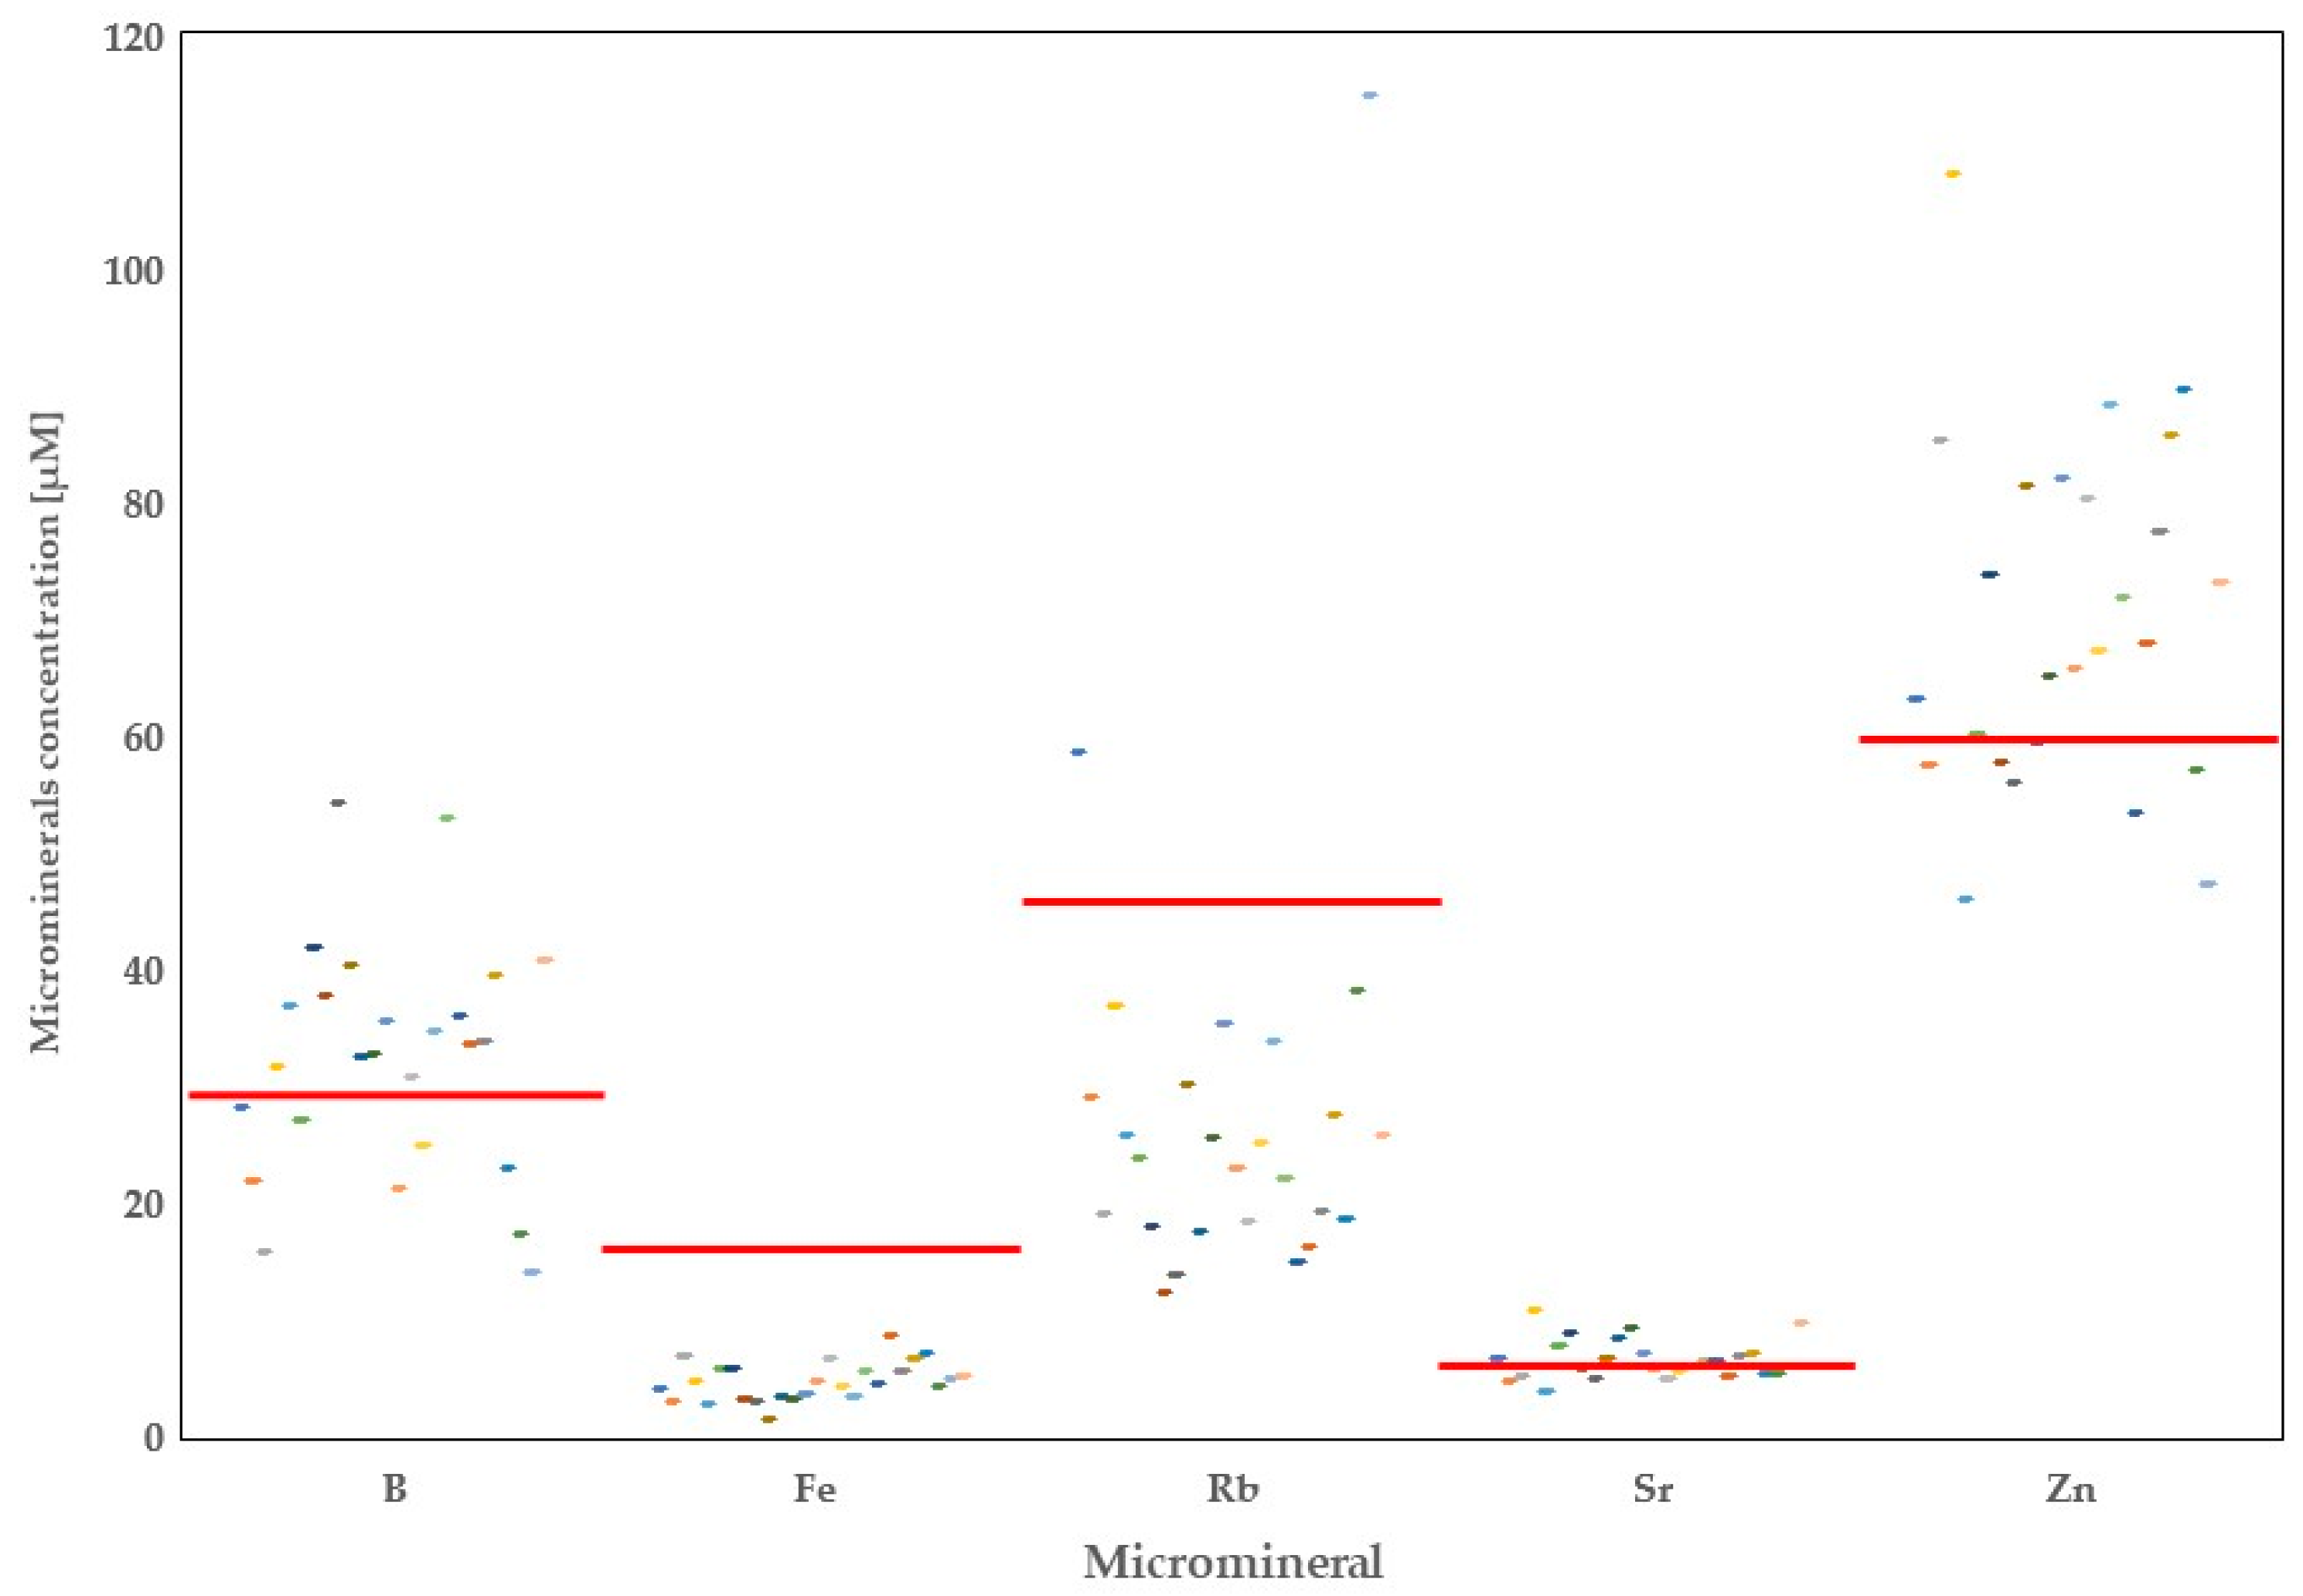
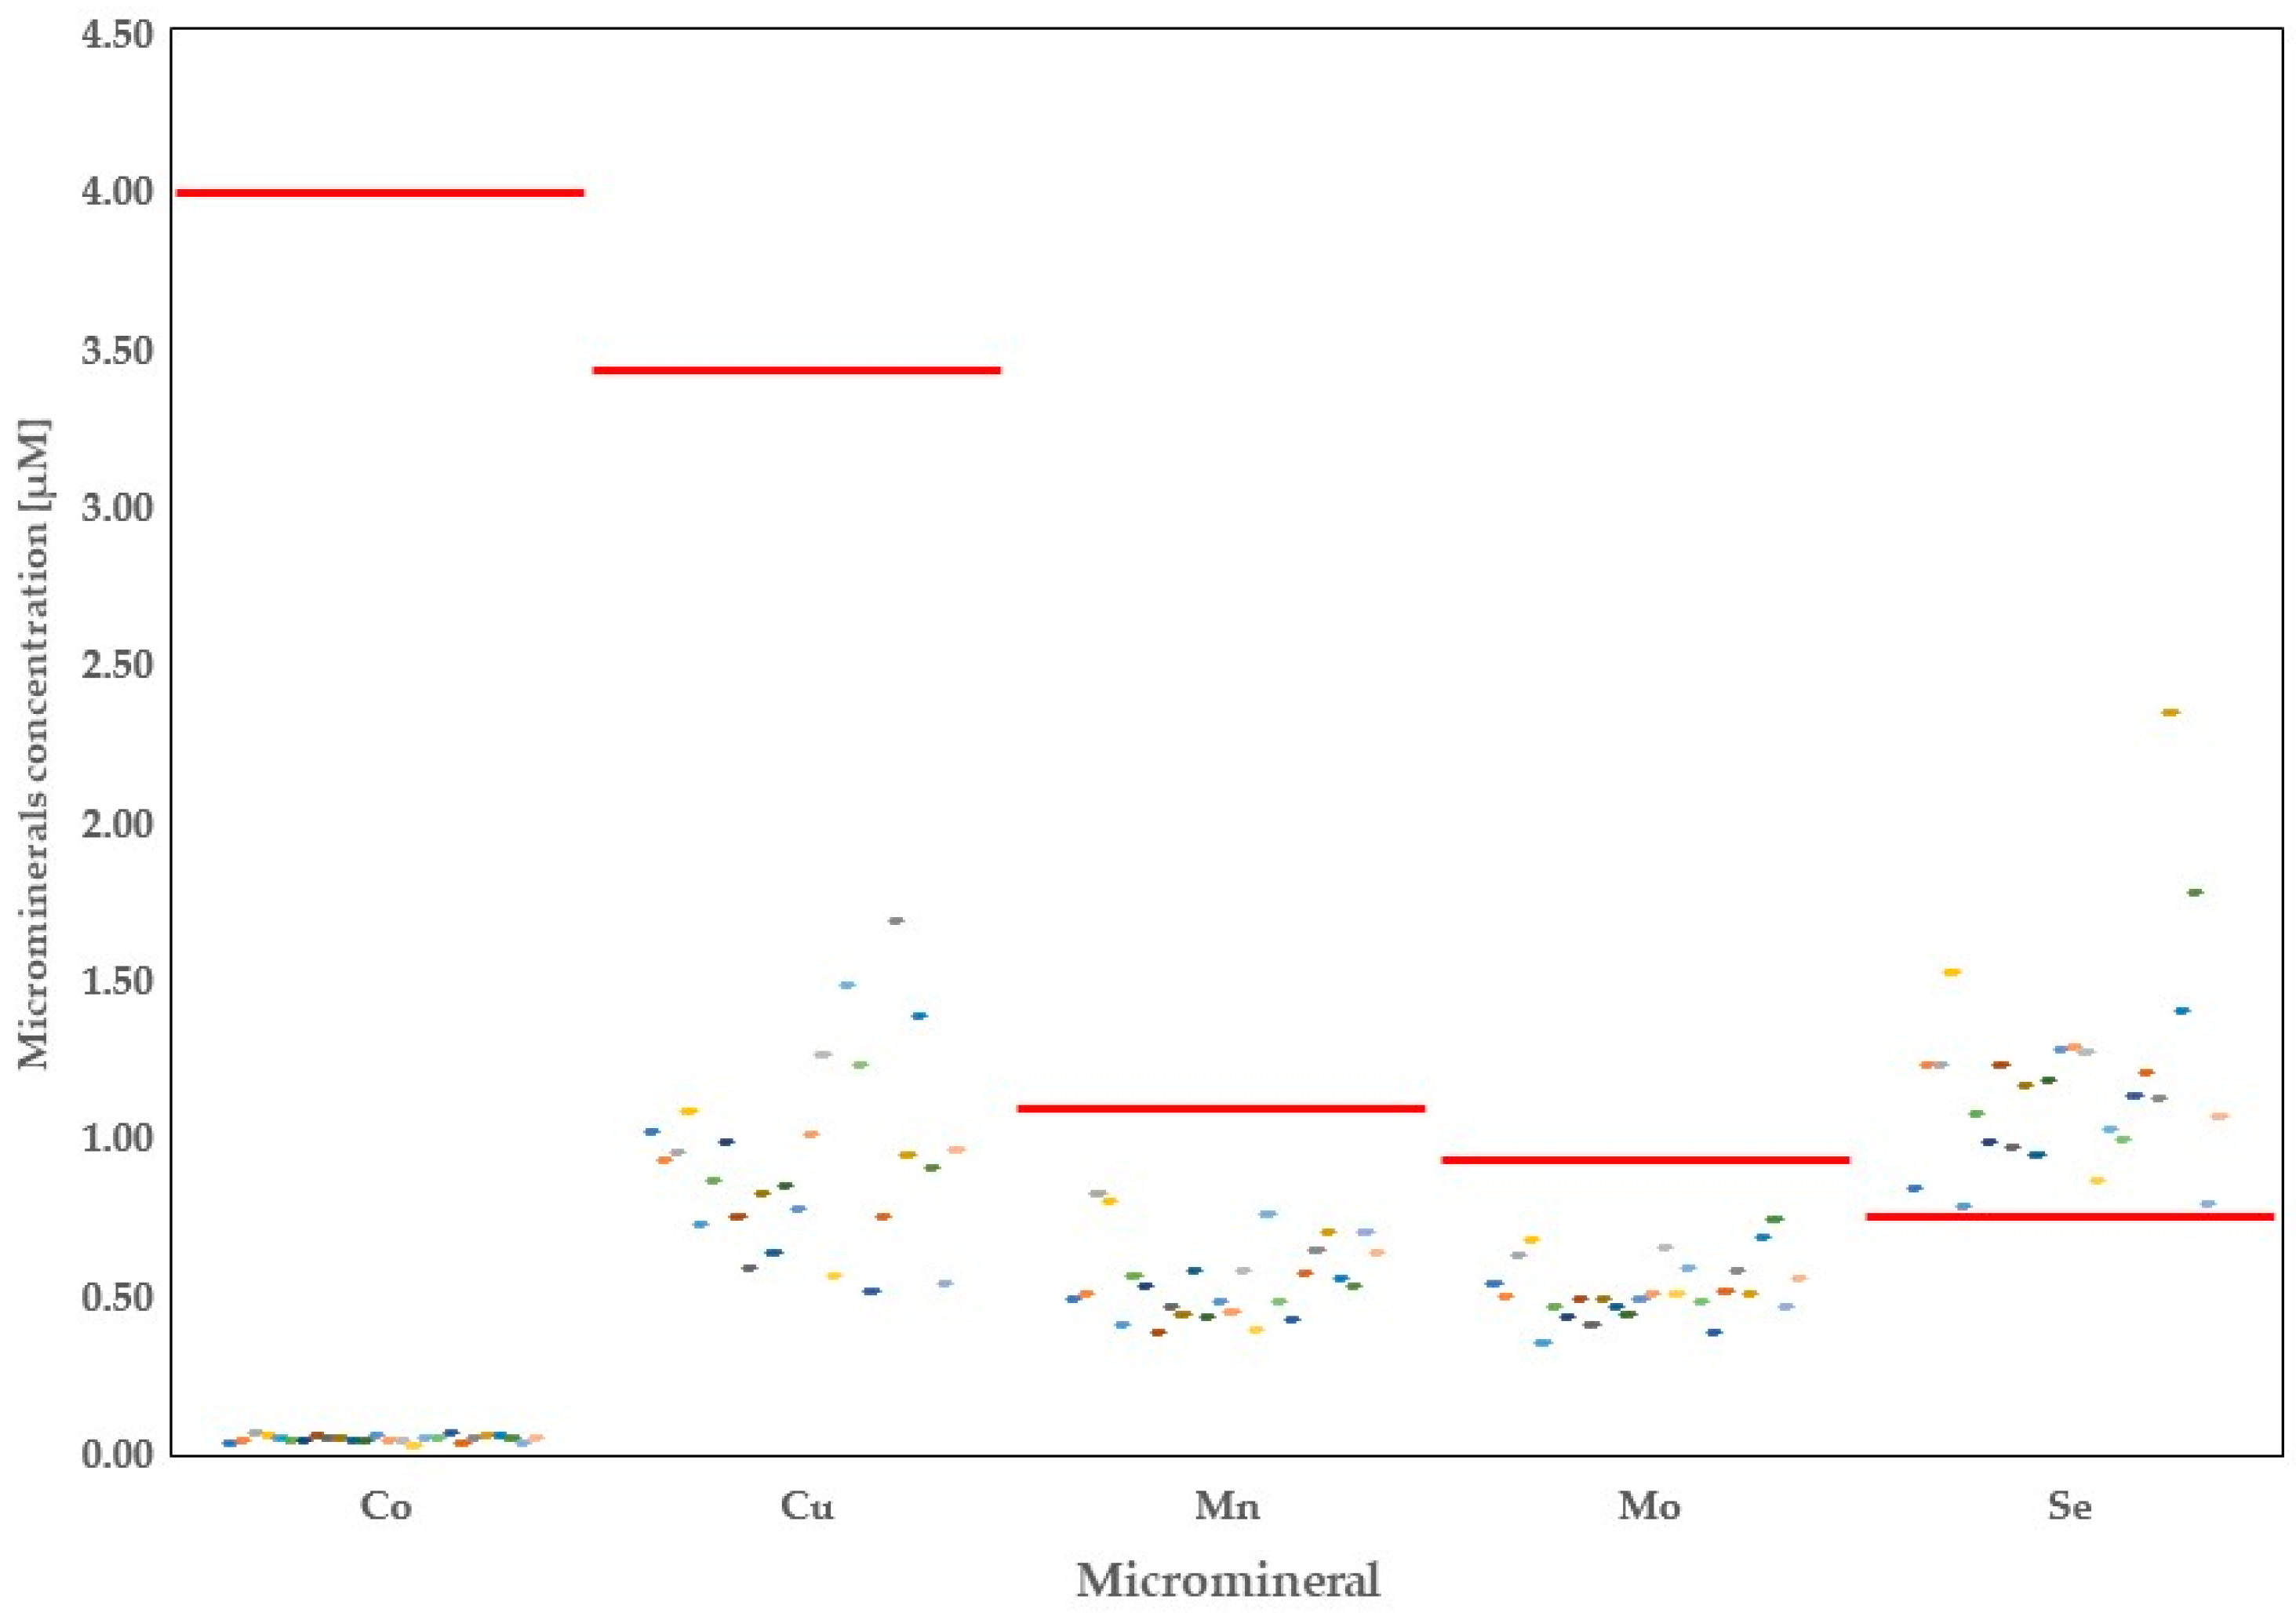
| Micromineral | Canada | SD | n | Min | Max | World * | SD | n | Min | Country | Max | Country | p-value |
| Boron | 32.25 | 6.64 | 155 | 14.01 | 54.26 | 29.33 | 62.58 | 173 | 7.86 | Poland | 277.52 | Germany | NS |
| Cobalt | 0.04 a | 0.01 | 156 | 0.02 | 0.06 | 3.99 b | 1.95 | 511 | <0.01 | Spain | 83.98 | Germany | p < 0.05 |
| Copper | 0.93 a | 0.49 | 156 | 0.51 | 1.68 | 3.43 b | 9.08 | 3668 | 0.50 | Poland | 61.37 | Slovakia | p < 0.05 |
| Iron | 4.67 a | 2.33 | 156 | 1.49 | 8.55 | 16.63 b | 24.93 | 2990 | 2.69 | Czech Republic | 155.42 | India | p < 0.05 |
| Manganese | 0.55 a | 0.17 | 156 | 0.38 | 0.82 | 1.11 b | 0.42 | 1590 | 0.24 | Czech Republic | 6.92 | China | p < 0.05 |
| Molybdenum | 0.52 a | 0.12 | 156 | 0.35 | 0.74 | 0.95 b | 0.28 | 274 | 0.11 | Poland | 3.86 | Germany | p < 0.05 |
| Rubidium | 28.56 a | 7.14 | 156 | 13.84 | 58.51 | 47.05 b | 10.84 | 152 | 0.02 | Japan | 427.87 | Austria | p < 0.05 |
| Selenium | 1.18 | 0.46 | 156 | 0.78 | 2.34 | 0.77 | 13.33 | 2240 | 0.07 | Brazil | 18.05 | South Korea | NS |
| Strontium | 6.54 | 1.84 | 156 | 4.59 | 10.77 | 6.65 | 1.09 | 283 | 0.05 | Japan | 35.61 | Germany | NS |
| Zinc | 70.02 | 18.85 | 156 | 45.89 | 108.14 | 64.04 | 29.13 | 3358 | 14.45 | Saudi Arabia | 688.18 | Germany | NS |
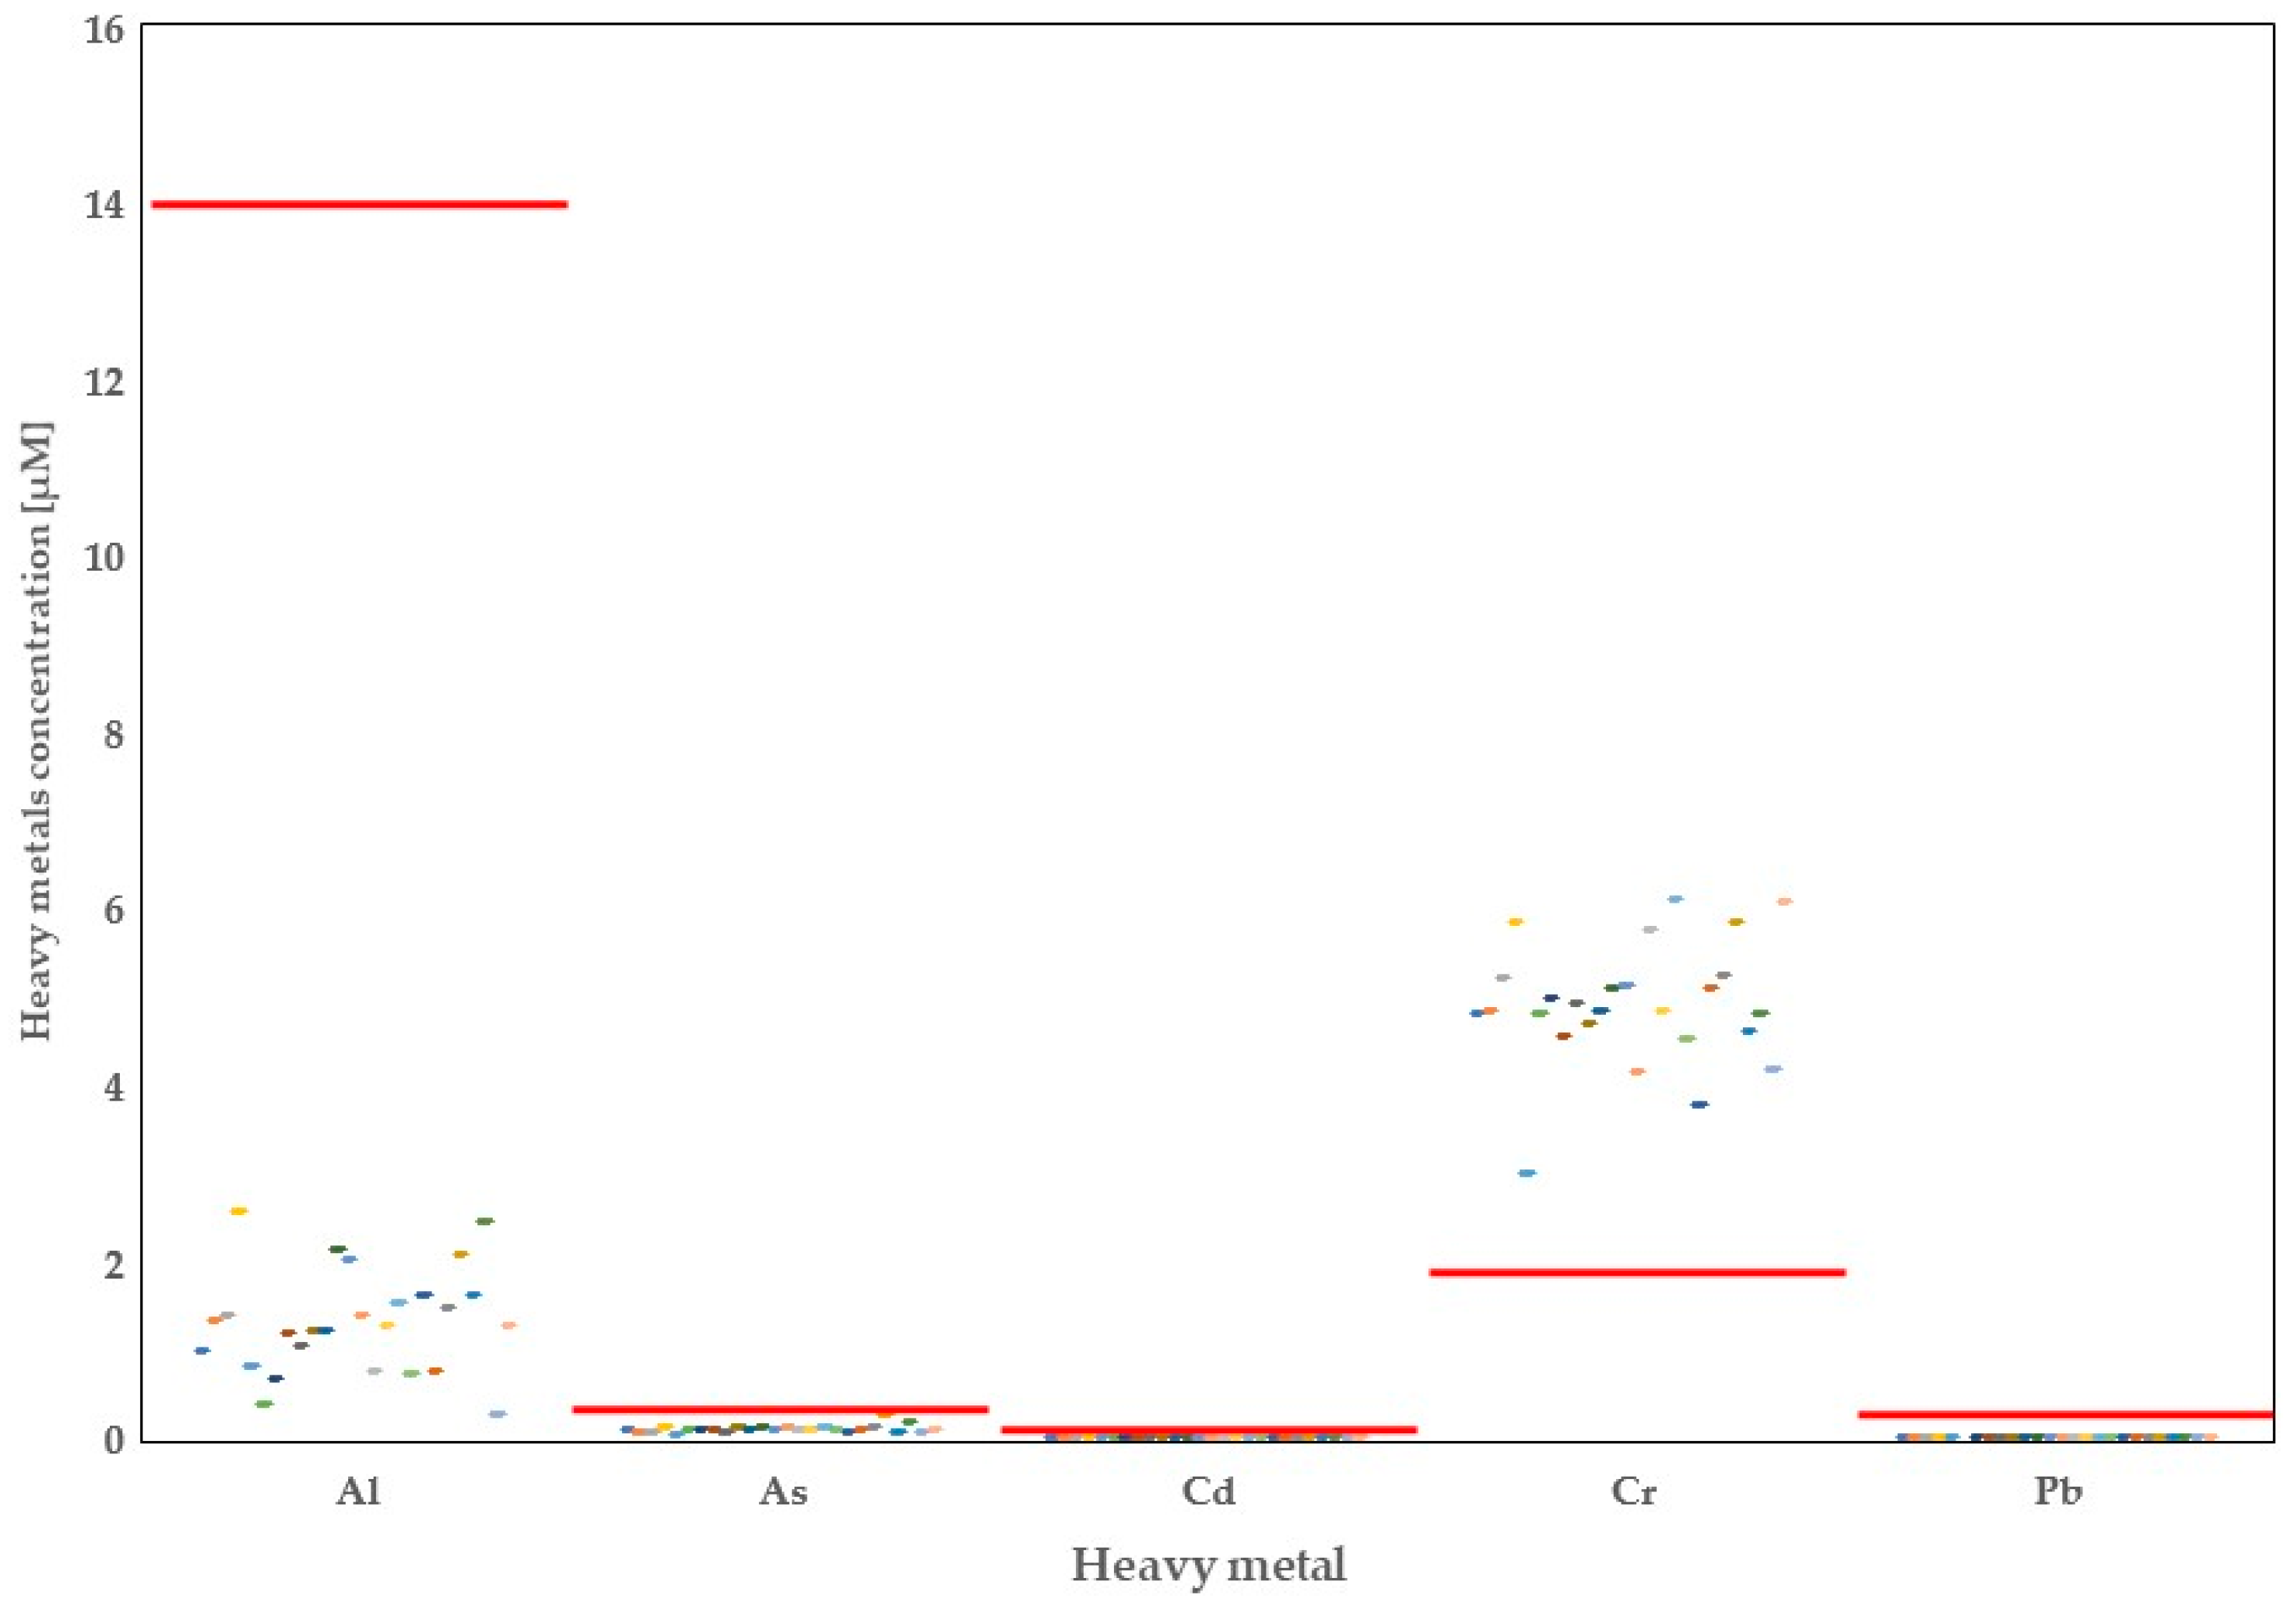
| Heavy metal | Canada | SD | n | Min | Max | World * | SD | n | Min | Country | Max | Country | p-value |
| Aluminum | 1.28 a | 0.59 | 156 | 0.267 | 2.573 | 13.92 b | 9.17 | 564 | 1.89 | Poland | 275.28 | Turkey | p < 0.05 |
| Arsenic | 0.11 | 0.09 | 156 | 0.056 | 0.281 | 0.39 | 1.09 | 648 | 0.01 | South Korea | 1.78 | Italy | NS |
| Cadmium | <0.01 | <0.01 | 156 | <0.01 | <0.01 | 0.17 | 0.76 | 2007 | <0.01 | Turkey | 2.40 | Slovakia | NS |
| Chromium | 4.92 a | 1.44 | 156 | 3.017 | 6.096 | 1.91 b | 7.09 | 1032 | 0.07 | Germany | 33.78 | Nigeria | p < 0.05 |
| Lead | <0.01 a | <0.01 | 156 | <0.01 | <0.01 | 0.34 b | 0.43 | 2218 | <0.01 | RSA | 4.10 | India | p < 0.05 |
| Macromineral | Canada | SD | n | Min | Max | COM * | SD | n | Min | Max | CONV * | SD | n | Min | Max | p-value |
| Calcium | 37,980 a | 7327 | 156 | 26,904 | 47,955 | 31,819 b | 2054 | 461 | 2096 | 38,423 | 37,744 a | 5,885 | 2791 | 14,147 | 242,016 | p < 0.05 |
| Magnesium | 6803 a | 1248 | 156 | 4625 | 10,166 | 4649 b | 467 | 479 | 4239 | 5144 | 4855 b | 977 | 2702 | 2350 | 38,272 | p < 0.05 |
| Phosphorus | 43,545 a | 7873 | 156 | 31,394 | 61,148 | 28,285 b | 1726 | 32 | 27,058 | 29,383 | 35,954c | 6,986 | 689 | 13,691 | 271,230 | p < 0.05 |
| Potassium | 43,672 a | 4920 | 156 | 39,396 | 48,730 | 38,781 b | 2487 | 407 | 23,223 | 43,095 | 39,756 b | 5,817 | 2537 | 21,893 | 371,355 | p < 0.05 |
| Sodium | 31,565 a | 6453 | 156 | 21,954 | 45,160 | 23,520 b | 3408 | 425 | 15,702 | 26,490 | 22,417 b | 5,109 | 2508 | 12,049 | 130,492 | p < 0.05 |
| Micromineral | Canada | SD | n | Min | Max | COM * | SD | n | Min | Max | CONV * | SD | n | Min | Max | p-value |
| Boron | 32.25 a | 6.64 | 155 | 14.01 | 54.26 | 10.58 b | 0.77 | 18 | 9.71 | 11.29 | 43.52 | 80.43 | 102 | 8.39 | 277.52 | p < 0.05 |
| Cobalt | 0.04 a | 0.01 | 156 | 0.02 | 0.06 | 0.07 b | 0.01 | 87 | <0.01 | 0.10 | 5.82c | 2.34 | 349 | <0.01 | 83.98 | p < 0.05 |
| Copper | 0.93 a | 0.49 | 156 | 0.51 | 1.68 | 3.82 b | 3.10 | 573 | 1.08 | 27.22 | 3.43 | 9.95 | 2980 | 0.50 | 61.37 | p < 0.05 |
| Iron | 4.67 a | 2.33 | 155 | 1.49 | 8.55 | 18.35 b | 9.60 | 522 | 3.04 | 147.31 | 16.62 b | 27.63 | 2353 | 2.69 | 155.42 | p < 0.05 |
| Manganese | 0.55 a | 0.17 | 156 | 0.38 | 0.82 | 2.13 b | 0.72 | 167 | 0.24 | 6.92 | 1.04c | 0.39 | 1308 | 0.31 | 4.79 | p < 0.05 |
| Molybdenum | 0.52 a | 0.12 | 156 | 0.35 | 0.74 | 1.20 b | 0.44 | 55 | 0.26 | 1.98 | 0.96c | 0.25 | 144 | 0.11 | 3.86 | p < 0.05 |
| Rubidium | 28.56 a | 7.14 | 156 | 13.84 | 58.51 | 18.10 b | 0.02 | 96 | 0.02 | 27.27 | 96.69c | 18.26 | 56 | 0.02 | 427.87 | p < 0.05 |
| Selenium | 1.18 a | 0.46 | 156 | 0.78 | 2.34 | 2.99a | 31.83 | 411 | 0.07 | 18.05 | 0.27 b | 0.12 | 1683 | 0.12 | 5.07 | p < 0.05 |
| Strontium | 6.54 a | 1.84 | 156 | 4.59 | 10.77 | 4.29 b | 0.01 | 96 | 0.05 | 6.95 | 10.32c | 1.59 | 134 | 0.06 | 35.61 | p < 0.05 |
| Zinc | 70.02 a | 18.85 | 156 | 45.89 | 108.14 | 53.45 b | 8.32 | 550 | 41.6 | 72.71 | 67.33 a | 32.25 | 2689 | 14.45 | 688.18 | p < 0.05 |
| Heavy metal | Canada | SD | n | Min | Max | COM * | SD | n | Min | Max | CONV * | SD | n | Min | Max | p-value |
| Aluminum | 1.28 a | 0.59 | 155 | 0.27 | 2.57 | NO DATA | 15.13 b | 9.59 | 511 | 2.06 | 275.28 | p <0.05 | ||||
| Arsenic | 0.11 a | 0.09 | 156 | 0.06 | 0.28 | 0.05 b | <0.01 | 87 | 0.01 | 0.23 | 0.49a | 1.25 | 486 | 0.01 | 1.78 | p < 0.05 |
| Cadmium | <0.01 a | <0.01 | 156 | <0.01 | <0.01 | 0.07 b | 0.05 | 145 | 0.01 | 0.91 | 0.19a | 0.81 | 1747 | 0.00 | 2.40 | p < 0.05 |
| Chromium | 4.92 a | 1.44 | 156 | 3.02 | 6.10 | 2.95 b | 0.65 | 161 | 0.09 | 7.02 | 1.85a | 8.02 | 796 | 0.07 | 33.78 | p < 0.05 |
| Lead | <0.01 a | <0.01 | 156 | <0.01 | <0.01 | 0.45 b | 0.31 | 203 | 0.02 | 1.11 | 0.34 b | 0.45 | 1900 | 0.00 | 4.10 | p < 0.05 |
| Macromineral | Total Concentration (mg/300 mL) | RDI 1(mg/day) | Intake from Milk 3 (%) |
| Calcium | 456.7 | 1000 | 45.67 |
| Magnesium | 49.59 | 350 | 14.17 |
| Phosphorus | 404.6 | 1000 | 40.46 |
| Potassium | 512.3 | 3500 | 14.64 |
| Sodium | 217.7 | 2400 | 9.07 |
| Micromineral | Total Concentration (µg/300 mL) | RDI 1(µg/day) | Intake from Milk 3 (%) |
| Boron | 104.6 | 20,000 | 0.52 |
| Cobalt | 0.8 | 19.85 | 3.83 |
| Copper | 17.7 | 2000 | 0.88 |
| Iron | 78.2 | 15,000 | 0.52 |
| Manganese | 9.0 | 5000 | 0.18 |
| Molybdenum | 14.9 | 75.00 | 19.83 |
| Rubidium | 643.9 | ND | ND |
| Selenium | 27.9 | 35.00 | 79.73 |
| Strontium | 171.9 | 4030 | 4.27 |
| Zinc | 1,373.8 | 15,000 | 9.16 |
| Heavy Metal | Total Concentration (µg/300 mL) | Toxic Dose 2 (µg/day) | Intake from Milk 3 (%) |
| Aluminum | 10.38 | 2020.30 | 0.51 |
| Arsenic | 2.43 | 10.14 | 23.94 |
| Cadmium | 0.05 | 0.97 | 5.62 |
| Chromium | 76.71 | 120.00 | 63.93 |
| Lead | 0.21 | 2.39 | 8.85 |
© 2019 by the authors. Licensee MDPI, Basel, Switzerland. This article is an open access article distributed under the terms and conditions of the Creative Commons Attribution (CC BY) license (http://creativecommons.org/licenses/by/4.0/).
Share and Cite
Zwierzchowski, G.; Ametaj, B.N. Mineral Elements in the Raw Milk of Several Dairy Farms in the Province of Alberta. Foods 2019, 8, 345. https://doi.org/10.3390/foods8080345
Zwierzchowski G, Ametaj BN. Mineral Elements in the Raw Milk of Several Dairy Farms in the Province of Alberta. Foods. 2019; 8(8):345. https://doi.org/10.3390/foods8080345
Chicago/Turabian StyleZwierzchowski, Grzegorz, and Burim N. Ametaj. 2019. "Mineral Elements in the Raw Milk of Several Dairy Farms in the Province of Alberta" Foods 8, no. 8: 345. https://doi.org/10.3390/foods8080345
APA StyleZwierzchowski, G., & Ametaj, B. N. (2019). Mineral Elements in the Raw Milk of Several Dairy Farms in the Province of Alberta. Foods, 8(8), 345. https://doi.org/10.3390/foods8080345