Article

Effects of Proteolytic and Lipolytic Enzyme Supplementations on Lipolysis and Proteolysis Characteristics of White Cheeses

1
Karataş School of Tourism and Hotel Management, Çukurova University, Adana 01903, Turkey
2
Department of Food Engineering, Agricultural Faculty, Çukurova University, Adana 01330, Turkey
*
Author to whom correspondence should be addressed.
Foods 2018, 7(8), 125; https://doi.org/10.3390/foods7080125
Submission received: 8 June 2018 / Revised: 18 July 2018 / Accepted: 7 August 2018 / Published: 8 August 2018

Abstract

:
Effects of proteolytic (Neutrase, Bacillus subtilis-originate, 0.20 (P1) and 0.40 g 100 L−1 (P2)) and lipolytic (Piccantase A, Mucor miehei-originated, 0.05 (L1) and 0.10 g 100 L−1 (L2)) enzyme supplementations to cheese milk on lipolysis and proteolysis characteristics of 90-day ripened cheese samples were investigated in this study. While enzyme supplementation did not have significant effects on titratable acidity, fat and protease-peptone nitrogen ratios of cheese samples, dry matter, salt, protein, water soluble nitrogen, 12% trichloroacetic acid soluble nitrogen ratio (TCA-SN), 5% phosphotungstic acid soluble nitrogen (PTA-SN), casein nitrogen ratios, penetrometer value, total free fatty acids (TFFA) and total free amino acids (TFAA) were significantly influenced by enzyme supplementations. Individual free amino acids (15 of them) were also determined. Free amino acid contents of enzyme-supplemented cheeses were higher than the control cheese and the values increased in all cheese samples with the progress of ripening (p < 0.05). The highest amino acids in all periods of ripening were identified as glutamic acid, lysine, proline and aspartic acid. The major (Ca, P, Na, K, Mg) and minor (Zn, Fe, Cu, Mn) mineral levels of cheeses decreased with the progress of ripening and the effects of enzyme supplementations on these attributes (except for magnesium and manganese) were found to be significant (p < 0.01). As to conclude, enzyme supplementations increased proteolysis and lipolysis and accelerated ripening and thus reduced ripening durations. Especially the enzyme ratios in P1 and L1 cheeses were found to be suitable for reducing the ripening period in White cheese without any adverse effects.

1. Introduction

Textural, functional and sensory attributes of cheese usually develop with the progress of ripening. Ripening is a costly process and ripening durations largely vary based on the type of cheese [1]. It is a quite complex and slow biochemical process [2] and involves three basic reactions as of glycolysis, lipolysis and proteolysis [3]. Proteolysis is the primary reaction takes place throughout the ripening cheese [4,5] and it is the key factor to promote the diversity in texture and flavor [6]. During the primary proteolysis, residual rennet enzymes together with milk proteases hydrolyze casein and thus produce large or medium-size peptides. Then in the secondary proteolysis, proteins and large peptides are gradually hydrolyzed into smaller peptides and amino acids with the aid of intracellular and extracellular enzymes of starter cultures or other cheese microorganisms [7]. Such a breakdown of protein networks plays a significant role in textural attributes and in the release of free amino acids with a key role in production of sapid compounds [8]. Cheese flavor is directly related to release of fatty acids during the lipolysis [9]. Since ripening is a quite costly process, various economic and technical processes were practiced accelerating the process and to reduce process costs [10]. Cheese should be stored for certain durations for proper ripening. However, such a longer storage duration requires high investment costs. Shortened storage durations may increase utilization capacities of the ripening rooms, increase production capacities, reduce production costs and provide significant economic contributions to producers [11,12].
Elevated ripening temperatures, addition of enzymes (recombinant enzymes, exogenous enzymes and microencapsulation of enzymes) and starters (attenuated, adjunct and genetically modified cultures) addition of cheese slurry and high-pressure treatment are methods used to accelerate cheese ripening. Among these practices, enzyme supplementation to the milk or curd and elevated ripening temperatures are the most common methods [13,14,15]. While elevated ripening temperatures are able to be applied to limited number of cheese types, the other methods may have legal (genetically modified starters) and technical problems (excessive ripening with the use of some peptidase and proteinases) and such methods can also be quite costly (use of plasmin, attenuated starter culture and free amino acids) [16]. Commercial lipase and protease enzyme are also used separately or in combination to accelerate ripening process of cheese [17,18,19,20,21,22,23]. In this study, two previously determined different doses of Bacillus subtilis-originated neutral protease (Neutrase) and Mucor miehei-originated fungal esterase lipase (Piccantase A) enzymes were used in cheese production and control cheese was produced without any microbial enzyme supplementation. Then produced cheeses were ripened for 3 months. Experiments were conducted in 3 replications and physico-chemical characteristics, nitrogen fractions, free amino acid and mineral compositions of white cheeses were determined at different stages of the ripening process and the effects of enzymes and ripening period on these attributes were determined.

2. Materials and Methods

2.1. Materials

Raw milk supplied from morning milking of Livestock Facility of Agricultural Research and Implementation Center of Agricultural Faculty was used in cheese production. The Ezal MA014 (Ezal; Texel, Dange Saint Romain, France) starter supplied from Ezal Company, commercial ECOREN 200 rennet produced by Maysa Food Co. (Ümraniye, İstanbul, Turkey) were used. As lipolytic enzyme, Mucor miehei-originated Piccantase A GR (fungal esterase-lipase) enzyme supplied from DSM Food Specialties Co. (İzmir, Türkiye) (Turkish Distributor of French Gist-Brocades Co., Izmir, Turkey) and as proteolytic enzyme, Bacillus subtilis-originated Neutrase 1.5 MG enzymes supplied from Novozymes Enzyme Export Co. (Etiler, İstanbul) (Turkish Distributor of Novozymes A/S—Bagguaerd, Denmark) were used. Calcium chloride (Merck, Darmstandt, Germany) and NaCl (Merck) were also supplied from commercial suppliers.

2.2. Methods

2.2.1. Manufacture of Experimental Turkish White Cheeses

Milk was checked for acidity and fats, passed through heat treatment at 68 ± 1 °C for 10 min, cooled down to 34 ± 1 °C and divided into 5 aliquots. These 5 sample aliquots were supplemented with 1% starter culture and 0.002% CaCl2 and subjected to pre-ripening for 30 min. Milk acidity levels were continuously monitored throughout the pre-ripening period and enzyme supplementation and fermentation was performed when the pH level reached to 6.4. Following pre-ripening, two aliquots were supplemented respectively with 0.05 g 100 L−1 (P1 cheese) and 0.10 g 100 L−1 (P2 cheese) Bacillus subtilis-originated neutral protease, the other two aliquots were supplemented with 0.20 g 100 L−1 (L1 cheese) and 0.40 g 100 L−1 (L2 cheese) Mucor miehei-originated fungal esterase lipase enzymes. The remaining last aliquot was used as control (C cheese) without any enzyme supplementation. Milk was coagulated with rennet at 32 ± 1 °C for 90 min. The coagulum was cut into 2–3 cm3 pieces, left to drain for 30 min. The gradually increasing weights (0.01–0.03 kg cm−2) were placed over the samples to press and separate whey. Then, cheese curds were cut into 7.5–8 cm3 pieces and salted at 12% brine and placed into 1 kg cheese containers. The containers were fully filled with 12% fresh brine, tightly closed and left for ripening in a cold storage at 7 ± 1 °C for 90 days.

2.2.2. Methods of Analysis

Gross Composition of Milk, Whey and Cheese Samples

Dry matter (DM) ratio of the milk and whey was determined by gravimetric method [24], fat ratio with Gerber method [25], protein ratios with Micro-Kjeldahl method [26], pH values with Inolop WTW (Weilheim, Germany) digital pH meter, titration acidity with alkaline titration [25], lactose ratios with the Layne–Eynon method [27]. Cheese yield performance was calculated as the amount of cheese (kg) produced from 100 kg milk. Cheese dry matter ratios were determined with gravimetric method [24], fat ratios with Van-Gulik butyrometer [28], protein ratios with Micro-Kjeldahl method [26], salt ratios with Mohr titration method and titration acidity with alkaline titration method [29]. Penetrometer value was determined at 4 ± 1 °C with Sur-Berlin PNR 6-brand penetrometer and the results were achieved as the penetration depth of 95.5 g penetrating tip in 5 s (1/10 mm).
Water soluble nitrogen (WSN) ratio [30], 5% phosphotungstic acid soluble nitrogen (PTA-SN) ratio [31] and 12% trichloroacetic acid soluble nitrogen ratio (TCA-SN) [32] were determined with the Micro–Kjeldahl method [26]. The degree of ripening in terms of 12% TCA soluble nitrogen was calculated as the ratio of 12% TCA soluble nitrogen to total nitrogen (TN). Casein nitrogen ratio was determined by subtracting water soluble nitrogen ratio from total nitrogenous substance ratio and results were expressed in % nitrogen. Protease-peptone nitrogen ratio was calculated by subtracting 12% TCA soluble nitrogen ratio from water soluble nitrogen ratio [33].

Total Free Amino Acid Ratios

Total free amino acid ratios of proteolytic enzyme-supplemented cheeses were determined spectrophotometrically in accordance with Cd-ninhidrine method [34]. Calculations were made based on created standard curve and results were expressed in mg Leu g−1 cheese.

Total Free Fatty Acid Ratios

Fat extractions from lipolytic enzyme-supplemented cheeses were performed in accordance with Nunez et al. [35] with slight modifications and results were expressed in terms of % oleic acid.

Free Amino Acid Composition

Phenomenex EZ Faast GC-FID Hydrolyzed Amino Acid Analysis by GC-FID kit (Phenomenex, Lane Cove West, NSW, Australia) was used to determine individual amino acids [36]. The procedure is briefly composed of three phases as of solid-phase extraction clean-up, derivation of the amino acids and liquid/liquid extraction phases. Zebron ZB-AAA chromatography column (10 m × 0.25 mm) fitted to a Varian CP-3800 gas chromatograph was used to analyze resultant derivative amino acids with an organic layer. The gas chromatograph was equipped with an auto-sampler and a flame ionization detector (FID 320 C, California, CA, USA) and operated at constant pressure flow mode (helium, 60 kPa, 1.5 mL/min) with a split injection ratio of 1:15. The injector temperature was 250 °C and detector temperatures was 300 °C. The column oven temperature was gradually increased from 110 °C to 310 °C with an increment ratio of 30 °C min−1. Then the temperature was held constant at 310 °C for 18 s. The overall run time was 7.56 min. The chromatographic data were managed by Varian Star Chromatography software (version 5.52; Varian Inc., Palo Alto, CA, USA). Amino acid quantities of proteolytic enzyme-supplemented cheese samples were calculated from the GC peaks and results were expressed in mg 100 g−1. These analyses were performed at the TUBITAK (The Scientific and Technical Research Council of Turkey) Food Institute of Marmara Research Centre.

Mineral Analyses with Atomic Absorption Spectrophotometer

Dry-ashing method was employed in mineral analyses [37]. Phosphorus analyses of cheese samples were performed colorimetrically in a spectrophotometer (Hitachi U-2000, Minato-ku, Tokyo, Japan). Readings were performed with the standard samples prepared identical with the samples prepared in accordance with Barton (0–100 mg P mL−1) at 430 nm. K, Na, Ca, Mg, Fe, Cu, Zn and Mn contents were determined with the aid of an Atomic Absorption Spectrophotometer (AAS) (Varian SpectrAA220, Victoria, Australia) provided that required dilutions were performed. Resultant values were multiplied by dilution factor and expressed in mg 100 g−1 DM.

Statistical Analyses

Statistical analyses were performed in accordance with one way ANOVA “Coincidental Parsellity Trial Plan” to determine the effects of different enzymes and ripening period and significant differences were compared with Duncan’s multiple range test.

3. Results and Discussion

3.1. Raw Milk and Whey Characteristics and Cheese Yield Performance

As can be seen in Table 1, average dry matter content of the raw milk was 11.23%, fat content was 3.2%, protein content was 3.13%, lactose content was 4.37%, pH was 6.61 and acidity was 6.69 °SH. Whey pH values varied between 5.62–5.69%, titration acidity values varied between 8.26–8.75 °SH, dry matter ratios between 6.52–6.64%, protein contents between 0.90–0.91%, lactose contents between 4.25–4.49% and the values were close to each other (p > 0.05). Fat contents of whey samples varied between 0.25–0.30% with the lowest values from the control and L1 cheese (p < 0.01).
Cheese yield performances varied between 12.97–14.02% (Table 2) and enzyme-supplemented cheeses had significantly different and lower values than the control cheese (p < 0.05). The actual performance is indicated as transition ratio of milk dry matter components into the cheese. In case of performance calculations as to have 40% dry matter ratio in white cheese, it was observed that protease and lipase enzyme-supplemented cheeses had close performance values to each other but had significantly lower values than the control cheese and decreasing performance values were observed with increasing enzyme supplementation rates (p < 0.05). Previous researchers also indicated that enzyme supplementation to cheese to accelerate ripening reduced performance values and such a case primarily resulted from increasing nitrogen losses in whey [14,19,38,39].

3.2. Gross Composition of Cheeses

Titration acidity, penetrometer values and general composition characteristics of white cheeses throughout 90-day ripening period are provided in Table 3. Titration acidity (TA) values of cheeses throughout the ripening period were close to each other, while the differences between the cheeses and enzyme dose x ripening period interaction were not significant (p > 0.05), but the effects of ripening period were found to be significant (p < 0.01). It was also reported in previous studies that enzyme-supplemented cheeses did not have significantly different acidity values from the control cheese [38,40,41].
Enzyme supplementation had significant effects on dry matter and protein contents of the chesses at 30th and 90th day of ripening (p < 0.05), ripening period and enzyme × ripening period interaction had significant effects on these attributes at p < 0.01 level. It was reported in previous studies that proteolytic and lipolytic enzymes did not have significant effect on dry matter content of cheeses [42,43,44,45]. Increasing acidity levels were reported to reduce water holding capacity of casein, thus increased dry matter content of the cheeses [46]. At the 90th day of ripening, protease enzyme-supplemented cheeses had significantly lower protein contents than the control cheese (p < 0.01) such a case was resulted from excessive protease contents. Protein contents of the cheeses had generally decreasing trends after the 30th day of ripening (p < 0.01).
The effects of enzyme treatments and enzyme × ripening period interaction on fat contents of the cheeses were not found to be significant (p > 0.05). It was reported that lipase enzyme supplementation did not have significant effects on fat contents of Ras cheese produced with Piccantase A [42,43], on fat contents of again Domiate cheese produced by using Palatase A, Palatase M and Piccantase [46] and on fat contents of Kasher cheese produced with Palatase M 200 L [47] and increasing fat contents were reported with the progress of ripening just based on increasing dry matter contents [41]. Slightly lower fat contents of lipase enzyme-supplemented cheeses than the others on 90th day of ripening can be attributed to high lipase enzyme activity and resultant release of fat from the cheeses. High fat contents of protease enzyme-supplemented chesses than the others can be attributed to release of nitrogenous by-products from the cheeses because of proteolysis with the progress of ripening and resultant decreasing protein content and relatively increasing fat and other compound content of dry matter. Present analyses revealed that enzyme treatments had significant effects on salt ratios throughput the ripening period (p < 0.05), except for 90th day of ripening. On the other hand, ripening period and enzyme × ripening period interaction had significant effects on the salt ratios at p < 0.01 level. The fluctuations in dry matter salt ratios of lipase-supplemented cheeses can be attributed to changes in dry matter contents of these cheeses.
As compared to the 1st day of ripening, cheeses hardened on 15th day of ripening, but softened from the 30th day until the end of ripening period. Enzyme treatments, enzyme x ripening period interaction had significant effects on penetrometer value (PV) (p < 0.01). As compared to the control cheese, at the last period of ripening, proteolytic enzyme-supplemented cheeses had either similar or harder texture and lipase enzyme-supplemented cheeses had softer texture (p < 0.01). Such a case can be attributed to high lipase levels of the cheeses [40,48].

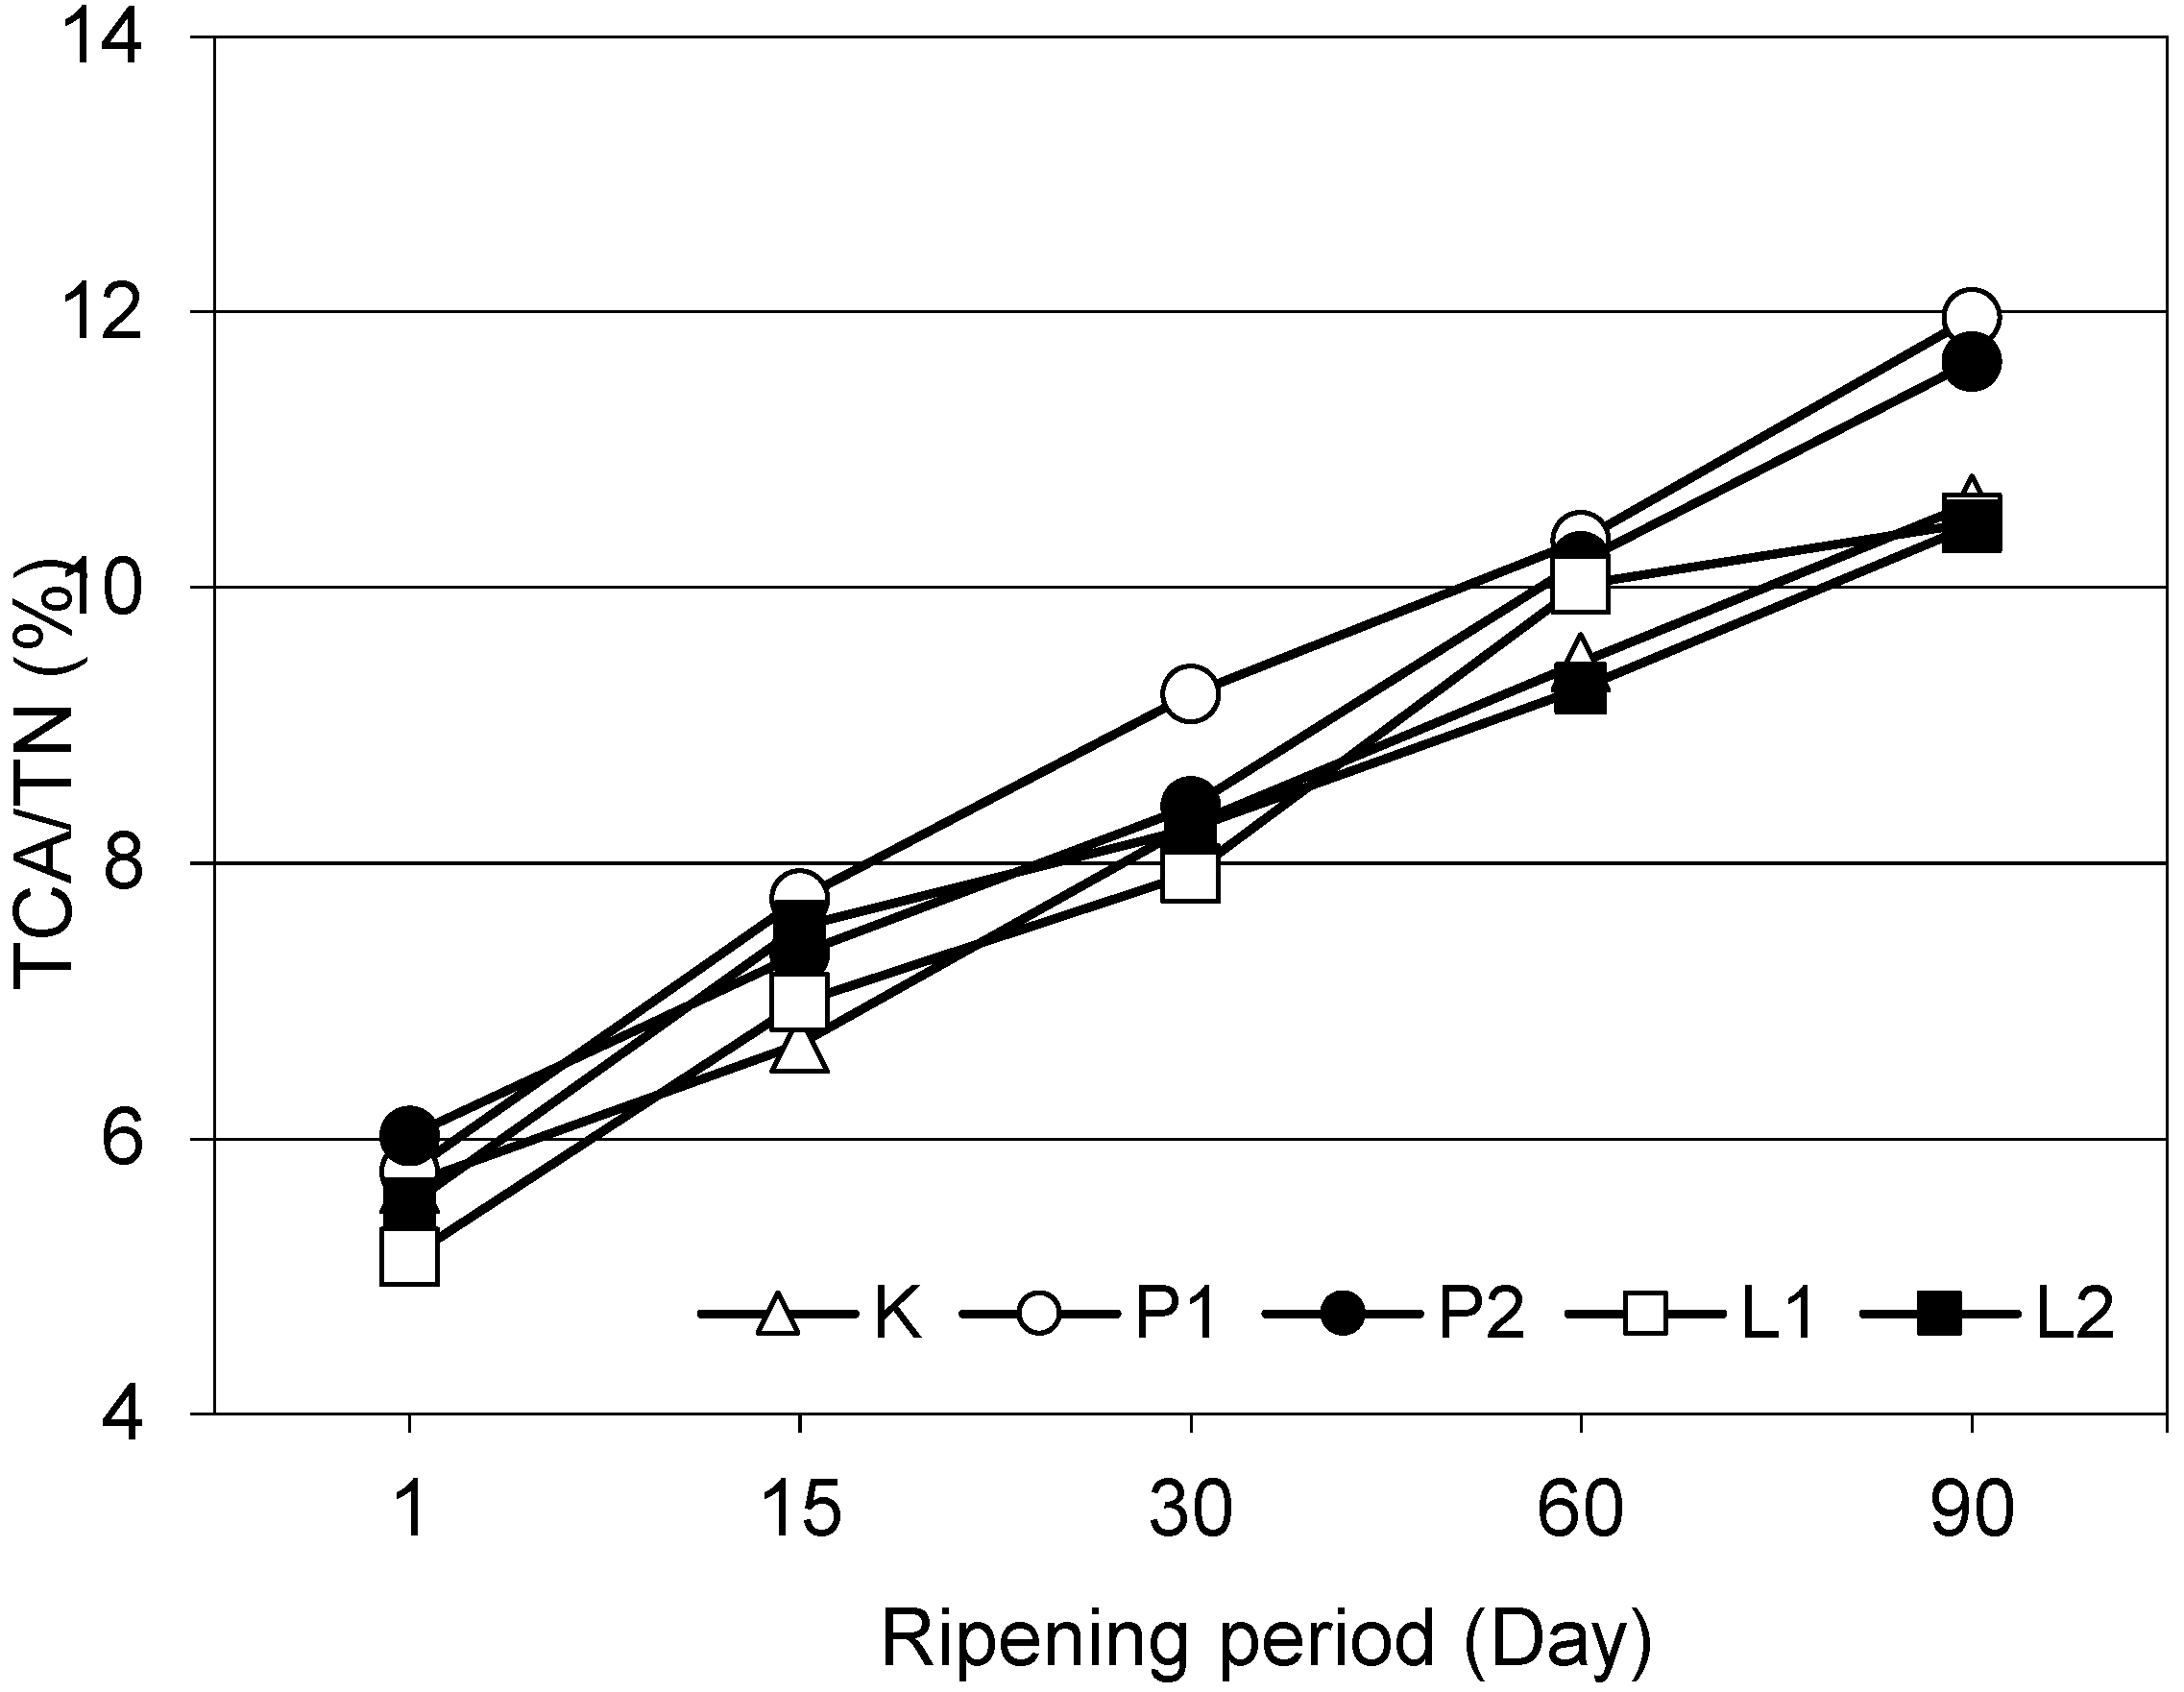
3.3. Nitrogen Fractions and Ripening Index of the Cheeses

In terms of water soluble nitrogen and 12% TCA soluble nitrogen contents (Table 4) of the cheeses, it was observed that protease enzyme-supplemented cheeses were significantly different from the others on the last day of ripening and significant increases were observed throughout the ripening period (p < 0.01). Nunez et al. [48]. reported that water soluble nitrogen formation in cheeses was more influenced from Neutrase L and Novozym proteinase enzyme supplementations than the 12% TCA-SN and 5% PTA-SN soluble nitrogen formation. Nasr [38] for Piccantase enzyme-supplemented Romi cheeses, Kheadr et al. [49] for Mucor miehei-originated Palatase M and Aspergillus niger-originated Lipase 50 enzyme-supplemented Cheddar cheeses, reported that water soluble nitrogen and non-protein nitrogenous substance contents were slightly higher than the control cheese and these values increased with the progress of ripening.
Peptide and amino acids with a molecular weight less than 600 dalton are significant indicators of cheese aroma levels [18] and these substances dissolved in 5% PTA-SN [50]. The differences in peptide and amino acid quantities dissolved in 5% PTA-SN at different ripening periods were found to be significant, proteolytic enzyme quantities did not yield significant differences (p > 0.05) and protease enzyme-supplemented cheeses were significantly different from lipase enzyme-supplemented chesses (p < 0.01). Such a case can be attributed to enhanced peptidase activity arising from the higher levels of primary proteolysis. Researchers indicated the primary reason for such cases as solubility of small molecule peptides and amino acids generated throughout the ripening duration in 5% PTA-SN. Increasing free amino acid quantities of these cheeses also support such an idea.
With regard to casein ratios in % nitrogen contents, it was observed that enzyme treatments (except for 30th day of ripening), ripening period, enzyme × ripening period interaction had significant effects on casein % nitrogen values, casein % nitrogen values decreased throughout the ripening duration (p < 0.01) and such a decrease was higher in proteolytic enzyme-supplemented cheeses than the control cheese (p < 0.01). Decreasing casein nitrogen quantities can be attributed to hydrolysis of α- and β-casein into peptides and amino acids.
Enzyme treatments, enzyme × ripening period interaction had significant effects on protease-peptone nitrogen values at p < 0.05 levels and ripening period had significant effects at p < 0.01 level. Except for 30th day of ripening, protease-peptone nitrogen rations of cheeses increased throughout the ripening period, except for 30th day of ripening (p < 0.01). Karaca and Guven [51] indicated regular decreases in casein nitrogen and increases in protease-peptone nitrogen ratios of white cheeses during the ripening process and reported the highest change in cheeses including Mucor miehei-originated protease enzyme.
Except for the 15th and 30th day of ripening, lipolytic and proteolytic enzyme-supplementations had significant effects on 12% TCA soluble nitrogen ratios, in other words on ripening index (Figure 1), of the cheeses (p < 0.01). On the 90th day of ripening, lipase enzyme-supplemented L1 and L2 chesses had similar 12% TCA soluble nitrogen ratios with the control cheese and such a ratio of proteolytic enzyme-supplemented P1 and P2 cheeses were significantly higher than the other cheeses (p < 0.01). On the other hand, enzyme quantities did not have significant effects on this ratio (p > 0.05). The 12% TCA soluble nitrogen ratios of white cheeses regularly increased with the progress of ripening (p < 0.01). Significant increases in 12% TCA soluble nitrogen ratios were also reported with the progress of ripening in Feta cheese by Valsamaki et al. [52], in Manchego cheese by Gaya et al. [53] and in white cheeses by Güven and Karaca [54], Cinbaş and Kılıç [55]. Significantly higher TCA soluble nitrogen ratios than the control cheese and increasing values with the progress of ripening were also reported for Bacillus subtilis-originated neutral protease-supplemented Manchego cheese [48,56] and Cheddar cheese [57].

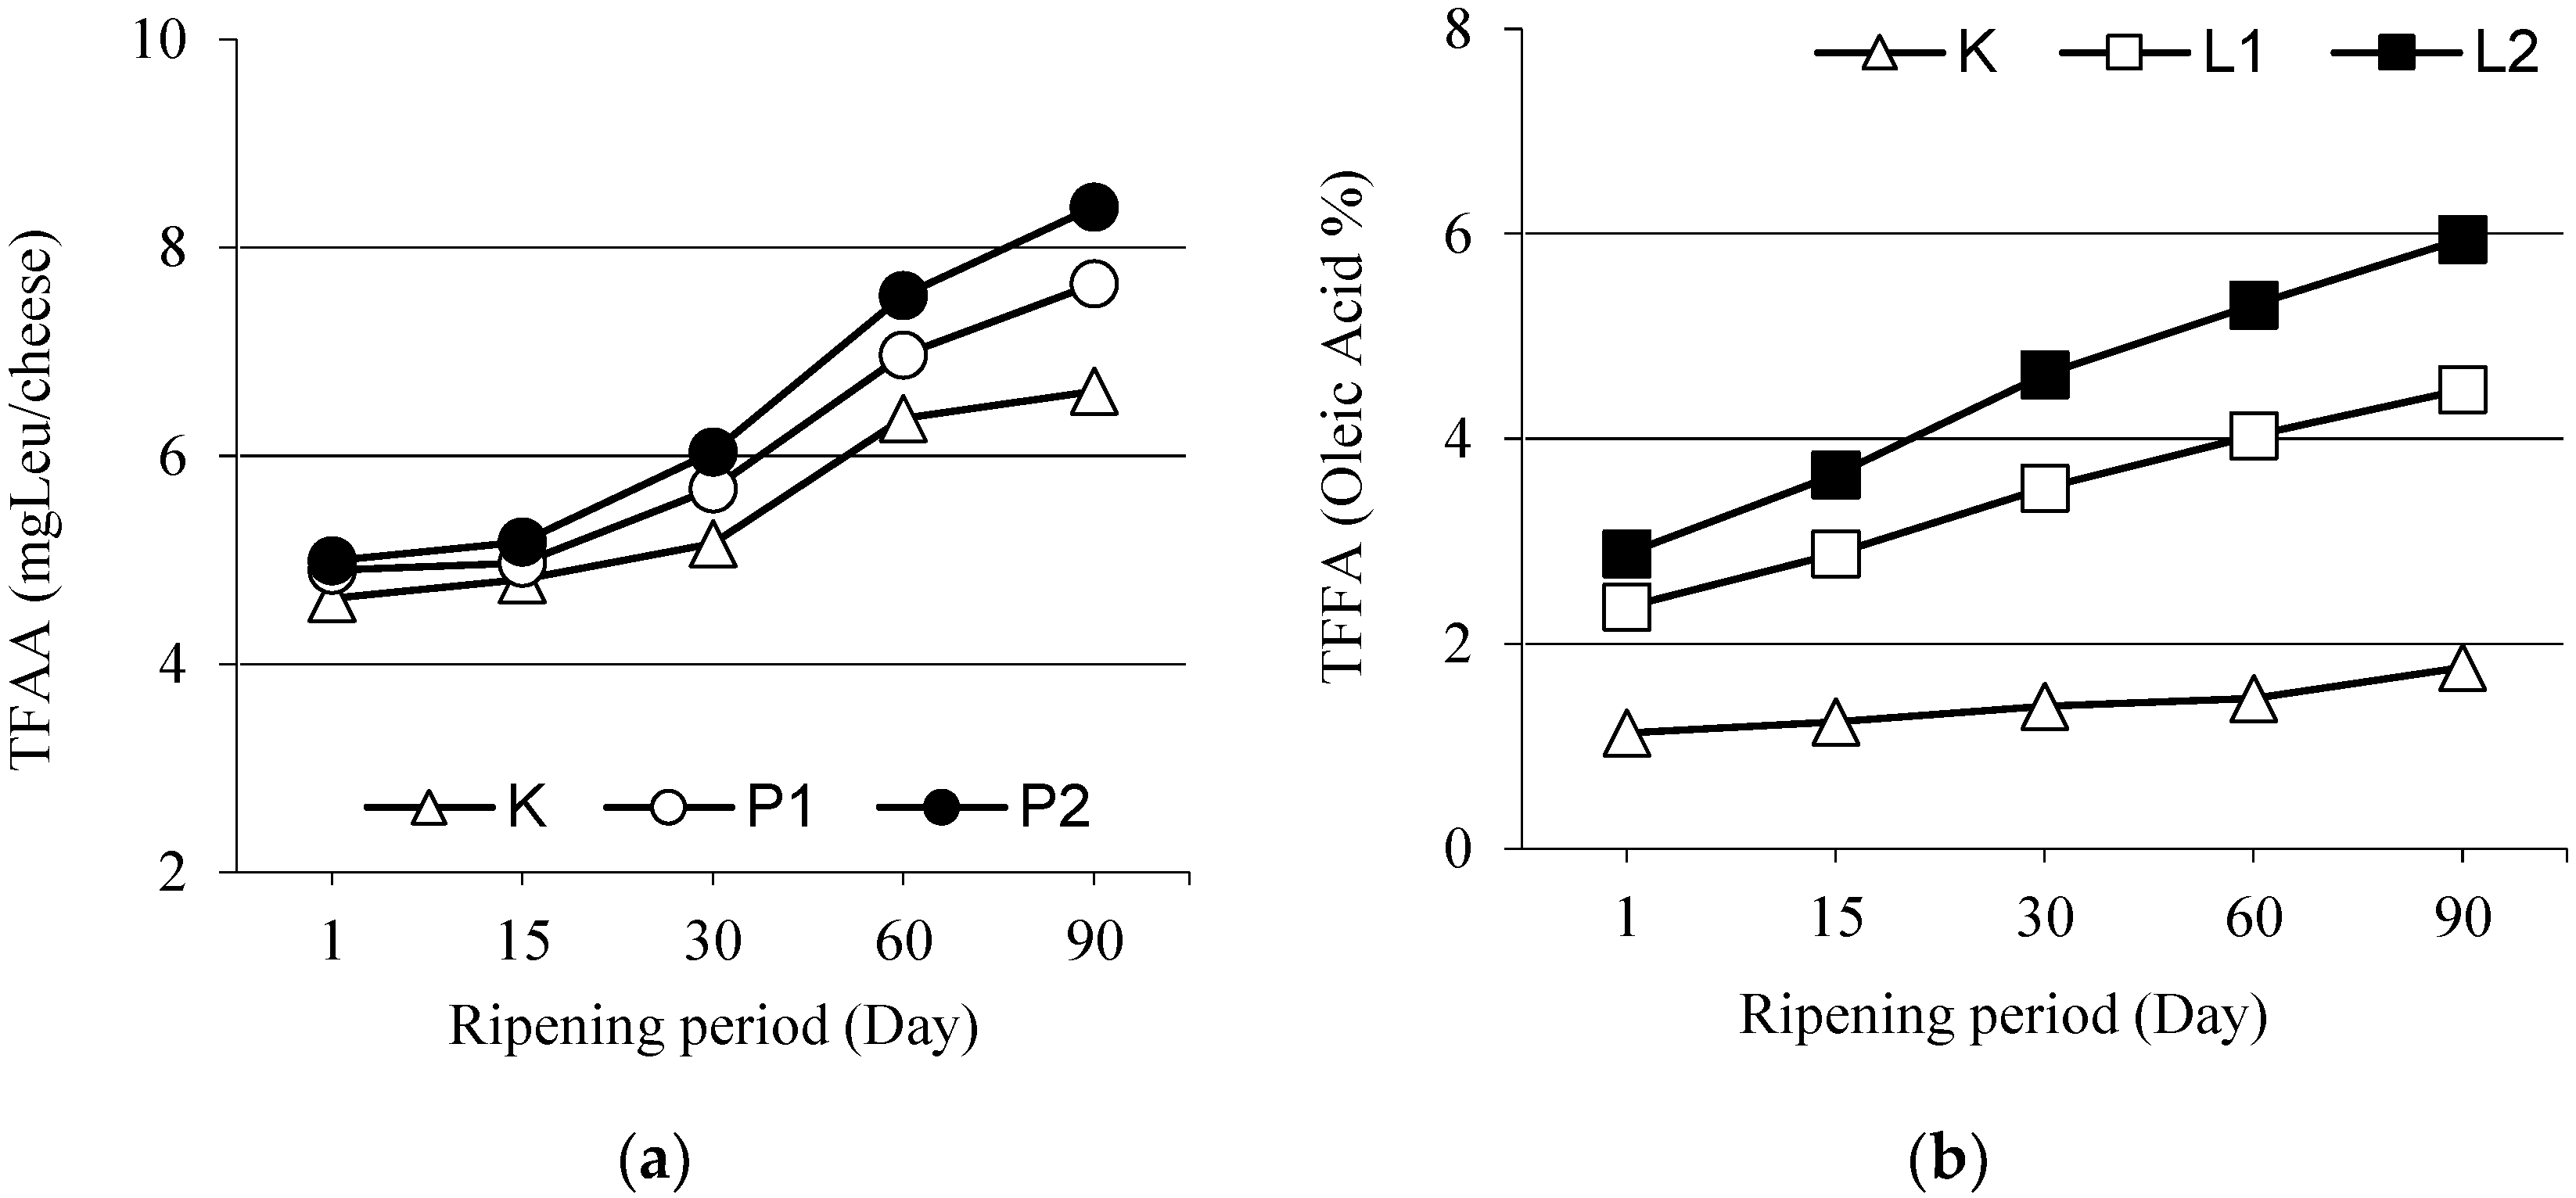
3.4. Total Free Amino Acids

Total free amino acid contents of the white cheeses are presented as means ± standard errors in Figure 2. Enzyme treatments, ripening period and enzyme × ripening period interaction had significant effects on total free amino acid contents of the cheeses. Total free amino acid contents of protease-supplemented cheeses were significantly higher than the control cheese on the 1st day of ripening (p < 0.01) and such a case went on throughout the ripening duration (p < 0.01).
Total free amino acid contents of the cheeses increased with increasing enzyme quantities and total free amino acid content of P2 cheese was significantly higher than the P1 cheese (p < 0.01). Faster increases were also reported in total free amino acid levels of protease enzyme-supplemented cheeses throughout the ripening process [19,58,59]. Increasing total free amino acid contents with the progress of ripening were also reported for Feta cheese [52,60] and for Ras cheese [61].

3.5. Individual Free Amino Acid Composition

Individual free amino acid composition of cheeses (15 amino acids) is provided in Table 5.
Free amino acid content of cheese is largely depending on manufacturing technology and ripening period. However, the primary factors responsible for amino acid release were indicated as non-starter lactic acid bacteria and proteolytic enzymes in the cheese [4]. They contribute to the overall characteristic flavor of different cheese varieties [6] and describe how far the ripening has proceeded [62]. As compared to the control cheese, protease enzyme-supplemented cheeses had significantly higher proline, aspartate and glutamate amino acid concentrations on the 30th day of ripening (p < 0.05). On the other hand, on the 90th day of ripening, proline, aspartate, glutamate and histidine amino acid concentrations of enzyme-supplemented cheeses were different from each other (p < 0.05). A general increase was observed in free amino acid concentrations of the control and protease enzyme-supplemented cheeses throughout the ripening period. The proteolytic activity during cheese ripening produces a higher content of short-chain peptides and FAAs [63]. The increase in aspartate and methionine concentrations of especially the proteolytic enzyme-supplemented cheeses throughout the ripening period was quite higher than the control treatment. In all periods of ripening of white cheeses, the highest amino acids were identified as glutamate, leucine, proline and aspartate and these amino acids increased with increasing protease enzyme quantities (p < 0.05).

3.6. Total Free Fatty Acids (TFFA)

Total free fatty acid quantities of lipase enzyme-supplemented cheeses (Figure 2) were higher than the control cheese in all ripening periods and total fatty acid quantities increased with increasing enzyme quantities (p < 0.01). Total free fatty acids of all cheeses regularly increased with the progress of ripening and enzyme x ripening period interaction had significant effects on these increases in all periods of ripening (p < 0.01). Previous researchers also reported increasing total fatty acid quantities throughout the ripening process in different cheese types [41,61]. Dinkçi [64] and Koçak et al. [45] indicated significant effects of lipase enzyme (Piccantase A, Palatase M 200 L) concentrations on total fatty acid quantities of cheese samples and reported increasing total fatty acid quantities with increasing enzyme concentrations.

3.7. Mineral Composition

Some minerals move from the inside out with the effect of pH and thus variations are observed in mineral concentrations of the final products [65]. On 30th day of ripening, calcium and magnesium contents of the cheese samples varied respectively between 687–764 and between 204–211 mg 100 g−1 (Table 6).
The values decreased on 90th day and varied respectively between 631–718 mg 100 g−1 and between 175–189 mg 100 g−1. The control and lipase enzyme-supplemented cheeses had higher calcium, sodium and phosphorus contents than the protease enzyme-supplemented cheeses. Statistical analyses revealed that enzyme treatments had significant effects on calcium, sodium, magnesium, phosphorus and zinc contents of while cheeses (p < 0.01) but did not have significant effects on potassium contents (p > 0.05). Ripening period and enzyme × ripening period interaction had significant effects on all minerals (p < 0.05). On the 30th day of ripening, the highest zinc (Zn) content (4.63 mg 100 g−1) was obtained from the control cheese and it was respectively followed by P2, L2, L1 and P1 cheeses (p < 0.05). The differences in iron (Fe) contents of the cheeses were not found to be significant on 30th day of ripening (p > 0.05). Enzyme treatments did not have significant effects on iron and manganese contents (p > 0.05) but had significant effects on copper contents (p < 0.01). Effects of ripening period and enzyme × ripening period interaction were not also found to be significant (p > 0.05). Major and minor minerals of cheese samples decreased with the progress of ripening. Such decreases throughout the ripening process were attributed to mineral passage into brine in time.

4. Conclusions

In this study, cheese was produced with Bacillus subtilis-originated neutral protease (Neutrase) and Mucor miehei-originated fungal esterase lipase (Piccantase A) enzyme supplementation at two previously determined quantities. The control cheese was produced without any microbial enzyme supplementations. Cheese samples were ripened for 3 months. Lipase enzyme supplementation increased whey fat content. In case of performance calculations as to have 40% dry matter ratio in white cheese, it was observed that enzyme-supplemented cheeses (except for P1 cheese) had significantly lower cheese yield performance than the control cheese. While titration acidity, dry matter content, water soluble nitrogen, 12% TCA soluble nitrogen, 5% PTA soluble nitrogen, protease-peptone nitrogen, penetrometer value, total free fat and amino acid concentrations increased, salt, casein nitrogen and mineral concentrations decreased with the progress of ripening. The highest major minerals were identified as sodium, calcium and phosphorus and the minor minerals as zinc and iron, respectively. The highest penetrometer values, in other words the softest texture, were obtained from lipase enzyme-supplemented chesses. It was concluded based on present findings that enzyme supplementations increased secondary proteolysis especially increasing free amino acids contents and lipolysis and accelerated ripening and thus reduced ripening period. The use of 0.20 g 100 L−1 Neutrase and 0.05 g 100 L−1 Piccantase A in White cheeses is recommended for providing significant economic contributions (increasing the capacity of ripening rooms, reducing costs and time) to producers. It has been determined that the use of proteolytic and lipolytic enzymes at higher levels causes a hard and brittle structure in cheeses and a bitter taste due to excessive proteolysis and lipolysis.

Author Contributions

Examined the literature, O.B.K. and M.G.; Methodology, O.B.K. and M.G.; Performed the Analysis, O.B.K.; Project Administration, M.G. and O.B.K.; Writing—Original Draft Preparation, Review & Editing, O.B.K.; O.B.K. is the supervisor of article submission.

Funding

This work was supported by a grant from Cukurova University Academic Research Projects Unit (Project No. FBE.2000D.124).

Conflicts of Interest

The authors declare no conflict of interest. The founding sponsors had no role in the design of the study; in the collection, analyses, or interpretation of data; in the writing of the manuscript, and in the decision to publish the results.

References

  1. Pachlová, V.; Bunka, F.; Flasarová, R.; Válková, P.; Bunková, L. The effect of elevated temperature on ripening of Dutch type cheese. Food Chem. 2012, 132, 1846–1854. [Google Scholar] [CrossRef]
  2. Fox, P.F. Proteolysis during cheese manufacture and ripening. J. Dairy Sci. 1989, 72, 1379–1400. [Google Scholar] [CrossRef]
  3. Mcsweeney, P.L.H. Biochemistry of cheese ripening. Int. J. Dairy Technol. 2004, 57, 127–144. [Google Scholar] [CrossRef]
  4. Poveda, J.M.; Molina, G.M.; Gómez-Alonso, S. Variability of biogenic amine and free amino acid concentrations in regionally produced goat milk cheeses. J. Food Compost. Anal. 2016, 51, 85–92. [Google Scholar] [CrossRef]
  5. Ceruti, R.J.; Zorrilla, S.E.; Sihufe, G.A. The influence of elevated initial ripening temperature on the proteolysis in Reggianito cheese. Food Res. Int. 2012, 48, 34–40. [Google Scholar] [CrossRef]
  6. McCarthy, C.M.; Kelly, P.M.; Wilkinson, M.G.; Guinee, T.P. Effect of fat and salt reduction on the changes in the concentrations of free amino acids and free fatty acids in Cheddar-style cheeses during maturation. J. Food Compost. Anal. 2017, 59, 132–140. [Google Scholar] [CrossRef]
  7. Giannoglou, M.; Karra, Z.; Platakou, E.; Katsaros, G.; Moatsou, G.; Taoukis, P. Effect of high pressure treatment applied on starter culture or on semi-ripened cheese in the quality and ripening of cheese in brine. Innov. Food Sci. Emerg. Technol. 2016, 38, 312–320. [Google Scholar] [CrossRef]
  8. Saldo, J.; McSweeney, P.L.H.; Sendra, E.; Kelly, A.L.; Guamis, B. Proteolysis in caprine milk cheese treated by high pressure to accelerate cheese ripening. Int. Dairy J. 2002, 12, 35–44. [Google Scholar] [CrossRef]
  9. Karami, M. Enhancing the lipolysis of feta-type cheese made from ultrafiltered cow’s milk. LWT Food Sci. Technol. 2017, 80, 386–393. [Google Scholar] [CrossRef]
  10. Ferrazza, R.E.; Fresno, J.M.; Ribeiro, J.I.; Tornadijo, M.E.; Furtado, M.M. Changes in the microbial flora of Zamorano cheese (P.D.O.) by accelerated ripening process. Food Res. Int. 2004, 37, 149–155. [Google Scholar] [CrossRef]
  11. Scolari, G.; Vescovo, M.; Sarra, P.G.; Bottazzi, V. Proteolysis in cheese made with liposome-entrapped proteolytic enzymes. Le Lait 1993, 73, 281–292. [Google Scholar] [CrossRef] [Green Version]
  12. Folkertsma, B.; Fox, P.F.; Mcsweeney, P.L.H. Accelerated ripening of cheddar cheese at elevated temperatures. Int. Dairy J. 1996, 6, 1117–1134. [Google Scholar] [CrossRef]
  13. Fox, P.F.; Wallace, J.M.; Morgan, S.; Lynch, C.M.; Niland, E.J.; Tobin, J. Acceleration of cheese ripening. Antonie van Leeuwenhoek 1996, 70, 271–297. [Google Scholar] [CrossRef] [PubMed]
  14. Law, B.A. Controlled and accelerated cheese ripening: The research base for new technologies. Int. Dairy J. 2001, 11, 383–398. [Google Scholar] [CrossRef]
  15. Kilcawley, K.N.; Nongonierma, A.B.; Hannon, J.A.; Doolan, I.A.; Wilkinson, M.G. Evaluation of commercial enzyme systems to accelerate Cheddar cheese ripening. Int. Dairy J. 2012, 26, 50–57. [Google Scholar] [CrossRef]
  16. Corsetti, A.; Gobbetti, M.; Smacchi, E.; Angelis, M.; Rossi, J. Accelerated ripening of Pecorino Umbro cheese. J. Dairy Res. 1998, 65, 631–642. [Google Scholar] [CrossRef]
  17. Lin, J.C.C.; Jeon, I.J. Effects of commercial food grade enzymes on free fatty acid profiles in granular cheddar cheese. J. Food Sci. 1987, 52, 78–83. [Google Scholar] [CrossRef]
  18. Mcsweeney, P.L.H.; Sousa, M.J. Biochemical pathways for the production of flavour compounds in cheeses during ripening: A review. Le Lait 2000, 80, 293–324. [Google Scholar] [CrossRef] [Green Version]
  19. Fernandez-Garcia, E.; Lopez-Fandino, R.; Alonso, I.; Ramos, M. The use of lipolytic and proteolytic enzymes in the manufacture of Manchego type cheese from ovine and bovine milk. J. Dairy Sci. 1994, 77, 2139–2149. [Google Scholar] [CrossRef]
  20. Fernandez-Garcia, E.; Lopez-Fandino, R.; Alonso, I. Effect of a food-grade enzyme preparation from aspergillus oryzae on free fatty acid release in Manchego-type cheese from ovine and bovine milk. Zeitschrift für Lebensmittel-Untersuchung und Forschung 1994, 199, 262–264. Available online: https://link.springer.com/content/pdf/10.1007%2FBF01193308.pdf (accessed on 7 May 2018). [CrossRef]
  21. Jarmul, J.; Reps, A.; Leman, H. Application of microbial preparation for acceleration of cheese ripening in the manufacture of tilsit type whey protein ıncorporated-cheese. Arta Academiae Agriculturae ac Technicae Olstenensis Technologia Alimentorum 1995, 28, 41–48. [Google Scholar]
  22. Koçak, C.; Avşar, Y.K.; Gürsel, A.; Semiz, A. Effect of lipase enzyme (Palatase A 750 L) on the ripening of Tulum cheese. Turk. J. Agric. For. 1995, 19, 171–177. [Google Scholar]
  23. Koçak, C.; Gürsel, A.A.; Avşar, Y.K.; Semiz, A. Effect of lipase enzyme (Palatase M 200 L) on the ripening of skin cheese. Egypt. J. Dairy Sci. 1995, 23, 43–52. [Google Scholar]
  24. IDF. Determination of the Total Solid Content (Cheese and Processed Cheese); IDF Standard 4A; International Dairy Federation: Brussels, Belgium, 1982. [Google Scholar]
  25. Anonymous. TS-1018 Çiğ İnek Sütü Standardı; Türk Standartları Enstitüsü: Ankara, Turkey, 1994; 15p. [Google Scholar]
  26. IDF. Milk Determination of Nitrogen Content; International Dairy Federation: Brussels, Belgium, 1993; p. 12. [Google Scholar]
  27. Anonymous. Gıda Maddeleri Muayene ve Analiz Yöntemleri; Genel Yayın No: 65; T. C. Tarım Orman Köy İşleri Bakanlığı, Gıda İşleri Genel Müdürlüğü: Ankara, Turkey, 1983; 796p. [Google Scholar]
  28. Kotterer, R.; Munch, S. Untersuchungsverfahren fur das Milchwirtschaftliche Laboratorium; Volkswirtschaftliche Verlag GmbH: Munchen, Germany, 1978; 201p. [Google Scholar]
  29. Anonymous. TS 591 Beyaz Peynir Standardı; Türk Standartları Enstitüsü: Ankara, Turkey, 1995; 9p. [Google Scholar]
  30. Kuchroo, C.N.; Fox, P.F. Soluble nitrogen in Cheddar cheese: Comparison of extraction procedures. Milchwissenschaft 1982, 37, 331–335. [Google Scholar]
  31. Jarrett, W.D.; Aston, J.W.; Dulley, J.R. A simple method for estimating free amino acids in Cheddar cheese. Aust. J. Dairy Technol. 1982, 37, 55–58. [Google Scholar]
  32. Polychroniadou, A.; Michaelidou, A.; Paschaloudis, N. Effect of time, temperature and extraction method on the trichloroacetic acid-soluble nitrogen of cheese. Int. Dairy J. 1999, 9, 559–568. [Google Scholar] [CrossRef]
  33. Argumosa, O.B.; Carballo, J.; Bernardo, A.; Martin, R. Chemical characterization of a Spanish artisanal goat cheese (Babai-Laciana Variety). Microbiol. Aliments Nutr. 1992, 10, 69–79. [Google Scholar]
  34. Folkertsma, B.; Fox, P.F. Use of cd-ninhydrin reagent to assess proteolysis in cheese during ripening. J. Dairy Res. 1992, 59, 217–224. [Google Scholar] [CrossRef]
  35. Nunez, M.; Garcia-Aser, C.; Rodriguez-Martin, M.A.; Medina, M.; Gaya, P. The effect of ripening and cooking temperatures on proteolysis and lipolysis in Manchego cheese. Food Chem. 1986, 21, 115–123. [Google Scholar] [CrossRef]
  36. Badawy, A.A.-B. The EZ: Faast family of amino acid analysis kits: Application of the GC-FID kit for rapid determination of plasma tryptophan and other amino acids. In Amino Acid Analysis. Methods in Molecular Biology (Methods and Protocols); Alterman, M., Hunziker, P., Eds.; Humana Press: Totowa, NJ, USA, 2012; Volume 828, ISBN 978-1-61779-445-2. [Google Scholar]
  37. American Organization of Analytical Chemists (AOAC). Atomic Absorption Spectrophotometric Method; American Organization of Analytical Chemists (AOAC): Arlington, VA, USA, 1990; Volume 68, p. 514. [Google Scholar]
  38. Nasr, M. Acceleration of Romi cheese ripening by addition of fungal esteraz lipase powder. Egypt. J. Dairy Sci. 1983, 11, 309–315. [Google Scholar]
  39. El-Soda, M. Accelerated Cheese Ripening. In Encyclopedia of Dairy Science; Fuquay, J.W., Fox, P.F., Eds.; Academic Press: Paris, France, 2003; Volume 1, pp. 327–329. [Google Scholar]
  40. Abd El-Salam, M.H.; El-Shibiny, S.; Moneib, A.F.; Abo El-Heiba, A.; El-Khamy, A.F. Addition of lipase in the manufacture of pickled soft cheese fromwhole and skim milk powder. Egypt. J. Dairy Sci. 1981, 9, 143–149. [Google Scholar]
  41. Aydemir, S.; Akın, N.; Koçak, C. Effect of lipase enzyme on the ripening of white pickled cheese. J. Food Lipids 2001, 8, 205–213. [Google Scholar] [CrossRef]
  42. Hagrass, A.E.A.; El-Ghandour, M.A.; Hammad, Y.A.; Hofi, A.A. Production of Ras cheese from recombined milk. III. Effect of some ripening agents. Egypt. J. Dairy Sci. 1983, 11, 271–279. [Google Scholar]
  43. El-Soda, M.; Ezzat, N.; Hassaneın, S.; El-Abassy, F.; Wahba, A. Acceleration of Ras cheese ripening. 1. Addition of commercial enzymes preparation. Egypt. J. Dairy Sci. 1990, 18, 171–178. [Google Scholar]
  44. El-Shazly, A.; El-Tahra, M.A.; El-Din, M.M.Z.; Guıoda, M.S. Effect of Using some lipolytic enzymes on the chemical composition and sensory evaluation of Roquefort cheese. Egypt. J. Food Sci. 1995, 22, 129–137. [Google Scholar]
  45. Koçak, C.; Bitlis, A.; Gürsel, A.; Avşar, Y.K. Effect of added fungal lipase on the ripening of Kasar cheese. Milchwissenschaft 1996, 51, 13–17. [Google Scholar]
  46. Ezzat, N. Accelerated ripening of Ras cheese with a commercial proteinase and intracelluler enzymes from Lactobacillus delbrueckii subsp bulgaricus, Propionibacterium freudenreichii and Brevibacterium linens. Le Lait 1990, 70, 459–466. [Google Scholar] [CrossRef]
  47. Bitlis, A. Lipaz Enziminin (Palatase M 200 L) Kaşar Peynirinin Olgunlaşması Üzerine Etkisi. Yüksek Lisans Tezi, Fen Bilimleri Enstitüsü, Ankara Üniversitesi, Ankara, Turkey, 1992; 90p. [Google Scholar]
  48. Nunez, M.; Guillen, A.M.; Rodriguez-Martin, M.A.; Marcilla, A.M.; Gaya, P.; Medina, M. Accelerated ripening of ewes’ milk Manchego cheese: The effect of neutral proteinases. J. Dairy Sci. 1991, 74, 4108–4118. [Google Scholar] [CrossRef]
  49. Kheadr, E.E.; Vuıllemard, J.C.; El-Deeb, S.A. Acceleration of Cheddar cheese lipolysis by using liposome-entrapped lipases. J. Food Sci. 2002, 67, 485–491. [Google Scholar] [CrossRef]
  50. Hannon, J.A.; Wilkinson, M.G.; Delahunty, C.M.; Wallace, J.M.; Morrissey, P.A.; Beresford, T.P. Use of autolytic starter systems to accelerate the ripening of Cheddar cheese. Int. Dairy J. 2003, 13, 313–323. [Google Scholar] [CrossRef]
  51. Karaca, O.B.; Güven, M. Effect of Ripening Temperatures and Microbial Enzymes on Proteolysis in White Pickled Cheese. In Proceedings of the 3rd International Symposium on “Traditional Foods from Adriatic to Caucasus”, Sarajevo, Bosnia and Herzegovina, 1–4 October 2015. [Google Scholar]
  52. Valsamaki, K.; Michaelidou, A.; Polychroniadou, A. Biogenic amine production in Feta cheese. Food Chem. 2000, 71, 259–266. [Google Scholar] [CrossRef]
  53. Gaya, P.; Medina, M.; Rodriguez-Marin, M.A.; Nunez, M. Accelerated ripening of ewes’ milk Manchego cheese: The effect of elevated ripening temperatures. J. Dairy Sci. 1990, 73, 26–32. [Google Scholar] [CrossRef]
  54. Güven, M.; Karaca, O.B. Proteolysis levels of White cheeses salted and ripened in brines prepared from various salts. Int. J. Dairy Technol. 2001, 54, 29–33. [Google Scholar] [CrossRef]
  55. Cinbaş, T.; Kılıç, M. Proteolysis and lipolysis in White cheeses manufactured by two different production methods. Int. J. Food Sci. Technol. 2006, 41, 530–537. [Google Scholar] [CrossRef]
  56. Picon, A.; Gaya, P.; Medina, M.; Nunez, M. The effect of liposome-encapsulated bacillus subtilis neutral proteinase on Manchego cheese ripening. J. Dairy Sci. 1995, 78, 1238–1247. [Google Scholar] [CrossRef]
  57. Hayashi, K.; Revell, D.F.; Law, B.A. Effect of partially purified extracellular serine proteinases produced by Brevibacterium Linens on the accelerated ripening of Cheddar cheese. J. Dairy Sci. 1990, 73, 579–583. [Google Scholar] [CrossRef]
  58. Law, B.A.; Wigmore, A.S. Accelerated cheese ripening with food grade proteinases. J. Dairy Res. 1982, 49, 137–146. [Google Scholar] [CrossRef]
  59. Lin, J.C.C.; Jeon, I.J.; Roberts, H.A.; Milliken, G.A. Effect of commercial food grade enzymes on proteolysis and textural changes in granular Cheddar cheese. J. Food Sci. 1987, 52, 620–625. [Google Scholar] [CrossRef]
  60. Kandarakis, I.; Moatsou, G.; Georgala, A.I.K.; Kaminarides, S.; Anifantakis, E. Effect of draining temperature on the biochemical characteristics of Feta cheese. Food Chem. 2001, 72, 369–378. [Google Scholar] [CrossRef]
  61. Awad, S. Texture and flavour development in Ras cheese made from raw and pasteurised milk. Food Chem. 2006, 97, 394–400. [Google Scholar] [CrossRef]
  62. Skeie, S.; Feten, G.; Almøy, T.; Østlie, H.; Isaksson, T. The use of near infrared spectroscopy to predict selected free amino acids during cheese ripening. Int. Dairy J. 2006, 16, 236–242. [Google Scholar] [CrossRef]
  63. Diana, M.; Rafecas, M.; Arco, C.; Quilez, J. Free amino acid profile of Spanish artisanal cheeses: Importance of gamma-aminobutyric acid (GABA) and ornithine content. J. Food Compos. Anal. 2014, 35, 94–100. [Google Scholar] [CrossRef]
  64. Dinkçi, N. Mucor miehei’den Elde Edilen Lipaz (Piccantase A) Enziminin Beyaz Peynirin Olgunlaşmasında Kullanılması Üzerine Araştırmalar. Yüksek Lisans Tezi, Fen Bilimleri Enstitüsü, Ege Üniversitesi, İzmir, Turkey, 1999; 119p. [Google Scholar]
  65. Gambelli, L.; Belloni, P.; Ingrao, G.; Pizzoferrato, L.; Santaroni, G.P. Minerals and Trace Elements in Some Italian Dairy Products. J. Food Compos. Anal. 1999, 12, 27–35. [Google Scholar] [CrossRef]
Figure 1. Ripening indices trichloroacetic acid soluble nitrogen (TCA-SN/TN) of White cheeses during ripening.
Foods 07 00125 g001
Figure 2. (a) Total free amino acids (TFAA); and (b) Total free fatty acids (TFFA) contents of White cheeses during ripening.
Foods 07 00125 g002
Table 1. Composition of the raw cow milk and whey of White cheeses (n = 3).
PropertiesRaw Cow MilkWhey
C *P1P2L1L2
pH6.61 ± 0.015.63 ± 0.02 a5.62 ± 0.03 a5.62 ± 0.02 a5.67 ± 0.10 a5.69 ± 0.10 a
TA **6.69 ± 0.028.74 ± 0.12 a8.71 ± 0.08 a8.75 ± 0.09 a8.32 ± 0.81 a8.26 ± 0.67 a
DM ** (%)11.23 ± 0.106.52 ± 0.08 a6.55 ± 0.09 a6.64 ± 0.08 a6.56 ± 0.10 a6.64 ± 0.08 a
Fat (%)3.20 ± 0.000.25 ± 0.03 b0.30 ± 0.00 a0.30 ± 0.00 a0.26 ± 0.05 b0.30 ± 0.00 a
Protein (%)3.13 ± 0.020.91 ± 0.01 a0.91 ± 0.02 a0.90 ± 0.02 a0.91 ± 0.01 a0.91 ± 0.01 a
Lactose (%)4.37 ± 0.064.27 ± 0.21 a4.34 ± 0.28 a4.49 ± 0.14 a4.25 ± 0.13 a4.32 ± 0.10 a
a,b Means in the same row followed by different letters were significantly different (p < 0.05). * Cheeses: C: Control without enzymes; P1; 0.05 g 100 L−1 protease, Bacillus subtilis; P2: 0.10 g 100 L−1 protease, Bacillus subtilis; L1: 0.20 g 100 L−1 lipase, Mucor miehei; L2: 0.40 g 100 L−1 lipase, Mucor miehei. ** DM: Dry Matter; TA: Titratable acidity as °SH, Soxhelet Henkel Unit.
Table 2. Yield rates of White cheeses (n = 3).
C *P1P2L1L2
Yield (%)14.02 ± 0.31 a13.26 ± 0.32 b12.97 ± 0.22 b13.24 ± 0.63 b12.99 ± 0.42 b
Yield (%40)15.53 ± 0.36 a14.79 ± 0.14 ab14.20 ± 0.21 b14.49 ± 0.68 b14.33 ± 0.45 b
a,b Means in the same row followed by different letters were significantly different (p < 0.05). * Cheeses: C: Control without enzymes; P1; 0.05 g 100 L−1 protease, Bacillus subtilis; P2: 0.10 g 100 L−1 protease, Bacillus subtilis; L1: 0.20 g 100 L−1 lipase, Mucor miehei; L2: 0.40 g 100 L−1 lipase, Mucor miehei.
Table 3. Titratable acidity, penetrometer values and mean composition of experimental White cheeses during ripening (n = 3).
Day1306090
Dry matter (%)C *44.28 ± 0.101C a45.43 ± 0.498B b45.94 ± 0.635B a46.93 ± 0.257A a
P144.63 ± 0.666B a46.27 ± 0.342A ab46.75 ± 0.723A a47.19 ± 0.732A a
P243.80 ± 0.810B a46.90 ± 0.580A a46.49 ± 0.897A a47.48 ± 0.622A a
L143.76 ± 0.042C a45.42 ± 0.605B b47.21 ± 1.257A a45.62 ± 0.222B b
L244.12 ± 0.055B a46.69 ± 0.298A a46.26 ± 0.573A a46.71 ± 0.361A a
Fat (%)C22.00 ± 0.000C a22.92 ± 0.144BC a23.75 ± 0.661AB a24.08 ± 0.144A a
P122.58 ± 0.520B a23.33 ± 0.382B a24.58 ± 0.804A a24.67 ± 0.577A a
P221.50 ± 0.500Ca23.42 ± 0.382B a24.08 ± 0.629AB a24.83 ± 0.520A a
L121.83 ± 0.289B a22.83 ± 0.289AB a23.83 ± 0.764A a23.42 ± 0.382A a
L222.00 ± 0.000B a23.08 ± 0.144A a23.25 ± 0.250A a23.58 ± 0.382A a
Protein (%)C17.39 ± 0.280A a18.11 ± 0.604A b18.11 ± 0.436A a18.39 ± 0.111A ab
P117.32 ± 0.346B a18.35 ± 0.066A b18.19 ± 0.086A a18.11 ± 0.053A bc
P217.38 ± 0.108C a19.37 ± 0.217A a18.31 ± 0.065B a17.71 ± 0.456C c
L117.53 ± 0.260B a18.26 ± 0.120B b19.06 ± 0.702A a17.88 ± 0.188B bc
L217.42 ± 0.163C a19.23 ± 0.423A a18.34 ± 0.038B a18.70 ± 0.401AB a
Salt (%)C2.24 ± 0.025A b2.13 ± 0.066AB a1.87 ± 0.179BC ab1.67 ± 0.299C a
P12.15 ± 0.010A c1.94 ± 0.017AB c1.69 ± 0.144B b1.89 ± 0.221B a
P22.53 ± 0.047A a2.09 ± 0.100B ab1.65 ± 0.112C b1.96 ± 0.291B a
L11.79 ± 0.068BC e2.08 ± 0.012A ab1.74 ± 0.105C b1.95 ± 0.166AB a
L21.93 ± 0.050A d2.02 ± 0.032A bc2.08 ± 0.085A a2.06 ± 0.125A a
PV **C68.83 ± 0.289A a58.00 ± 5.196BC a61.67 ± 0.577B a63.00 ± 0.500AB c
P155.50 ± 0.866C d53.17 ± 0.289D bc58.67 ± 0.289B b63.83 ± 0.289A c
P258.83 ± 1.756B c49.17 ± 0.764C c58.17 ± 0.577B b68.33 ± 0.577A b
L160.00 ± 0.000B c54.00 ± 0.866D ab58.33 ± 1.527C b70.17 ± 0.289A a
L263.17 ± 0.289B b50.67 ± 0.764D bc59.33 ± 0.764C b70.17 ± 0.577A a
TA ** (LA%)C2.02 ± 0.035C a2.26 ± 0.040B a2.38 ± 0.097AB a2.51 ± 0.076A a
P12.06 ± 0.104C a2.23 ± 0.040BC a2.39 ± 0.147AB a2.52 ± 0.102A a
P22.02 ± 0.015C a2.24 ± 0.031B a2.28 ± 0.065B a2.41 ± 0.000A a
L12.03 ± 0.064D a2.30 ± 0.096BC a2.44 ± 0.006AB a2.47 ± 0.127A a
L22.05 ± 0.146B a2.34 ± 0.038A a2.40 ± 0.029A a2.46 ± 0.031A a
A,B,C,D Means in the same row followed by different letters were significantly different (p < 0.05); a,b,c,d,e Means in the same column followed by different letters significantly different (p < 0.05); * Cheeses: C: Control without enzymes; P1; 0.05 g 100 L−1 protease, Bacillus subtilis; P2: 0.10 g 100 L−1 protease, Bacillus subtilis; L1: 0.20 g 100 L−1 lipase, Mucor miehei; L2: 0.40 g 100 L−1 lipase, Mucor miehei. ** PV: Penetrometer value; TA: Titratable acidity expressed as grams of lactic acid per 100 grams of cheese.
Table 4. Nitrogen fractions of experimental White cheeses during ripening (n = 3).
Day115306090
WSN ** (%)C *0.193 ± 0.003E c0.268 ± 0.005D b0.306 ± 0.004C c0.362 ± 0.009B b0.428 ± 0.013A b
P10.216 ± 0.005E ab0.288 ± 0.003D a0.329 ± 0.004C b0.404 ± 0.005B a0.462 ± 0.003A a
P20.229 ± 0.009E a0.289 ± 0.012D a0.350 ± 0.011C a0.391 ± 0.015B a0.451 ± 0.014A a
L10.196 ± 0.011D c0.268 ± 0.001C b0.304 ± 0.018B c0.395 ± 0.006A a0.393 ± 0.010A c
L20.209 ± 0.014E bc0.272 ± 0.001D b0.335 ± 0.003C ab0.364 ± 0.017B b0.405 ± 0.001A c
TCA-SN (%)C0.154 ± 0.005E ab0.188 ± 0.013D a0.235 ± 0.003C bc0.269 ± 0.001B b0.306 ± 0.011A b
P10.156 ± 0.002E ab0.205 ± 0.009D a0.240 ± 0.005C bc0.295 ± 0.005B a0.339 ± 0.002A a
P20.164 ± 0.012E a0.202 ± 0.010D a0.255 ± 0.003C a0.293 ± 0.007B a0.323 ± 0.003A a
L10.141 ± 0.006D c0.184 ± 0.003C a0.227 ± 0.001B c0.299 ± 0.010A a0.294 ± 0.012A b
L20.151 ± 0.004D bc0.205 ± 0.012C a0.249 ± 0.017B ab0.267 ± 0.001B b0.306 ± 0.010A b
PTA-SN (%)C0.051 ± 0.001E a 0.054 ± 0.001D bc0.062 ± 0.001C a0.078 ± 0.002B bc0.083 ± 0.001A ab
P10.047 ± 0.001E b 0.054 ± 0.001D bc0.064 ± 0.004C a0.080 ± 0.002B ab0.086 ± 0.002A a
P20.044 ± 0.001D c0.058 ± 0.002C a0.060 ± 0.002C a0.076 ± 0.001B c0.086 ± 0.001A a
L10.042 ± 0.001D d 0.053 ± 0.001C cd0.056 ± 0.001B b0.081 ± 0.003A a0.080 ± 0.002A b
L20.046 ± 0.001C bc0.055 ± 0.001B b0.055 ± 0.001B b0.077 ± 0.002A c0.079 ± 0.004A b
CN (%)C2.53 ± 0.050A a 2.53 ± 0.021A a2.53 ± 0.098A b2.48 ± 0.061A a2.45 ± 0.023A ab
P12.50 ± 0.056A a 2.36 ± 0.020C c2.55 ± 0.012A b2.45 ± 0.015B a2.38 ± 0.010C bc
P22.49 ± 0.021B a 2.46 ± 0.036B ab2.69 ± 0.032A a2.48 ± 0.021B a2.33 ± 0.070C c
L12.55 ± 0.042A a 2.36 ± 0.010B c2.56 ± 0.035A b2.59 ± 0.110A a2.41 ± 0.030B bc
L22.52 ± 0.036B a 2.44 ± 0.087B bc2.68 ± 0.065A a2.51 ± 0.026B a2.53 ± 0.064B a
CN/TN (%)C92.92 ± 0.050A a90.42 ± 0.121B a89.22 ± 0.474C a87.25 ± 0.065D a85.14 ± 0.471E b
P192.06 ± 0.321A bc89.13 ± 0.191B c88.57 ± 0.115C a85.85 ± 0.220D c83.74 ± 0.128E c
P291.59 ± 0.356A c89.47 ± 0.472B bc88.49 ± 0.311C a86.39 ± 0.525D bc83.76 ± 0.616E c
L192.86 ± 0.411A a89.79 ± 0.040B b89.38 ± 0.642B a86.78 ± 0.447C ab85.97 ± 0.375D a
L292.34 ± 0.578A ab89.98 ± 0.341B ab88.87 ± 0.321C a87.33 ± 0.624D a86.19 ± 0.250E a
PPN (%)C0.038 ± 0.003C a0.081 ± 0.015B a0.071 ± 0.008B a0.094 ± 0.009B a0.123 ± 0.020A ab
P10.059 ± 0.003D a0.083 ± 0.006C a0.063 ± 0.006D a0.109 ± 0.006B a0.122 ± 0.002A ab
P20.065 ± 0.020C a0.088 ± 0.013BC a0.094 ± 0.009B a0.098 ± 0.017B a0.128 ± 0.010A a
L10.055 ± 0.010B a0.084 ± 0.004A a0.077 ± 0.019A a0.096 ± 0.009A a0.100 ± 0.014A b
L20.058 ± 0.015C a0.067 ± 0.011BC a0.087 ± 0.014AB a0.098 ± 0.016A a0.099 ± 0.009Ab
PPN/TN (%)C1.40 ± 0.123C a2.89 ± 0.530B a2.50 ± 0.325B a3.29 ± 0.235B a4.25 ± 0.709A ab
P12.19 ± 0.146D a3.13 ± 0.244C a2.20 ± 0.195D a3.82 ± 0.214B a4.30 ± 0.081A ab
P22.39 ± 0.760E a3.18 ± 0.447C a3.10 ± 0.271D a3.42 ± 0.621B a4.60 ± 0.392A a
L12.00 ± 0.351C a3.21 ± 0.139AB a2.70 ± 0.649BC a3.20 ± 0.190AB a3.56 ± 0.517A bc
L22.14 ± 0.594B a2.48 ± 0.437AB a2.88 ± 0.471AB a3.40 ± 0.572A a3.36 ± 0.368A c
A,B,C,D,E Means in the same row followed by different letters were significantly different (p < 0.05); a,b,c,d Means in the same column followed by different letters significantly different (p < 0.05); * Cheeses: C: Control without enzymes; P1; 0.05 g 100 L−1 protease, Bacillus subtilis; P2: 0.10 g 100 L−1 protease, Bacillus subtilis; L1: 0.20 g 100 L−1 lipase, Mucor miehei; L2: 0.40 g 100 L−1 lipase, Mucor miehei. ** WSN, water-soluble nitrogen; TCA-SN, 12% trichloroacetic acid-soluble nitrogen; PTA-SN, 5% phosphotungstic acid-soluble nitrogen; CN, Caseine nitrogen; PPN, proteose peptone nitrogen. WSN, TCA-SN or PTA-SN values were expressed as % of total nitrogen.
Table 5. Concentration of individual free amino acids (FAA) of Beyaz cheeses (n = 3) (mg 100 g−1).
Amino Acids30 Days90 Days
C *P1P2CP1P2
Alanine (Ala)59 ± 1 a60 ± 5 a72 ± 6 a70 ± 3 a76 ± 9 a75 ± 3 a
Glycine (Gly)38 ± 5 a37 ± 4 a44 ± 3 a42 ± 3 a42 ± 9 a42 ± 4 a
Valine (Val)137 ± 19 a128 ± 13 a143 ± 21 a150 ± 11 a182 ± 26 a176 ± 12 a
Leucine (Leu)224 ± 24 a219 ± 23 a250 ± 9 a245 ± 11 a282 ± 39 a271 ± 6 a
Isoleucine (Ile)116 ± 12 a98 ± 6 a108 ± 14 a 122 ± 6 a149 ± 25 a145 ± 1 a
Threonine (Thr)78 ± 9 a85 ± 6 a97 ± 6 a 89 ± 13 a102 ± 20 a95 ± 1 a
Serine (Ser)86 ± 17 a104 ± 8 a128 ± 12 a 112 ± 4 a107 ± 10 a110 ± 2 a
Proline (Pro)217 ± 19 b238 ± 9 a252 ± 26 a 234 ± 9 b269 ± 10 a273 ± 9 a
Aspartate (Asp)180 ± 40 a170 ± 6 a253 ± 29 b192 ± 13 b239 ± 49 b349 ± 28 a
Methionine (Met)29 ± 3 a29 ± 2 a25 ± 1 a29 ± 1 b51 ± 8 a55 ± 12 a
Glutamate (Glu)279 ± 11 b271 ± 22 b369 ± 32 a 327 ± 21 b369 ± 27 ab374 ± 28 a
Phenylalanine (Phe)118 ± 13 a130 ± 8 a133 ± 5 a140 ± 9 a153 ± 27 a151 ± 1 a
Lysine (Lys)141 ± 12 a142 ± 10 a169 ± 15 a152 ± 8 a152 ± 9 a162 ± 2 a
Histidine (His)41 ± 2 a45 ± 2 a44 ± 6 a 39 ± 0 c45 ± 2 b50 ± 2 a
Tyrosine (Tyr)101 ± 5 a100 ± 6 a107 ± 9 a104 ± 2 a111 ± 4 a115 ± 2 a
a,b,c: Average values in the same row and days with different letters are significantly different (p < 0.05). * Cheeses: C: Control without enzymes; P1; 0.05 g 100 L−1 protease, Bacillus subtilis; P2: 0.10 g 100 L−1 protease, Bacillus subtilis; L1: 0.20 g 100 L−1 lipase, Mucor miehei; L2: 0.40 g 100 L−1 lipase, Mucor miehei.
Table 6. Mineral contents (mg 100g−1) of experimental White cheeses during ripening (n = 3).
MineralDayC *P1P2L1L2
Ca30726 ± 01 ab687 ± 19 b699 ± 40 b723 ± 37 ab764 ± 17 a
90669 ± 16 bc646 ± 33 cd631 ± 13 d698 ± 10 ab718 ± 18 a
P30698 ± 11 a645 ± 09 a 677 ± 16 a706 ± 18 a713 ± 08 a
90671 ± 03 ab641 ± 05 c631 ± 12 bc646 ± 28 bc 704 ± 10 a
Na301968 ± 02 a1728 ± 26 b1933 ± 40 a1928 ± 89 a1665 ± 14 b
901860 ± 25 a1560 ± 36 d1724 ± 83 b1704 ± 30 bc1612 ± 61 cd
K30253 ± 05 ab253 ± 16 c231 ± 06 b233 ± 09 a226 ± 21 a
90188 ± 17 b161 ± 04 c183 ± 10 c173 ± 13 bc209 ± 15 a
Mg30210 ± 08 a211 ± 07 a204 ± 07 a209 ± 06 a209 ± 02 a
90179 ± 03 a179 ± 09 a175 ± 04 a185 ± 07 a189 ± 05 a
Zn304.63 ± 0.070 a4.02 ± 0.030 d4.43 ± 0.060 b4.09 ± 0.069 d4.33 ± 0.023 c
903.95 ± 0.040 a4.00 ± 0.047 a3.80 ± 0.072 b3.83 ± 0.017 b4.00 ± 0.055 a
Fe300.407 ± 0.038 a0.389 ± 0.017 a0.385 ± 0.011 a0.391 ± 0.002 a0.365 ± 0.028 a
900.379 ± 0.015 ab0.361 ± 0.017 b0.393 ± 0.009 a0.390 ± 0.015 a0.363 ± 0.004 b
Cu300.107 ± 0.011 a0.065 ± 0.005 b0.070 ± 0.009 b0.078 ± 0.014 b0.073 ± 0.001 b
900.110 ± 0.001 a0.067 ± 0.002 b0.069 ± 0.007 b0.071 ± 0.010 b0.069 ± 0.005 b
Mn300.058 ± 0.001 a0.056 ± 0.005 a0.055 ± 0.004 a0.055 ± 0.001 a0.057 ± 0.002 a
900.053 ± 0.006 a0.045 ± 0.002 a0.047 ± 0.000 a0.044 ± 0.004 a0.048 ± 0.001 a
a,b,c,d Means in the same row followed by different letters were significantly different (p < 0.05); * Cheeses: C: Control without enzymes; P1; 0.05 g 100 L−1 protease, Bacillus subtilis; P2: 0.10 g 100 L−1 protease, Bacillus subtilis; L1: 0.20 g 100 L−1 lipase, Mucor miehei; L2: 0.40 g 100 L−1 lipase, Mucor miehei.

