Detection, Purity Analysis, and Quality Assurance of Adulterated Peanut (Arachis hypogaea) Oils


Abstract
1. Introduction
2. Materials and Methods
2.1. Material and Supplies: Regression Analysis
2.2. Preparation of Adulterated HRPO Samples, FTIR Measurement, PLS Regression, and Multivariate Data Analysis
3. Results and Discussion
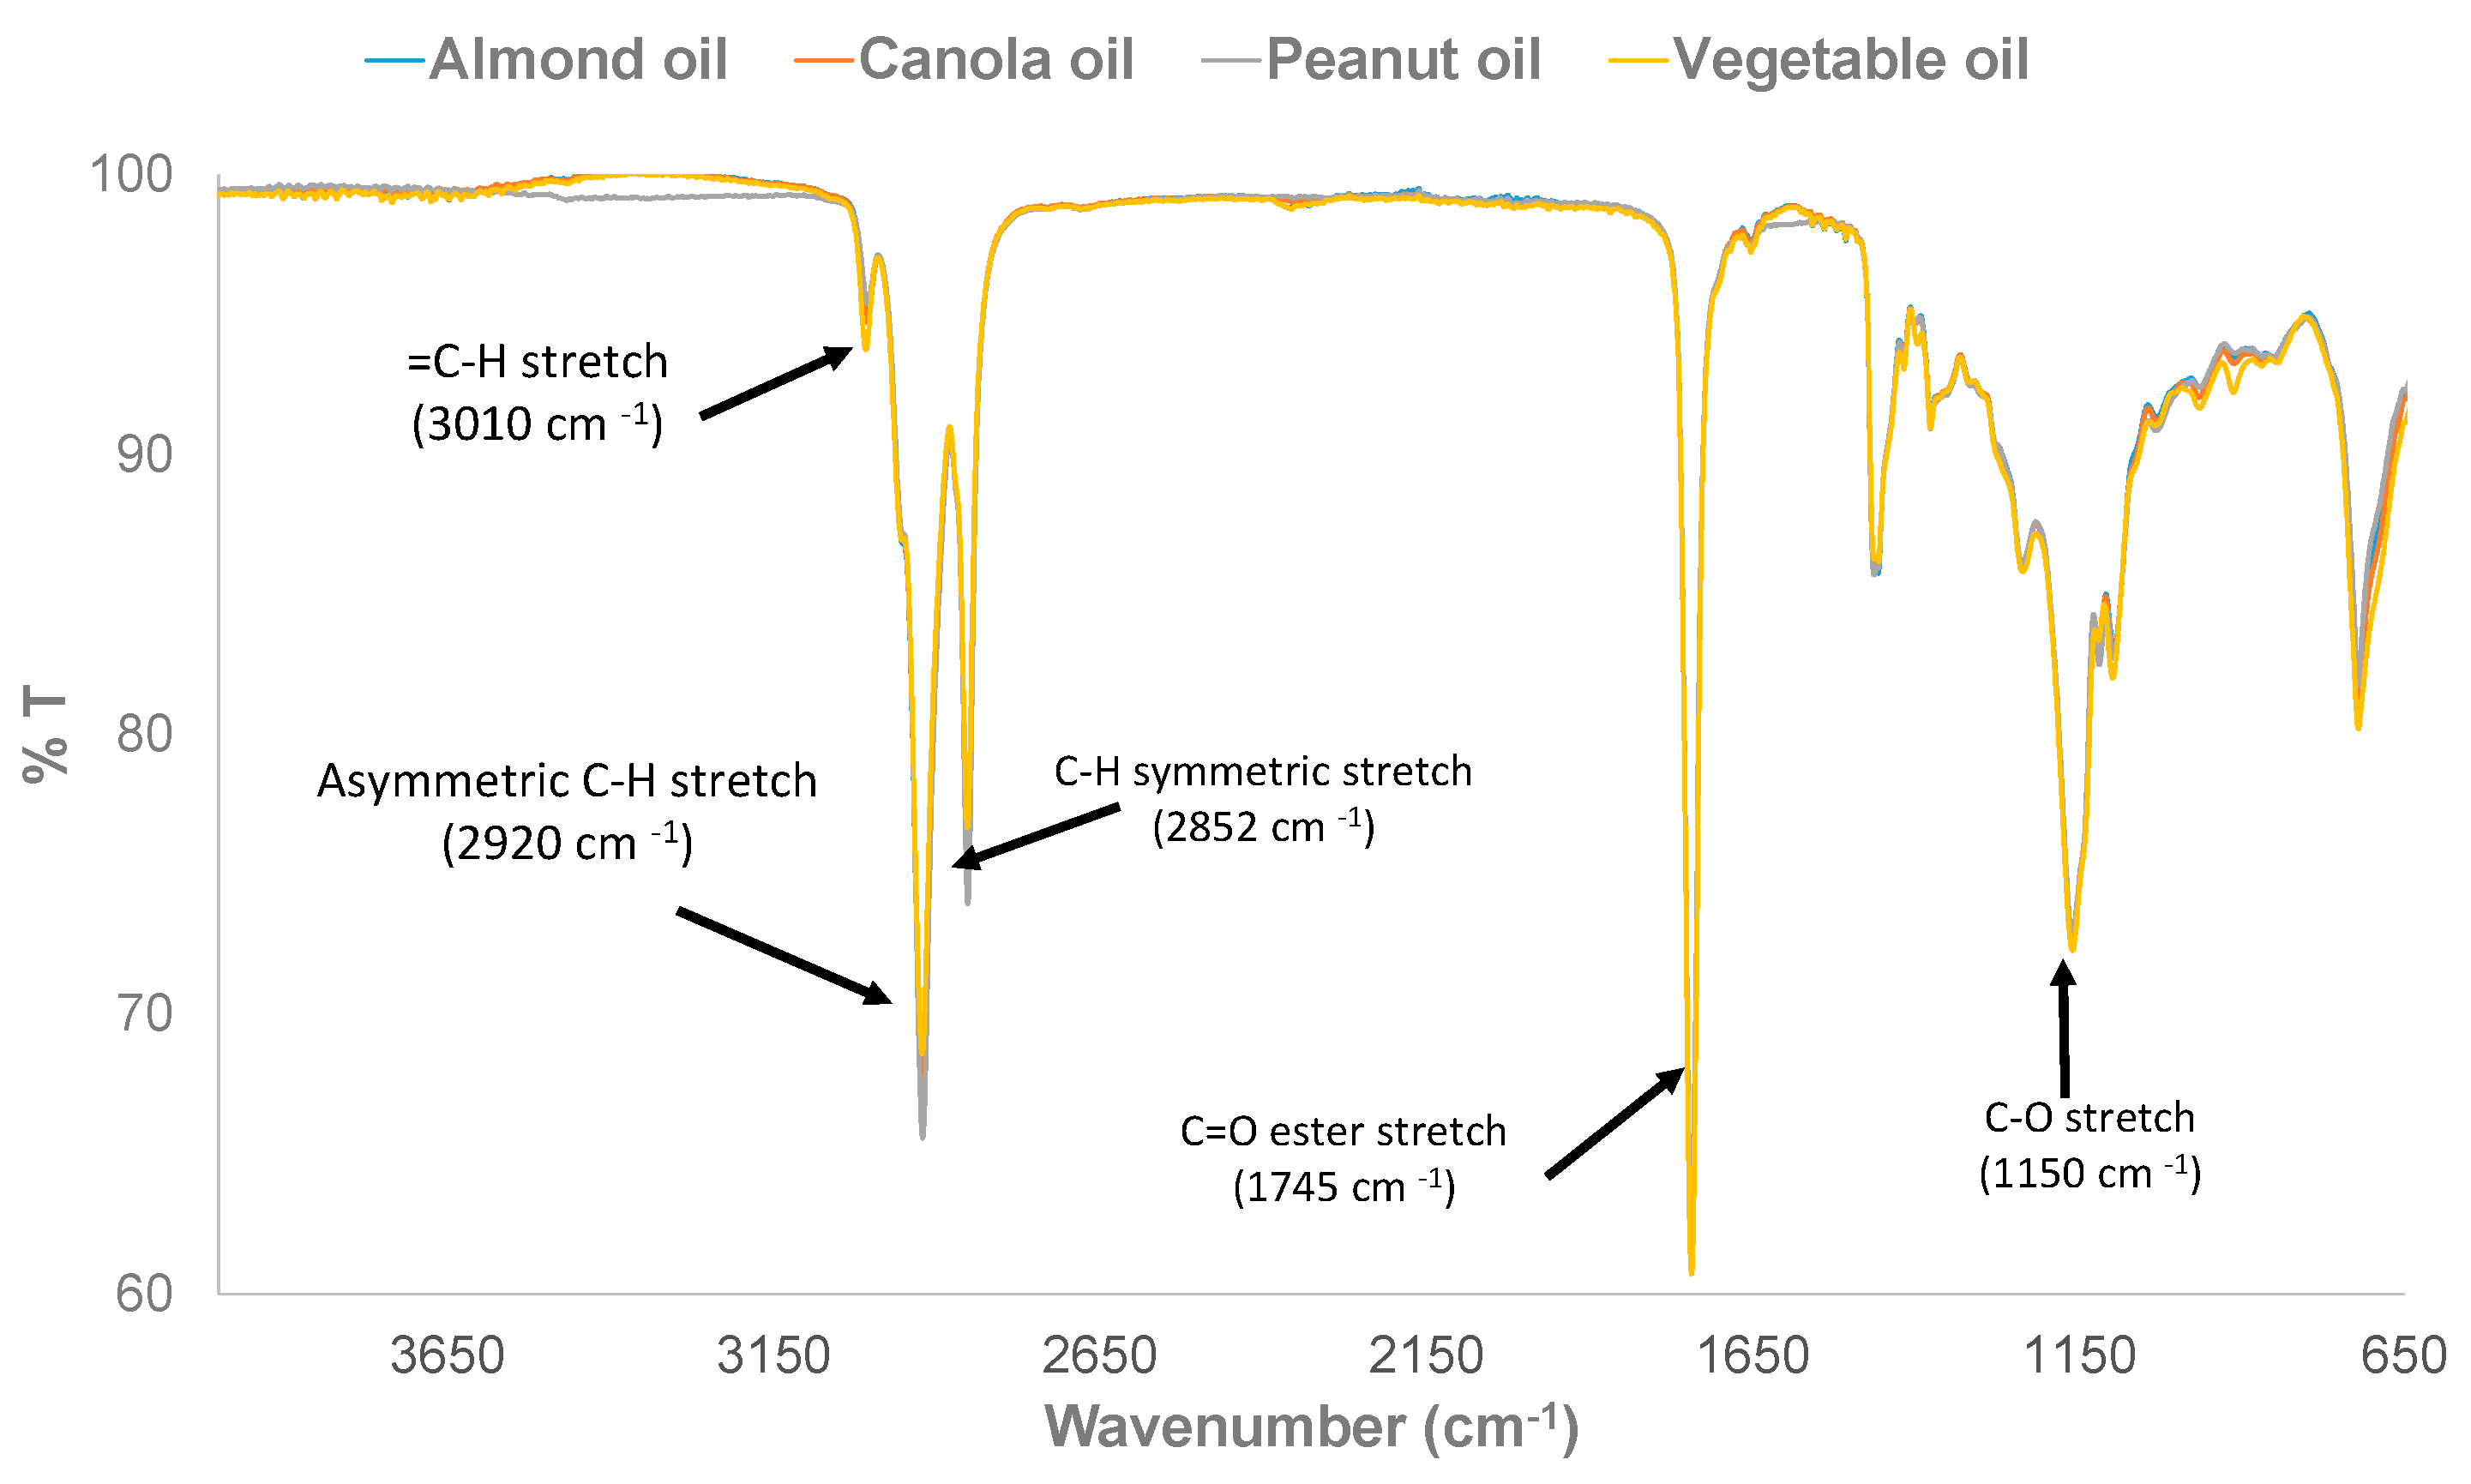
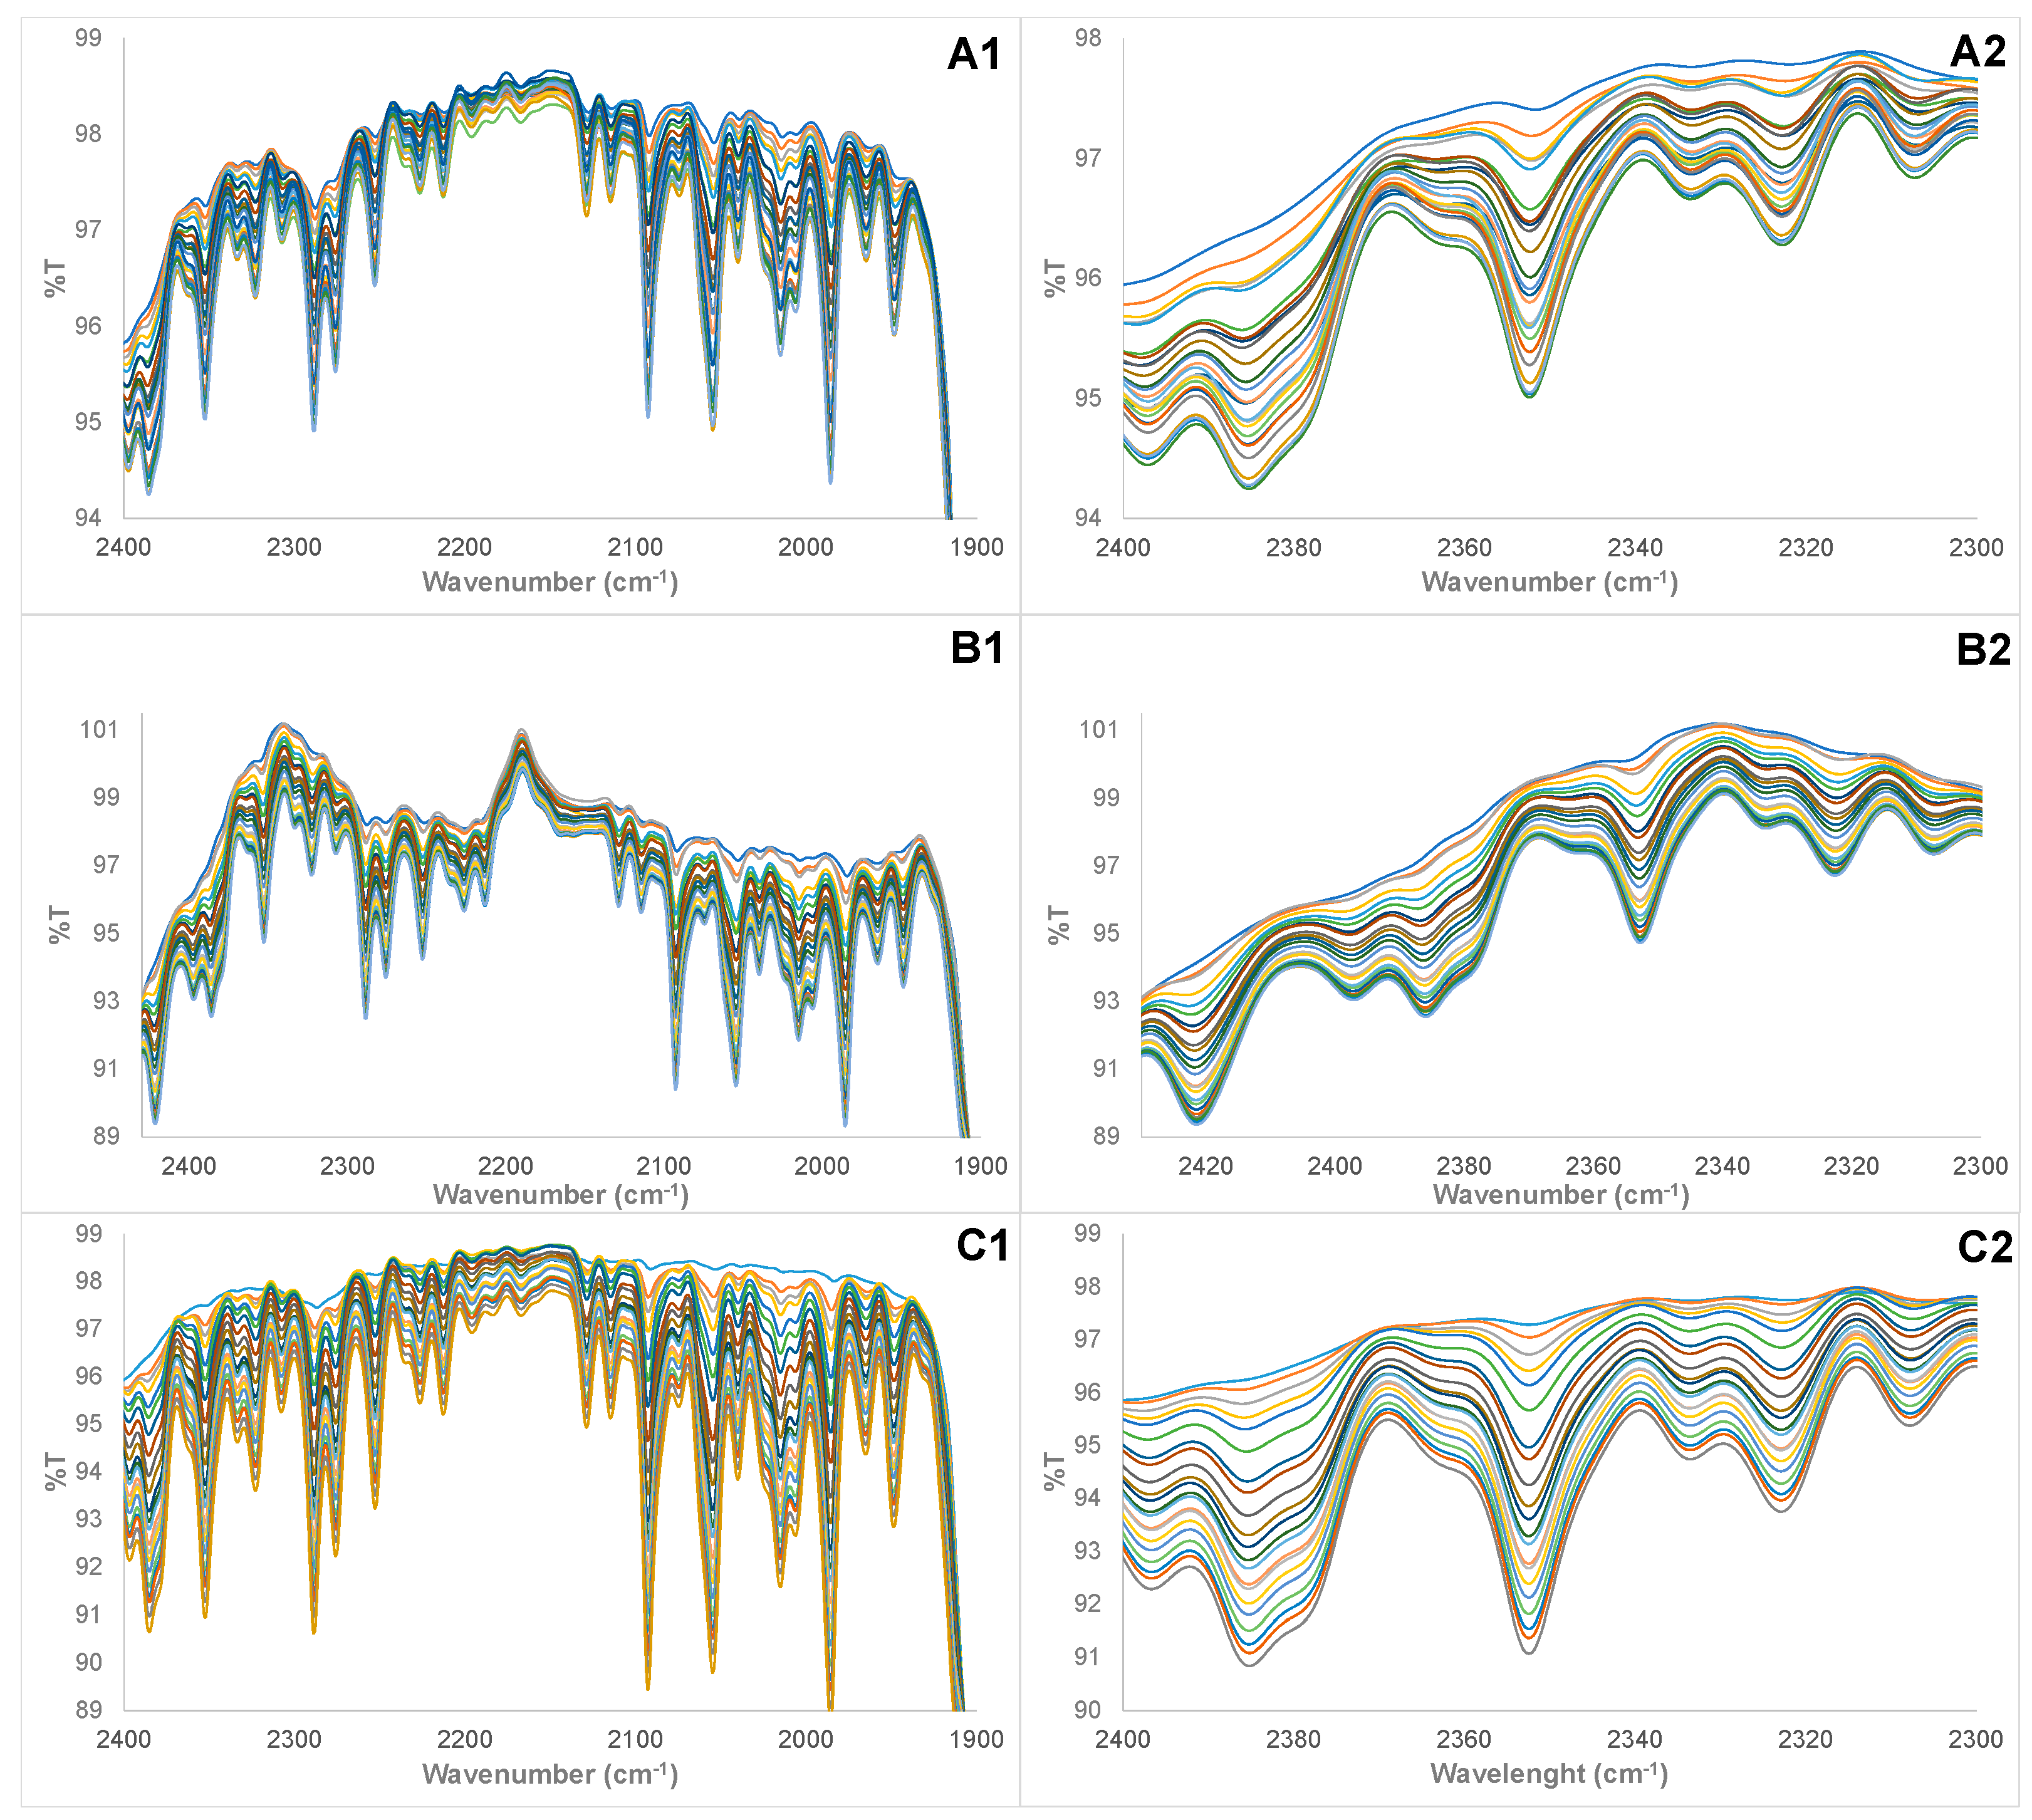
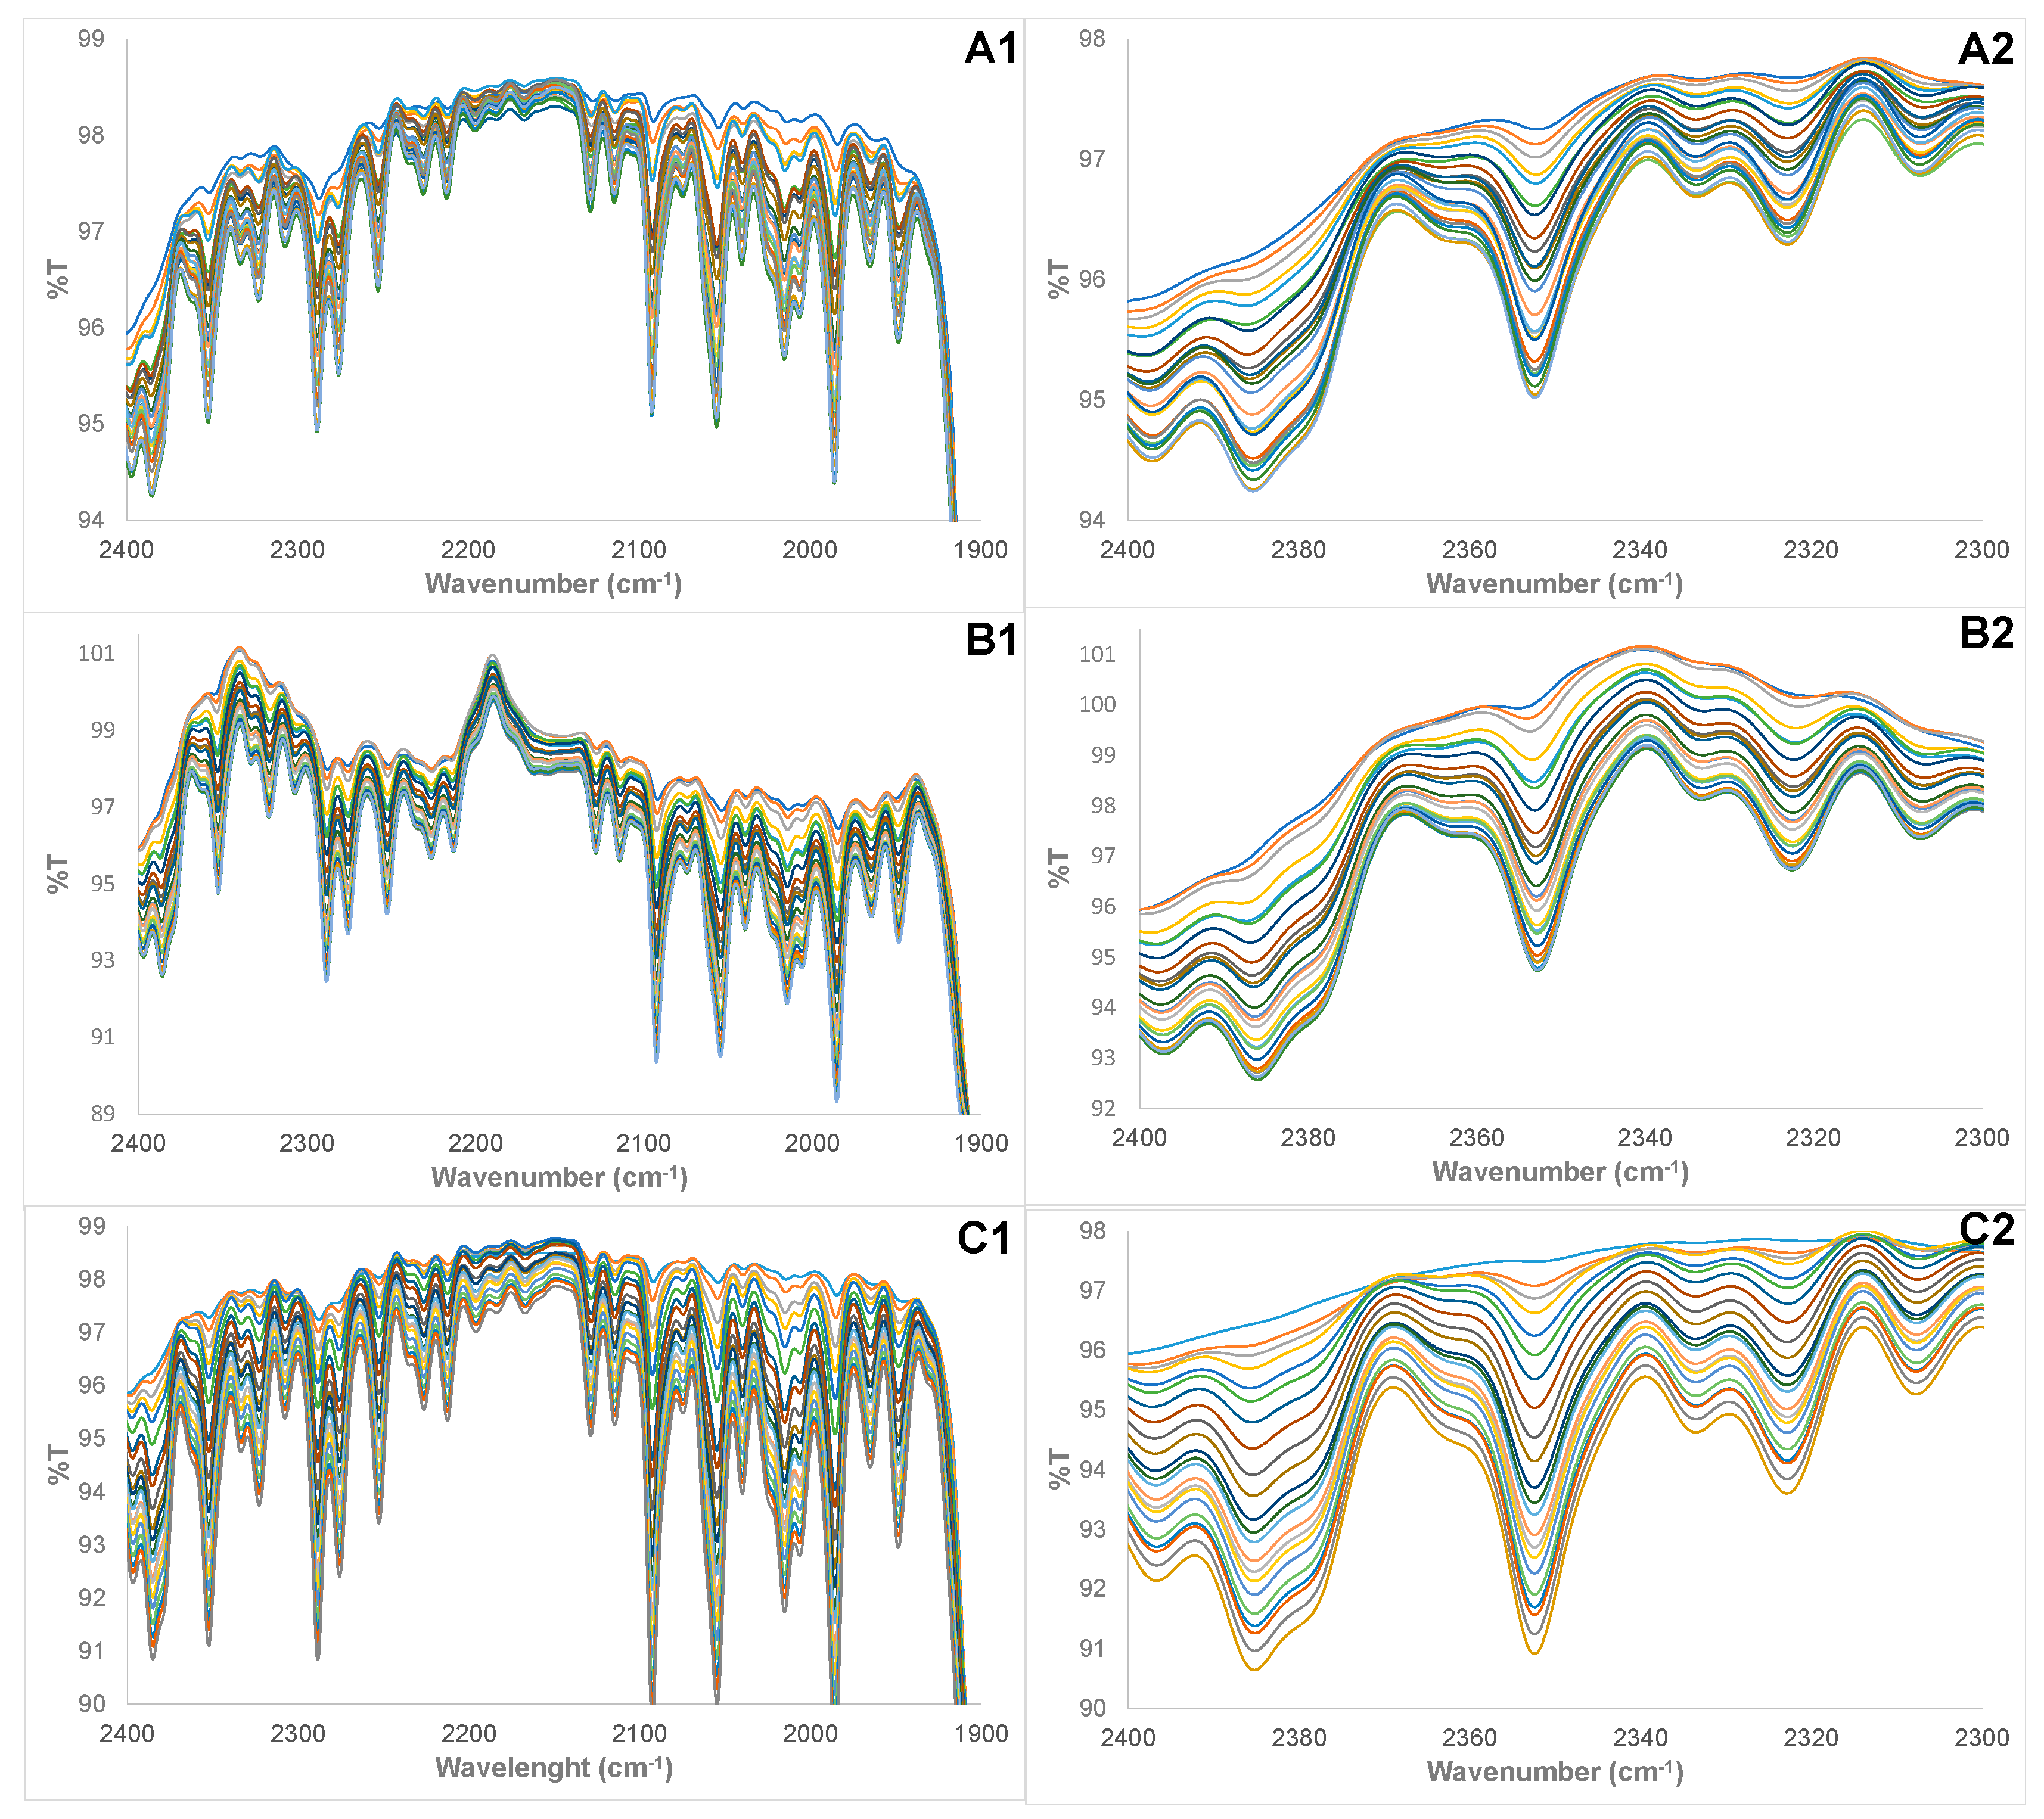
3.1. Physical Examination and FTIR Property of Pure and Adulterated HRPO Oils
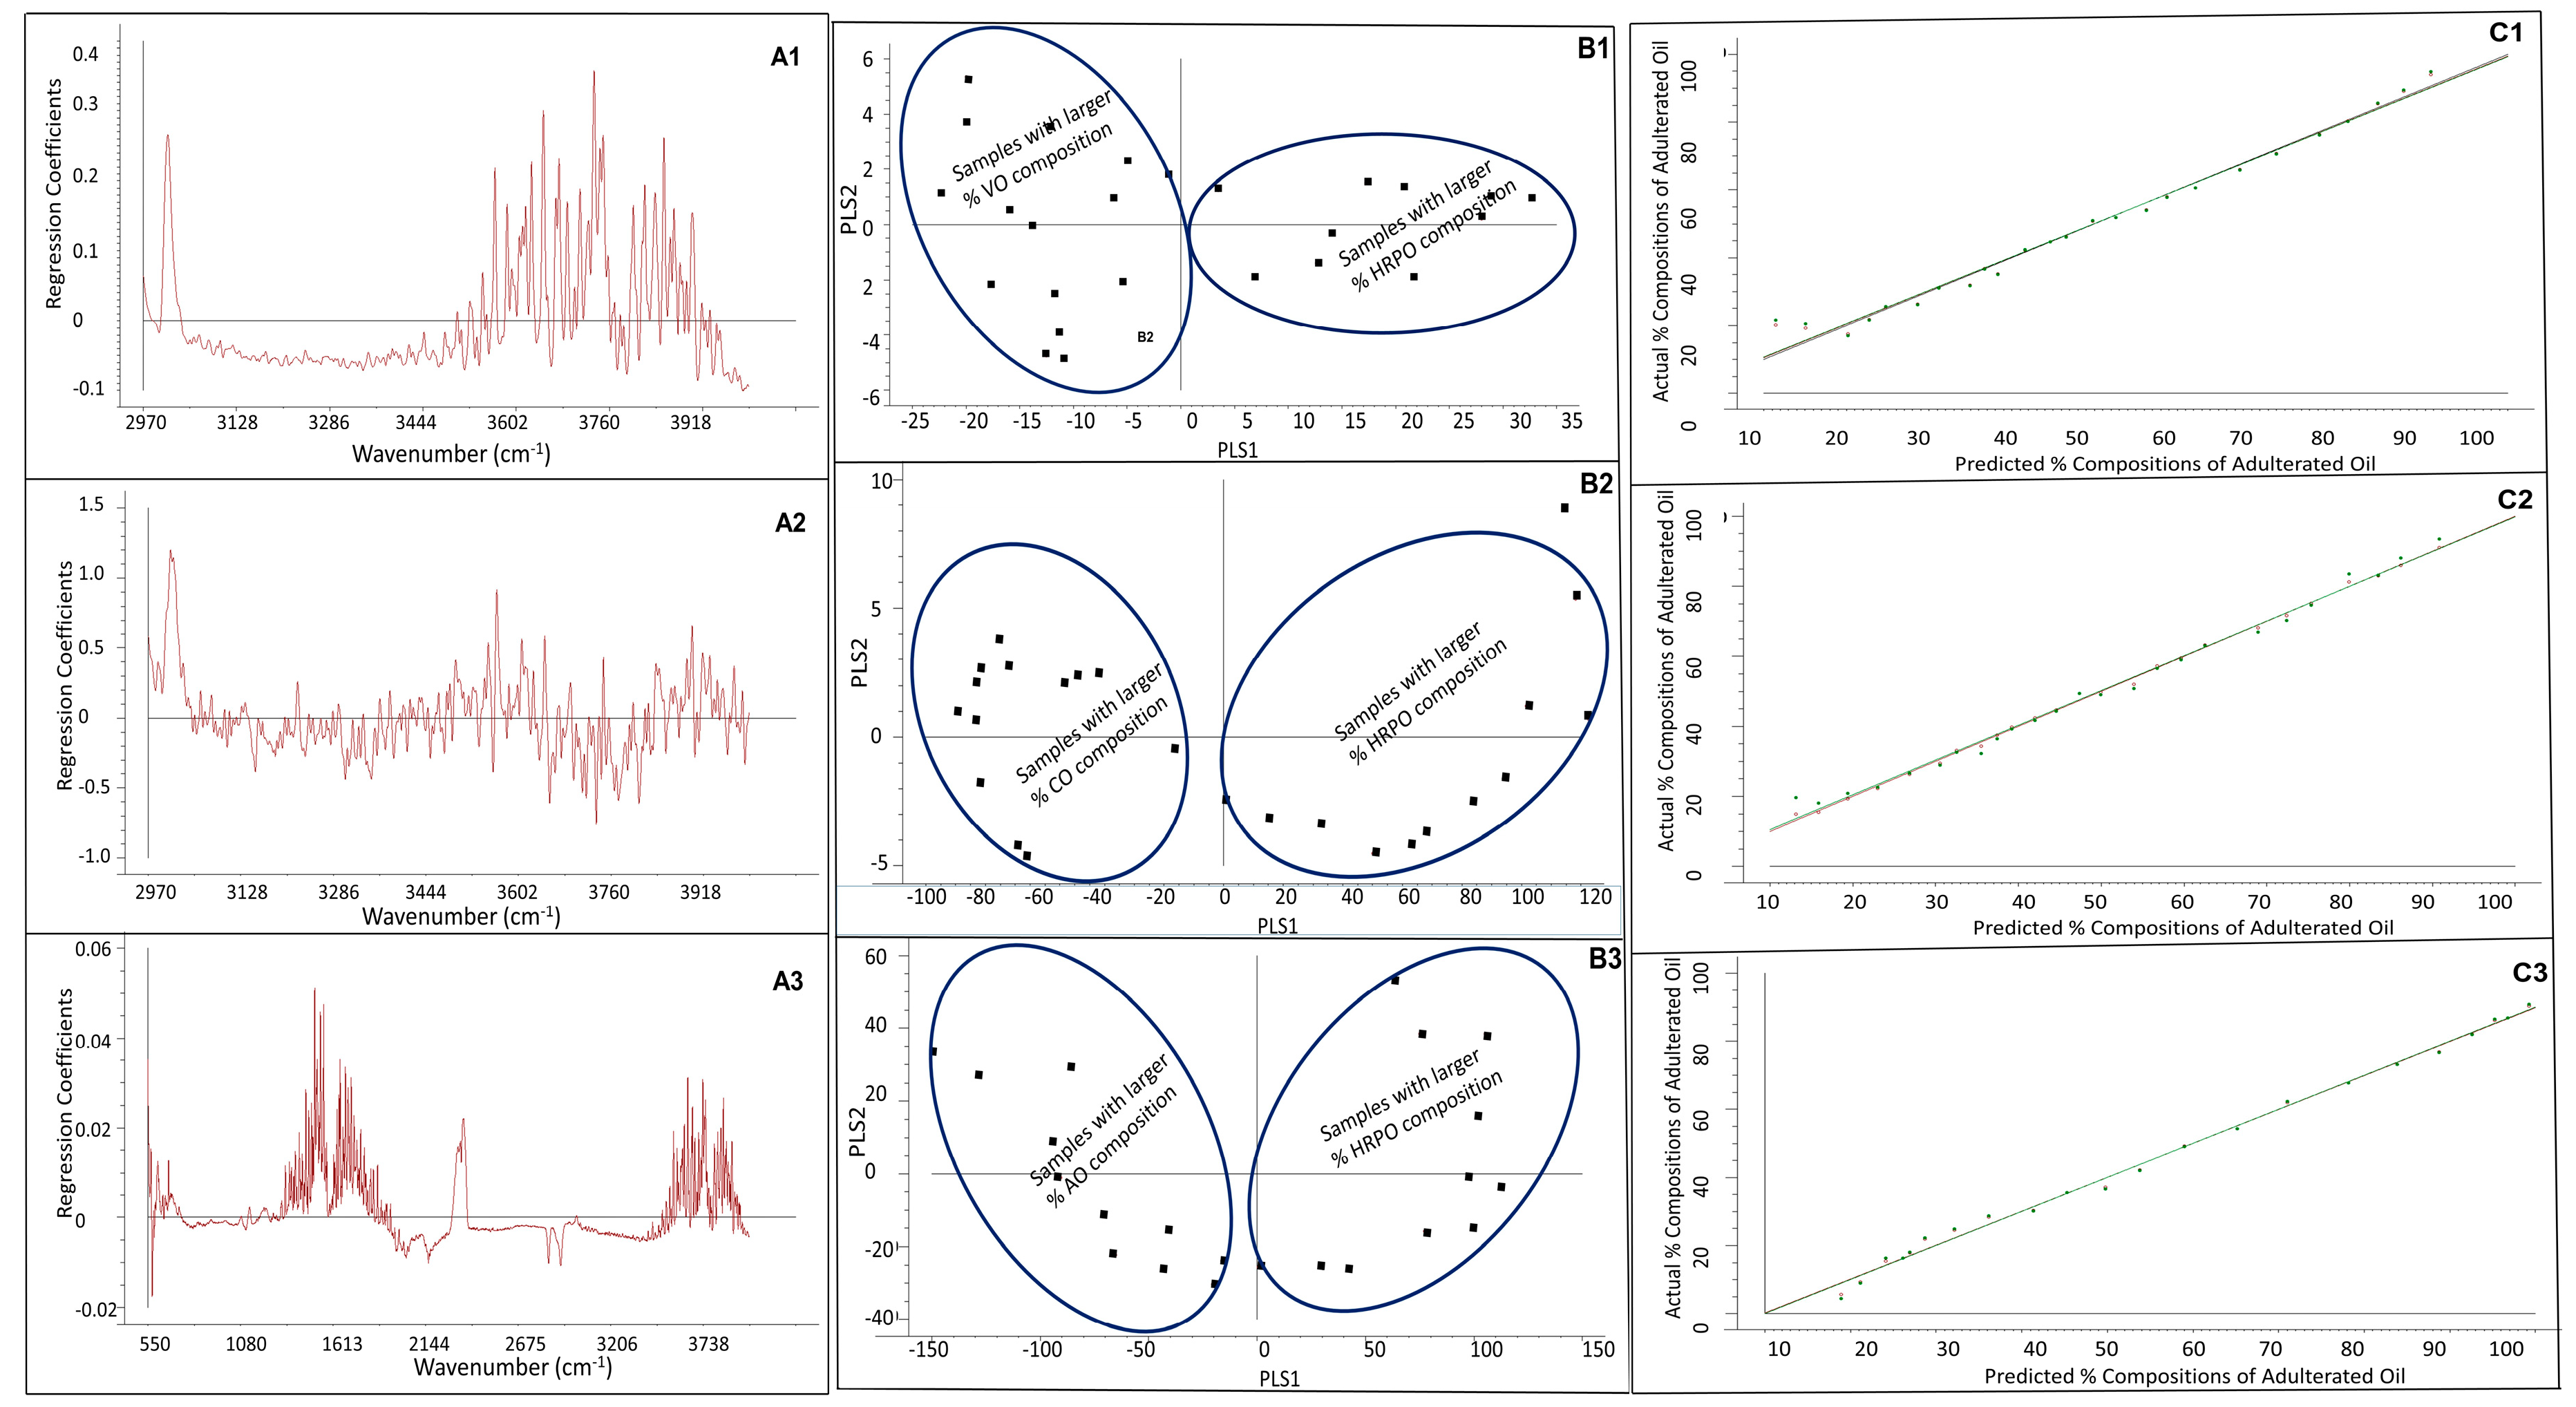
3.2. PLS Regression Modeling
3.3. Figures-of-Merit of PLS Regression Model, Limit-of-Detection (LOD), and Limit-of-Quantitation (LOQ)
3.4. Determination of Percentage Compositions of Adulterated HRPO Samples
4. Conclusions
Author Contributions
Funding
Acknowledgments
Conflicts of Interest
References
- O’Brien, R.D. Fats and Oils: Formulating and Processing for Applications; CRC Press: Boca Raton, FL, USA, 2004; pp. 1–147. [Google Scholar]
- Majchrzak, T.; Wojnowski, W.; Dymerski, T.; Gebicki, J.; Namies’nik, J. Electronic noses in classification and quality control of edible oils: A review. Food Chem. 2018, 246, 192–201. [Google Scholar] [CrossRef] [PubMed]
- Yang, Y.; Zhang, L.; Li, P.; Yu, L.; Mao, J.; Wang, X.; Zhang, Q. A review of chemical composition and nutritional properties of minor vegetable oils in China. Trends Food Sci. Technol. 2018, 74, 26–32. [Google Scholar] [CrossRef]
- Dorni, C.; Sharma, P.; Saikia, G.; Longvah, T. Fatty acid profile of edible oils and fats consumed in India. Food Chem. 2018, 238, 9–15. [Google Scholar] [CrossRef] [PubMed]
- Lutter, R. Addressing Challenges of Economically-Motivated Adulteration. Presented at Public Meeting on Economically Motivated Adulteration, College Park, MD, USA, 06 April. Fed. Regist. 2009, 74, 15497–15499. [Google Scholar]
- Everstine, K.; Spink, J.; Kennedy, S. Analysis of Food Fraud and Economically Motivated Adulteration incidents. J. Food Prot. 2013, 4, 560–735. [Google Scholar]
- Spink, J.; Moyer, D.C. Understanding and combating food fraud. Food Technol. 2013, 67, 30–35. [Google Scholar]
- European Commission. Commission Decision of 12 August 2002 implementing Council Directive 96/23/EC concerning the performance of analytical methods and the interpretation of results (2002/657/EC). Off. J. Eur. Commun. 2002, 221, 8–36. [Google Scholar]
- European Commission. Food Fraud. 2006. Available online: http://ec.europa.eu/food/safety/official_controls/food_fraud/index_en.htm (accessed on 4 June 2018).
- European Food Safety Authority. Regulation (EC) No 178/2002 of the European Parliament and of the Council of 28 January 2002 laying down the general principles and requirements of food law, establishing the European Food Safety Authority and laying down procedures in matters of food safety. Off. J. Eur. Commun. 2002, 31, 1–24. [Google Scholar]
- European Parliament. EP Report 2013/2091(INI). Report on the Food Crisis, Fraud in the Food Chain and the Control Thereof. European Parliament—Committee on the Environment, Public Health and Food Safety. 4 December 2013. Available online: http://www.europarl.europa.eu/sides/getDoc.do?pubRef=-//EP//TEXT+REPORT+A7-2013-0434+0+DOC+XML+V0//EN (accessed on 4 June 2018).
- Johnson, R. Food Fraud and “Economically Motivated Adulteration of Food and Food Ingredients”. Congressional Research Service: 10 January 2014. Available online: https://fas.org/sgp/crs/misc/R43358.pdf (accessed on 5 June 2018).
- Wheatley, V.; Spink, J. Defining the public health threat of dietary supplement fraud. Compr. Rev. Food Sci. Food Saf. 2013, 12, 599–613. [Google Scholar] [CrossRef]
- U.S. Pharmacopeial Convention. USP’s Food Fraud Database. Available online: https://www.foodfraud.org/ (accessed on 4 June 2018).
- Tavernise, S. The New York Times: FDA Set 2018 Deadline to Rid Foods of Trans Fats. Available online: https://www.nytimes.com/2015/06/17/health/fda-gives-food-industry-three-years-eliminate-trans-fats.html (accessed on 15 May 2018).
- Miele, M.M.; Anderson, S.L.; Blackburn, S.C.; Bradley, S.L.; Craft, D.L.; Flynn, C.J.; Fulton, T.J.; Rovnyak, D. NMR Characterization of Adulterants in Health Supplements. Chem. Educ. 2016, 21, 139–142. [Google Scholar]
- Parveen, I.; Gafner, S.; Techen, N.; Murch, S.J.; Khan, I.A. DNA barcoding for the identification of botanicals in herbal medicine and dietary supplements: Strengths and limitations. Planta Med. 2016, 82, 1225–1235. [Google Scholar] [CrossRef] [PubMed]
- Reid, L.M.; O’Donnell, C.P.; Downey, G. Recent technological advances for the determination of food authenticity. Trends Food Sci. Technol. 2006, 17, 344–353. [Google Scholar] [CrossRef]
- Wielogorska, E.; Chevallier, O.; Black, C.; Galvin-King, P.; Delêtre, M.; Kelleher, C.T.; Haughey, S.A.; Elliott, C.T. Development of a comprehensive analytical platform for the detection and quantitation of food fraud using a biomarker approach. The oregano adulteration case study. Food Chem. 2018, 239, 32–39. [Google Scholar] [CrossRef] [PubMed]
- Cornet, V.; Govaert, Y.; Moens, G.; Van Loco, J.; Degroodt, J.M. Development of a Fast Analytical Method for the Determination of Sudan Dyes in Chili- and Curry-Containing Foodstuffs by High-Performance Liquid Chromatography−Photodiode Array Detection. J. Agric. Food Chem. 2006, 54, 639–644. [Google Scholar] [CrossRef] [PubMed]
- Ruf, J.; Walter, P.; Kandler, H.; Kaufmann, A. Discovery and structural elucidation of the illegal azo dye Basic Red 46 in sumac spice. J. Food Addit. Contam. 2012, 29, 897–907. [Google Scholar] [CrossRef] [PubMed]
- Marieschi, M.; Torelli, A.; Beghé, D.; Bruni, R. Authentication of Punica granatum L.: Development of SCAR markers for the detection of 10 fruits potentially used in economically motivated adulteration. Food Chem. 2016, 202, 438–444. [Google Scholar] [CrossRef] [PubMed]
- Wang, S.; Guo, Q.; Wang, L.; Lin, L.; Shi, H.; Cao, H.; Cao, B. Detection of honey adulteration with starch syrup by high performance liquid chromatography. Food Chem. 2015, 172, 669–674. [Google Scholar] [CrossRef] [PubMed]
- Domingues, D.S.; Pauli, E.D.; de Abreu, J.E.M.; Massura, F.W.; Cristiano, V.; Santos, M.J.; Nixdorf, S.L. Detection of roasted and ground coffee adulteration by HPLC by amperometric and by post-column derivatization UV–Vis detection. Food Chem. 2014, 146, 353–362. [Google Scholar] [CrossRef] [PubMed]
- Apetrei, I.M.; Apetrei, C. Detection of virgin olive oil adulteration using a voltammetric e-tongue. Comput. Electron. Agric. 2014, 108, 148–154. [Google Scholar] [CrossRef]
- Ribeiro, R.O.R.; Mársico, E.T.; Carneiro, C.D.S.; Monteiro, M.L.G.; Conte Júnior, C.; de Jesus, E.F.O. Detection of honey adulteration of high fructose corn syrup by Low Field Nuclear Magnetic Resonance (LF 1H NMR). J. Food Eng. 2014, 135, 39–43. [Google Scholar] [CrossRef]
- Fang, G.; Goh, J.Y.; Tay, M.; Lau, H.F.; Li, S.F.Y. Characterization of oils and fats by 1H NMR and GC/MS fingerprinting: Classification, prediction and detection of adulteration. Food Chem. 2013, 138, 1461–1469. [Google Scholar] [CrossRef] [PubMed]
- Zhu, W.; Wang, X.; Chen, L. Rapid detection of peanut oil adulteration using low-field nuclear magnetic resonance and chemometrics. Food Chem. 2017, 216, 268–274. [Google Scholar] [CrossRef] [PubMed]
- Zhang, L.; Li, P.; Sun, X.; Wang, X.; Xu, B.; Wang, X.; Ding, X. Classification and adulteration detection of vegetable oils based on fatty acid profiles. J. Agric. Food Chem. 2014, 62, 8745–8751. [Google Scholar] [CrossRef] [PubMed]
- Guillen, M.D.; Cabo, N. Infrared Spectroscopy in the Study of Edible Oils and Fats. J. Sci. Food Agric. 1997, 75, 1–11. [Google Scholar] [CrossRef]
- Muik, B.; Lendl, B.; Molina-Diaz, A.; Valcarcel, M.; Ayora-Canada, M.J. Two-dimensional correlation spectroscopy and multivariate curve resolution for the study of lipid oxidation in edible oils monitored by FTIR and FT-Raman spectroscopy. Anal. Chim. Acta 2007, 593, 54–67. [Google Scholar] [CrossRef] [PubMed]
- Rodrigues Júnior, P.H.; de Sá Oliveira, K.; de Almeida, C.E.; De Oliveira, L.F.; Stephani, R.; Pinto Mda, S.; de Carvalho, A.F.; Perrone, Í.T. FT-Raman and chemometric tools for rapid determination of quality parameters in milk powder: Classification of samples for the presence of lactose and fraud detection byaddition of maltodextrin. Food Chem. 2016, 196, 584–588. [Google Scholar] [CrossRef] [PubMed]
- Ding, X.; Ni, Y.; Kokot, S. NIR spectroscopy and chemometrics for the discrimination of pure, powdered, purple sweet potatoes and their samples adulterated with the white sweet potato flour. Chemom. Intell. Lab. Syst. 2015, 144, 17–23. [Google Scholar] [CrossRef]
- Kurniawati, E.; Rohman, A.; Triyana, K. Analysis of lard in meatball broth using Fourier transform infrared spectroscopy and chemometrics. Meat Sci. 2014, 96, 94–98. [Google Scholar] [CrossRef] [PubMed]
- Li, B.; Wang, H.; Zhao, Q.; Ouyang, J.; Wu, Y. Rapid detection of authenticity and adulteration of walnut oil by FTIR and fluorescence spectroscopy: A comparative study. Food Chem. 2015, 181, 25–30. [Google Scholar] [CrossRef] [PubMed]
- De Sá Oliveira, K.; Callegaro, L.S.; Stephani, R.; Almeida, M.R.; Oliveira, L.F.C. Analysis of spreadable cheese by Raman spectroscopy and chemometric tools. Food Chem. 2016, 194, 441–446. [Google Scholar] [CrossRef] [PubMed]
- Nekvapil, F.; Brezestean, I.; Barchewitz, D.; Glamuzina, B.; Chiş, V.; Pinzaru, S.C. Citrus fruits freshness assessment using Raman spectroscopy. Food Chem. 2018, 242, 560–567. [Google Scholar] [CrossRef] [PubMed]
- Alvarenga Junior, B.R.; Soares, F.L.F.; Ardila, J.A.; Durango, L.G.C.; Forim, M.R.; Carneiro, R.L. Determination of B-complex vitamins in pharmaceutical formulations by surface-enhanced Raman spectroscopy. Spectrochim. Acta Mol. Biomol. Spectrosc. 2018, 188, 589–595. [Google Scholar] [CrossRef] [PubMed]
- Martin, C.; Bruneel, J.; Guyon, F.; Médina, B.; Jourdes, M.; Teissedre, P.; Guillaume, F. Raman spectroscopy of white wines. Food Chem. 2015, 181, 235–240. [Google Scholar] [CrossRef] [PubMed]
- Mandrile, A.M.; Giovannozzi, F.; Durbiano, G.; Martrab, A.M. Rossi. Rapid and sensitive detection of pyrimethanil residues on pome fruits by Surface Enhanced Raman Scattering. Food Chem. 2018, 244, 16–24. [Google Scholar] [CrossRef] [PubMed]
- Trebolazabala, J.; Maguregui, M.; Morillas, H.; Diego, A.; Madariaga, J.M. Portable Raman spectroscopy for an in-situ monitoring the ripening of tomato (Solanum lycopersicum) fruits. Spectrochim. Acta Mol. Biomol. Spectrosc. 2017, 180, 138–143. [Google Scholar] [CrossRef] [PubMed]
- Lipiäinen, I.; Fraser-Miller, S.J.; Gordon, K.C.; Strachan, C.J. Direct comparison of low- and mid-frequency Raman spectroscopy for quantitative solid-state pharmaceutical analysis. J. Pharm. Biomed. Anal. 2018, 149, 343–350. [Google Scholar] [CrossRef] [PubMed]
- Chen, D.; Xie, X.; Ao, H.; Liu, J.; Peng, C. Raman spectroscopy in quality control of Chinese herbal medicine. J. Chin. Med. Assoc. 2017, 80, 288–296. [Google Scholar] [CrossRef] [PubMed]
- Mandrile, L.; Amato, G.; Marchis, D.; Martra, G.; Rossi, A.M. Species-specific detection of processed animal proteins in feed by Raman Spectroscopy. Food Chem. 2017, 229, 268–275. [Google Scholar] [CrossRef] [PubMed]
- Nedeljkovic, A.; Tomasevic, I.; Miocinovic, J.; Pudja, P. Feasibility of discrimination of dairy creams and cream-like analogues using Raman spectroscopy and chemometric analysis. Food Chem. 2017, 232, 487–492. [Google Scholar] [CrossRef] [PubMed]
- Li, Y.; Fang, T.; Zhu, S.; Huang, F.; Chen, Z.; Wang, Y. Detection of olive oil adulteration with waste cooking oil via Raman spectroscopy combined with iPLS and SiPLS. Spectrochim. Acta Mol. Biomol. Spectrosc. 2018, 189, 37–43. [Google Scholar] [CrossRef] [PubMed]
- Gao, F.; Xu, L.; Zhang, Y.; Yang, Z.; Han, L.; Liu, X. Analytical Raman spectroscopic study for discriminant analysis of different animal-derived feedstuff: Understanding the hig Muik correlation between Raman spectroscopy and lipid characteristics. Food Chem. 2018, 240, 989–996. [Google Scholar] [CrossRef] [PubMed]
- Sebben, J.A.; Espindola, J.S.; Ranzan, L.; Moura, N.F.; Trierweiler, L.F.; Trierweiler, J.O. Development of a quantitative approach using Raman spectroscopy for carotenoids determination in processed sweet potato. Food Chem. 2018, 245, 1224–1231. [Google Scholar] [CrossRef] [PubMed]
- Feudjio, W.M.; Ghalila, H.; Nsangou, M.; Majdi, Y.; Kongbonga, Y.M. Fluorescence Spectroscopy Combined with Chemometrics for the Investigation of the Adulteration of Essential Oils. Food Anal. Method 2017, 10, 2539–2548. [Google Scholar] [CrossRef]
- Ellis, D.I.; Brewster, V.L.; Dunn, W.B.; Allwood, J.W.; Golovanov, A.P.; Goodacre, R. Fingerprinting food: Current technologies for the detection of food adulteration and contamination. Chem. Soc. Rev. 2012, 41, 5706–5727. [Google Scholar] [CrossRef] [PubMed]
- Elzey, B.; Pollard, D.; Fakayode, S.O. Determination of Adulterated of Neem Oil and Flaxseed Oil Compositions by FTIR Spectroscopy and Multivariate Regression Analysis. Food Control 2016, 68, 303–309. [Google Scholar] [CrossRef]
- Elzey, B.; Norman, V.; Stephenson, J.; Pollard, D.; Fakayode, S.O. Purity Analysis of Adulterated Essential Oils (Wintergreen, Tea Tree, Rosemary, and Lemon Eucalyptus Oil) by FTIR Spectroscopy and Partial-least-square Regression. Spectroscopy 2016, 31, 26–37. [Google Scholar]
- Carrín, M.E.; Carelli, A.A. Peanut oil: Compositional data. Eur. J. Lipid Sci. Technol. 2010, 112, 697–707. [Google Scholar] [CrossRef]
- Dorschel, C. Characterization of the TAG of peanut oil by electrospray LC-MS-MS. J. Am. Oil Chem. Soc. 2002, 79, 749–753. [Google Scholar] [CrossRef]
- List, G.R. Processing and Food Uses of Peanut Oil and Protein. In Peanut: Genetics, Processing, and Utilization; Academic Press and AOCS Press: Washington, IL, USA, 2016; pp. 405–428. [Google Scholar]
- Lusas, E.W. Food uses of peanut protein. J. Am. Oil Chem. Soc. 1979, 56, 425–430. [Google Scholar] [CrossRef] [PubMed]
- The Statistics Portal. Production Volume of Peanut Oil Worldwide from 2012/13 to 2017/18 (in Million Metric Tons). Available online: https://www.statista.com/statistics/613483/peanut-oil-production-volume-worldwide/ (accessed on 23 May 2018).
- Malinowski, E.R. Factor Analysis in Chemistry; Wiley: New York, NY, USA, 1991. [Google Scholar]
- Martens, H.; Naes, T. Multivariate Calibration; Wiley: New York, NY, USA, 1998. [Google Scholar]
- Adams, M.J. Chemometrics in Analytical Spectroscopy, 2nd ed.; Royal Society of Chemistry: Cambridge, MA, USA, 1995. [Google Scholar]
- Beebe, K.R.; Pell, R.J.; Seasholtz, M.B. Chemometrics: A Practical Guide; John Wiley Publishing: New York, NY, USA, 1998; p. 348. [Google Scholar]
- Otto, M. Pattern Recognition and Classification, in Chemometrics; John Wiley & Sons Publishing: New York, NY, USA, 2016; pp. 135–211. [Google Scholar]


| Wavenumber (cm−1) | Offset | Slope | R2 | LOD (%wt/wt) | LOQ (%wt/wt) | |
|---|---|---|---|---|---|---|
| HRPO-VO | 2235–3300 | 0.572672 | 0.988415 | 0.994191 | 0.27% | 0.90 |
| HRPO-CO | 2235–3300 | 0.075944 | 0.998477 | 0.999238 | 0.02% | 0.05 |
| HRPO-AO | 400–4000 | 0.154691 | 0.996644 | 0.998321 | 0.02% | 0.07 |
| Sample | % HRPO Predicted | Actual % HRPO | %RE | % VO Predicted | Actual % VO | %RE |
|---|---|---|---|---|---|---|
| V1 | 90.8 | 89.1 | −1.95 | 9.2 | 10.9 | 15.9 |
| V2 | 85.6 | 85.1 | −0.58 | 14.4 | 14.9 | 3.30 |
| V3 | 82.5 | 82.4 | −0.07 | 17.5 | 17.6 | 0.33 |
| V4 | 77.8 | 79.1 | 1.63 | 22.2 | 20.9 | −6.19 |
| V5 | 72.0 | 74.0 | 2.62 | 28.0 | 26.0 | −7.45 |
| V6 | 69.2 | 69.8 | 0.88 | 30.8 | 30.2 | −2.02 |
| V7 | 63.8 | 64.4 | 1.04 | 36.3 | 35.6 | −1.88 |
| V8 | 61.1 | 60.4 | −1.12 | 38.9 | 39.6 | 1.72 |
| V9 | 56.5 | 57.7 | 1.98 | 43.5 | 42.3 | −2.69 |
| V10 | 56.0 | 54.4 | −2.90 | 44.0 | 45.6 | 3.47 |
| V11 | 52.2 | 51.6 | −1.06 | 47.8 | 48.4 | 1.13 |
| V12 | 49.3 | 48.4 | −1.96 | 50.7 | 51.6 | 1.84 |
| V13 | 46.2 | 45.1 | −2.51 | 53.8 | 54.9 | 2.06 |
| V14 | 43.0 | 42.7 | −0.87 | 57.0 | 57.3 | 0.65 |
| V15 | 38.6 | 39.7 | 2.53 | 61.4 | 60.3 | −1.66 |
| V16 | 37.0 | 37.8 | 1.94 | 63.0 | 62.2 | −1.18 |
| V17 | 34.5 | 35.8 | 3.67 | 65.5 | 64.2 | −2.04 |
| V18 | 31.4 | 32.8 | 4.29 | 68.6 | 67.2 | −2.09 |
| V19 | 27.7 | 29.7 | 6.76 | 72.3 | 70.3 | −2.85 |
| V20 | 27.2 | 27.2 | −0.23 | 72.8 | 72.8 | 0.09 |
| V21 | 22.9 | 23.5 | 2.51 | 77.1 | 76.5 | −0.77 |
| V22 | 19.6 | 20.8 | 5.79 | 80.4 | 79.2 | −1.52 |
| RMS%RE | 2.77 | 4.37 | ||||
| Sample | % HPPO Predicted | Actual % HPPO | %RE | % CO Predicted | Actual % CO | %RE |
|---|---|---|---|---|---|---|
| V1 | 89.8 | 87.9 | −2.07 | 10.2 | 12.1 | 15.1 |
| V2 | 84.0 | 84.3 | 0.37 | 16.0 | 15.7 | −2.01 |
| V3 | 80.2 | 82.7 | 2.96 | 19.8 | 17.3 | −14.1 |
| V4 | 77.9 | 77.2 | −0.91 | 22.1 | 22.8 | 3.08 |
| V5 | 71.0 | 74.0 | 4.03 | 29.0 | 26.0 | −11.5 |
| V6 | 68.7 | 70.8 | 3.00 | 31.3 | 29.2 | −7.29 |
| V7 | 63.7 | 64.3 | 1.04 | 36.3 | 35.7 | −1.88 |
| V8 | 60.5 | 61.1 | 0.88 | 39.5 | 38.9 | −1.38 |
| V9 | 55.5 | 58.0 | 4.36 | 44.5 | 42.0 | −6.03 |
| V10 | 54.6 | 56.0 | 2.45 | 45.4 | 44.0 | −3.12 |
| V11 | 51.5 | 51.2 | −0.68 | 48.5 | 48.8 | 0.71 |
| V12 | 49.4 | 48.4 | −2.09 | 50.6 | 51.6 | 1.96 |
| V13 | 46.2 | 46.4 | 0.38 | 53.8 | 53.6 | −0.33 |
| V14 | 46.3 | 43.5 | −6.45 | 53.7 | 56.5 | 4.97 |
| V15 | 40.0 | 41.0 | 2.31 | 60.0 | 59.0 | −1.61 |
| V16 | 37.7 | 38.5 | 1.98 | 62.3 | 61.5 | −1.24 |
| V17 | 33.8 | 36.9 | 8.47 | 66.2 | 63.1 | −4.96 |
| V18 | 32.8 | 34.4 | 4.64 | 67.2 | 65.6 | −2.43 |
| V19 | 29.6 | 31.5 | 5.89 | 70.4 | 68.5 | −2.70 |
| V20 | 26.3 | 28.6 | 8.07 | 73.7 | 71.4 | −3.23 |
| V21 | 26.0 | 25.0 | −3.96 | 74.0 | 75.0 | 1.32 |
| V22 | 20.8 | 20.9 | 0.66 | 79.2 | 79.1 | −0.17 |
| RMS%RE | 5.51 | 5.87 |
| Sample | % HRPO Predicted | Actual % HRPO | %RE | % AO Predicted | Actual % AO | %RE |
|---|---|---|---|---|---|---|
| V1 | 89.6 | 88.3 | −1.50 | 10.4 | 11.7 | 11.3 |
| V2 | 85.7 | 85.9 | 0.24 | 14.3 | 14.1 | −1.44 |
| V3 | 82.3 | 83.7 | 1.66 | 17.7 | 16.3 | −8.54 |
| V4 | 77.9 | 79.8 | 2.45 | 22.1 | 20.2 | −9.71 |
| V5 | 76.0 | 76.7 | 0.89 | 24.0 | 23.3 | −2.92 |
| V6 | 70.3 | 71.4 | 1.51 | 29.7 | 28.6 | −3.76 |
| V7 | 62.1 | 64.9 | 4.25 | 37.9 | 35.1 | −7.85 |
| V8 | 58.4 | 58.7 | 0.43 | 41.6 | 41.3 | −0.62 |
| V9 | 51.3 | 51.8 | 0.99 | 48.7 | 48.2 | −1.06 |
| V10 | 46.3 | 44.4 | −4.17 | 53.7 | 55.6 | 3.33 |
| V11 | 39.8 | 42.5 | 6.47 | 60.2 | 57.5 | −4.79 |
| V12 | 37.3 | 36.9 | −0.97 | 62.7 | 63.1 | 0.57 |
| V13 | 34.1 | 33.0 | −3.56 | 65.9 | 67.0 | 1.75 |
| V14 | 28.1 | 29.4 | 4.22 | 71.9 | 70.6 | −1.75 |
| V15 | 28.1 | 23.2 | −20.77 | 71.9 | 76.8 | 6.29 |
| V16 | 23.5 | 20.9 | −12.34 | 76.5 | 79.1 | 3.27 |
| V17 | 21.2 | 17.7 | −19.46 | 78.8 | 82.3 | 4.19 |
| V18 | 16.8 | 16.3 | −3.13 | 83.2 | 83.7 | 0.61 |
| V19 | 14.2 | 14.7 | 3.42 | 85.8 | 85.3 | −0.59 |
| V20 | 11.5 | 12.3 | 6.51 | 88.5 | 87.7 | −0.91 |
| V21 | 8.3 | 10.0 | 17.42 | 91.7 | 90.0 | −1.95 |
| RMS%RE | 8.32 | 4.86 |
© 2018 by the authors. Licensee MDPI, Basel, Switzerland. This article is an open access article distributed under the terms and conditions of the Creative Commons Attribution (CC BY) license (http://creativecommons.org/licenses/by/4.0/).
Share and Cite
Smithson, S.C.; Fakayode, B.D.; Henderson, S.; Nguyen, J.; Fakayode, S.O. Detection, Purity Analysis, and Quality Assurance of Adulterated Peanut (Arachis hypogaea) Oils. Foods 2018, 7, 122. https://doi.org/10.3390/foods7080122
Smithson SC, Fakayode BD, Henderson S, Nguyen J, Fakayode SO. Detection, Purity Analysis, and Quality Assurance of Adulterated Peanut (Arachis hypogaea) Oils. Foods. 2018; 7(8):122. https://doi.org/10.3390/foods7080122
Chicago/Turabian StyleSmithson, Shayla C., Boluwatife D. Fakayode, Siera Henderson, John Nguyen, and Sayo O. Fakayode. 2018. "Detection, Purity Analysis, and Quality Assurance of Adulterated Peanut (Arachis hypogaea) Oils" Foods 7, no. 8: 122. https://doi.org/10.3390/foods7080122
APA StyleSmithson, S. C., Fakayode, B. D., Henderson, S., Nguyen, J., & Fakayode, S. O. (2018). Detection, Purity Analysis, and Quality Assurance of Adulterated Peanut (Arachis hypogaea) Oils. Foods, 7(8), 122. https://doi.org/10.3390/foods7080122