Article

Comparison of Growth Kinetics of Various Pathogenic E. coli on Fresh Perilla Leaf

Department of Food and Nutrition, 1 Hoeki-dong, Dongdaemun-gu, Kyung Hee University, Seoul 130-701, Korea
*
Author to whom correspondence should be addressed.
Foods 2013, 2(3), 364-373; https://doi.org/10.3390/foods2030364
Submission received: 20 May 2013 / Revised: 3 July 2013 / Accepted: 17 July 2013 / Published: 2 August 2013
(This article belongs to the Special Issue Food Microbiology and Safety)

Abstract

:
Growth kinetics for Escherichia coli O157:H7 in perilla leaves were compared to those of pathogenic E. coli strains, including enteropathogenic (EPEC), enterotoxigenic (ETEC), enteroinvasive (EIEC) and other enterohemorrhagic (EHEC) at 13, 17, 24, 30 and 36 °C. Models for lag time (LT), specific growth rate (SGR) and maximum population density (MPD) as a function of temperature were developed. The performance of the models was quantified using the ratio method and an acceptable prediction zone method. Significant differences in SGR and LT among the strains were observed at all temperatures. Overall, the shortest LT was observed with E. coli O157:H7, followed by EPEC, other EHEC, EIEC and ETEC, while the fastest growth rates were noted in EPEC, followed by E. coli O157:H7, ETEC, other EHEC and EIEC. The models for E. coli O157:H7 in perilla leaves was suitable for use in making predictions for EPEC and other EHEC strains.

1. Introduction

Enteric Escherichia coli have been classified on the basis of virulence properties, including enterohemorrhagic E. coli (EHEC), enterotoxigenic E. coli (ETEC), enteropathogenic E. coli (EPEC), enteroadherent E. coli (EAEC) and enteroinvasive E. coli (EIEC) [1]. Among them, enterohemorrhagic E. coli O157:H7 are responsible for numerous outbreaks associated with the consumption of fresh produce in many parts of the world. From 1995 to 2006, a total of 22 outbreaks in California were directly associated with E. coli O157:H7 contaminated fresh lettuce or spinach [2]. Recently, an outbreak of the virulent strain of E. coli O104:H4 in vegetable sprouts grown in an organic farm has killed 35 and sickened 3256 in Germany [3]. From 2006 to 2012, 233 (12.5%) outbreaks in Korea were also due to pathogenic E. coli, out of 1871 foodborne disease outbreaks reported [4]. According to a recent epidemiological analysis regarding pathogenic E. coli outbreaks [5], the EPEC (44.7%) strain was reported as the primary cause of outbreak associated with E. coli in Korea, followed by ETEC (34.2%), EAEC (10.5%) and EHEC (9.2%).
Consumption of fresh vegetables contaminated with E. coli O157:H7 poses a serious risk to humans, as epidemiological studies showed that an infectious dose may be as low as 10 cells [6]. Perilla leaf is one of the most widely consumed raw or pickled leaf vegetables in Korea and is easily contaminated with various pathogens [7]. The results of microbiological hazard analysis on fresh vegetables indicate that E. coli was detected in 33% to 53% of perilla leaves at the contamination level of 1.18~3.45 log CFU/g [8]. Jung et al. [9] compared the contamination level of E. coli in fresh produce in Korea and observed that the highest contamination level of E. coli among the tested produce was detected in perilla leaves (35.0%), which is a widely consumed fresh produce in Korea. Park et al. [10] also reported a higher frequency of outbreaks of foodborne illness related to perilla leaves.
Predictive models can be used to assess the impact of food handling and storage conditions on pathogen levels in food and the risk to public health [11]. Various models that predict the growth of E. coli O157:H7 have been developed in broth and foods [12,13,14,15,16,17]. Although fresh produce has been identified as a vehicle for foodborne illness caused by E. coli O157:H7 contamination, a few predictive models for the growth of E. coli O157:H7 on iceberg lettuce [18] and minimally processed leafy green vegetables have been reported [19].
In the present study, a predictive model for growth of E. coli O157:H7 in perilla leaves was developed and then evaluated for its prediction of growth with four pathogenic E. coli strains, including EPEC, ETEC, EIEC and other EHEC. The purpose of this study was to determine whether or not the growth model developed with E. coli O157:H7 in perilla leaves can be used for growth prediction of other pathogenic E. coli.

2. Experimental Section

2.1. Bacterial Strains

Enteropathogenic E. coli (EPEC: NCCP 13715), enterotoxigenic E. coli (ETEC: NCCP 13717 and 13718), enteroinvasive E. coli (EIEC: NCCP 13719) and other enterohemorrhagic E. coli (EHEC: NCCP 13720 and 13721) were obtained from the Korean Food Drug Administration (KFDA) and were maintained in tryptic soy broth (TSB, Difco, Sparks, MD, USA) that contained 20% glycerol (Sigma-Aldrich, St. Louis, MO, USA) at −80 °C. Ten microliters (10 μL) of thawed stock culture was inoculated into a 50 mL Erlenmeyer flask containing 10 mL of TSB, which was then sealed [19] with a silicone cap and incubated at 36 °C for 24 h on a rotary shaker (VS-8480SR, Vision, Korea) at 140 rpm. Viable cell counts ranged from 8.5–9.5 log CFU/mL after incubation.

2.2. Inoculation of Strain in Perilla Leaves

Perilla leaves were washed twice with running tap water and then rinsed with distilled water for 1 min. The rinsed perilla leaves were submerged in a solution of 3.6% hydrogen peroxide for 5 min to remove background microorganisms, rinsed with distilled water and cleaned with sterilized distilled water [10]. The sanitized perilla leaves were air-dried in a bio-safety cabinet at room temperature for about 1 h before inoculation. The sanitized perilla leaves were then immersed for 3 min in inoculum solution (2 L), which was prepared by transferring l mL of pathogenic E. coli O157:H7 strains or other pathogenic E. coli strains into 2 L of sterile distilled water. Each sample was air-dried in a bio-safety cabinet at room temperature for 1 h, and 5 g of inoculated perilla leaves were aseptically packed into sterile bags and stored at 13, 17, 24, 30 or 36 °C. Each sample was homogenized (Stomacher, Interscience, Paris, France) for 2 min in 40 mL of 0.1% sterilized peptone water. One milliliter (1 mL) of homogenized sample was diluted in 9 mL of 0.1% sterilized peptone water. One hundred microliter (100 μL) aliquots of two dilutions of each sample were plated on eosin methylene blue agar (EMB: Difco, Sparks, MD, USA) in duplicate and incubated aerobically at 36 °C for 24 h. The colonies on duplicate plates of each sample were counted and, then, converted to log numbers. Experiments were replicated twice for each strain and storage temperature.

2.3. Primary Modeling

Viable counts (log CFU per g) of E. coli O157:H7 and other pathogenic E. coli were graphed as a function of time and, then, iteratively fitted to the modified Gompertz model using GraphPad PRISM V4.0 (GraphPad Software, San Diego, CA, USA) to determine the lag time (LT), specific growth rate (SGR) and maximum population density (MPD). The model used was as follows:
Y0 = N0 + C × exp{−exp[(2.718 × SGR/C) × (LT − t) + 1]}
where Y0 is the viable cell count (log CFU per g) at time t (h), N0 is the initial log number of cells, C is the difference between the initial and final cell numbers, SGR is the maximum specific growth rate (log CFU per h), LT is the lag time before growth and t is the incubation time. The goodness-of-fit of the data was evaluated based on the coefficient of determination (R2), which was provided by GraphPad PRISM.

2.4. Secondary Modeling

LT, SGR and MPD values were graphed as a function of temperature and then fitted to the Davey, square root and polynomial models, respectively. The Davey model used was as follows [20,21]:
Y = a + (b/T) + (c/T2)
where Y is LT (h), a, b and c are regression coefficients without biological meaning and T is temperature.
The square-root model used was as follows [22] :
Foods 02 00364 i001
where Y is SGR (log CFU/ h), b is a regression coefficient, T is temperature (°C) and Tmin is the cardinal minimum growth temperature.
The second order polynomial model used was as follows [23]:
Y = a + b × T + c × T2
where Y is MPD (log CFU) and a, b and c are regression coefficients without biological meaning.

2.5. Performance Evaluation of Perilla Leaves Model

Different pathogenic E. coli strains, including EPEC, ETEC, EIEC and other EHEC, were used for performance evaluation of E. coli O157:H7 models for perilla leaves. The performance of the models was quantified using the ratio method described by Ross [24] and an acceptable prediction zone method [25]. Prediction bias (Bf) and accuracy (Af) factors were calculated using the following equations [26]:
Bf for LT = 10∑log(predicted/observed)/n
Af for LT = 10∑|log(predicted/observed)|/n
Bf for SGR = 10∑log(observed/predicted)/n
Af for SGR = 10∑|log(observed/predicted)|/n
where n is the number of prediction cases used in the calculation. Different ratios were used for LT and SGR, so that Bf less than 1 would represent fail-safe predictions and Bf and Af above 1 would represent fail-dangerous predictions [26]. In addition, relative errors (RE) of individual prediction cases were calculated using the following equations [27]:
RE for LT (%) = [(predicted − observed)/predicted] × 100
RE for SGR or MPD (%) = [(observed − predicted)/predicted] × 100
where RE less than zero represented fail-safe predictions and RE above zero represented fail-dangerous predictions. The median relative error (MRE) and the mean absolute relative error (MARE) were also used to measure the prediction bias and accuracy of the model, respectively.
In the acceptable prediction zone method for LT, SGR and MPD, the percentage of RE (%RE) that is in an acceptable prediction zone (i.e., the ratio of the number of RE in the acceptable prediction zone to the total number of prediction cases) from −30% (fail-safe) to 15% (fail-dangerous) was calculated and used also as a measure of model performance [25,26].

2.6. Statistical Analysis

The values of LT, SGR and MPD were also analyzed by analysis of variance, and the means were separated using Duncan’s multiple range test at p < 0.05 using the Statistical Analysis Systems (SAS) V 9.1 (SAS Institute Inc., Cary, NC, USA).

3. Results and Discussion

3.1. Development of Growth Model for E. coli O157:H7 in Perilla Leaves

Perilla leaves was used as a substrate to develop a growth model of E. coli O157:H7 (NCTC 12079) as a function of time and temperature. Although the growth of E. coli O157:H7 in TSB was observed at 7 and 10 °C (data not shown), the growth of E. coli O157:H7 in perilla leaves was not observed under 12 °C. Therefore, growth kinetics for E. coli O157:H7 in perilla leaves was compared at 13, 17, 24, 30 and 36 °C. Especially, the MPD of E. coli O157:H7 in perilla leaves was significantly decreased at 13 and 17 °C. The LT, SGR and MPD secondary models for perilla leaves as a function of temperature were also developed using the Davey, square-root and polynomial models, respectively (Table 1). Park et al. [10] observed growth of L. monocytogenes in perilla leaves at only 24 °C, and LT and SGR of L. monocytogenes in perilla leaves was 7.92 h and 0.028 log CFU/h, respectively. On the other hand, shorter LT (5.52 h) and faster SGR (0.207 log CFU/h) were observed at 24 °C with E. coli O157:H7 in the current study. This indicates that the growth of E. coli O157:H7 in perilla leaves is faster than that of L. monocytogenes at 24 °C.
Table 1. Lag time, SGR and MPD of E. coli O157:H7 in perilla leaves and developed secondary models.
Parameter13 °C17 °C24 °C30 °C36 °CSecondary model equation
MeanSEMeanSEMeanSEMeanSEMeanSE
LT x45.84 e0.1620.40 d0.234.80 c0.102.64 b0.102.40 a0.32LT = 0.6688 + (−42.71/T) + (763.7/T2)
SGR y0.034 a0.000.055 b0.010.236 c0.020.359 d0.050.548 e0.00SGR = [0.1183(T − 5.182)]2
MPD z5.73 a0.115.81 a0.106.73 b0.127.01 b0.037.02 b0.04MPD = 3.717 + 0.1769T − 0.002378T2
x LT, lag time (h); y SGR, specific growth rate (log CFU/h); z MPD, maximum population density (log); a–e Mean values (n = 4) in the row followed by different letters are significantly different (p <0.05); T, temperature.

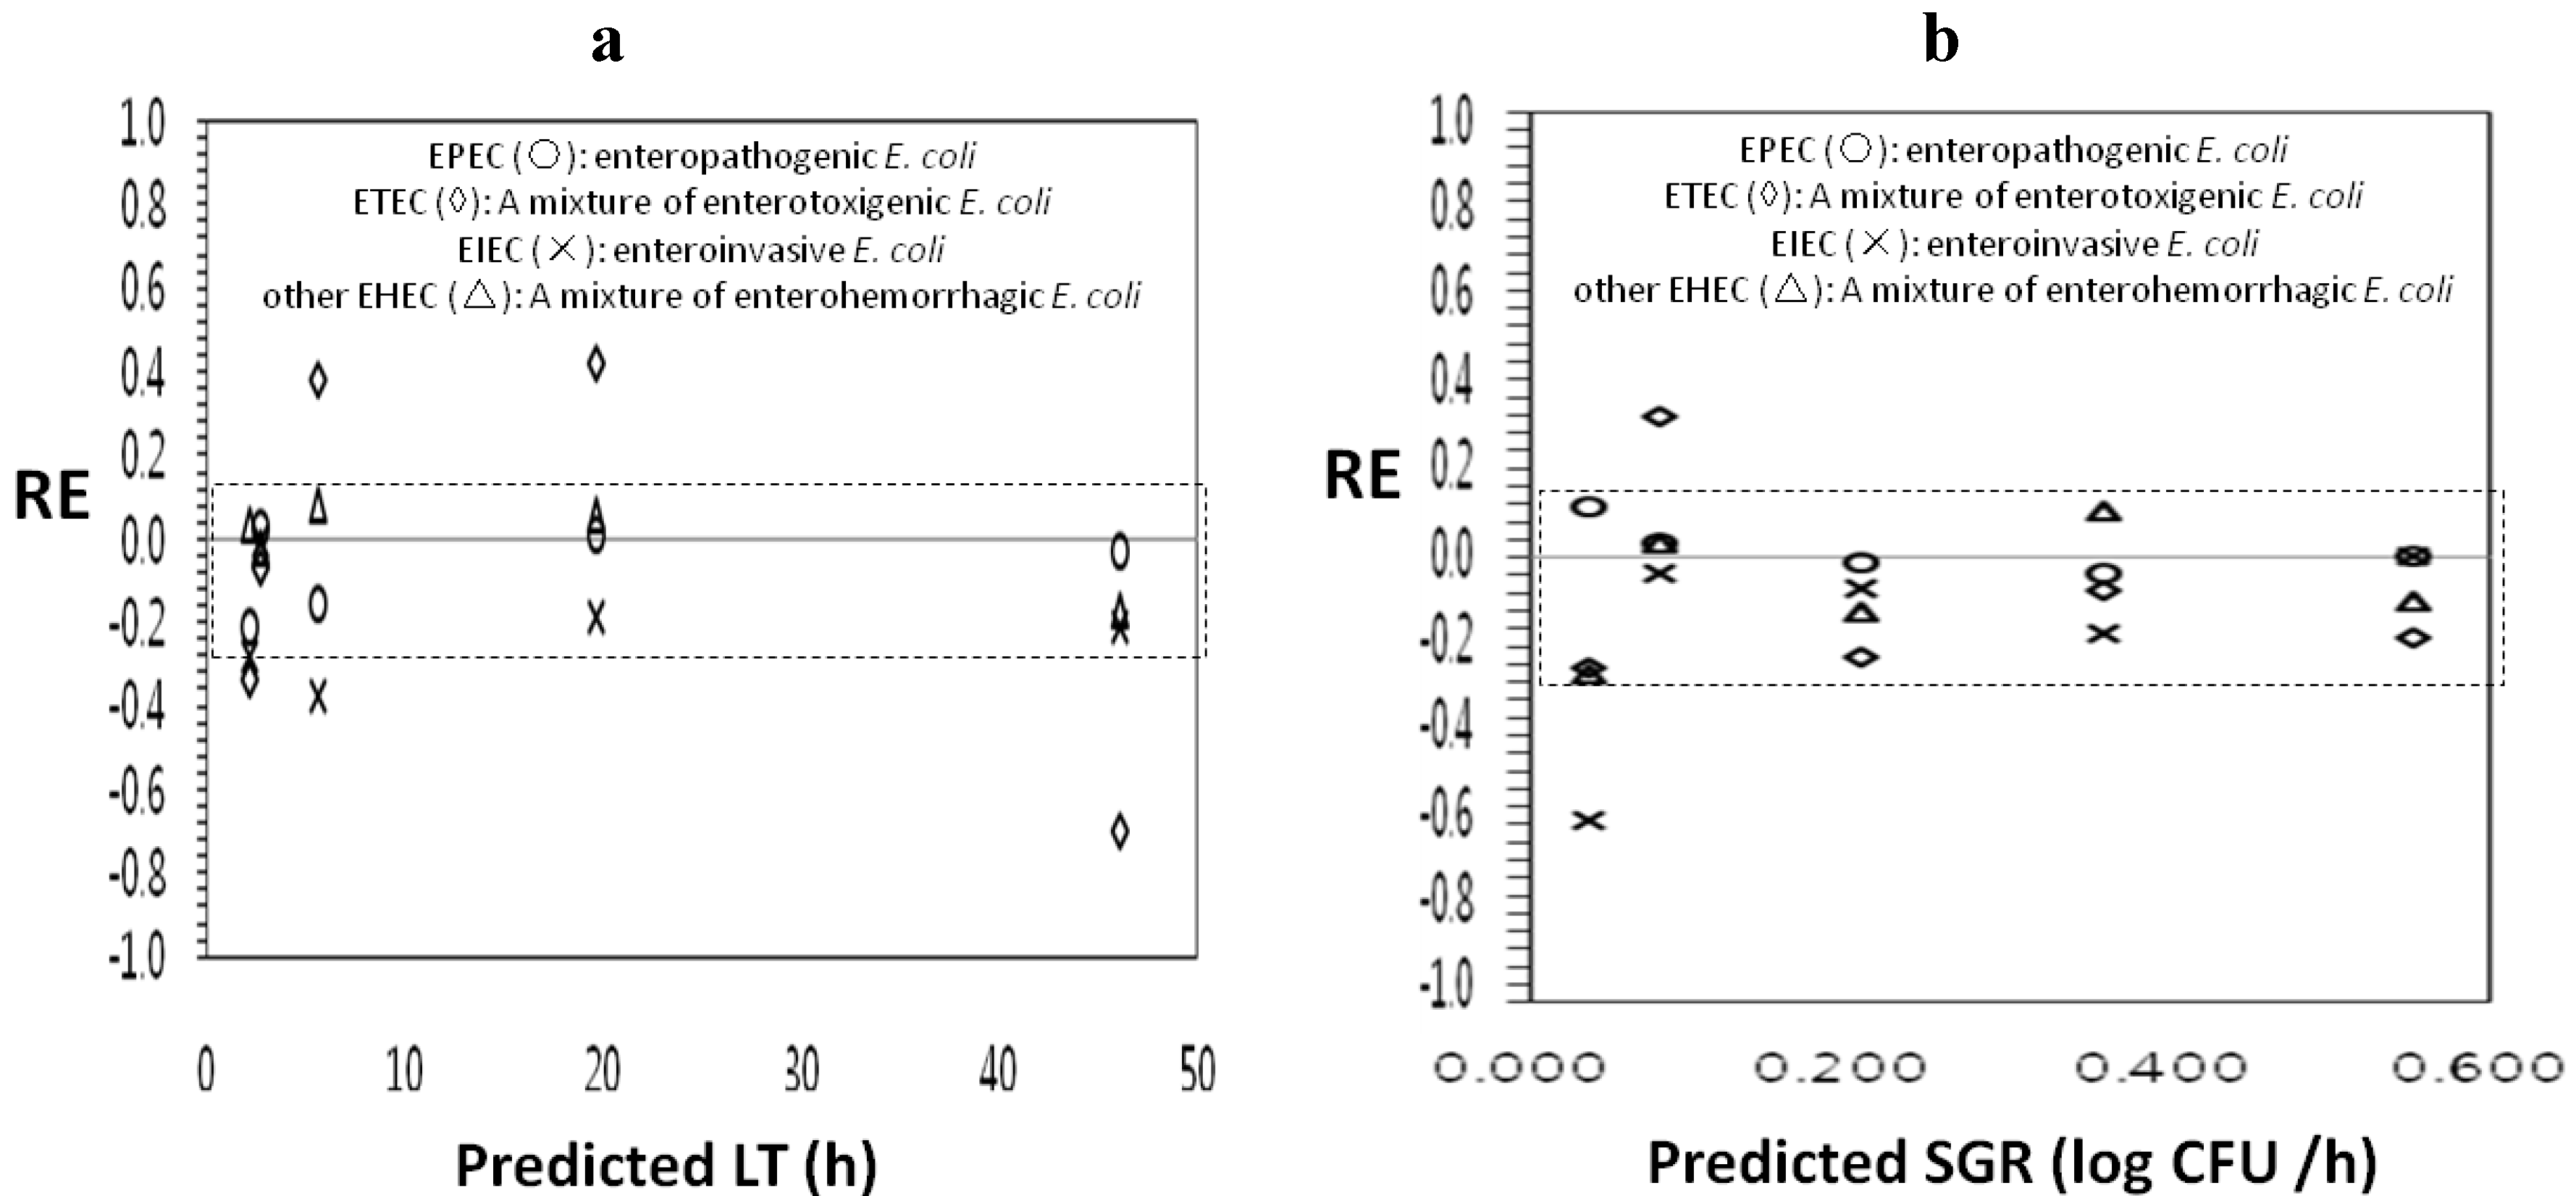
3.2. Evaluation of Model Performance

The performance of the growth model can be evaluated for the dependent data used during model development and for independent data not used during model development. In the present study, the growth model of E. coli O157:H7 in perilla leaves was evaluated using independent sets of data obtained with EPEC (enteropathogenic E. coli NCCP 13715), a mixture of ETEC (enterotoxigenic E. coli NCCP 13717 and 13718), EIEC (enteroinvasive E. coli NCCP 13719) and a mixture of other EHEC (enterohemorrhagic E. coli NCCP 13720 and 13721), which are other strains than the ones used in the model development. Table 2 shows that predicted SGR and LT values by secondary models for E. coli O157:H7 in perilla leaves were compared to the observed SGR and LT values with 4 different strains (EPEC, ETEC, EIEC and other EHEC). Significant differences in SGR and LT values in perilla leaves were observed, depending on the type of strains at all tested temperatures (p < 0.05). The differences in LT values were increased between the predicted data with the E. coli O157:H7 model and the observed data with various pathogenic E. coli strains at lower storage temperature. At 13 °C, the shortest LT was observed with E. coli O157:H7 in perilla leaves, followed by EPEC, EHEC, other, EIEC and ETEC, while the fastest growth rates were noted in EPEC, followed by E. coli O157:H7 in perilla leaves at 13 °C.
Table 2. Comparison of growth kinetics * for E. coli O157:H7 to those ** for various pathogenic E. coli strains in perilla leaves.
ParameterStrains13 °C17 °C24 °C30 °C36 °C
MeanSEMeanSEMeanSEMeanSEMeanSE
LT xO157:H745.84 a0.0019.68 d0.005.52 b0.002.64 a0.002.16 a0.00
EPEC k47.52 b1.1819.44 c1.766.48 b0.432.73 a0.062.64 b0.01
ETEC l78.48 e0.8511.52 a0.293.60 a0.302.89 b0.202.88 c0.07
EIEC m55.92 c1.0623.28 e0.557.68 c0.012.74 a0.112.87 c0.04
EHEC n54.24 d1.4218.48 b0.245.04 b0.052.88 b0.072.12 a0.04
SGR yO157:H70.036 d0.000.081 b0.000.207 e0.000.359 d0.000.554 c0.00
EPEC0.040 e0.010.084 c0.000.204 d0.010.347 c0.020.555 d0.07
ETEC0.027 c0.000.107 d0.010.161 a0.000.332 b0.010.455 a0.04
EIEC0.015 a0.000.079 a0.090.192 c0.010.298 a0.010.555 d0.00
EHEC0.026 b0.020.084 c0.000.182 b0.040.396 e0.020.499 b0.02
* Predicted value (n = 4) from the secondary model for E. coli O157:H7 on perilla leaves; ** Observed value (n = 4); a–e Mean values (n = 4) in the column followed by different letters are significantly different (p < 0.05); x LT, lag time (h); y SGR, specific growth rate (log CFU/h); k EPEC, enteropathogenic; l ETEC, enterotoxigenic; m EIEC, enteroinvasive; n EHEC, enterohemorrhagic.
Table 3 shows the performance of secondary growth models for E. coli O157:H7 in perilla leaves for prediction of other pathogenic E. coli strains. In the LT model for perilla leaves, EIEC had the lowest Bf of 0.83, indicating that the model developed for E. coli O157:H7 in perilla leaves predicted the LT that was 17% shorter than those actually observed for EIEC in perilla leaves. All %RE of EIEC were less than zero (Figure 1), which indicated fail-safe predictions [26], and three of five REs (percentage of RE = 66.7%) for the EIEC model were inside the acceptable prediction zone. However, ETEC had a Bf of 1.03, indicating that the growth model of E. coli O157:H7 in perilla leaves predicted LT that was 3% slower than those actually observed for ETEC in perilla leaves, and only one of five relative errors (percentage of RE = 20%) for these models were inside the acceptable prediction zone. These results indicate that the LT model in perilla leaves for E. coli O157:H7 was not suitable for ETEC and EIEC. On the other hand, Bf for the LT model to EPEC and other EHEC strains was acceptable, at values of 0.94 and 1.00, respectively, and the RE plot also indicated that all REs (100%) for LT were inside the acceptable prediction zone, indicating that the LT model in perilla leaves for E. coli O157:H7 was suitable for EPEC and other EHEC strains.
In the SGR model, EIEC had the lowest Bf of 0.79, indicating that the growth model of E. coli O157:H7 in perilla leaves predicted the SGR that was 21% faster than those actually observed for EIEC in perilla leaves (Table 3). All REs of EIEC were less than zero, which indicated fail-safe predictions, and four of five relative errors (percentage of RE = 80%) for these models were inside the acceptable prediction zone. However, EPEC had the highest Bf of 1.02 Moreover, the Bf of ETEC and other EHEC were acceptable, 0.90 and 0.92, respectively, indicating that the model predicted an SGR that was 10% and 8% faster than those actually observed for ETEC and other EHEC in perilla leaves, respectively. All REs (percentage of RE = 100%) for EPEC and other EHEC were inside the acceptable prediction zone. These results show that LT and SGR secondary models of perilla leaves for E. coli O157:H7 were suitable for enteropathogenic E. coli (EPEC) and other enterohemorrhagic E. coli (EHEC), but only the SGR model of E. coli O157:H7 predicted for the growth of enteroinvasive E. coli (EIEC) and enterotoxigenic E. coli (ETEC) in perilla leaves well.
Table 3. Performance of secondary growth models for E. coli O157:H7 in perilla leaves for various pathogenic E. coli strains.
StrainModelBfaMRE bAfcMARE d%RE e
EPEC fLT j0.94−0.031.080.09100
SGR k1.020.141.040.04100
ETEC gLT1.03−0.071.460.3833.3
SGR0.90−17.921.240.2183.3
EIEC hLT0.83−0.211.210.2166.7
SGR0.79−7.201.270.1783.3
EHEC iLT1.000.041.080.08100
SGR0.92−9.871.140.12100
a Bf, bias factor; b MRE, median relative error; c Af, accuracy factor; d MARE, mean absolute relative error; e %RE, the percentage of relative error in an acceptable prediction range from −30% to 15% for SGR and −60% to 30% for LT; f EPEC, enteropathogenic; j LT, lag time (h); k SGR, specific growth rate (log CFU/h); g ETEC, enterotoxigenic; h EIEC, enteroinvasive; i EHEC, other enterohemorrhagic E. coli.
Figure 1. Relative error (RE) plots with an acceptable prediction zone of lag time (LT) and specific growth rate (SGR) data used for model performance of extrapolation. (a) LT; (b) SGR.
Foods 02 00364 g001
A well-known strategy for modeling is to choose the fastest growing strain in the environmental conditions investigated, because the fastest growing strain will dominate the growth in food products [28]. McMeekin et al. [23] also recommended independent modeling of several different strains before choosing the strain that grows fastest under the environment conditions of most interest. Salter et al. [29] compared the growth of the nonpathogenic, E. coli M23, with the growth of pathogenic strains of E. coli O157:H7 and found only small differences in the growth responses of these two strains. They also found that the model based on E. coli M23 was able to describe the growth of pathogenic strains of E. coli O157:H7.

4. Conclusions

Developed LT and SGR models for E. coli O157:H7 in perilla leaves were suitable for only enteropathogenic E. coli (EPEC) and other enterohemorrhagic E. coli (EHEC). As a result of comparison of growth kinetics in perilla leaves, E. coli O157:H7 and EPEC are the high risk ones of pathogenic E. coli among the pathogenic E. coli. The results of the current study provide the growth characteristics of various pathogenic E. coli strains in perilla leaves at various temperatures, which will be useful information for risk assessment of pathogenic E. coli in perilla leaves at a retail fresh market.

Conflicts of Interest

The authors declare no conflict of interest.

References

  1. Myron, M.L. Escherichia coli that cause diarrhea: Enterotoxigenic, enteropathogenic, enteroinvasive, enterohemorrhagic, and enteroadherent. J. Infect. Dis. 1987, 155, 377–389. [Google Scholar] [CrossRef]
  2. Cooley, M.; Carychao, D.; Crawford-Miksza, L.; Jay, M.T.; Myers, C.; Rose, C.; Keys, C.; Farrar, J.; Mandrell, R.E. Incidence and tracking of Escherichia coli O157:H7 in a major produce production region in California. PloS One 2007, 2, e1159. [Google Scholar] [CrossRef]
  3. News, F.Q. Germany Finally Confirms Source of Deadly E. coli Outbreak. Available online: http://www.foodproductiondaily.com/Safety-Regulation/Germany-finally-confirms-source-of-deadly-E.coli-outbreak (accessed on 15 March 2013).
  4. Korea Centers for Disease Control & Prevention. Available online: http://www.cdc.go.kr/CDC/eng/main.jsp (accessed on 20 Febuary 2013).
  5. Lee, J.K.; Park, I.H.; Yoon, K.; Kim, H.J.; Cho, J.I.; Lee, S.H.; Hwang, I.G. An analysis of epidemiological investigation reports regarding to pathogenic E. coli outbreaks in Korea from 2009 to 2010. J. Food Hyg. Saf. 2012, 27, 366–374. [Google Scholar]
  6. Jinneman, K.C.; Trost, P.A.; Hill, W.E.; Weagant, S.D.; Bryant, J.L.; Kaysner, C.A.; Wekell, M.M. Comparison of template preparation methods from foods for amplification of Escherichia coli O157 Shiga-like toxins type I and II DNA by multiplex polymerase chain reaction. J. Food Prot. 1995, 58, 722–726. [Google Scholar]
  7. Kwon, W.H.; Lee, W.G.; Song, J.E.; Kim, K.Y.; Shim, W.B.; Yoon, Y.H.; Kim, Y.S.; Chung, D.H. Microbiological hazard analysis on perilla leaf farms at the harvesting stage for the application of the Good Agricultural Practices (GAP). J. Food Hyg. Saf. 2012, 27, 295–300. [Google Scholar]
  8. Choi, J.W.; Park, S.Y.; Yeon, J.H.; Lee, M.J.; Chung, D.H.; Lee, K.H.; Kim, M.G.; Lee, D.H.; Kim, K.S.; Ha, S.D. Microbial contamination levels of fresh vegetables distributed in markets. J. Food Hyg. Saf. 2005, 20, 43–47. [Google Scholar]
  9. Jung, S.H.; Hur, M.J.; Ju, J.H.; Kim, K.A.; Oh, S.S.; Go, S.M.; Kim, Y.H.; Im, J.S. Microbiological evaluation of raw vegetable. J. Food Hyg. Saf. 2006, 24, 250–257. [Google Scholar]
  10. Park, S.Y.; Choi, J.W.; Chung, D.H.; Kim, M.G.; Lee, K.H.; Kim, K.S.; Bahk, G.J.; Bae, D.H.; Park, S.K.; Kim, K.Y. Development of a predictive mathematical model for the growth kinetics of Listeria monocytogenes in sesame leaves. Food Sci. Biotechnol. 2007, 16, 238–242. [Google Scholar]
  11. Oscar, T.P. Extrapolation of a predictive model for growth of a low inoculum size of Salmonella typhimurium DT104 on chicken skin to higher inoculum sizes. J. Food Prot. 2011, 74, 1630–1638. [Google Scholar] [CrossRef]
  12. Buchanan, R.L.; Bagi, L.K.; Goins, R.V.; Phillips, J.G. Response surface models for the growth kinetics of Escherichia coli O157:H7. Food Microbiol. 1993, 10, 303–315. [Google Scholar] [CrossRef]
  13. Kovárová, K.; Zehnder, A.J.; Egli, T. Temperature-dependent growth kinetics of Escherichia coli ML 30 in glucose-limited continuous culture. J. Bacteriol. 1996, 178, 4530–4539. [Google Scholar]
  14. Presser, K.A.; Ratkowsky, D.A.; Ross, T. Modelling the growth rate of Escherichia coli as a function of pH and lactic acid concentration. Appl. Environ. Microbiol. 1997, 63, 2355–2360. [Google Scholar]
  15. Ross, T.; Ratkowsky, D.A.; Mellefont, L.A.; McMeekin, T.A. Modelling the effects of temperature, water activity, pH and lactic acid concentration on the growth rate of Escherichia coli. Int. J. Food Microbiol. 2003, 82, 33–43. [Google Scholar] [CrossRef]
  16. Sutherland, J.P.; Bayliss, A.J.; Braxton, D.S.; Beaumont, A.L. Predictive modelling of Escherichia coli O157:H7: Inclusion of carbon dioxide as a fourth factor in a pre-existing model. Int. J. Food Microbiol. 1997, 37, 113–120. [Google Scholar] [CrossRef]
  17. Sutherland, J.P.; Bayliss, A.J.; Braxton, D.S. Predictive modelling of growth of Escherichia coli O157:H7: The effects of temperature, pH and sodium chloride. Int. J. Food Microbiol. 1995, 25, 29–49. [Google Scholar] [CrossRef]
  18. Koseki, S.; Isobe, S. Prediction of pathogen growth on iceberg lettuce under real temperature history during distribution from farm to table. Int. J. Food Microbiol. 2005, 104, 239–248. [Google Scholar] [CrossRef]
  19. McKellar, R.C.; Delaquis, P. Development of a dynamic growth-death model for Escherichia coli O157:H7 in minimally processed leafy green vegetables. Int. J. Food Microbiol. 2011, 151, 7–14. [Google Scholar] [CrossRef]
  20. Daughtry, B.J.; Davey, K.R.; King, K.D. Temperature dependence of growth kinetics of food bacteria. Food Microbiol. 1997, 14, 21–30. [Google Scholar] [CrossRef]
  21. Oscar, T.P. Development and validation of a tertiary simulation model for predicting the potential growth of Salmonella typhimurium on cooked chicken. Int. J. Food Microbiol. 2002, 76, 177–190. [Google Scholar] [CrossRef]
  22. Ratkowsky, D.A.; Olley, J.; McMeekin, T.A.; Ball, A. Relationship between temperature and growth rate of bacterial cultures. J. Bacteriol. 1982, 149, 1–5. [Google Scholar]
  23. McMeekin, T.A.; Olley, J.; Ross, T. Predictive Microbiology: Theory and Application; John Wiley & Sons Ltd.: Taunton, UK, 1993. [Google Scholar]
  24. Ross, T. Indices for performance evaluation of predictive models in food microbiology. J. Appl. Microbiol. 1996, 81, 501–508. [Google Scholar]
  25. Oscar, T.P. Validation of lag time and growth rate models for Salmonella typhimurium: Acceptable prediction zone method. J. Food Sci. 2005, 70, 129–137. [Google Scholar] [CrossRef]
  26. Abou-Zeid, K.A.; Oscar, T.P.; Schwarz, J.G.; Hashem, F.M.; Whiting, R.C.; Yoon, K. Development and validation of a predictive model for Listeria monocytogenes Scott A as a function of temperature, pH, and commercial mixture of potassium lactate and sodium diacetate. J. Mircobiol. Biotechnol. 2009, 19, 718–726. [Google Scholar]
  27. Delignette-Muller, M.L.; Rosso, L.; Flandrois, J.P. Accuracy of microbial growth predictions with square root and polynomial models. Int. J. Food Microbiol. 1995, 27, 139–146. [Google Scholar] [CrossRef]
  28. McKellar, R.C.; Lu, X. Modeling Microbial Responses in Food; CRC Press: Boca Raton, FL, USA, 2003. [Google Scholar]
  29. Salter, M.A.; Ross, T.; McMeekin, T.A. Applicability of a model for non-pathogenic Escherichia coli for predicting the growth of pathogenic Escherichia coli. J. Appl. Microbiol. 1998, 85, 357–364. [Google Scholar]

