Abstract
Organoleptic features allow extra virgin olive oil (EVOO) to be distinguished from other commercial categories and to determine consumer preferences. In this study, we evaluated the influence of the phenolic content on the intensity of two characteristic attributes, namely, bitterness and pungency. The organoleptic analysis was carried out by a panel of trained tasters, who categorized a set of 200 EVOO samples produced in two consecutive crop seasons into three intensity levels (“Delicate”, “Medium”, and “Robust”) according to current regulations. The total phenolic content was correlated with the intensity of both attributes, but a different contribution was identified for individual phenols. For bitterness, aglycone isomers of oleuropein and ligstroside provided over 70% discrimination power (estimated by receiver operating characteristic analysis), while oleocanthal and oleacein were associated with a decrease in bitterness intensity. In addition, the intensity of pungency intensity was related to the content of oleocanthal, oleomissional, and oleokoronal, as they allowed the classification of about 75% of the “Robust” pungency EVOOs. With these premises, it is possible to obtain olive oils with the desired intensity of bitterness and pungency by controlling the factors that influence phenolic metabolism.
1. Introduction
Over the years extra virgin olive oil (EVOO) has gained great gastronomic popularity due to its organoleptic characteristics and health benefits [1]. It is worth highlighting the role of the minor fraction and, particularly, the phenolic compounds for their nutraceutical properties [2]. Phenols are responsible for the unique health claim included in the European Regulation EU 432/2012, which is exclusive to olive oil. This claim refers to “olive oil polyphenols contribute to the protection of blood lipids against oxidative stress” and could only be applied if the olive oils contain at least 5 mg of hydroxytyrosol, tyrosol, and their derivatives for a recommended daily intake of 20 g of olive oil [3].
In terms of organoleptic evaluation, fruitiness, pungency, and bitterness are the three main positive attributes evaluated by the panel test. Recently, the International Olive Council (IOC) and the European Commission have classified these attributes according to the intensity of their perception in: “Robust” (median intensity score of all panel tasters > 6.0 on a scale 0–10), “Medium” (median intensity score of all panel tasters between 3.0 and 6.0), and “Delicate” (median intensity score of all panel tasters < 3.0). Complementary, fruitiness is classified as “green fruitiness” and “ripe fruitiness” based on a set of olfactory and gustatory sensory characteristics derived from green and fresh olives or sound and fresh olives, respectively [4,5].
Some studies have previously reported a quantitative association between these attributes and diverse chemical families of compounds in olive oil [6,7]. On the one hand, the fruitiness of EVOO has been explained by the presence of a large number of volatile compounds [8,9,10]. Recently, Tomé-Rodríguez et al. linked the intensity of fruitiness to the main metabolic ratios responsible for the formation of C5 and C6 volatiles through the lipoxygenase (LOX) pathway. Specifically, the conversion of 3-hexenal to 2-hexenol or 3-hexen-1-ol discriminated between ripe fruitiness (towards the formation of 2-hexenol) and intense fruitiness (towards the formation of 3-hexen-1-ol) [11]. Similarly, Ríos-Reina et al. reported specific volatile markers of fruitiness type using three analytical gas chromatographic methods (HS-SPME–GC–FID, HS-SPME–GC–MS, and TDU–GC–MS) and two data processing strategies (conventional integration and PARADISe software) [7]. Other authors have developed tools to classify the fruitiness intensity of EVOOs (ripe fruitiness or light, medium, and intense green fruitiness) using a high-sensitivity laboratory electronic nose [12].
On the other hand, pungency and bitterness are two sensory attributes that have traditionally been related to the total phenolic content [13,14,15,16], but other studies have linked these attributes to specific secoiridoid derivatives. Oleacanthal has been proposed to be responsible for the pungent sensation in olive oils [17,18,19], while the bitter sensory notes have been linked to the presence of oleuropein and ligstroside derivatives. Demopoulos et al. reported a positive correlation between oleocanthal and oleacein content and pungency and bitterness intensity in Koroneiki virgin olive oils [20] and Gutierrez-Rosales et al. obtained strong correlations between bitterness intensity and oleuropein aglycone, oleacein, and oleocanthal content [21], while the other authors related bitterness to the presence of oleuropein aglycone [22,23].
In recent years, there has been a great interest in developing analytical techniques to measure bitter and pungent attributes in olive oils to support the panel test. However, few studies have related the panel test evaluation of pungency and bitterness to the phenolic profiles of EVOOs. The identification of the phenols responsible for both organoleptic attributes would allow the selection of EVOOs with desired levels of pungency and bitterness. With these premises, the aims of this study were: (i) to find patterns of association between the intensity of these two gustatory attributes, determined by a trained taster panel, and the phenolic profile established by individual determination using LC–MS/MS; and (ii) to explain the intensity of bitterness and pungency by changes occurring in the metabolism of secoiridoids. In order to increase the representativeness of this study, a set of 200 high quality EVOOs produced in two consecutive harvest seasons was selected.
2. Materials and Methods
2.1. Samples and Sensory Analysis
A set of 200 EVOO samples produced in two consecutive agronomic seasons (2021/2022 and 2022/2023) of different cultivars (monovarietal and blended) and geographical origin were used in this study. The samples were provided by the organizing committee of the EVOOLEUM World’s Top 100 EVOO Guide (Mercacei and AEMO, Spain), corresponding to the top 100 EVOOs included in the 2022 and 2023 Edition Guides. According to the rules of the competition, all the samples submitted had to be certified as extra virgin by an accredited laboratory, guaranteeing the absence of any organoleptic defects. It is worth mentioning that top 100 EVOOs of each edition were selected by the panel of tasters from a total of 450 EVOOs. This selection was based on organoleptic analysis, which means that the quality of top 100 EVOOs was exceptional. Information on the samples is shown in Table S1.
The organizing committee of the EVOOLEUM competition coordinated the organoleptic evaluation of the EVOO samples, which was carried out by a group of twenty-five professional tasters. Each EVOO sample (100 samples × 2 years) was evaluated by five tasters in accordance with the recommendations of the IOC method [5]. Thus, each taster evaluated 20 randomly coded EVOOs in five sessions (4 samples per session) organized on two consecutive days (3 + 2). The EVOO samples were evaluated quantitatively in terms of bitterness and pungency. For this purpose, each taster gave an intensity score for each attribute on a scale of 0–10. For the development of this research, the organizing committee gave the median of all the individual scores provided by the panel testers. The EVOOs were categorized according to the intensity of these two attributes as “Robust”, “Medium”, and “Delicate” according to the median of all the individual scores provided by the panel tasters.
2.2. Reagents and Standards
Mass spectrometry (MS)-grade methanol (MeOH) from Fisher Scientific (Hampton, NH, USA) and n-hexane from Scharlab (Barcelona, Spain) were used for the determination and quantification of the phenolic compounds in the samples. MS grade formic acid, also from Fisher Scientific was used as ionization agent. Deionized water (18 MΩ·cm) from a Millipore Milli-Q water purification system (Bedford, MA, USA) was used to prepare both mobile phases and the hydroalcoholic mixture used as extractant.
Hydroxytyrosol and tyrosol were purchased in Extrasynthese (Genay, France), secoiridoid derivatives oleacein (3,4-DHPEA-EDA) and oleocanthal (p-HPEA-EDA) were acquired from Phytolab (Vestenbergsgreuth, Germany) and oleuropein and ligstroside aglycones from TRC (Ontario, Canada, Greece). Naringenin from Sigma-Aldrich (St. Louis, MO, USA) was used as internal standard (IS) to control the LC–MS/MS performance during the analysis of all samples.
2.3. Determination of Phenolic Compounds in EVOO
Phenolic compounds were isolated by liquid-liquid extraction according to a previously published protocol [24]. A 0.5 g aliquot of oil was vortexed with 250 µL of n-hexane for 30 s. Then, 2 mL of 80:20 (v/v) MeOH:water with the IS (1 µg/mL) was added and shaken for 2 min and the hydroalcoholic phase was separated by centrifugation. Phenolic extraction was performed quantitatively under these conditions as previously reported [25,26]. The phenolic extract was diluted 1:25 (v/v) before injecting 5 µL into a Thermo Scientific UltiMate 3000 series LC system coupled to a Thermo Scientific QqQ TSQ Quantum™ Access MAX detector (Waltham, MA, USA). Three replicates per sample were analyzed.
MS detection was performed using MS/MS in multiple reaction monitoring (MRM) mode for selective transitions from the precursor ion to the representative product ions for each analyte. The MRM parameters for the determination of the target phenols are given in Table S2.
2.4. Quantitative Determination of Phenolic Compounds and Statistical Analysis
Calibration curves were established using refined sunflower oil fortified with different concentrations of the phenolic standards (five concentrations from 1 mg/kg to 20 mg/kg). Each concentration level, prepared in triplicate, was analyzed after application of the complete procedure including sample preparation. The calibration equations were used to calculate the absolute concentration of the target phenols in the EVOO samples (Table S3).
Statistical analysis was performed with R (version 4.3.1., http://www.r-project.org/, accessed on 16 March 2024). Specifically, Kruskal–Wallis and pairwise Wilcoxon tests with a Bonferroni correction (p-value < 0.05) were used to detect significant differences between categories of organoleptic characteristics and to evaluate differences in phenolic content between the two harvesting seasons. The Spearman correlation was also used to find associations between the concentration of phenolics and the intensity values of the two sensory characteristics. Partial Least Square Discriminant Analysis (PLS-DA) was used to study the discrimination of EVOOs based on the three categories defined for each attribute. The area under the curve (AUC) of multiclass receiver operating characteristic (ROC) curves was calculated using the pROC R package (version 1.18.5) [27].
3. Results and Discussion
3.1. Variability in Phenolic Composition and Organoleptic Attributes
As mentioned above, the bitterness and pungency of EVOOs have often been explained by the total phenolic content [13,28]. However, few studies have focused on the association of individual phenols with these two attributes. In this study, EVOOs were classified according to the intensity of bitterness and pungency as determined by the tasting panel. The classification protocol is described in the European Commission Regulation 2022/2104 and considers the following three groups: “Robust” (median intensity score of all panel tasters > 6.0 on a scale 0–10), “Medium” (median intensity score of all panel tasters between 3.0 and 6.0), and “Delicate” (median intensity score of all panel tasters < 3.0). The three categories were well represented in terms of number of samples for the bitterness attribute, but only 11 EVOOs were classified as “Delicate” in pungency. This low representativeness of the “Delicate” pungency group is a limitation of this study, explained by the selection of the tasters, since pungency is a characteristic of high quality EVOOs. Statistical analysis revealed significant differences in the three bitterness groups by comparing the two seasons (Table 1). Thus, EVOOs produced in the 2022–2023 crop season were characterized by a more intense bitterness than those produced in the previous season (p-value < 0.001), while significant differences were found only in the “Robust” category for pungency (p-value < 0.001).

Table 1.
Organoleptic evaluation of bitterness and pungency in EVOOs selected in the two harvesting seasons. Letters indicate significant differences between the three groups for bitterness and pungency (p < 0.05). Asterisks indicate significant differences between the groups.
Despite these differences in the two consecutive seasons, no variation was observed in the total phenolic content of EVOOs (Table 2, Figure S1) with a mean value of 437 mg/kg and a similar distribution in quartiles. Considering the individual phenolic contents, hydroxytyrosol, oleuropein aglycone, and oleacein were significantly higher in the first harvesting season, while oleomissional was significantly higher (p-value < 0.001) in the second season. No significant differences were found for tyrosol, ligstroside aglycone, oleokoronal and oleocanthal.
Table 2.
Mean phenolic content (expressed in mg/kg) and standard deviation determined in EVOO samples of each crop season.
In addition, a correlation analysis using Spearman’s test was carried out to find out possible relationships between organoleptic attributes and phenolic concentration (Table S4). Bitterness intensity showed a positive correlation with total phenolic content and oleuropein aglycone (R = 0.46 and R = 0.38, respectively; p-value < 0.001) followed by ligstroside aglycone, oleomissional, and oleokoronal (R = 0.35). These results agree with those reported by Cui et al., who pointed out that no bitter taster receptors are activated by oleacein and oleocanthal [29]. On the other hand, total phenolic content followed by ligstroside aglycone and oleokoronal were positively correlated with pungency (R = 0.39 and R = 0.30, respectively; p-value < 0.001). Despite these high levels of significance, the correlation coefficients were less than 0.5. Based on these premises, the contribution of phenolic to bitterness and pungency seems to be explained by several compounds. Bitterness and pungency also showed a positive correlation (R = 0.69; p-value < 0.001), which means that both attributes are strongly related.
3.2. Influence of the EVOO Phenolic Profile on the Intensity of Bitterness and Pungency
After evaluating the variability in organoleptic characteristics and phenolic content, a multivariate supervised analysis by PLS-DA was performed to evaluate the ability of the phenolic profile to discriminate the three bitterness categories assigned by the European Commission regulation (Figure S2). The EVOOs with “Medium” intensity described a large dispersion in the PLS plot, but the EVOOs with “Delicate” and “Robust” bitterness were well discriminated. For this reason, we performed a second PLS-DA analysis restricted to EVOOs belonging to the “Delicate” (n = 32) and “Robust” (n = 26) bitterness categories. The PLS-DA scores plot (Figure 1a) showed a clear distinction between the two groups along the first component. Also, the loadings plot (Figure 1b) showed the discriminatory role of the closed monoaldehyde form of both aglycones (oleuropein and ligstroside aglycones) and the open aldehyde form of the ligstroside aglycone (oleokoronal) for EVOOs categorized with “Robust” bitterness, whereas oleacein and oleocanthal were distributed with the “Delicate” bitterness group. Regarding the pungency attribute, PLD-DA did not reveal any clear discrimination between the three groups or between the “Medium” and “Robust” intensity groups (Figure S3).
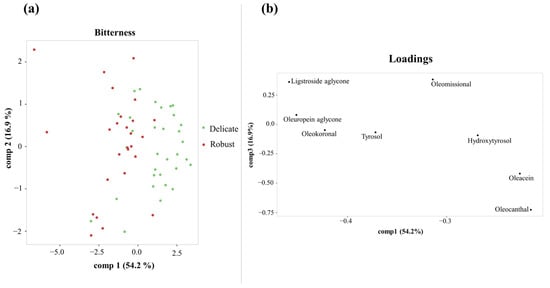
Figure 1.
PLS-DA scores plot (a) and loadings plot (b) for discriminating “Robust” and “Delicate” bitterness groups using the first and third components.
However, Kruskal–Wallis and pairwise Wilcoxon tests (adjusted Bonferroni p < 0.05) were used as complementary analysis to find differences between the groups. They revealed significant differences in the total phenolic content for the two groups correctly represented by pungency (Table 3, Figure 2).
Table 3.
Mean concentration of phenols (expressed in mg/kg) in the total set of samples in each category of bitterness and pungency. Lowercase letters indicate significant differences (p < 0.05) between intensity groups for each attribute.
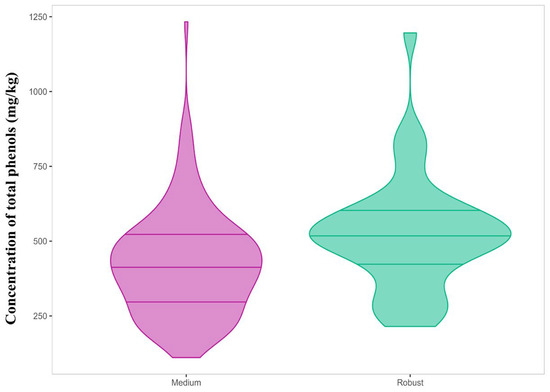
Figure 2.
Violin plot of the total phenolic content (mg/kg) for “Medium” and “Robust” pungency categories.
The “Robust” pungency group had a total phenolic content of 522 ± 189 mg/kg as compared to the “Medium” group with 422 ± 175 mg/kg. Significant differences were also reported for three individual phenols, namely, the open isomers, oleomissional and oleokoronal (p-values 0.0015 and 0.05, respectively), and oleocanthal (p-value = 0.021). These three compounds were more concentrated in the “Robust” pungency group, despite other studies associating this organoleptic property to the presence of oleocanthal [17,18]. Similarly, the three groups established for bitterness showed significant differences in the total phenolic content, but also in the individual content of specific phenols such as the aglycone isomers (Table 3, Figure 3). Thus, the total phenolic content increased linearly with the intensity of bitterness, with the mean content in the “Robust” group being 621 ± 223 mg/kg while the “Delicate” group reported 327 ± 144 mg/kg. Among the individual phenols, only oleuropein aglycone and ligstroside aglycone showed significant variations with bitterness intensity with clear differences between the three categories. The content in oleuropein aglycone in the “Delicate” group was 93.3 ± 55.4 mg/kg as compared to 190 ± 82 mg/kg in the “Robust” group. Similarly, ligstroside aglycone was found to be 50.8 ± 30.3 mg/kg in the “Delicate” group as compared to 121 ± 64 mg/kg in the “Robust” group. These results agree with those obtained by Cui et al., who found a high stimulation ability of bitter receptors for these two phenols using a calcium mobilization functional assay [29]. Hydroxytyrosol showed a similar behavior to both aglycones but the range of variation in concentration was reduced. Oleomissional, oleokoronal, and oleocanthal also showed statistical differences, but only allowed differentiation of the “Robust” bitterness group.
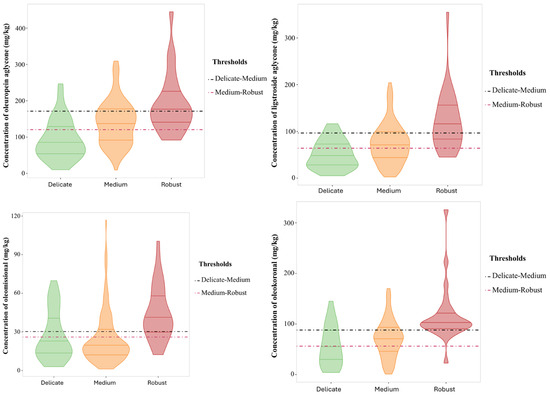
Figure 3.
Violin plot for the concentration of secoiridoids (mg/kg) with significant differences between the bitterness groups. Threshold concentrations are included to discriminate between “Delicate” and “Medium” (pink line) and between “Medium” and “Robust” (black line).
3.3. Capability of Phenols to Discriminate Bitterness and Pungency Intensity of EVOOs
A complementary analysis of the ability of phenols to discriminate the intensity of bitterness and pungency in EVOOs was performed using receiver operating characteristic (ROC) curves and pairwise comparisons [27]. This evaluation was multiclass for bitterness due to the categorization into three intensity groups, while for pungency only two groups were considered due to the reduced representativeness of the “Delicate” group. For bitterness, ligstroside aglycone, oleuropein aglycone, oleokoronal, and oleomissional gave multiclass AUC percentages above 70%, while oleacein and oleocanthal gave values below 60% (Table 4). These results were complemented by the pairwise comparison reporting AUC values for discriminating between two groups, namely, “Delicate” vs. “Medium”; “Medium” vs. “Robust”; and “Delicate” vs. “Robust”. Comparison of the two extreme groups, “Delicate” vs. “Robust”, clearly showed the discrimination ability of the aglycone isomers of oleuropein and ligstroside with AUC values ranging from 75.6% to 88.3%. The highest AUC percentages were found for oleuropein and ligstroside aglycones (closed forms) with 86.2 and 88.3, respectively. It is worth mentioning that hydroxytyrosol and tyrosol, simple phenols, also gave AUC values above 80, but their concentration variability ranges were particularly limited. On the other hand, the AUC values for oleacein and oleocanthal for discriminating the two extreme groups were the lowest among those monitored for individual phenols. A similar pattern was observed when comparing “Delicate” and “Medium” groups, as the highest AUC values were found for oleuropein aglycone (72.7%) and ligstroside aglycone (66.2%), followed by hydroxytyrosol (67.2%). The comparison between the “Medium” and “Robust” groups allowed the detection of the open aglycone isomers, oleomissional (79.8%) and oleokoronal (80.4%), as the phenols with the highest AUC values followed by the two closed isomers, oleuropein aglycone (68.7%) and ligstroside aglycone (74.0%). The simple phenols also showed high AUC values, 67.9% and 70.5% for hydroxytyrosol and tyrosol, respectively, whereas the lowest AUC values were obtained for oleacein and oleocanthal.
Table 4.
AUC values (%) estimated for phenolic compounds to discriminate intensity groups of bitterness (multiclass AUC) and pungency (“Medium” versus “Robust”). AUC values (%) and threshold concentrations (mg/kg) obtained by pairwise comparison of bitterness intensity groups are also provided.
For pungency, the discrimination AUC values were lower than those found for bitterness. Thus, the total phenolic content gave an AUC of 67.0% when comparing the “Medium” and “Robust” pungency groups, while the three individual phenols that gave significant differences were the top 3 phenols with the highest discriminatory ability. These were oleomissional (68.0%), oleokoronal (62.0%), and oleocanthal (64.0%).
3.4. Association of Bitterness and Pungency with Phenolic Content
Considering the synthetic pathway involved in the formation of the main secoiridoid derivatives found in olive oil (Figure 4), the compounds with the highest ability to explain bitterness are the aglycone isomers of oleuropein and ligstroside, which are released by enzymatic conversion of the oleuropein and ligstroside substrates by β-glucosidase. The closed isomers are in chemical equilibrium with the open forms, the latter being the substrates for conversion by the esterase enzyme to oleacein and oleocanthal [30]. According to the results reported in this study, the predominance of these last two secoiridoids in the phenolic profile is associated with a decrease in bitterness intensity. Regarding the role of the aglycone isomers, the opening of the closed cycle in the aglycones also seems to play a relevant role in the bitterness intensity. Although the concentration of both isomeric forms of oleuropein and ligstroside are associated with bitterness intensity, the closed forms provided a strong concentration effect on the intensity of this attribute, in agreement with the study reported by Cui et al., who attributed the highest ability to activate bitter taste receptors to the closed isomers [30]. On the other hand, oleomissional had the ability to activate only one of the bitter taste receptors (TAS2R8) whereas oleocanthal and oleacein did not activate any of these receptors (TAS2Rs). These results were consistent with those obtained in our study, supported by the violin plots and the threshold concentrations for discriminating the three bitter intensity groups (Figure 3). Thus, the thresholds of oleuropein and ligstroside aglycones (closed forms) for discriminating the “Delicate” and “Medium” groups allowed the classification of almost 75% of the EVOOs with “Delicate” bitterness against about 60% of the EVOOs with “Medium” bitterness. On the other hand, the thresholds of the two closed aglycones allowed the classification of about 75% of the “Medium” bitterness EVOOs and less than 50% of the “Robust” bitterness EVOOs.
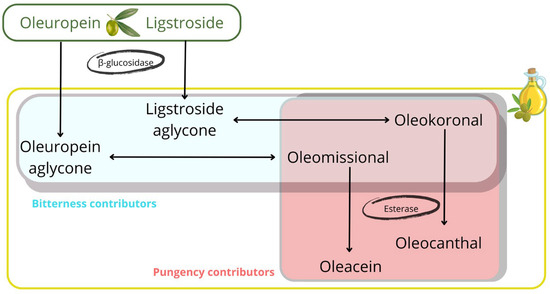
Figure 4.
Pathway for the synthesis of the main secoiridoids found in olive oil with indication of the main contributors of bitterness and pungency.
The discriminatory power capability was less significant for the open isomers, as they mainly classified “Robust” bitterness EVOOs. Thus, the thresholds for oleomissional and oleokoronal allowed us to discriminate about 75% of the “Robust” bitterness EVOOs. These results indicate that the closed isomers of oleuropein and ligstroside aglycones are the strongest contributors to EVOO bitterness. However, the open forms, oleomissional and oleokoronal, also contribute to “Robust” bitterness EVOOs, probably because they are positively correlated with the presence of the closed isomers. This finding supports the conclusions reported by Servili et al. concerning the relationship between the attributes and ring opening in aglycone secoiridoids [31].
For pungency, we found a similar effect to that observed for bitterness (Figure S4). Thus, the threshold concentrations determined for oleomissional and oleokoronal allowed the classification of about 75% of the “Medium” pungency EVOOs and more than 50% of the “Robust” pungency EVOOs. Complementarily, oleocanthal, formed by the esterase conversion of oleokoronal, reported a discrimination threshold that correctly classified about 50% of “Medium” pungency EVOOs and almost 75% of “Robust” pungency EVOOs. Therefore, it seems that oleomissional and oleokoronal are mainly responsible for the pungency of EVOOs, but oleocanthal also contributes to the discrimination of “Robust” pungency EVOOs, as reported by Peyrot des Ganchons et al. [19] and Andrewes et al. [17], probably because this phenol is positively correlated with the presence of oleokoronal. Overall, the first part of this synthetic pathway regulates bitterness, while the second part is responsible for the pungency attribute. This explanation supports the high level of correlation reported between the intensity of the two attributes.
4. Conclusions
Phenolic composition was associated with the intensity of bitterness and pungency in EVOOs. Oleuropein and ligstroside aglycone were positively correlated with the intensity of bitterness, although oleomissional and oleokoronal also contributed to discriminate the “Robust” intensity group. On the other hand, oleacein and oleocanthal were associated with the lowest intensity of bitterness. Complementary, oleomissional, oleokoronal, and oleocanthal showed the highest ability to discriminate between the “Medium” and “Robust” pungency groups. The metabolic pathway involved in the synthesis of the main secoiridoids can therefore explain the intensity of these two attributes, which are of particular relevance in the organoleptic evaluation of EVOOs. With these premises, the control of the factors that influence the metabolism of secoiridoids would make it possible to obtain olive oils with the desired intensity of bitterness and pungency, which is of interest to the olive oil industry in order to prepare products according to consumer preferences.
Supplementary Materials
The following supporting information can be downloaded at: https://www.mdpi.com/article/10.3390/foods14091620/s1, Table S1. List of EVOO samples analyzed in this study. Bitterness and pungency are categorized in three groups according to the ranges established by Regulation (EU) 2022/2104 of 29 July 2022. Table S2. LC–MS/MS parameters for determination of phenolic compounds. Table S3. Calibration models used for quantitative analysis of phenols. Table S4. Correlation coefficients between the intensity of bitterness and pungency and the concentration of phenolic compounds. Statistical significance is denoted as follows: *, p < 0.05; **, p < 0.01; ***, p < 0.001. Figure S1. Distribution of the total phenolic content in EVOOs selected in each crop season. Figure S2. PLS-DA scores plot relative to the three bitterness categories. Figure S3. PLS-DA scores plot relative to the three pungency categories (a) and the “Medium” versus “Robust” categories (b). Figure S4. Violin plot for the concentration of secoiridoids (mg/kg) with significant differences between pungency groups. Threshold concentrations are included for discrimination of “Medium” and “Robust”.
Author Contributions
Conceptualization, S.T.-R., M.C.-S., and F.P.-C.; methodology, S.T.-R., F.B.-P., M.C.-S., J.M.P.-V., and F.P.-C.; software, M.C.-S.; validation, S.T.-R., F.B.-P., and F.P.-C.; formal analysis, S.T.-R., F.B.-P., M.C.-S., J.M.P.-V., and F.P.-C.; investigation, S.T.-R. and F.B.-P.; resources, J.M.P.-V.; writing—original draft, S.T.-R. and F.P.-C.; writing—review and editing, S.T.-R., J.M.P.-V., and F.P.-C.; visualization, F.P.-C.; supervision, F.P.-C.; project administration, F.P.-C.; funding acquisition, F.P.-C. All authors have read and agreed to the published version of the manuscript.
Funding
This research was funded jointly by the Spanish Ministerio de Ciencia e Innovación (PID2019-111373RB-I00 and PID2022-137313OBI00 projects), the European Regional Development Fund/European Social Fund (“Investing in your future”).
Institutional Review Board Statement
Ethical review and approval were waived for this study as it involved professional tasters and the analysis of extra virgin olive oils that undergone all legal controls.
Informed Consent Statement
Participants gave informed consent via the statement “I am aware that my responses are confidential, and I agree to participate in this survey” where an affirmative reply was required to enter the survey. They were able to withdraw from the survey at any time without giving a reason. The products tested, extra virgin olive oils, were safe for consumption.
Data Availability Statement
The original contributions presented in the study are included in the article/Supplementary Material, further inquiries can be directed to the corresponding author.
Acknowledgments
This research was supported by the collaboration agreement between University of Cordoba and the Spanish Association of Olive Municipalities (AEMO). The authors also thank Evooleum and all tasters involved in the jury of this quality competition in the 2022 and 2023 editions. Consortium for Biomedical Research in Frailty and Healthy Ageing (CIBERFES) is an initiative of Carlos III Institute of Health.
Conflicts of Interest
The authors declare that they have no known competing financial interests or personal relationships that could have appeared to influence the work reported in this paper.
References
- Estruch, R.; Ros, E.; Salas-Salvadó, J.; Covas, M.-I.; Corella, D.; Arós, F.; Gómez-Gracia, E.; Ruiz-Gutiérrez, V.; Fiol, M.; Lapetra, J.; et al. Primary prevention of cardiovascular disease with a mediterranean diet supplemented with extra-virgin olive oil or nuts. N. Engl. J. Med. 2018, 378, e34. [Google Scholar] [CrossRef] [PubMed]
- Emma, M.R.; Augello, G.; Di Stefano, V.; Azzolina, A.; Giannitrapani, L.; Montalto, C. Potential Uses of Olive Oil Secoiridoids for the Prevention and Treatment of Cancer: A Narrative Review of Preclinical Studies. Int. J. Mol. Sci. 2021, 22, 1234. [Google Scholar] [CrossRef] [PubMed]
- European Commission. Commission Regulation (EU) No 1018/2013 establishing a list of permitted health claims made on foods other than those referring to the reduction of disease risk and to children’s development and health. Off. J. Eur. Union. 2013, L282, 43–45. [Google Scholar]
- European Commission. Commission Delegated Regulation (EU) 2022/2104 of 29 July 2022 supplementing Regulation (EU) No 1308/2013 of the European Parliament and of the Council as Regards Marketing Standards for Olive Oil, and Repealing Commission Regulation (EEC) No 2568/91 and Commission Implementing Regulation (EU) No 29/2012. Off. J. Eur. Union. 2022, L284, 1–22. Available online: https://eur-lex.europa.eu/legal-content/EN/TXT/PDF/?uri=CELEX:32022R2104 (accessed on 13 January 2025).
- IOC. COI/T.20/Doc. No 15/Rev. 11. Sensory Analysis of Olive Oil-Method for the Organoleptic Assessment of Virgin Olive Oil. International Olive Council Website. 2024. Available online: https://www.internationaloliveoil.org/what-we-do/chemistry-standardisation-unit/standards-and-methods/ (accessed on 13 January 2025).
- Kottaridi, K.; Milionis, A.; Demopoulos, V.; Rigakou, A.; Nikolaidis, V. A regression analysis method for the prediction of olive oil sensory attributes. J. Agric. Food Res. 2023, 12, 100555. [Google Scholar] [CrossRef]
- Ríos-Reina, R.; Aparicio-Ruiz, R.; Morales, M.T.; García-González, D.L. Contribution of specific volatile markers to green and ripe fruity attributes in extra virgin olive oils studied with three analytical methods. Food Chem. 2023, 399, 133942. [Google Scholar] [CrossRef]
- Cecchi, L.; Migliorini, M.; Mulinacci, N. Virgin Olive Oil Volatile Compounds: Composition, Sensory Characteristics, Analytical Approaches, Quality Control, and Authentication. J. Agric. Food Chem. 2021, 69, 2013–2040. [Google Scholar] [CrossRef]
- da Costa, J.R.O.; Dal Bosco, S.M.; de Souza Ramos, R.C.; Machado, I.C.K.; Garavaglia, J.; Villasclaras, S.S. Determination of volatile compounds responsible for sensory characteristics from Brazilian extra virgin olive oil using HS-SPME/GC-MS direct method. J. Food Sci. 2020, 85, 3764–3775. [Google Scholar] [CrossRef]
- Zhou, Q.; Liu, S.; Liu, Y.; Song, H. Comparative Analysis of Volatiles of 15 Brands of Extra-Virgin Olive Oils Using Solid-Phase Micro-Extraction and Solvent-Assisted Flavor Evaporation. Molecules. 2019, 24, 1512. [Google Scholar] [CrossRef]
- Tomé-Rodríguez, S.; Ledesma-Escobar, C.A.; Penco-Valenzuela, J.M.; Calderón-Santiago, M.; Priego-Capote, F. Metabolic patterns in the lipoxygenase pathway associated to fruitiness attributes of extra virgin olive oil. J. Food Compos. Anal. 2022, 109, 104478. [Google Scholar] [CrossRef]
- Teixeira, G.G.; Dias, L.G.; Rodrigues, N.; Marx, Í.M.G.; Veloso, A.C.A.; Pereira, J.A.; Peres, A.M. Application of a lab-made electronic nose for extra virgin olive oils commercial classification according to the perceived fruitiness intensity. Talanta 2021, 226, 122122. [Google Scholar] [CrossRef] [PubMed]
- Beltrán, G.; Ruano, M.T.; Jiménez, A.; Uceda, M.; Aguilera, M.P. Evaluation of virgin olive oil bitterness by total phenol content analysis. Eur. J. Lipid Sci. Technol. 2007, 108, 193–197. [Google Scholar] [CrossRef]
- Bendini, A.; Cerretani, L.; Carrasco-Pancorbo, A.; Gómez-Caravaca, A.; Segura-Carretero, A.; Fernández-Gutiérrez, A.; Lercker, G. Phenolic Molecules in Virgin Olive Oils: A Survey of Their Sensory Properties, Health Effects, Antioxidant Activity and Analytical Methods. An Overview of the Last Decade Alessandra. Molecules 2007, 12, 1679–1719. [Google Scholar] [CrossRef]
- Gawel, R.; Rogers, D.A.G. The relationship between total phenol concentration and the perceived style of extra virgin olive oil. Grasas y Aceites 2009, 60, 134–138. [Google Scholar] [CrossRef]
- Inarejos-Garcia, A.M.; Androulaki, A.; Salvador, M.D.; Fregapane, G.; Tsimidou, M.Z. Discussion on the objective evaluation of virgin olive oil bitterness. Food Res. Int. 2009, 42, 279–284. [Google Scholar] [CrossRef]
- Andrewes, P.; Busch, J.L.H.C.; De Joode, T.; Groenewegen, A.; Alexandre, H. Sensory properties of virgin olive oil polyphenols: Identification of deacetoxy-ligstroside aglycon as a key contributor to pungency. J. Agric. Food Chem. 2003, 51, 1415–1420. [Google Scholar] [CrossRef]
- Beauchamp, G.K.; Keast, R.S.J.; Morel, D.; Lin, J.; Pika, J.; Han, Q.; Lee, C.H.; Smith, A.B.; Breslin, P.A. Ibuprofen-like activity in extra-virgin olive oil. Nature 2005, 437, 45–46. [Google Scholar] [CrossRef]
- Peyrot des Gachons, C.; Uchida, K.; Bryant, B.; Shima, A.; Sperry, J.B.; Dankulich-Nagrudny, L.; Tominaga, M.; Smith, A.B.; Beauchamp, G.K.; Breslin, P.A. Unusual Pungency from Extra-Virgin Olive Oil Is Attributable to Restricted Spatial Expression of the Receptor of Oleocanthal. J. Neurosci. 2011, 31, 999–1009. [Google Scholar] [CrossRef]
- Demopoulos, V.; Karkoula, E.; Magiatis, P.; Melliou, E.; Kotsiras, A.; Mouroutoglou, C. Correlation of oleocanthal and oleacein concentration with pungency and bitterness in “koroneiki” virgin olive oil. Acta Hortic. 2015, 1099, 219–224. [Google Scholar] [CrossRef]
- Gutiérrez-Rosales, F.; Ríos, J.J.; Gómez-Rey, M.L. Main Polyphenols in the Bitter Taste of Virgin Olive Oil. Structural Confirmation by On-Line High-Performance Liquid Chromatography Electrospray Ionization Mass Spectrometry. J. Agric. Food Chem. 2003, 51, 6021–6025. [Google Scholar] [CrossRef]
- Mateos, R.; Cert, A.; Pérez-Camino, M.C.; García, J.M. Evaluation of virgin olive oil bitterness by quantification of secoiridoid derivatives. J. Am. Oil Chem. Soc. 2004, 81, 71–75. [Google Scholar] [CrossRef]
- Siliani, S.; Mattei, A.; Innocenti, L.B.; Zanoni, B. Bitter taste and phenolic compounds in extra virgin olive oil: An empirical relationship. J. Food Qual. 2006, 29, 431–441. [Google Scholar] [CrossRef]
- Castillo-Luna, A.; Criado-Navarro, I.; Ledesma-Escobar, C.A.; López-Bascón, M.A.; Priego-Capote, F. The decrease in the health benefits of extra virgin olive oil during storage is conditioned by the initial phenolic profile. Food Chem. 2021, 336, 127730. [Google Scholar] [CrossRef] [PubMed]
- Hrncirik, K.; Fritsche, S. Comparability and reliability of different techniques for the determination of phenolic compounds in virgin olive oil. Eur. J. Lipid Sci. Technol. 2004, 106, 540–549. [Google Scholar] [CrossRef]
- Sánchez de Medina, V.; Miho, H.; Melliou, E.; Magiatis, P.; Priego-Capote, F.; Luque de Castro, M.D. Quantitative method for determination of oleocanthal and oleacein in virgin olive oils by liquid chromatography–tandem mass spectrometry. Talanta 2017, 162, 24–31. [Google Scholar] [CrossRef]
- Robin, X.; Turck, N.; Hainard, A.; Tiberti, N.; Lisacek, F.; Sanchez, J.-C.; Müller, M. pROC: An open-source package for R and S+ to analyze and compare ROC curves. BMC Bioinformatics. 2011, 12, 77. [Google Scholar] [CrossRef]
- Prata, R.; Pereira, J.A.; Rodrigues, N.; Dias, L.G.; Veloso, A.C.A.; Casal, S.; Peres, A.M. Olive Oil Total Phenolic Contents and Sensory Sensations Trends during Oven and Microwave Heating Processes and Their Discrimination Using an Electronic Tongue. J. Food Qual. 2018, 2018, 1–10. [Google Scholar] [CrossRef]
- Cui, M.; Chen, B.; Xu, K.; Rigakou, A.; Diamantakos, P.; Melliou, E.; Logothetis, D.E.; Magiatis, P. Activation of specific bitter taste receptors by olive oil phenolics and secoiridoids. Sci. Rep. 2021, 11, 22340. [Google Scholar] [CrossRef]
- Diamantakos, P.; Velkou, A.; Killday, K.B.; Gimisis, T.; Melliou, E.; Magiatis, P. Oleokoronal and oleomissional: New major phenolic ingredients of extra virgin olive oil. Olivae 2015, 122, 22–33. [Google Scholar]
- Servili, M.; Sordini, B.; Esposto, S.; Urbani, S.; Veneziani, G.; Di Maio, I.; Selvaggini, R.; Taticchi, A. Biological activities of phenolic compounds of extra virgin olive oil. Antioxidants 2014, 3, 1–23. [Google Scholar] [CrossRef]
Disclaimer/Publisher’s Note: The statements, opinions and data contained in all publications are solely those of the individual author(s) and contributor(s) and not of MDPI and/or the editor(s). MDPI and/or the editor(s) disclaim responsibility for any injury to people or property resulting from any ideas, methods, instructions or products referred to in the content. |
© 2025 by the authors. Licensee MDPI, Basel, Switzerland. This article is an open access article distributed under the terms and conditions of the Creative Commons Attribution (CC BY) license (https://creativecommons.org/licenses/by/4.0/).