

Authentication of Indian Honey Based on Carbon Stable Isotope Ratio Analysis—Verification of Indian Regulatory Criteria

Abstract
1. Introduction
2. Materials and Methods
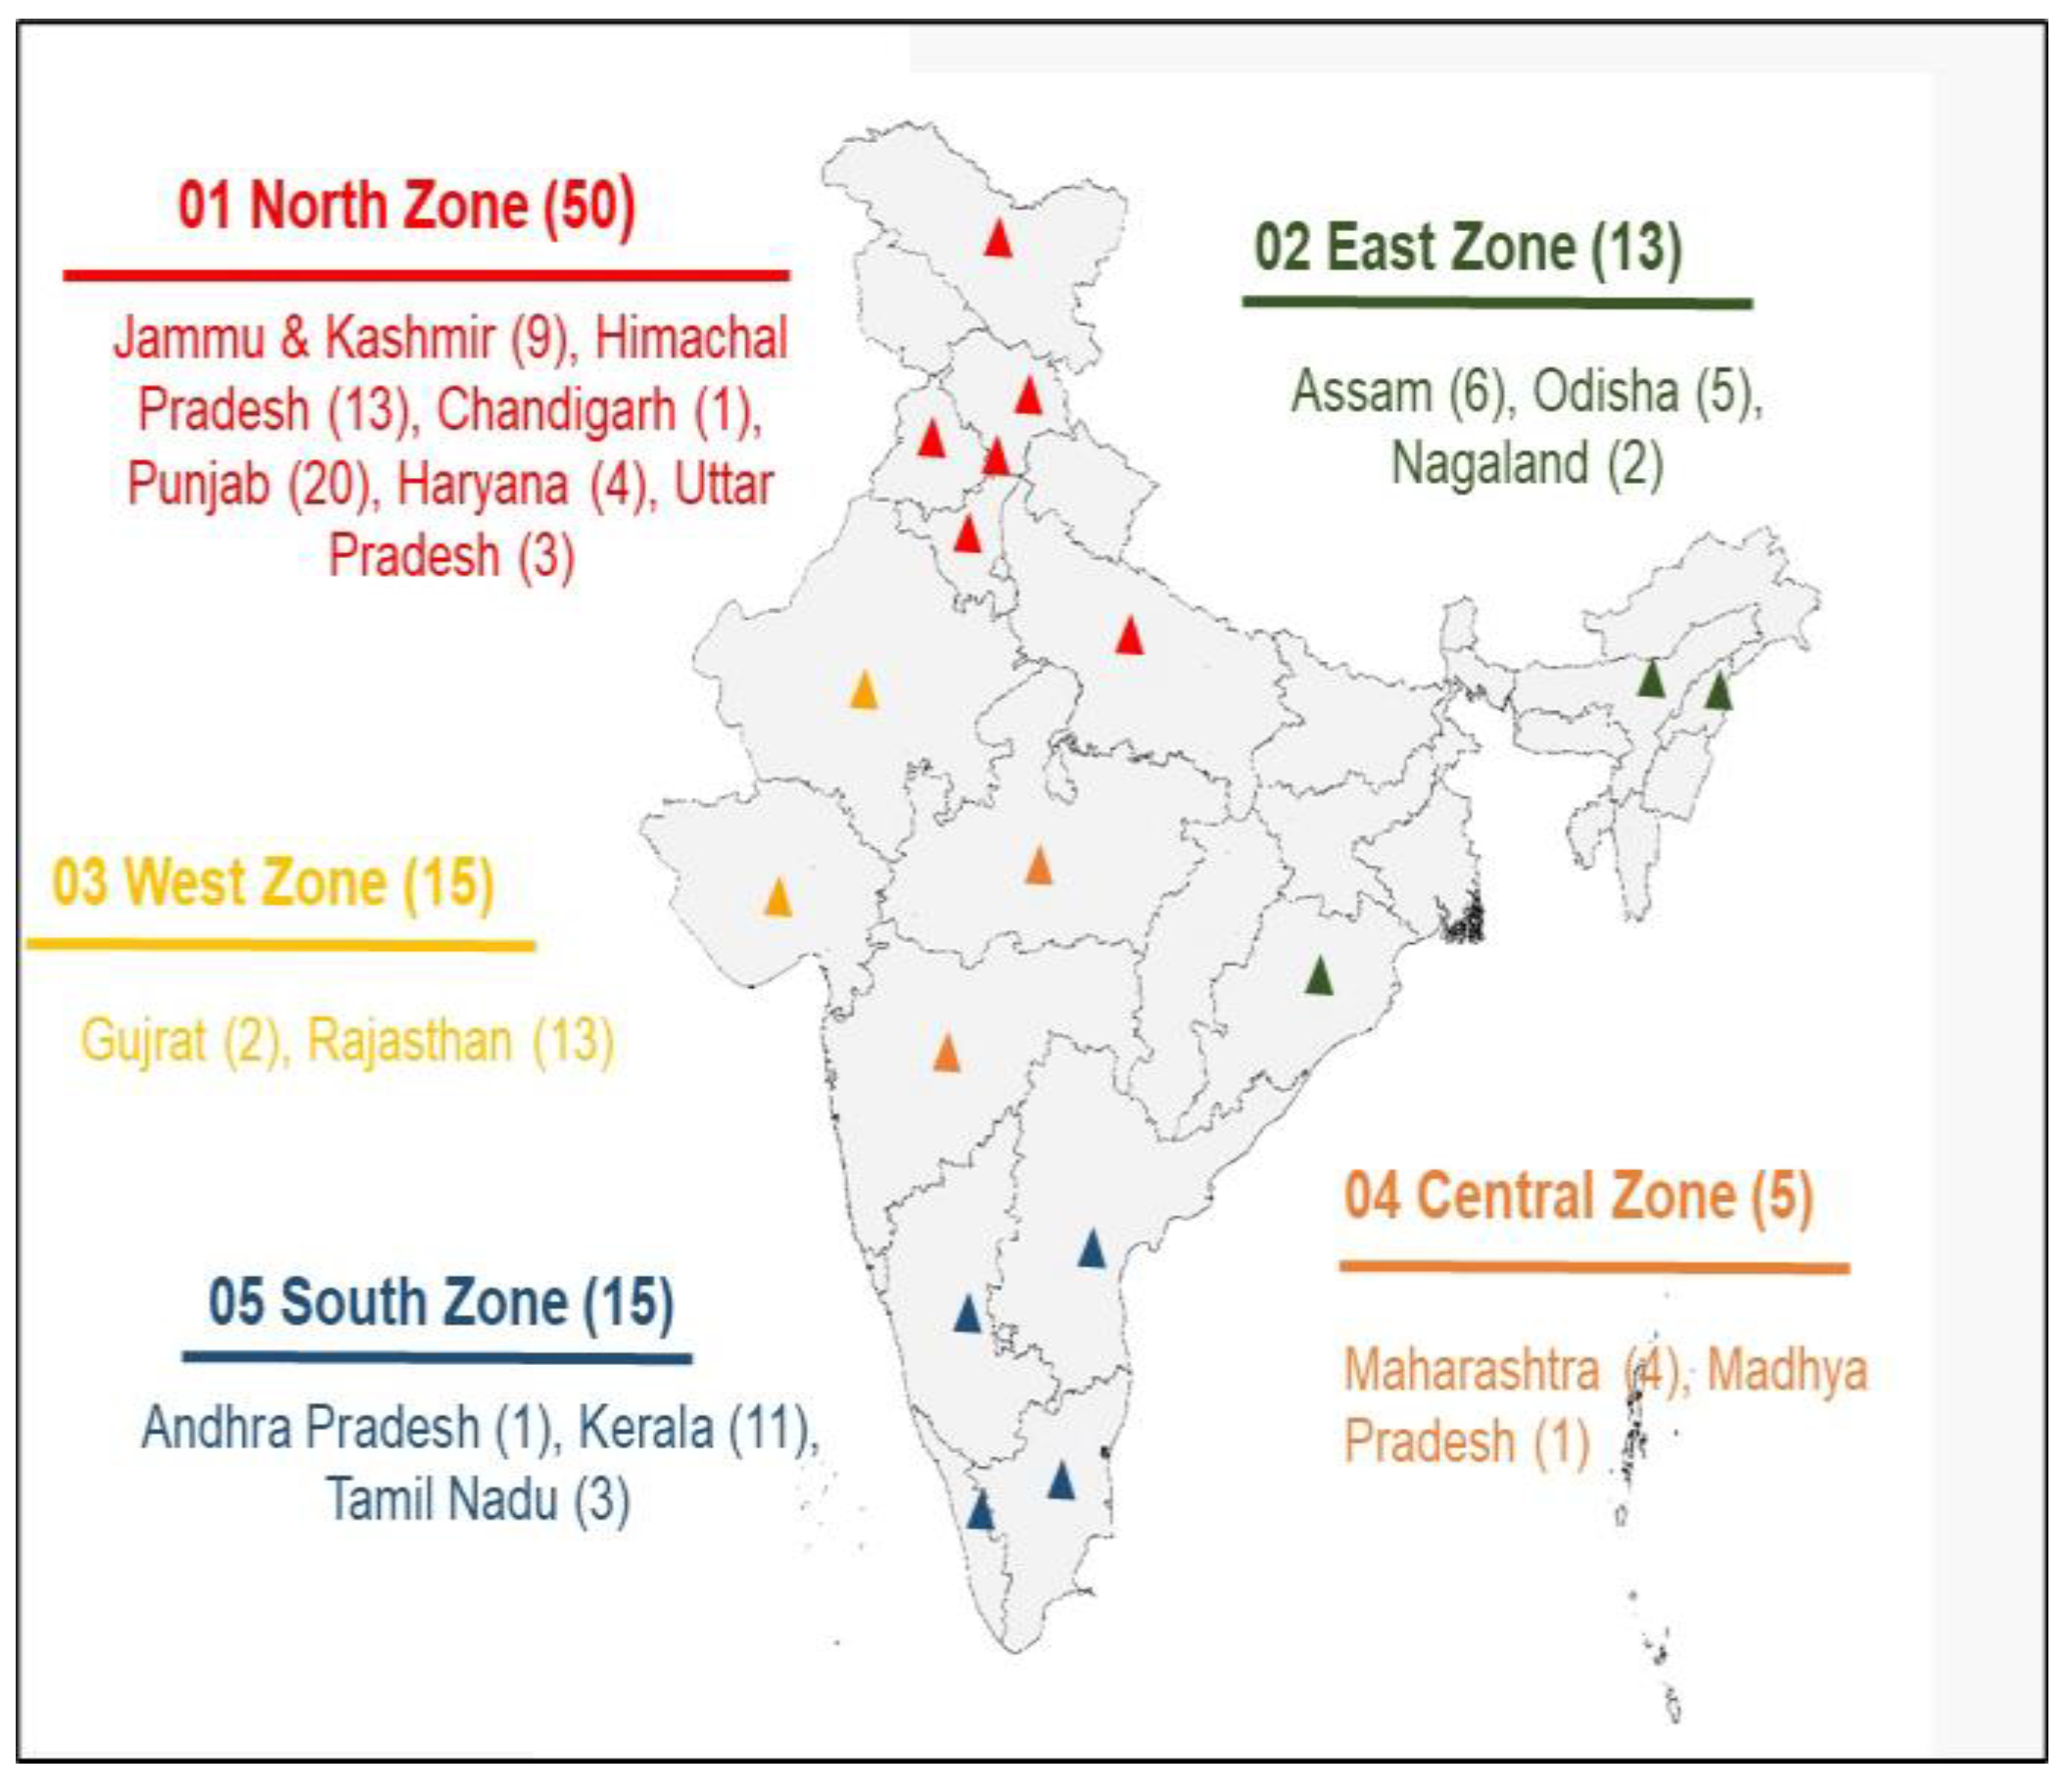
2.1. Honey Samples
2.2. Reference Materials and Reagents
2.3. Instrumentation and Measurement
2.3.1. EA-IRMS
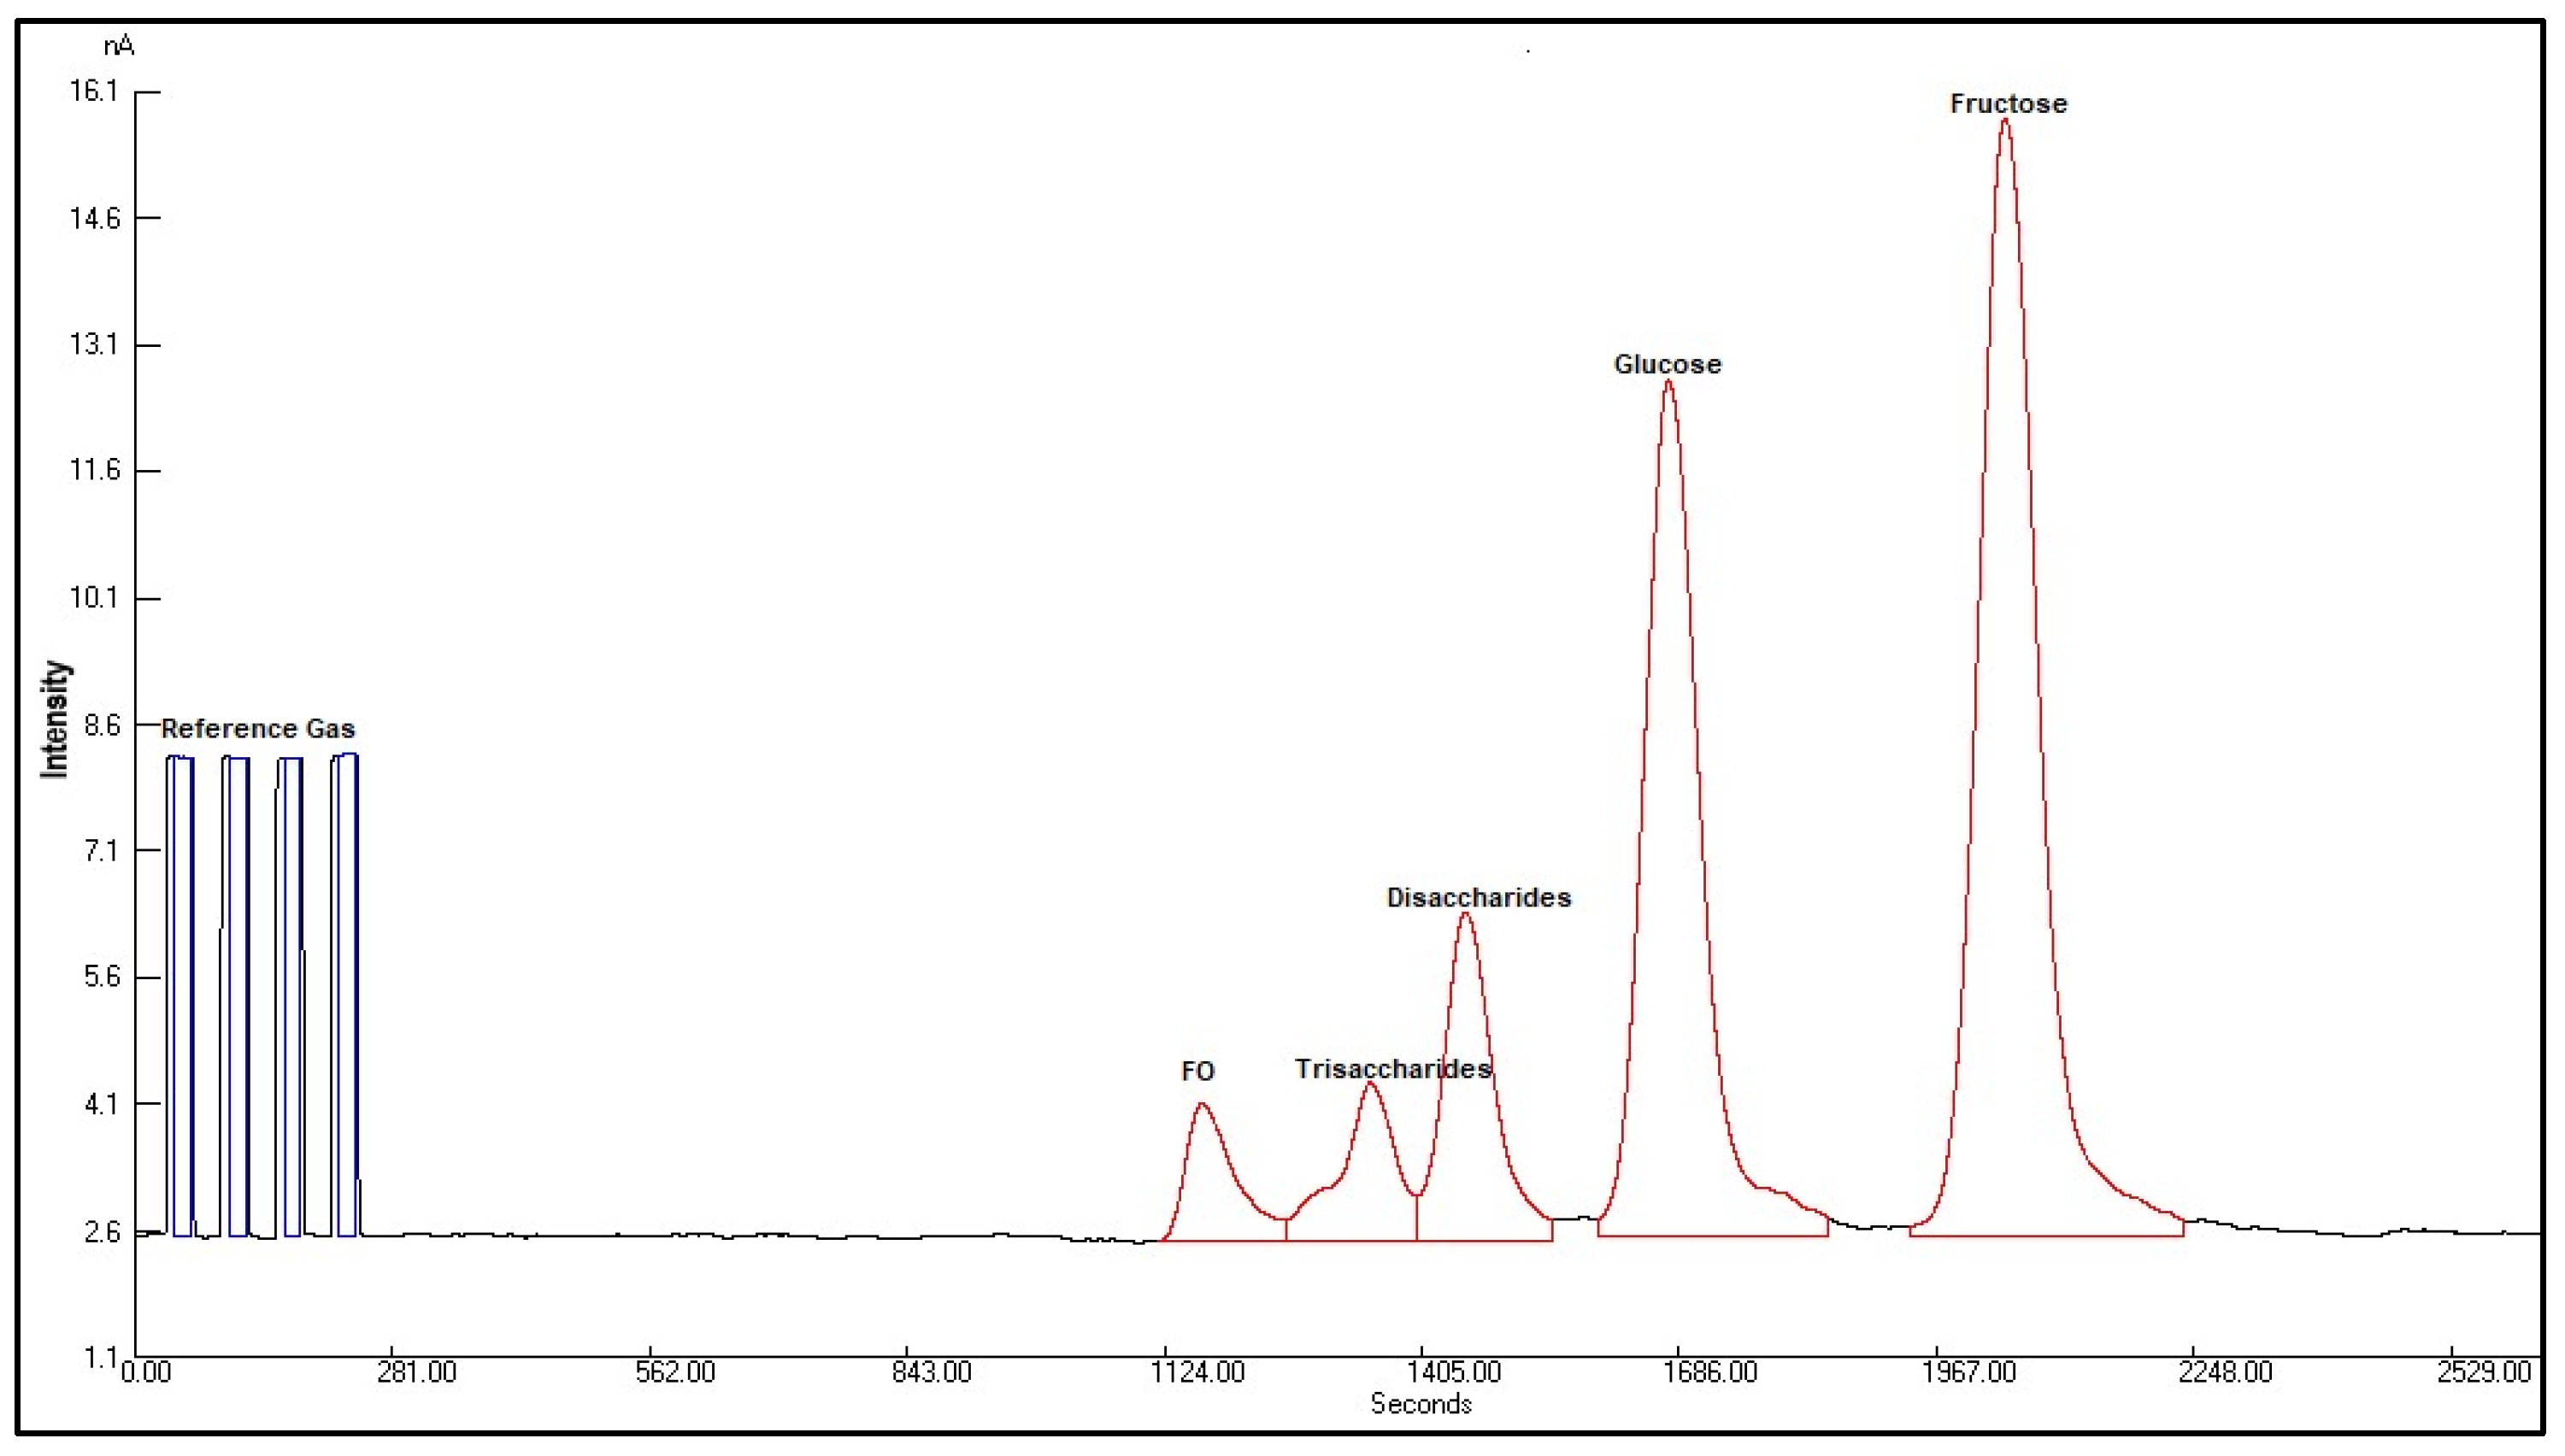
2.3.2. LC-IRMS
2.4. Sample Preparation and Analysis
2.4.1. δ13C Value of Honey and Protein by EA-IRMS
2.4.2. δ13C Value of Sugars in Honey by LC-IRMS
2.5. Stable Carbon Isotopic Value-Based Criteria for Authentic Honey as Defined by the Food Safety and Standards Authority of India (FSSAI) Under FSSR 2018 [25]
| Sr. No. | Parameters | Criteria |
| 1 | Δδ13CP-H ‰ | ≥−1 |
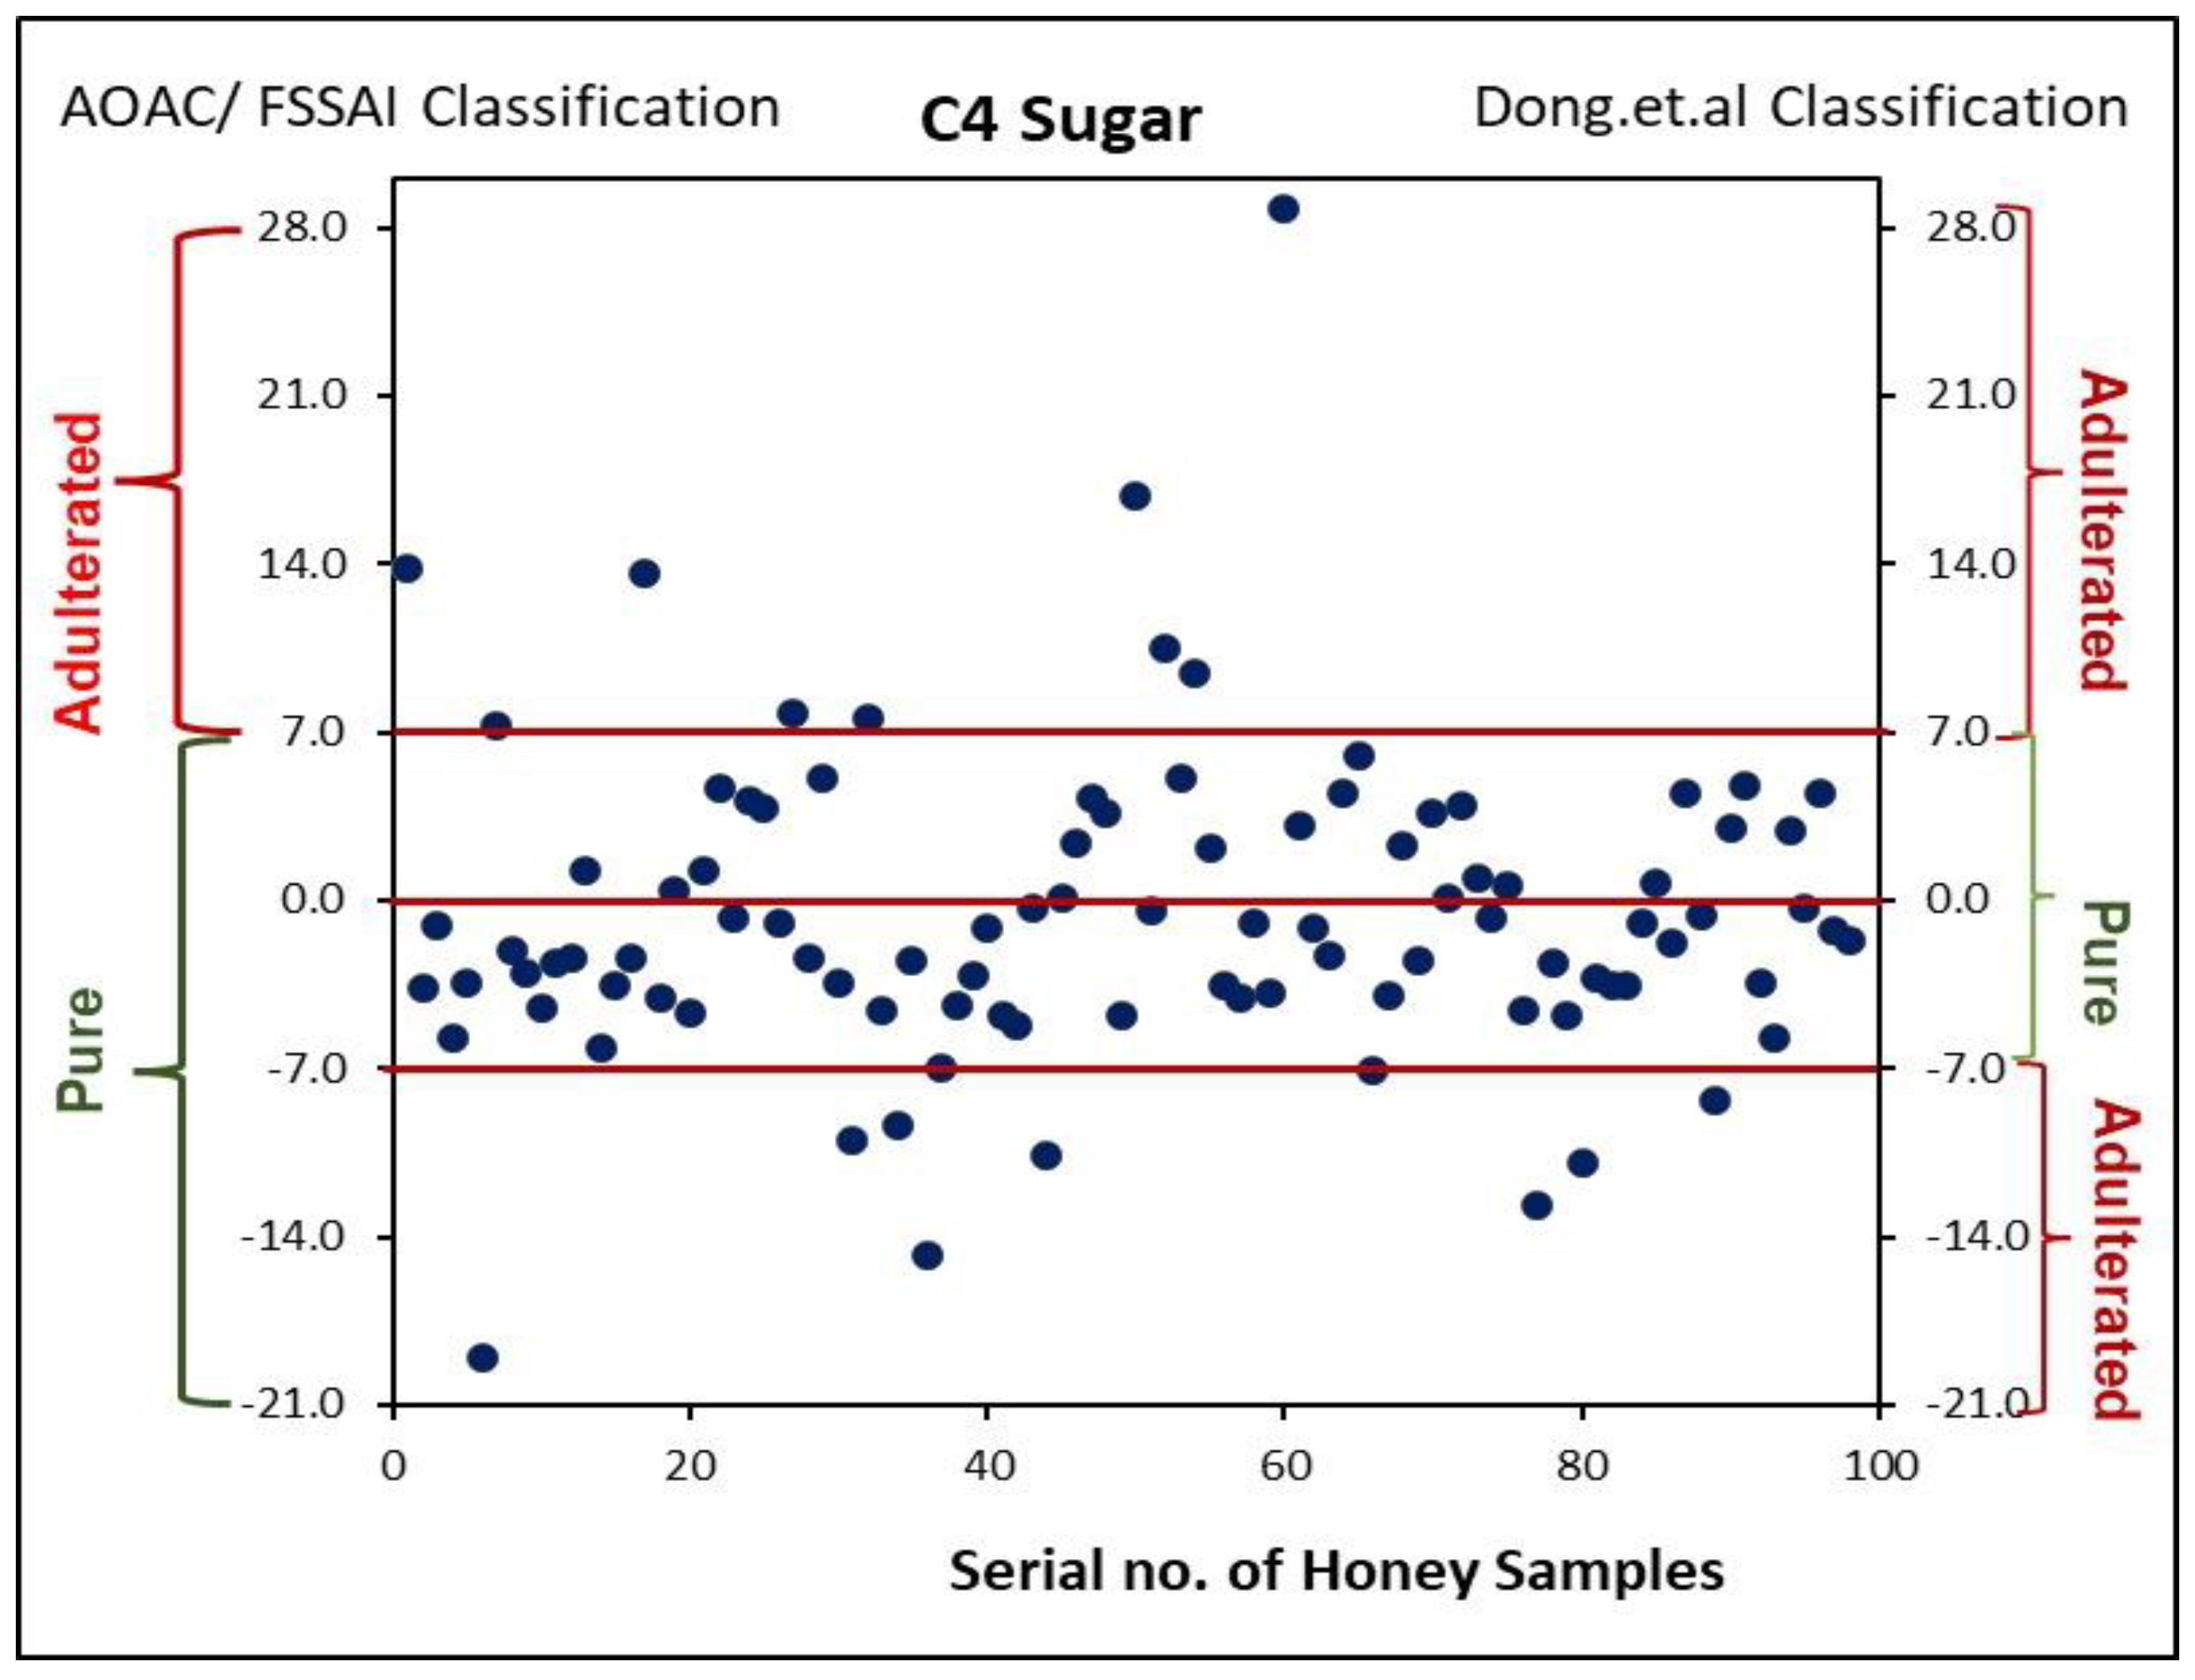
| 2 | C4 Sugar %, max | 7.0 |
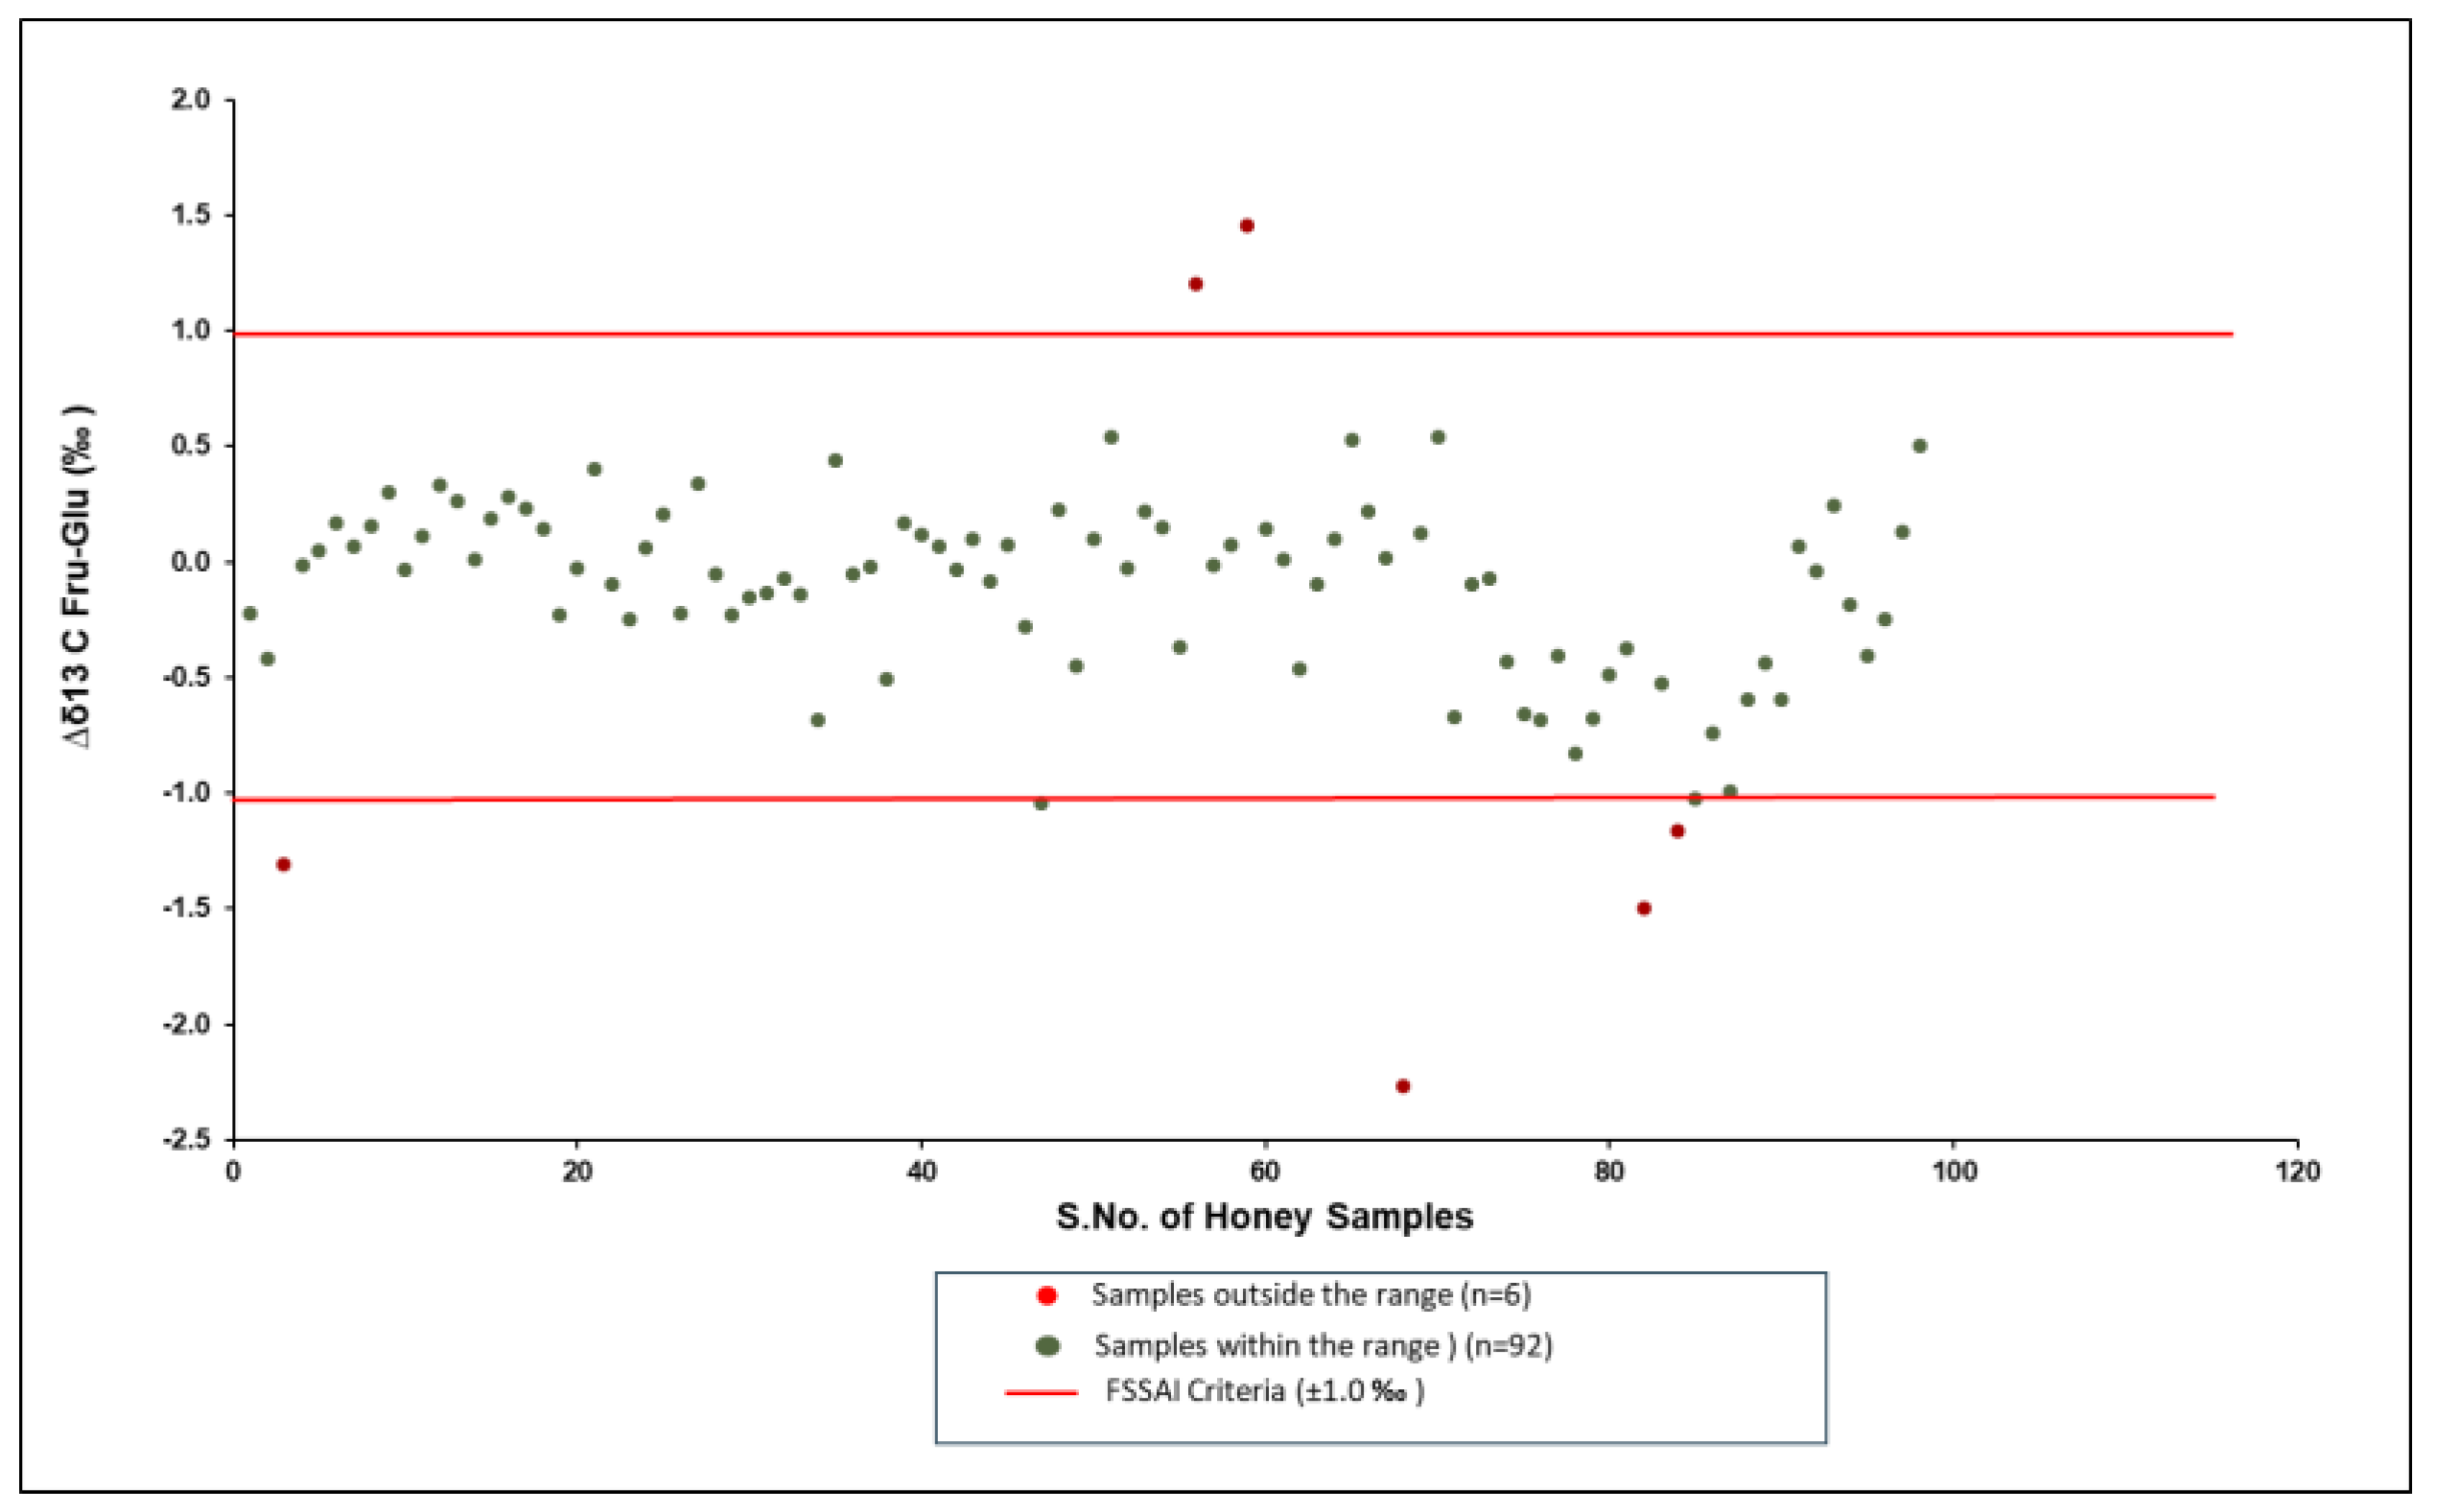
| 3 | Δδ13CFru-Glu ‰ | ±1.0 |
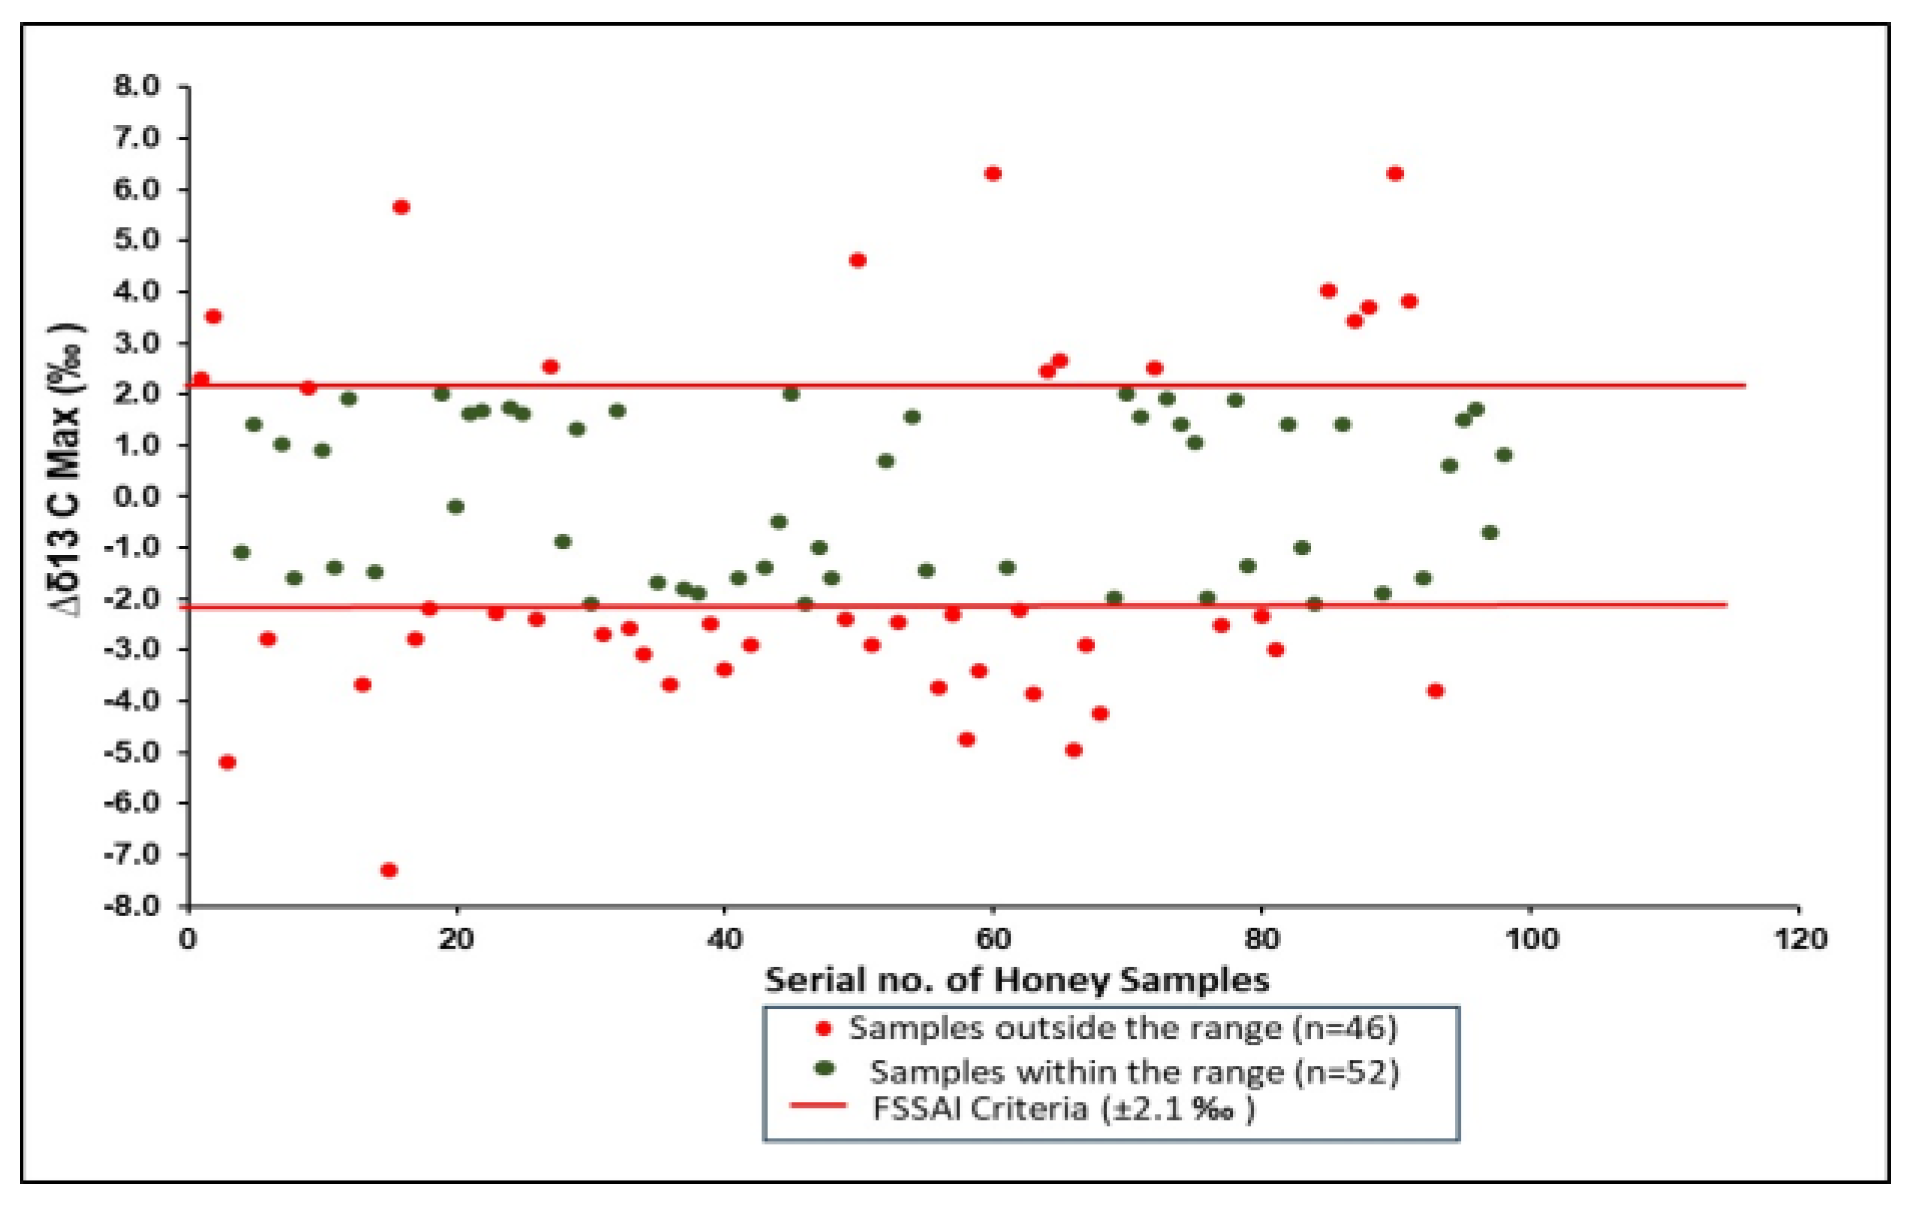
| 4 | Δδ13Cmax ‰ | ±2.1 |
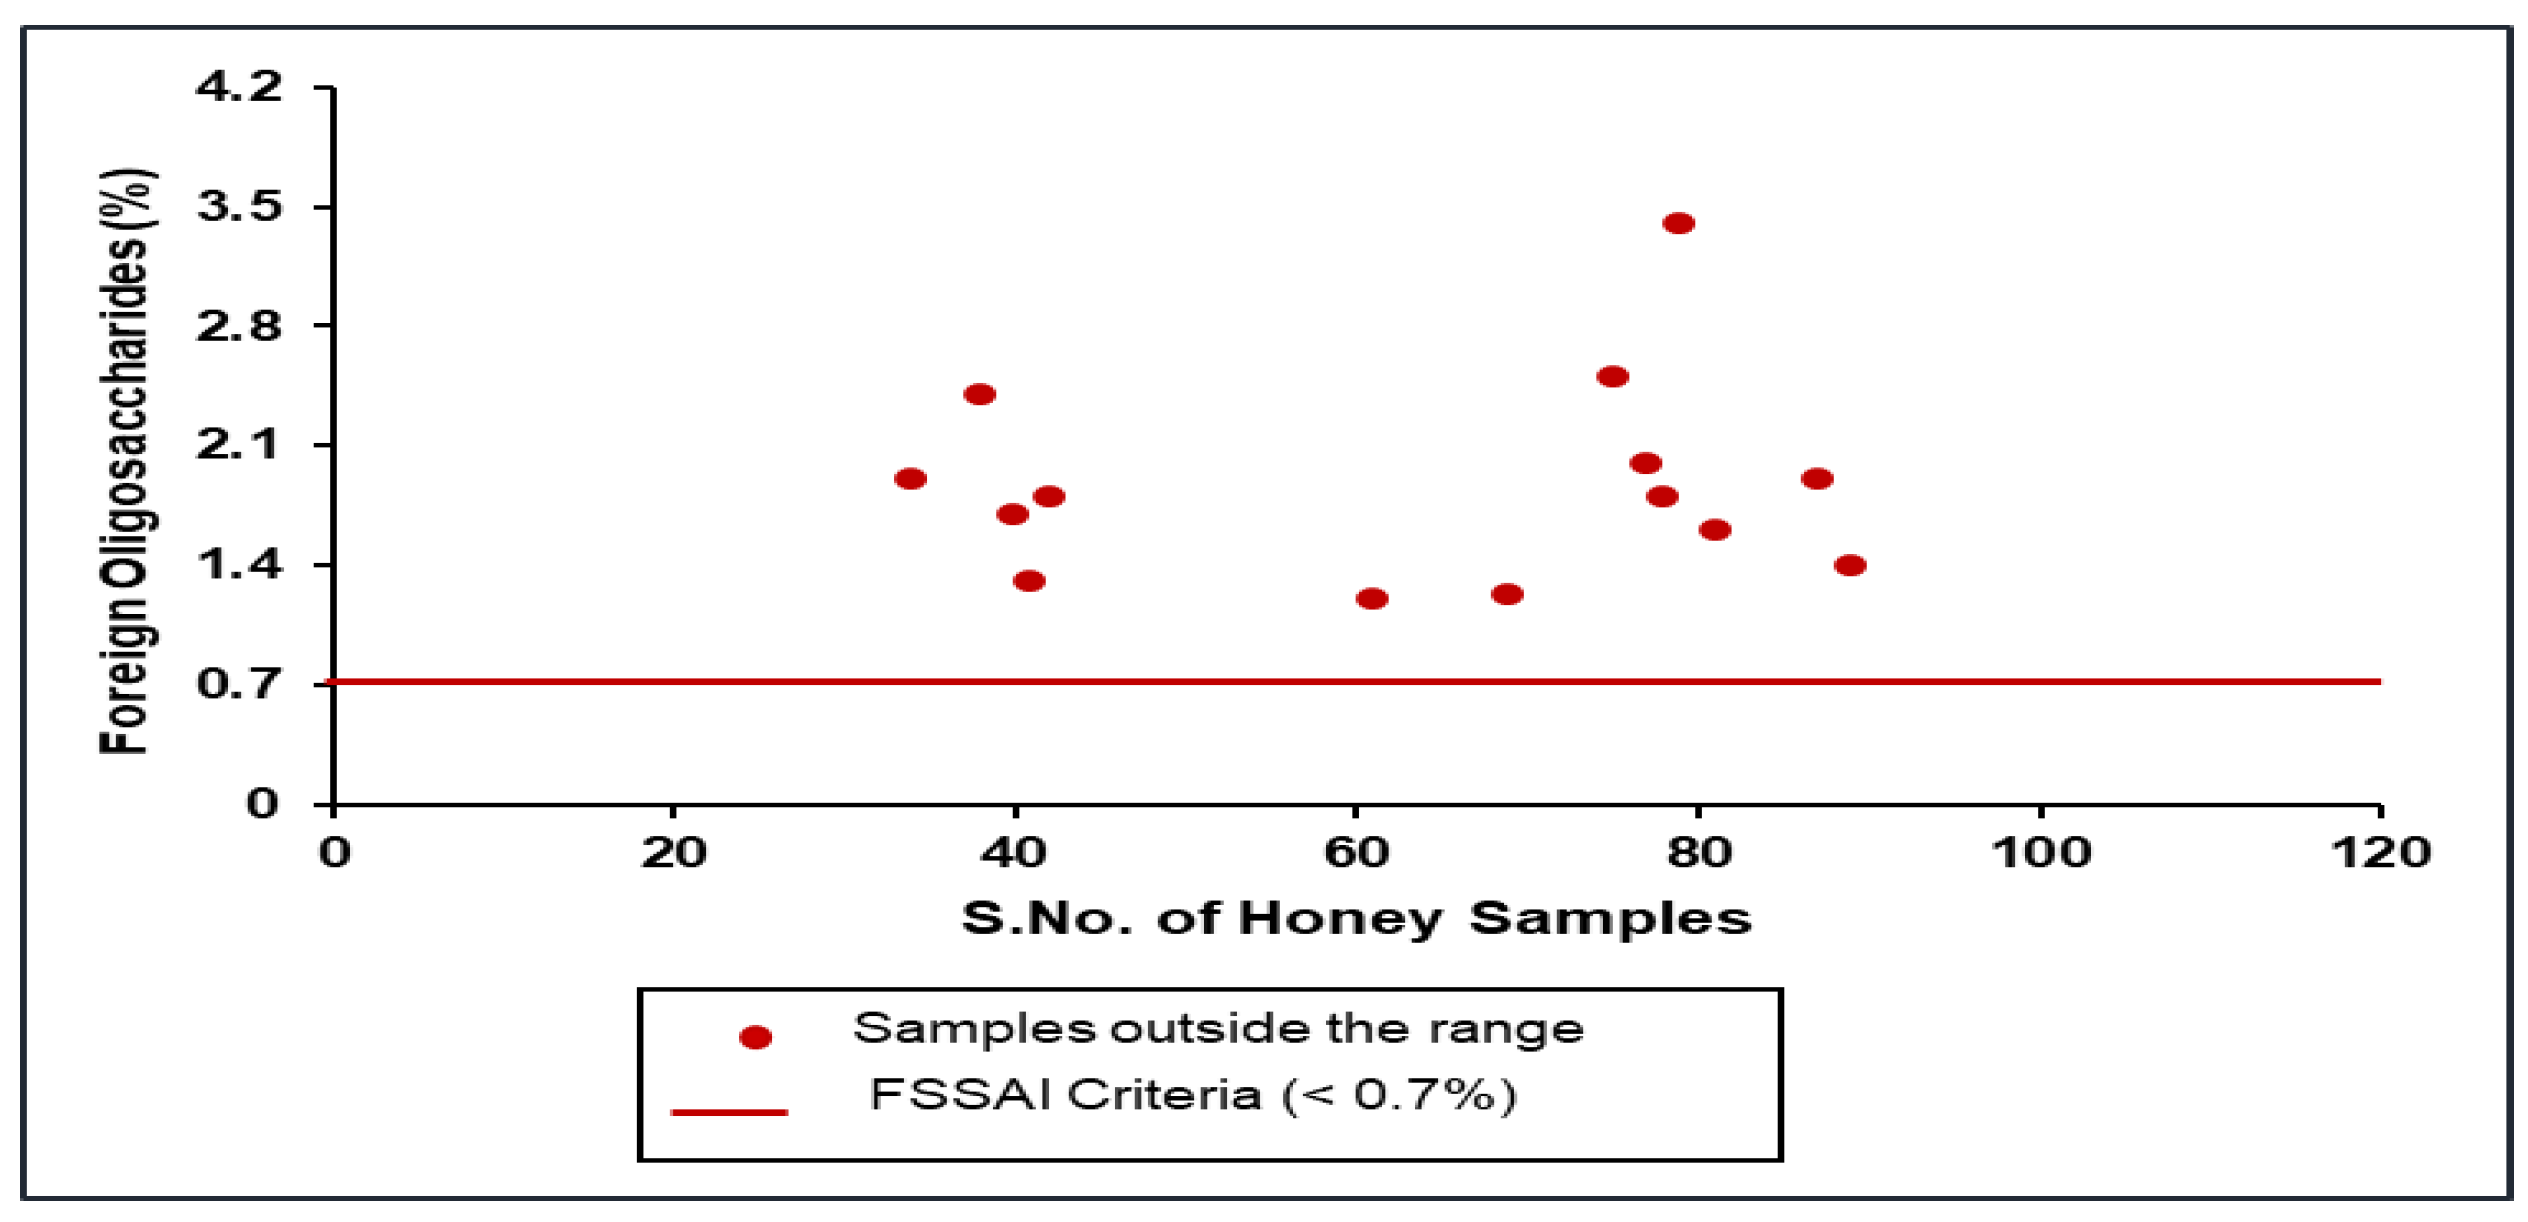
| 5 | Foreign oligosaccharides, percent (%) peak area, max | 0.7 |
3. Results and Discussion
3.1. δ13C Value for Honey by EA-IRMS
3.2. Difference in δ13C Values of Protein and Honey (Δδ13CP-H) and C4 Sugar by EA-IRMS
3.3. Δδ13CFru-Glu by LC-IRMS
3.4. Δδ13Cmax by EA/LC-IRMS
3.5. Correlation Between δ13C Values by EA-IRMS (Δδ13CP-H) and LC-IRMS (Δδ13Cmax, FO)
3.6. Foreign Oligosaccharide by LC-IRMS
4. Conclusions
Supplementary Materials
Author Contributions
Funding
Institutional Review Board Statement
Informed Consent Statement
Data Availability Statement
Acknowledgments
Conflicts of Interest
References
- Terrab, A.; González, A.G.; Díez, M.J.; Heredia, F.J. Characterisation of Moroccan unifloral honeys using multivariate analysis. Eur. Food Res. Technol. 2003, 218, 88–95. [Google Scholar] [CrossRef]
- Chen, L.; Xue, X.; Ye, Z.; Zhou, J.; Chen, F.; Zhao, J. Determination of Chinese honey adulterated with high fructose corn syrup by near infrared spectroscopy. Food Chem. 2011, 128, 1110–1114. [Google Scholar] [CrossRef]
- Cabanero, A.I.; Recio, J.L.; Ruperez, M. Liquid chromatography coupled to isotope ratio mass spectrometry: A new perspective on honey adulteration detection. J. Agric. Food Chem. 2006, 54, 9719–9727. [Google Scholar] [CrossRef] [PubMed]
- Padovan, G.J.; De Jong, D.; Rodrigues, L.P.; Marchini, J.S. Detection of adulteration of commercial honey samples by the 13C/12C isotopic ratio. Food Chem. 2003, 82, 633–636. [Google Scholar] [CrossRef]
- Padovan, G.J.; Rodrigues, L.P.; Leme, I.A.; De Jong, D.; Marchini, J.S. Presence of C4 Sugars in Honey Samples Detected by the Carbon Isotope Ratio Measured by IRMS. Eurasian J. Anal. Chem. 2007, 2, 134. [Google Scholar]
- Ruiz-Matute, A.I.; Weiss, M.; Sammataro, D.; Finely, J.; Sanz, M.L. Carbohydrate composition of high-fructose corn syrups (HFCS) used for bee feeding: Effect on honey composition. J. Agric. Food Chem. 2010, 58, 7317–7322. [Google Scholar] [CrossRef] [PubMed]
- Földhádzi, G. Analysis and Quantitation of Sugars in Honey of Different Botanical Origin Using High Performance Liquid Chromatography. 1994. Available online: https://www.cabidigitallibrary.org/doi/full/10.5555/19970200094 (accessed on 25 September 2024).
- Ruiz-Matute, A.I.; Soria, A.C.; Martínez-Castro, I.; Sanz, M.L. A new methodology based on GC−MS to detect honey adulteration with commercial syrups. J. Agric. Food Chem. 2007, 55, 7264–7269. [Google Scholar] [CrossRef]
- Karabagias, I.K.; Casiello, G.; Kontakos, S.; Louppis, A.P.; Longobardi, F.; Kontominas, M.G. Investigating the impact of botanical origin and harvesting period on carbon stable isotope ratio values (13C/12C) and different parameter analysis of Greek unifloral honeys: A chemometric approach for correct botanical discrimination. Int. J. Food Sci. Technol. 2016, 51, 2460–2467. [Google Scholar] [CrossRef]
- Cordella, C.; Militão, J.S.; Clément, M.C.; Drajnudel, P.; Cabrol-Bass, D. Detection and quantification of honey adulteration via direct incorporation of sugar syrups or bee-feeding: Preliminary study using high-performance anion exchange chromatography with pulsed amperometric detection (HPAEC-PAD) and chemometrics. Anal. Chim. Acta 2005, 531, 239–248. [Google Scholar] [CrossRef]
- Herpai, Z.; Szigeti, J.; Csapó, J. A rapid and sensitive method for the determination of high-fructose corn syrup (HFCS) in honey. Acta Univ. Sapientiae Aliment. 2013, 6, 5–13. [Google Scholar]
- Wang, S.; Guo, Q.; Wang, L.; Lin, L.; Shi, H.; Cao, H.; Cao, B. Detection of honey adulteration with starch syrup by high performance liquid chromatography. Food Chem. 2015, 172, 669–674. [Google Scholar] [CrossRef] [PubMed]
- Li, S.; Zhang, X.; Shan, Y.; Su, D.; Ma, Q.; Wen, R.; Li, J. Qualitative and quantitative detection of honey adulterated with high-fructose corn syrup and maltose syrup by using near-infrared spectroscopy. Food Chem. 2017, 218, 231–236. [Google Scholar] [CrossRef] [PubMed]
- Ždiniaková, T.; Loerchner, C.; De, R.O.; Dimitrova, T.; Kaklamanos, G.; Breidbach, A.; Maquet, A. EU Coordinated Action to Deter Certain Fraudulent Practices in the Honey Sector. JRC Publications Repository. 2023. Available online: https://joint-research-centre.ec.europa.eu (accessed on 5 October 2024).
- White, J.W., Jr.; Doner, L.W. Mass spectrometric detection of high-fructose corn sirup in honey by use of 13C/12C ratio: Collaborative study. J. Assoc. Off. Anal. Chem. 1978, 61, 746–750. [Google Scholar] [CrossRef]
- White, J.W., Jr.; Doner, L.W. The 13C/12C ratio in honey. J. Apic. Res. 1978, 17, 94–99. [Google Scholar] [CrossRef]
- Winkler, F.J.; Schmidt, H.L. Scope of the application of 13C isotope mass spectrometry in Food Analysis. Z. Fuer Lebensm.-Unters. Und-Forsch. 1980, 171, 85–94. [Google Scholar] [CrossRef]
- White, J.W.; Winters, K.; Peter, M.; Rossmann, A. Stable carbon isotope ratio analysis of honey: Validation of internal standard procedure for worldwide application. J. AOAC Int. 1998, 81, 610–619. [Google Scholar] [CrossRef]
- Elflein, L.; Raezke, K.P. Improved detection of honey adulteration by measuring differences between 13C/12C stable carbon isotope ratios of protein and sugar compounds with a combination of elemental analyzer-isotope ratio mass spectrometry and liquid chromatography-isotope ratio mass spectrometry δ13C-EA/LC-IRMS). Apidologie 2008, 39, 574–587. [Google Scholar] [CrossRef]
- AOAC Official. Method 998.12. C-4 plant sugars in honey. In Official Methods of Analysis of AOAC International, 16th ed.; Cunniff, P., Ed.; AOAC International: Gaithersburg, MD, USA, 1999; Volume 2, pp. 27–30. [Google Scholar]
- White, J.W.; Winters, K. Honey protein as internal standard for stable carbon isotope ratio detection of adulteration of honey. J. Assoc. Off. Anal. Chem. 1989, 72, 907–911. [Google Scholar] [CrossRef]
- White, J.W. Internal standard stable carbon isotope ratio method for determination of C-4 plant sugars in honey: Collaborative study, and evaluation of improved protein preparation procedure. J. AOAC Int. 1992, 75, 543–548. [Google Scholar] [CrossRef]
- Food and Agriculture Organization of the United Nations. Turkish Food Codex-Directive on Honey; Nr. 2012/58; Ministry of Food and Agriculture and Livestock: Ankara, Turkey, 2012. [Google Scholar]
- AGMARK Official Gazatte. Honey Grading and Marking Rules; CG-HR-E-08062024-254624, Part II, Section 3, Sub-Section I; Ministry of Agriculture and Farmers Welfare, Department of Agriculture and Farmers Welfare: New Delhi, India, 2024. [Google Scholar]
- Food Safety and Standards Authority of India. Food Safety and Standards Authority of India. Food Products Standards and Food Additives, Sweetening Agents Including Honey. In Food Safety and Standards Regulation 2011 (Amended in 2018); Version I; Food Safety and Standards Authority of India: New Delhi, India, 2023; pp. 1–16. [Google Scholar]
- True Source Certified® Standards V7.3.1, Revision Date: 1 March 2024. Available online: www.truesourcehoney.com (accessed on 24 January 2025).
- BS EN 17958:2024; Food Authenticity-Determination of the δ13C Value of Mono-(Fructose and Glucose), di-, and trisaccharides in Honey by Liquid Chromatography-Isotope Ratio Mass Spectrometry (LC-IRMS). BSI Standards Limited: London, UK, 2024; ISBN 978 0 539 22700 0.
- FSSAI Official Method of Analysis. Method for the Estimation of ∆δ13Cfru-glu, ∆δ13Cmax and Foreign Oligosaccharides in Honey by Elemental Analysis (EA)/Liquid Chromatography (LC)-Isotopic Ratio Mass Spectrometry (EA/LC-IRMS); Food Safety and Standards Authority of India: New Delhi, India, 2020. Available online: https://www.fssai.gov.in/upload/advisories/2020/06/5ef9b7b0a0591Order_Method_Cmax_Foreign_Oligosaccharides_29_06_2020.pdf (accessed on 6 May 2024).
- IS/ISO/IEC 17025-2017; General Requirements for the Competence of Testing and Calibration Laboratories. International Organization for Standardization and the International Electrotechnical Commission: Geneva, Switzerland, 2017.
- Dong, H.; Xiao, K.; Xian, Y. Isotope ratio mass spectrometry coupled to element analyzer and liquid chromatography to identify commercial honeys of various botanical types. Food Anal. Methods 2017, 10, 2755–2763. [Google Scholar] [CrossRef]
- El Hawari, K.; Al Iskandarani, M.; Jaber, F.; Ezzeddine, R.; Ziller, L.; Perini, M.; Bontempo, L.; Pellegrini, M.; Camin, F. Evaluation of honey authenticity in Lebanon by analysis of carbon stable isotope ratio using elemental analyzer and liquid chromatography coupled to isotope ratio mass spectrometry. J. Mass Spectrom. 2021, 56, e4730. [Google Scholar] [CrossRef]
- Geană, E.I.; Ciucure, C.T.; Costinel, D.; Ionete, R.E. Evaluation of honey in terms of quality and authenticity based on the general physicochemical pattern, major sugar composition and δ13C signature. Food Control 2020, 109, 106919. [Google Scholar] [CrossRef]
- Kelly, J.D.; Petisco, C.; Downey, G. Application of Fourier transform midinfrared spectroscopy to the discrimination between Irish artisanal honey and such honey adulterated with various sugar syrups. J. Agric. Food Chem. 2006, 54, 6166–6171. [Google Scholar] [CrossRef]
- Khatun, M.A.; Yoshimura, J.; Yoshida, M.; Suzuki, Y.; Huque, R.; Kelly, S.D.; Munshi, M.K. Isotopic characteristics (δ13C, δ15N, and δ18O) of honey from Bangladesh retail markets: Investigating sugar manipulation, botanical and geographical authentication. Food Chem. 2024, 435, 137612. [Google Scholar] [CrossRef] [PubMed]
- Rogers, K.M.; Sim, M.; Stewart, S.; Phillips, A.; Cooper, J.; Douance, C.; Pyne, R.; Rogers, P. Investigating C-4 sugar contamination of manuka honey and other New Zealand honey varieties using carbon isotopes. J. Agric. Food Chem. 2014, 62, 2605–2614. [Google Scholar] [CrossRef] [PubMed]
- Zhou, X.; Taylor, M.P.; Salouros, H.; Prasad, S. Authenticity and geographic origin of global honeys determined using carbon isotope ratios and trace elements. Sci. Rep. 2018, 8, 14639. [Google Scholar] [CrossRef]
- Kamdee, K.; Naksuriyawong, S.; Uapoonphol, N.; Fungklin, R.; Esor, J.; Permnamtip, V.; Meepho, S.-A.; Judprasong, K. Evaluation of honey authenticity in Thailand by analysis of carbon stable isotope ratio using elemental analyser coupled to isotope ratio mass spectrometry and cavity ring-down spectrometry. Int. J. Food Sci. Technol. 2023, 58, 2458–2464. [Google Scholar] [CrossRef]
- Geana, E.I.; Ciucure, C.T. Establishing authenticity of honey via comprehensive Romanian honey analysis. Food Chem. 2020, 306, 125595. [Google Scholar] [CrossRef]
- Xu, J.; Liu, X.; Wu, B.; Cao, Y. A comprehensive analysis of 13C isotope ratios data of authentic honey types produced in China using the EA-IRMS and LC-IRMS. J. Food Sci. Technol. 2020, 57, 1216–1232. [Google Scholar] [CrossRef]
- Cengiz, M.M.; Tosun, M.; Topal, M. Determination of the physicochemical properties and 13C/12C isotope ratios of some honeys from the northeast Anatolia region of Turkey. J. Food Compos. Anal. 2018, 69, 39–44. [Google Scholar] [CrossRef]
- Dong, H.; Luo, D.; Xian, Y.; Luo, H.; Guo, X.; Li, C.; Zhao, M. Adulteration identification of commercial honey with the C-4 sugar content of negative values by an elemental analyzer and liquid chromatography coupled to isotope ratio mass spectroscopy. J. Agric. Food Chem. 2016, 64, 3258–3265. [Google Scholar] [CrossRef] [PubMed]
- Çinar, S.B.; Ekşi, A.; Coşkun, İ. Carbon isotope ratio (13C/12C) of pine honey and detection of HFCS adulteration. Food Chem. 2014, 157, 10–13. [Google Scholar] [CrossRef] [PubMed]
- Simsek, A.; Bilsel, M.; Goren, A.C. 13C/12C pattern of honey from Turkey and determination of adulteration in commercially available honey samples using EA-IRMS. Food Chem. 2012, 130, 1115–1121. [Google Scholar] [CrossRef]
- Guler, A.; Kocaokutgen, H.; Garipoglu, A.V.; Onder, H.; Ekinci, D.; Biyik, S. Detection of adulterated honey produced by honeybee (Apis mellifera L.) colonies fed with different levels of commercial industrial sugar (C3 and C4 plants) syrups by the carbon isotope ratio analysis. Food Chem. 2014, 155, 155–160. [Google Scholar] [CrossRef]

| Sr. No. | Type of Flora | Number of Samples |
|---|---|---|
| A | Multifloral | 41 |
| B | Monofloral | 57 |
| 1 | Mustard | 10 |
| 2 | Eucalyptus Tree | 7 |
| 3 | Rosewood (Shisham) Tree | 7 |
| 4 | Lychee Tree | 6 |
| 5 | Rubber Tree | 6 |
| 6 | Coriander | 4 |
| 7 | Carom | 3 |
| 8 | Acacia Tree | 2 |
| 9 | Clover (Trifolium) | 2 |
| 10 | Drum Stick Tree (Moringa) | 2 |
| 11 | Indian Jujube | 1 |
| 12 | Bitter Vine | 1 |
| 13 | Plectranthus (Chhichri) | 1 |
| 14 | Coconut | 1 |
| 15 | Gum Arabic Tree (Babool) | 1 |
| 16 | Herbs | 1 |
| 17 | Sesame | 1 |
| 18 | Sunflower | 1 |
| Total | 98 | |
| Sr. No. | Name of Countries | δ13CH Value (‰) | Previous Studies |
|---|---|---|---|
| 1 | Thailand (n = 49) | −23.10 to −29.10 | [37] |
| 2 | Lebanon (n = 33) | −24.50 to −26.50 | [31] |
| 3 | Romanian (n = 48) | −24.47 to −27.0 | [38] |
| 4 | China (n = 94) | −23.21 to −29.49 | [39] |
| 5 | Turkey (n = 19) | −25.20 to −26.10 | [40] |
| 6 | China (n = 53) | −23.55 to −27.44 | [41] |
| 7 | China (n = 800) | −24.20 to −25.85 | [30] |
| 8 | Turkey (n = 100) | −22.70 to −27.4 | [42] |
| 9 | Turkey (n = 31) | −23.30 to −27.58 | [43] |
| 10 | Argentina, Austria, Bulgaria, Canada, China, Czech Republic, El Salvador, France, Germany, Great Britain, Greece, Hungary, India, Italy, Japan, Malaysia, Mexico, Romania, Slovakia, Slovenia, Spain, Turkey, Ukraine, Uruguay, Vietnam (n = 451) | −23.0 to −27.3 | [19] |
| 11 | United States (ASCS), Germany, UK, Mexico, Italy, Spain (n = 224) | >−23.5 | [18] |
| Overall published range in the literature | −22.70 to −29.49 | -- | |
| Overall observed range of Indian honey (n = 98) in this study | −22.07 to −29.02 | -- | |
| Observed range of Indian honey in this study falling under published ranges in the literature (n = 93) | −23.24 to −29.02 | -- | |
| Observed range of Indian honey in this study not falling under published ranges in the literature (n = 5) | −22.07 to −22.56 | ||
Disclaimer/Publisher’s Note: The statements, opinions and data contained in all publications are solely those of the individual author(s) and contributor(s) and not of MDPI and/or the editor(s). MDPI and/or the editor(s) disclaim responsibility for any injury to people or property resulting from any ideas, methods, instructions or products referred to in the content. |
© 2025 by the authors. Licensee MDPI, Basel, Switzerland. This article is an open access article distributed under the terms and conditions of the Creative Commons Attribution (CC BY) license (https://creativecommons.org/licenses/by/4.0/).
Share and Cite
Dua, A.; Bahman, S.; Kelly, S.; Dogra, S.; Sharma, K. Authentication of Indian Honey Based on Carbon Stable Isotope Ratio Analysis—Verification of Indian Regulatory Criteria. Foods 2025, 14, 1289. https://doi.org/10.3390/foods14081289
Dua A, Bahman S, Kelly S, Dogra S, Sharma K. Authentication of Indian Honey Based on Carbon Stable Isotope Ratio Analysis—Verification of Indian Regulatory Criteria. Foods. 2025; 14(8):1289. https://doi.org/10.3390/foods14081289
Chicago/Turabian StyleDua, Ajit, Sanjivan Bahman, Simon Kelly, Shainandni Dogra, and Kirti Sharma. 2025. "Authentication of Indian Honey Based on Carbon Stable Isotope Ratio Analysis—Verification of Indian Regulatory Criteria" Foods 14, no. 8: 1289. https://doi.org/10.3390/foods14081289
APA StyleDua, A., Bahman, S., Kelly, S., Dogra, S., & Sharma, K. (2025). Authentication of Indian Honey Based on Carbon Stable Isotope Ratio Analysis—Verification of Indian Regulatory Criteria. Foods, 14(8), 1289. https://doi.org/10.3390/foods14081289