Article

Green Extraction of Lotus Leaf (Nelumbo nucifera Gaertn) Polyphenols: Unraveling the Mechanism of Ultrasound-Assisted Deep Eutectic Solvents

1
College of Food Science and Nutritional Engineering, China Agricultural University, Beijing 100083, China
2
College of Veterinary Medicine, Sichuan Agricultural University, Chengdu 611130, China
3
State Key Laboratory of Vegetable Biobreeding, Institute of Vegetables and Flowers, Chinese Academy of Agricultural Sciences, Beijing 100081, China
4
Shaanxi Key Laboratory of Degradable Biomedical Materials, Shaanxi R&D Center of Biomaterials and Fermentation Engineering, Biotech & Biomed Research Institute, School of Chemical Engineering, Northwest University, Xi’an 710069, China
*
Author to whom correspondence should be addressed.
Foods 2025, 14(23), 4045; https://doi.org/10.3390/foods14234045
Submission received: 23 October 2025 / Revised: 18 November 2025 / Accepted: 21 November 2025 / Published: 25 November 2025

Abstract

Deep eutectic solvents (DESs) have attracted considerable attention in recent years because of their cost-effectiveness, safety, and sustainability. In this study, we developed 19 DESs for the extraction of antioxidant polyphenolic compounds from lotus leaves, utilizing ultrasound-assisted extraction (UAE). Among the DESs examined, choline chloride (ChCl) and lactic acid (ChCl: lactic acid) exhibited the highest extraction efficiency. The optimal conditions were established as follows: molar ratio of 1:2.6, solid-to-liquid ratio of 1:20 g/mL, water content of 8%, and ultrasound time of 65 min, which proved to be more efficient than conventional extraction methods such as water and ethanol. Under the optimal conditions, the total phenolic content (TPC) was 187.23 ± 14.67 mg GAE/g DW, and the extracts exhibited high antioxidant activity (DPPH IC50: 0.92 ± 0.23 mg/mL; FRAP: 21.56 ± 3.05 mg Trolox/g DW). This superiority arises from the formation of robust hydrogen bonds between ChCl and lactic acid, in conjunction with improved mass transfer efficiency. This study provides a green alternative method for polyphenol extraction from lotus leaves.

Graphical Abstract

1. Introduction

Nelumbo nucifera Gaertn. (lotus), a member of the Nymphaeaceae family, is widely distributed across Eastern Asia, China, and India, where the total area devoted to its cultivation is estimated to exceed 3344 km2 [1]. Lotus is often undervalued for its medicinal properties [2], as most individuals regard it merely as an economic ornamental, which leads to a considerable waste of potential resources. Importantly, >80 flavonoids and >10 phenolic acids have been identified in lotus leaves, with 2.9% of flavonoids (fresh weight) and 3.5% of phenolic acids (dry fractions) in whole leaves [3,4,5]. As a rich source of polyphenols with antioxidant properties, the extracts of lotus leaves offer great potential for resource recycling and functional food development. However, despite an abundant annual yield of 70–100 M tons [6], lotus leaf remains largely underutilized, with only 1% been used in the food industry. To produce extracts suitable for such applications, there is a pressing need to establish suitable extraction methods based on the matrix source and properties of polyphenolic compounds. The choice of solvent significantly influences extraction efficiency and compound activity.
Traditional extraction methods, including Soxhlet and solid–liquid extraction, are frequently supplanted by alternative techniques due to several limitations: (1) they may require up to 24 h (or longer), (2) they limit the quantity of samples processed simultaneously, and (3) they necessitate the use of organic solvents such as methanol, ethanol, and diethyl ether [7,8,9,10].
To overcome these limitations, advanced extraction methods have been developed, including supercritical fluid, microwave-assisted (MAE), and ultrasound-assisted extraction (UAE). These techniques primarily improve extraction efficiency by minimizing solvent volume and reducing extraction time [11,12]. Given considerations of cost and equipment availability, MAE and UAE are more commonly utilized [13] by disrupting plant cell walls through cavitation or thermal shock, these methods enhance yields; for instance, flavonoid yields are up to 20–30% greater than traditional solvent extraction [14]. However, solvent selection is a key factor affecting the extraction capacity of UAE.
Notably, deep eutectic solvents (DESs), formed by hydrogen bond acceptors (HBAs) and hydrogen bond donors (HBDs), are frequently employed to extract bioactive compounds from botanical sources owing to their biodegradability and low toxicity [15]. The DES systems display similar properties to ionic liquids. However, DES synthesis does not rely on chemical reactions but rather on the formation and disruption of hydrogen bond networks [16,17]. Due to most DESs exhibiting high viscosity, the addition of moderate amounts of water can improve extraction efficiency by lowering viscosity [18].
Due to comparable polarities and shared chemical interactions, including hydrogen bonding, dipole–dipole forces, and van der Waals forces, DESs have been used in efficient polyphenol extraction from plants, such as fruit or leaf waste from Capparis ovata, Moringa oleifera L., Mulberry, Pollen Typhae, Lycium barbarum L., and lemon verbena [19,20,21,22,23,24]. Although DESs have been utilized to extract polyphenolic compounds from lotus leaves, achieving a yield of 126.10 mg/g, the HBD: propylene glycol employed has been deemed unsuitable for polyphenol extraction due to the steric hindrance it introduces [25]. The steric hindrance resulting from the conformation of DESs suggests elevated surface tension, necessitating a higher energy input for the active compound to interact with the HBA. To overcome this limitation, the present study evaluated the ultrasound-assisted extraction of polyphenols from lotus leaves utilizing 19 different DES systems. DES systems based on choline chloride (ChCl), betaine, and L-proline were compared for their efficacy in extracting polyphenols from lotus leaves.
Experimental variables can significantly influence the extraction efficiency of DESs, necessitating a robust experimental design to evaluate the impact of each variable and optimize conditions for maximizing the yield of extracted polyphenols. Accordingly, the Box–Behnken design was employed to assess the effects of various variables on the final polyphenol yield and bioactive properties. This study also aims to further elucidate the potential mechanism underlying polyphenol extraction using the UAE and DES system. This research constitutes the first investigation into the mechanism of combined UAE and DES extraction of polyphenols from lotus leaves.

2. Materials and Methods

2.1. Materials and Chemicals

Lotus leaves sourced from Anhui Herbal Medicine Cultivation Co., Ltd. (Haozhou, China) were dried at 60 °C for 24 h in an oven (GZX-9030MBE, Boxun Medical Biological Instrument Corp., Shanghai, China), crumbled, sieved (using a 40-mesh sieve), and then stored at 4 °C for further analysis (Figure 1).
Choline chloride (ChCl, 98%), betaine (98%), L-proline (98%), levulinic acid (95%), lactic acid (95%), urea (98%), glycerol (98%), D-glucose (≥98%), maltose (≥98%), sodium acetate (≥99%), and ferric chloride (≥99%) were purchased from Aladdin Scientific Co., Ltd. (Shanghai, China). 2,2-Diphenyl-1-(2,4,6-trinitrophenyl) hydrazyl (DPPH), 2,4,6-tri(2-pyridyl)-s-triazine (TPTZ), (±)-6-hydroxy-2,5,7,8-tetramethylchromane-2-carboxylic acid (Trolox), gallic acid (99.9%), and Folin–phenol reagent were obtained from Shanghai Yuanye Biotechnology Co., Ltd. (Shanghai, China).

2.2. Preparation of Deep Eutectic Solvents

The DES-1 to DES-7, DES-8 to DES-15, and DES-16 to DES-19 (Figure 1) were synthesized using choline chloride, betaine, and L-proline as the hydrogen bond acceptors (HBAs) in combination with various hydrogen bond donor (HBD) compounds such as levulinic acid, lactic acid, urea, glycerol, D-glucose, and maltose. The molar ratio of HBAs/HBDs was recommended according to the literature (as shown in Table 1). To ensure complete dissolution, 2 mL of distilled water was uniformly added to all systems and then they were heated at 80 °C for 1–40 min with constant agitation at 500 rpm until a homogeneous liquid was achieved.

2.3. Determination of Physical Properties of Deep Eutectic Solvents

The pH was determined using a pH meter (FE28-Micro, METTLER TOLEDO, Greifensee, Switzerland). Density was calculated using the following formula:
ρ ( D E S ) = m 3 m 1 m 2     m 1 × ρ ( H 2 O )
where m1, m2, and m3 are the weight of the bottle, the bottle with water, and the bottle with DES, respectively.
Rheological analysis was conducted utilizing a rheometer (DHR-2, TA Instruments, New Castle, DE, USA) equipped with parallel plate geometry (25 mm diameter) and a 1 mm gap between plates. The samples underwent deformation speeds ranging from 0.1 to 100 s−1 at 25 °C. The reported value is the mean of five measurements.

2.4. Determination of Total Phenolic Content and Antioxidant Capacity

The total phenolic content (TPC) was determined by the Folin–Ciocalteu colorimetric method reported by Elaine Benítez-Correa [26] with some modifications. A 0.1 mL aliquot of sample was diluted in 4.9 mL of distilled water, then mixed with 1 mL of Folin–Ciocalteu reagent and allowed to stand for 3 min. Subsequently, 4 mL of a 0.94 M aqueous sodium carbonate solution was added, the mixture was shaken vigorously, and it was incubated in the dark at 50 °C for 5 min. Following centrifugation at 4000× rpm for 1 min, the absorbance of supernatant was measured at 765 nm using a spectrophotometer (UV–Visible V-5600, Yuanxi Instruments Co., Ltd., Shanghai, China). Calibration curves were established with gallic acid standards (y = 6.64686x + 0.00586; R2 = 0.9987), and the results were expressed as mg gallic acid equivalent per gram of dry weight (mg GAE/g DW).
The 2,2-diphenyl-1-(2,4,6-trinitrophenyl) hydrazyl (DPPH) free radical scavenging method was determined according to the detailed assay described by Hee Nam [27] with some modifications. The five extracts (water, 75% EtOH, DES-2, DES-15, and DES-19) were prepared at a concentration of 50 mg/mL and diluted in water to final concentrations of 2.5, 1.67, 1.25, 1, 0.83, and 0.71 mg/mL. A total of 100 µL of each sample was mixed with 2.9 mL of DPPH solution (0.025 mg/mL, dissolved in methanol). The mixture was reacted in the dark at room temperature for 30 min. Distilled water served as the negative control and the absorbance was measured at 517 nm with a spectrophotometer (UV–Visible V-5600, Yuanxi Instruments Ltd., Shanghai, China). All determinations were performed in triplicate. The percentage inhibition of DPPH radical by extracts was based on the following:
Inhibition   ( % ) = A 0     A t A 0 × 100
where A0 is the control and At is the absorbance of sample. The IC50 values (mg/mL, the concentration of the test samples required to reach inhibition of DPPH radical to 50%) were calculated.
Ferric-reducing antioxidant power (FRAP) was determined following the protocol outlined by Noor Alsaud [28] with slight modifications. Specifically, 400 µL of the sample was combined with 3.6 mL of TPTZ working solution, which was prepared by mixing sodium acetate buffer (300 mM pH 3.6), TPTZ (10 mM) and FeCl3·6H2O (20 mM) in a ratio of 10:1:1. The mixture was incubated in the dark for 30 min. Absorbance was measured at 593 nm using a spectrophotometer (UV–Visible V-5600, Yuanxi Instruments Ltd., Shanghai, China). Calibration curves were established with Trolox standards (y = 6.432x − 4.012, R2 = 0.9981), and the results were expressed as mg Trolox equivalent per gram of dry weight (mg Trolox/g DW).

2.5. Extraction Procedure

The extraction procedure was conducted following previously reported methods with some modifications [26]. A sample (0.50 g) was combined with 10 mL of DES, then sonicated at 30 °C for 30 min (40 kHz, 120 W) (JP-040S ultrasound, Skymen, Shenzhen, China). To prevent an increase in temperature during ultrasonication, the water in the ultrasonic bath should be drained and replaced with room-temperature distilled water every 5 min. The obtained mixture was centrifuged at 10,000× rpm for 10 min, and the supernatant was collected for further analysis.

2.6. Optimization of Extraction Process

Single-factor design experiments were conducted under various conditions: (a) molar ratios of HBA/HBD (1:1, 1:2, 1:3, 1:4, 1:5); (b) water content (0%, 10%, 20%, 30%, and 50%); (c) solid-to-liquid ratios (1:10, 1:15, 1:20, 1:25, and 1:30 g/mL); and (d) ultrasonic time (30, 40, 50, 60, and 70 min) (40 kHz,120 W) to assess the yield of TPC.
Based on single-factor experiments, a four-factor, three-level response surface methodology (RSM) was employed to optimize the extraction of total polyphenols from lotus leaves. The factors investigated included the HBD: HBA molar ratio (1, 2, 3), liquid–solid ratio (15, 20, 25 mL/g), ultrasonic time (50, 60, 70 min), and water content (0, 10, 20%). The TPC (mg GAE/g DW) served as the response variable. Data analysis was conducted using Design Expert 13.0. The experimental results are presented in Table 2, accompanied by the following quadratic regression equation:
Yield of TPC = 185.29 + 28.74A + 13.14C − 15.33AC − 31.71AD − 16.17BC − 22.70A2 − 14.24B2 − 15.22C2 − 39.07D2
where A represents the molar ratio of HBA/HBD, B represents the liquid–solid ratio, C represents the ultrasonic time, and D represents the water contents.

2.7. Fourier Transform Infrared Spectrometer

The functional groups of ChCl, DL-lactic acid, and ChCl–lactic acid (molar ratio 1:2) were analyzed using a Shimadzu IRTracer-100 FTIR spectrometer (IRTracer100, Shimadzu Co., Ltd., Kyoto, Japan), which is equipped with an MIR-TGS detector. Spectra were recorded at room temperature over the range of 4000–500 cm−1, with 16 scans accumulated at a resolution of 4 cm−1.

2.8. Scanning Electron Microscope

Scanning electron microscope (SEM) analysis was performed using a Hitachi SU5000 (Hitachi SU5000, Hitachi High-Tech Co., Ltd., Shanghai, China), equipped with a secondary electron detector and operated at an acceleration voltage of 20 kV. The samples analyzed comprised raw lotus leaf powder and materials extracted using DES and ethanol (75%) under optimal extraction conditions determined by RSM analysis.

2.9. Statistical Analysis

All measurements were conducted in triplicate and are presented as mean ± SD. One-way analysis of variance (ANOVA) was performed using Graphpad Prism 9.0 (San Diego, CA, USA). The BBD-RSM design was executed using Design-Expert 13.0 (Minneapolis, Minnesota, MN, USA). ANOVA was applied to assess linear regression, quadratic coefficients, and interactions. The predicted R2 and adjusted R2 were estimated at the 95% significance level based on the polynomial equation (p < 0.05).

3. Results and Discussion

3.1. Characterization of Different DESs

Table 1 summarizes the DES systems commonly used in recent years for polyphenol extraction. Choline chloride, betaine, and L-proline were identified as the most frequently employed HBAs, and were, therefore, selected as the HBAs in this study. HBDs, including carbohydrates, alcohols, acids, and amides, were chosen based on their prevalence in reported applications. We further characterized the physicochemical properties (e.g., pH, viscosity, and density) of the resulting DES combinations. This characterization was conducted to establish a correlation between DES properties and polyphenol extraction efficiency, thereby providing a scientific basis for the optimization of DES-based extraction.
As illustrated in Figure 1, the 19 DESs generally display fluidity and notable variations in visual appearance at room temperature. Their properties, including pH, density, and viscosity, are summarized in Table 3. Viscosity, which directly influences a liquid’s flow resistance, is typically elevated in DESs due to complex hydrogen bonding between the HBAs and HBDs [29]. This high viscosity poses challenges for industrial applications. Enhanced hydrogen bonding between HBAs and HBDs results in increased viscosity, which restricts molecular mobility [30]. DESs with higher viscosities (>200 mPa·s) demonstrate greater ionic hydrophobicity [31], including ChCl-based DES-1, DES-3, DES-5, and DES-6, as well as betaine-based DES-8 and DES-9, and L-proline-based DES-17. In contrast, DESs with lower viscosities (41.3–167.4 mPa·s; DES-2, DES-10, DES-14, DES-16) may exhibit reduced surface tension, thereby facilitating polyphenol extraction. However, excessively low viscosities (4.8–20 mPa·s; DES-4, DES-7, DES-15, DES-19) suggest weak intermolecular interactions, which also inhibit extraction.
Density is a fundamental physical property of DESs. Solvents with densities of ≤1.0 g/cm3 are generally preferred for extraction processes due to their compatibility with water [31]. As indicated in Table 3, DES-1, DES-2, DES-12, and DES-15 meet this criterion (≤1.14 g/cm3), thereby satisfying most extraction requirements. However, polyhydroxylated HBDs, such as glycerol, D-glucose, and maltose, increase the density of DESs [32]. Consequently, formulations containing these HBDs, including DES-3, DES-4, DES-5, DES-6, DES-10, DES-11, DES-13, DES-14, DES-16, DES-17, and DES-18, exhibit elevated densities ranging from 1.15 to 1.29 g/cm3.
The pH value of DES significantly affects the efficiency of polyphenol extraction, which is determined by the acidity and basicity of HBA and HBD [33]. Bubalo et al. [34] demonstrated that acid-based DESs achieve higher recovery of free anthocyanins from grape skins compared to sugar-based alternatives. The acidic conditions can improve the stability of polyphenols and increase their extraction rates. Consequently, acidic HBDs such as levulinic acid (DES-1, DES-8) and lactic acid (DES-2, DES-9) are likely to enhance polyphenol extraction in this study. Given the properties of DESs, including low viscosity, water-like density, and acidic pH, DES-2 (ChCl–lactic acid) appears to be particularly suitable for the extraction of polyphenols from lotus leaves. Although these physicochemical trends are apparent, objective empirical validation would further strengthen the evidence.

3.2. Determination of the Optimal DES for Polyphenol Extraction

3.2.1. Screening of DESs for Enhanced Polyphenol Extraction

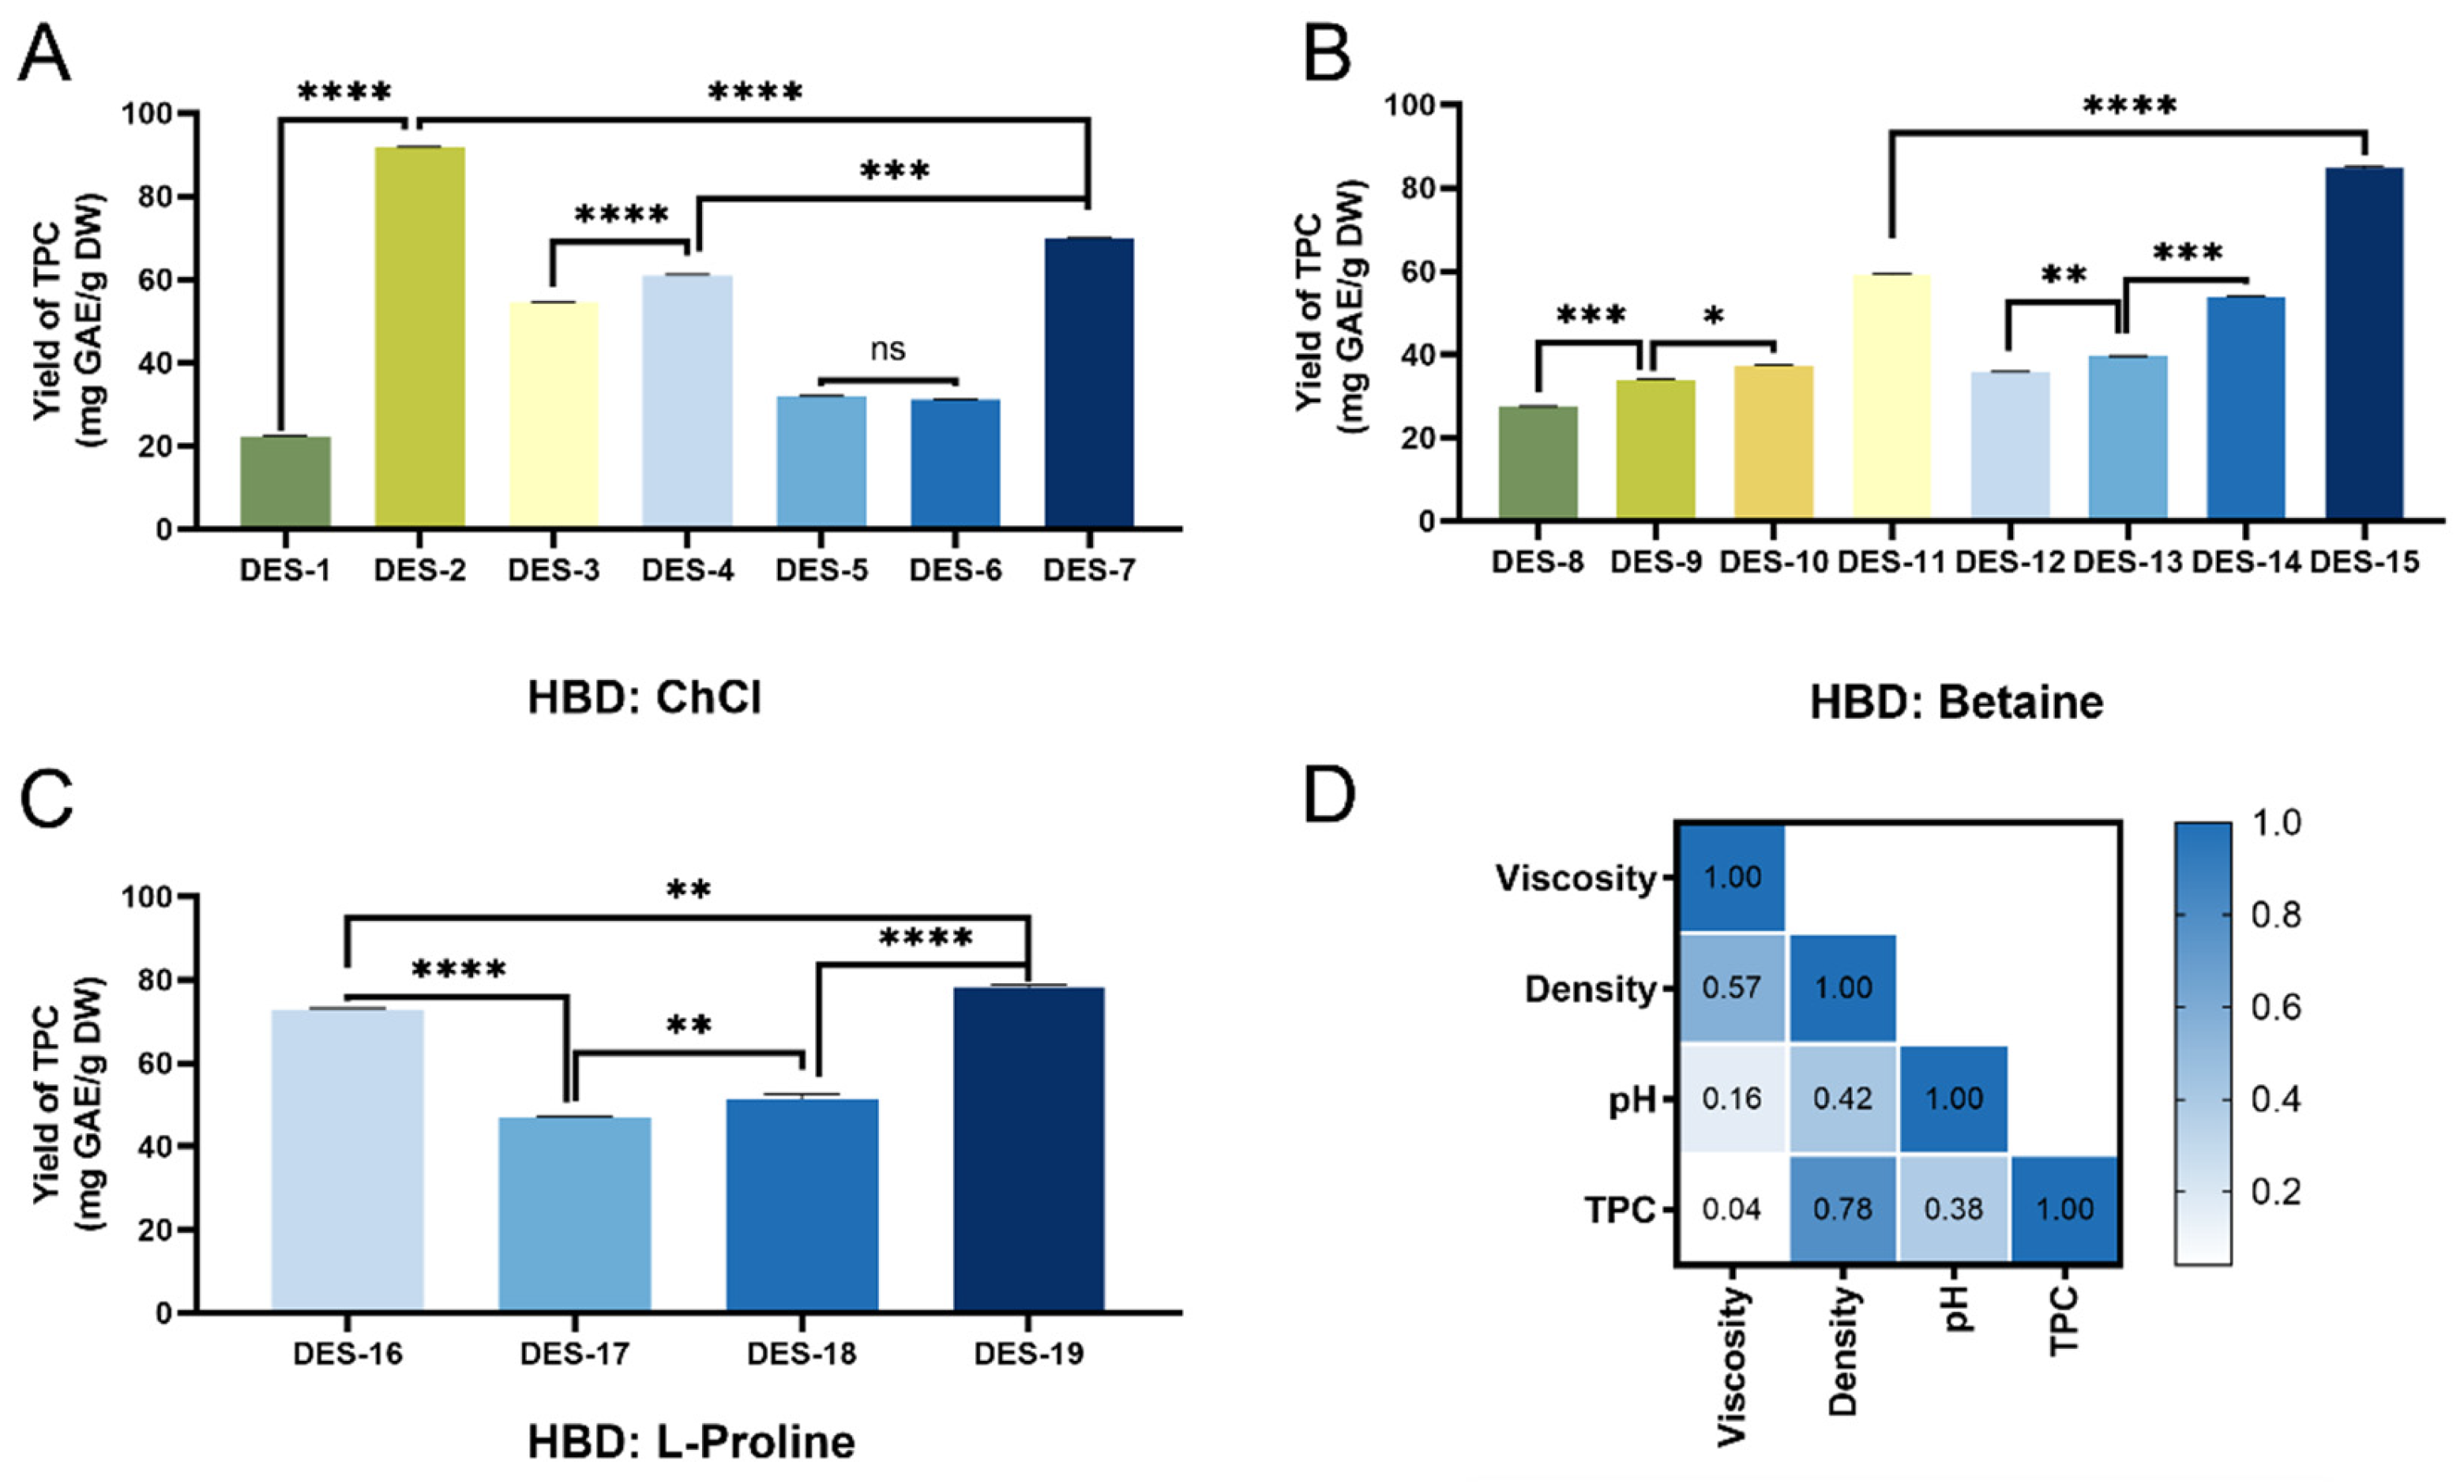
Figure 2A–C reveals significant differences in polyphenol content extracted by ChCl-, betaine-, and L-proline-based DES systems. Among these, DES-2 (ChCl–lactic acid), DES-15 (betaine–urea), and DES-19 (L-proline–urea) achieved high extraction efficiencies, yielding 84.52 ± 0.21, 77.60 ± 0.49, and 71.12 ± 0.47 mg GAE/g DW, respectively. DES-2 (ChCl-lactic acid) demonstrated the highest polyphenol content, consistent with the conclusions drawn in Section 3.1. These findings align with the results reported by Saha et al. [35]. L-proline-based DESs generally outperformed betaine-based DESs, which can be attributed to the abundant hydrogen bond acceptors in L-proline that facilitate bond formation. Meanwhile, ChCl-, betaine-, and L-proline–glycerol DESs exhibited comparable TPC values, indicating similar polyol-mediated behavior. It is worth noting that selecting DES-2, DES-15, or DES-19 for further research requires additional evaluation of their antioxidant activity levels.
Figure 2D illustrates the Pearson correlation coefficients between the physicochemical properties of DES and TPC, where the values presented are correlation coefficients. Viscosity exhibits a strong negative correlation with TPC (r = 0.86, p < 0.05). Notably, D-glucose and glycerol produced medium-to-high viscosities, which can be attributed to the hydrogen bonding between HBD and HBA that restricts molecular mobility [31]. The system pH may also influence extraction efficiency, and acidic conditions generally favor polyphenol extraction.

3.2.2. Comparison of the Effects of Different Extraction Methods on Antioxidant Activity

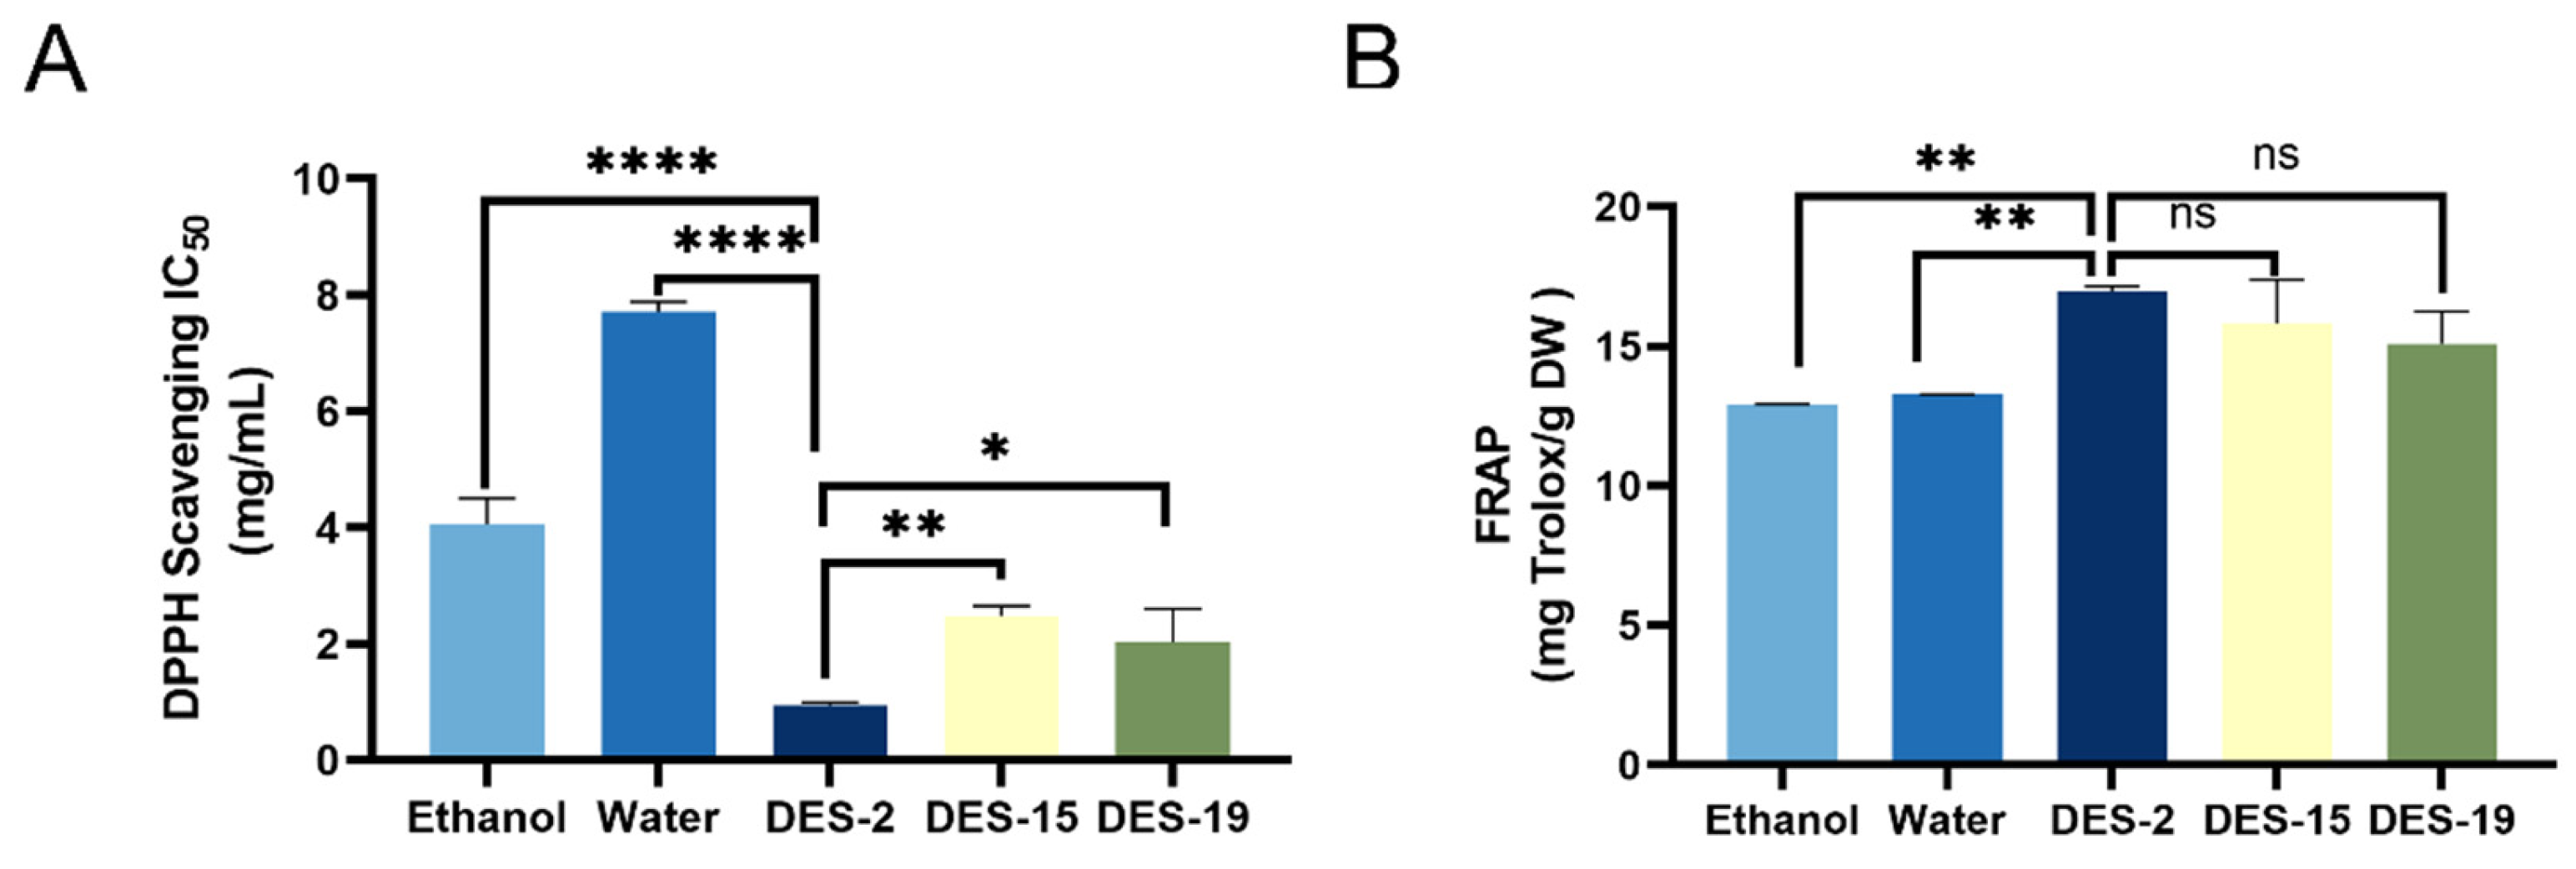
The antioxidant activities of five extracts, derived from water, 75% ethanol, DES-2 (ChCl: lactic acid), DES-15 (betaine: urea), and DES-19 (L-proline: urea), were evaluated through DPPH radical scavenging and FRAP total reduction capacity assays. As illustrated in Figure 3, the extract obtained using DES-2 (ChCl: lactic acid) exhibited an IC50 value of 0.96 ± 0.04 mg/mL, significantly lower than those of the extracts from 75% ethanol (4.06 ± 0.45 mg/mL) and water (7.72 ± 0.16 mg/mL) (p < 0.0001). Additionally, the IC50 value for the DES-2 (ChCl: lactic acid) extract was also significantly lower than those for DES-15 (betaine: urea, 2.46 ± 0.17 mg/mL) and DES-19 (L-proline: urea, 2.03 ± 0.57 mg/mL) (p < 0.05), indicating that the extract from DES-2 (ChCl: lactic acid) exhibited the highest DPPH radical scavenging capacity. Moreover, the FRAP values further confirmed that the extract from DES-2 (ChCl: lactic acid, 16.94 ± 0.20 mg Trolox/g DW) demonstrated the strongest reducing capacity among the tested solvents.
Soukaina et al. [36] demonstrated that ChCl-based DESs exhibit significantly higher efficiency in extracting polyphenols compared to traditional solvents such as methanol. This finding suggests that the polarity of ChCl-based DESs is closely associated with the polarity of polyphenolic compounds in plants, thereby directly affecting their solubility. Furthermore, the carboxyl group in lactic acid can form hydrogen bonds with polyphenolic substances [37,38,39]. Reports indicate that the ChCl: lactic acid combination serves as the most effective solvent for recovering phenolic compounds Consequently, DES-2: ChCl: lactic acid will be selected for subsequent studies in this research.

3.3. Optimization of DES Extraction Conditions

3.3.1. Single-Factor Test

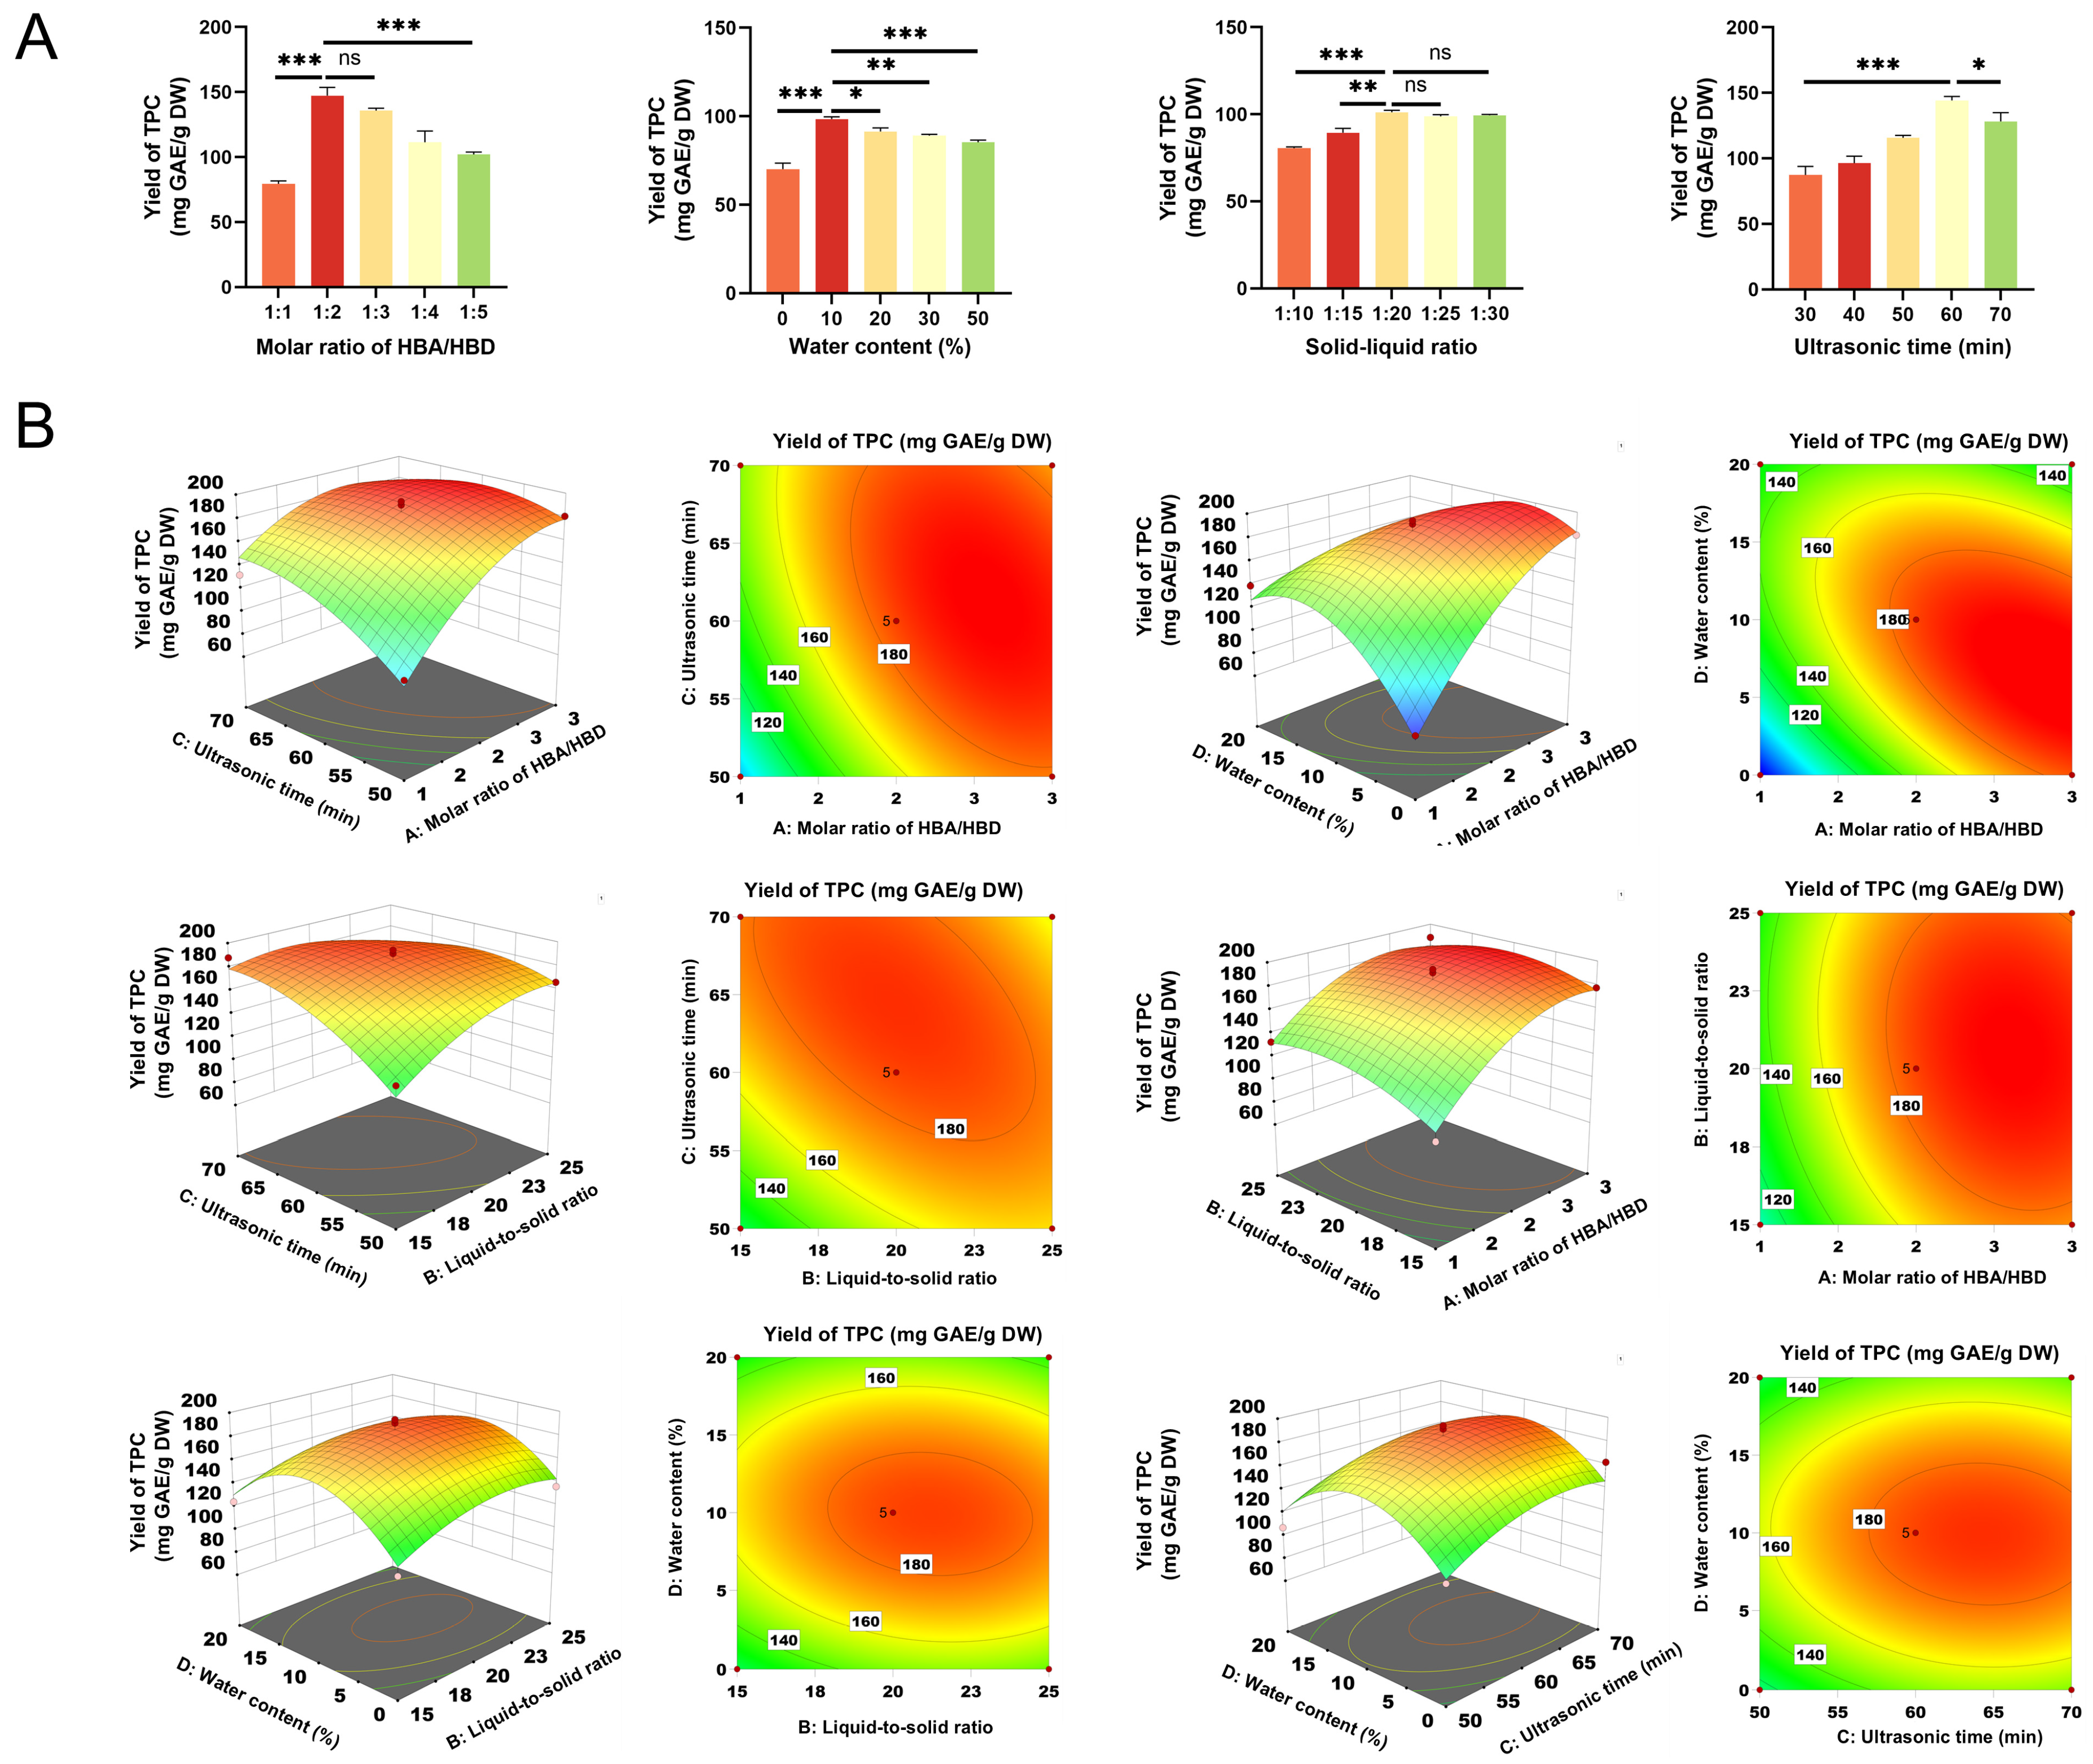
The extraction efficiency of the UAE-DES system is influenced by several factors, including molar ratio, liquid–solid ratio, ultrasound time, and water content. To evaluate the effect of the HBA/HBD molar ratio on TPC, experiments were conducted across a range from 1:1 to 1:5 while keeping other conditions constant (solid–liquid ratio of 1:20 g/mL, ultrasound duration of 30 min, and water content of 20%). This range was chosen in accordance with previous research [25], which suggests that an imbalance in HBDs or HBAs may influence phenolic compound yield. TPC rose markedly as the molar ratio of ChCl to lactic acid increased from 1:1 (79.36 ± 2.37 mg GAE/g DW) to 1:2 (147.30 ± 6.22 mg GAE/g DW), but subsequently declined from 1:2 to 1:5 (102.10 ± 1.75 mg GAE/g DW). This trend may be attributed to excessive acidity and elevated viscosity resulting from a surplus of lactic acid, which could promote polyphenol degradation and impede mass transfer efficiency [40]. Based on these results, a ChCl–lactic acid molar ratio of 1:2 was chosen for further experiments.
Water content critically influences the viscosity of DESs, where moderate levels enhance polyphenol extraction by optimizing hydrogen bonding capacity and mass transfer efficiency [41]. Based on previous research by Kaur et al. [42], this study investigated water content in the range of 0–50%. Under controlled conditions (molar ratio of 1:4, solid–liquid ratio of 1:20 g/mL, ultrasound duration of 30 min), TPC was evaluated across this range. As shown in Figure 4A, the maximum TPC (98.40 ± 1.30 mg GAE/g DW) was achieved at 10% water content, after which it decreased to 91.40 ± 2.03 mg GAE/g DW at 20%. A significant correlation was observed between viscosity and TPC (p < 0.05). Therefore, the 10% water content was selected for further optimization.
The solid–liquid ratio also plays a key role in the maximum extraction capacity of DESs under fixed conditions (molar ratio of 1:4, ultrasound duration of 30 min, water content of 20%). Based on previous research findings [42], the solid–liquid ratio range for this study was determined to be 1:10 to 1:30. As illustrated in Figure 4A, the TPC increased sharply from a ratio of 1:10 (80.56 ± 0.76 mg GAE/g DW) to 1:20 (101.22 ± 1.05 mg GAE/g DW) and then plateaued between the ratios of 1:20 and 1:30 (99.44 ± 0.54 mg GAE/g DW). An increase in the solid–liquid ratio enhances the solute–solvent concentration gradient, thereby accelerating the mass transfer of polyphenols. However, excessively high ratios can diminish ultrasonic cavitation intensity due to the increased density of solid particles [43]. To optimize extraction capacity while minimizing resource consumption, the 1:20 ratio was chosen for subsequent experiments.
Ultrasound time is another key factor affecting DES–UAE efficiency. Based on common practice in previous DES extraction studies [42,44,45], ultrasound times of 10–70 min were applied. Therefore, in this study, TPC was assessed over 30–70 min under set parameters (molar ratio of 1:4, solid–liquid ratio of 1:20 g/mL, water content of 20%). As shown in Figure 4A, TPC rose sharply from 87.46 ± 6.41 mg GAE/g DW at 30 min to 144.33 ± 2.86 mg GAE/g DW at 60 min, then decreased to 128.28 ± 6.68 mg GAE/g DW by 70 min. The initial increase suggests a high concentration gradient promoting the release of surface compounds, while the subsequent decline indicates possible equilibrium or compound degradation. Therefore, a 60 min ultrasound time was selected for further experiments.

3.3.2. BBD Experimental Design

The optimal extraction process for DES–UAE was investigated using a Box–Behnken design (BBD). A four-factor, three-level BBD was established based on the preliminary single-factor tests (as shown in Table 2), which identified the optimal ranges for molar ratio (1:2), water content (10%), solid–liquid ratio (1:20), and ultrasound time (60 min). Then, a total of 29 experiments were executed, yielding the TPC results presented in Table 4. The relationship between the variables and the response was accurately described by a quadratic polynomial model (see Section 2.6).
Analysis of variance (ANOVA) confirmed the models’ high reliability for prediction. As presented in Table 4, the model was highly significant (p < 0.0001) with a non-significant lack of fit (p = 0.0913). The high R2 (0.9414) and adjusted R2 (0.8829) values further affirmed the model’s robustness in representing the relationships between the independent variables and TPC. The three-dimensional response surface plots, exemplified in Figure 4B, revealed that TPC initially increased and then decreased with increasing levels of molar ratio, liquid–solid ratio, and sonication time—a trend consistent with the single-factor experiments. Notably, significant interactive effects (p < 0.05) were observed for the pairs of molar ratio and sonication time (AC), molar ratio and water content (AD), and liquid–solid ratio and sonication time (BC).
These significant interactions can be interpreted through the physicochemical properties of DESs. As tunable solvents, the viscosity and polarity of DESs [46], critical for extraction efficiency, are modulated by the HBA/HBD molar ratio and water content. The significant interaction between molar ratio and water content suggests that at the optimal molar ratio of 1:2.6, a robust hydrogen-bond network forms, facilitating polyphenol dissolution. The addition of 8% water at this ratio is likely to reduce viscosity, enhancing mass transfer efficiency between the sample and solvent, and yielding superior extraction performance [47]. Simultaneously, the interaction between molar ratio and ultrasound time (68 min) indicates that ultrasound cavitation synergizes with the optimized DES structure. The cavitation bubbles disrupt cell walls, while the reduced viscosity of the optimized DESs allows more effective solvent penetration into the cellular matrix [48]. Finally, the significant interaction between the solid–liquid ratio and sonication time reflects the increasing reliance of extraction yield on ultrasound duration at higher solid-to-liquid ratios, where mass transfer limitations are more pronounced.
The optimal extraction conditions identified through response surface analysis are as follows: a molar ratio of 1:2.592, a liquid-to-solid ratio of 19.814 mL/g, an ultrasound time of 64.509 min, and a water content of 7.722%. Under these conditions, the theoretical TPC was calculated to be 195.566 mg GAE/g DW. In the validation experiments, the parameters were adjusted to a molar ratio of 1:2.6, a solid-to-liquid ratio of 1:20, an ultrasound time of 65 min, and a water content of 8%. Three parallel experiments were conducted, and the results are presented in Table 5. The total polyphenol yield from lotus leaves was measured at 187.23 ± 14.67 mg GAE/g DW, reflecting a deviation of 4.58% from the theoretical value, which indicates the model’s strong predictive capability. Furthermore, under the optimized extraction conditions, the DPPH radical scavenging capacity of the lotus leaf extract (0.92 ± 0.23 mg/mL) increased by 3.26%, while the FRAP total reducing capacity (21.56 ± 3.05 mg Trolox/g DW) exhibited a rise of 27.27%. These results indicate that the DES–UAE system established in this study achieves efficient extraction of lotus leaf polyphenols and exhibits high antioxidant activity.

3.4. Chemical Interactions and Morphological Characterization

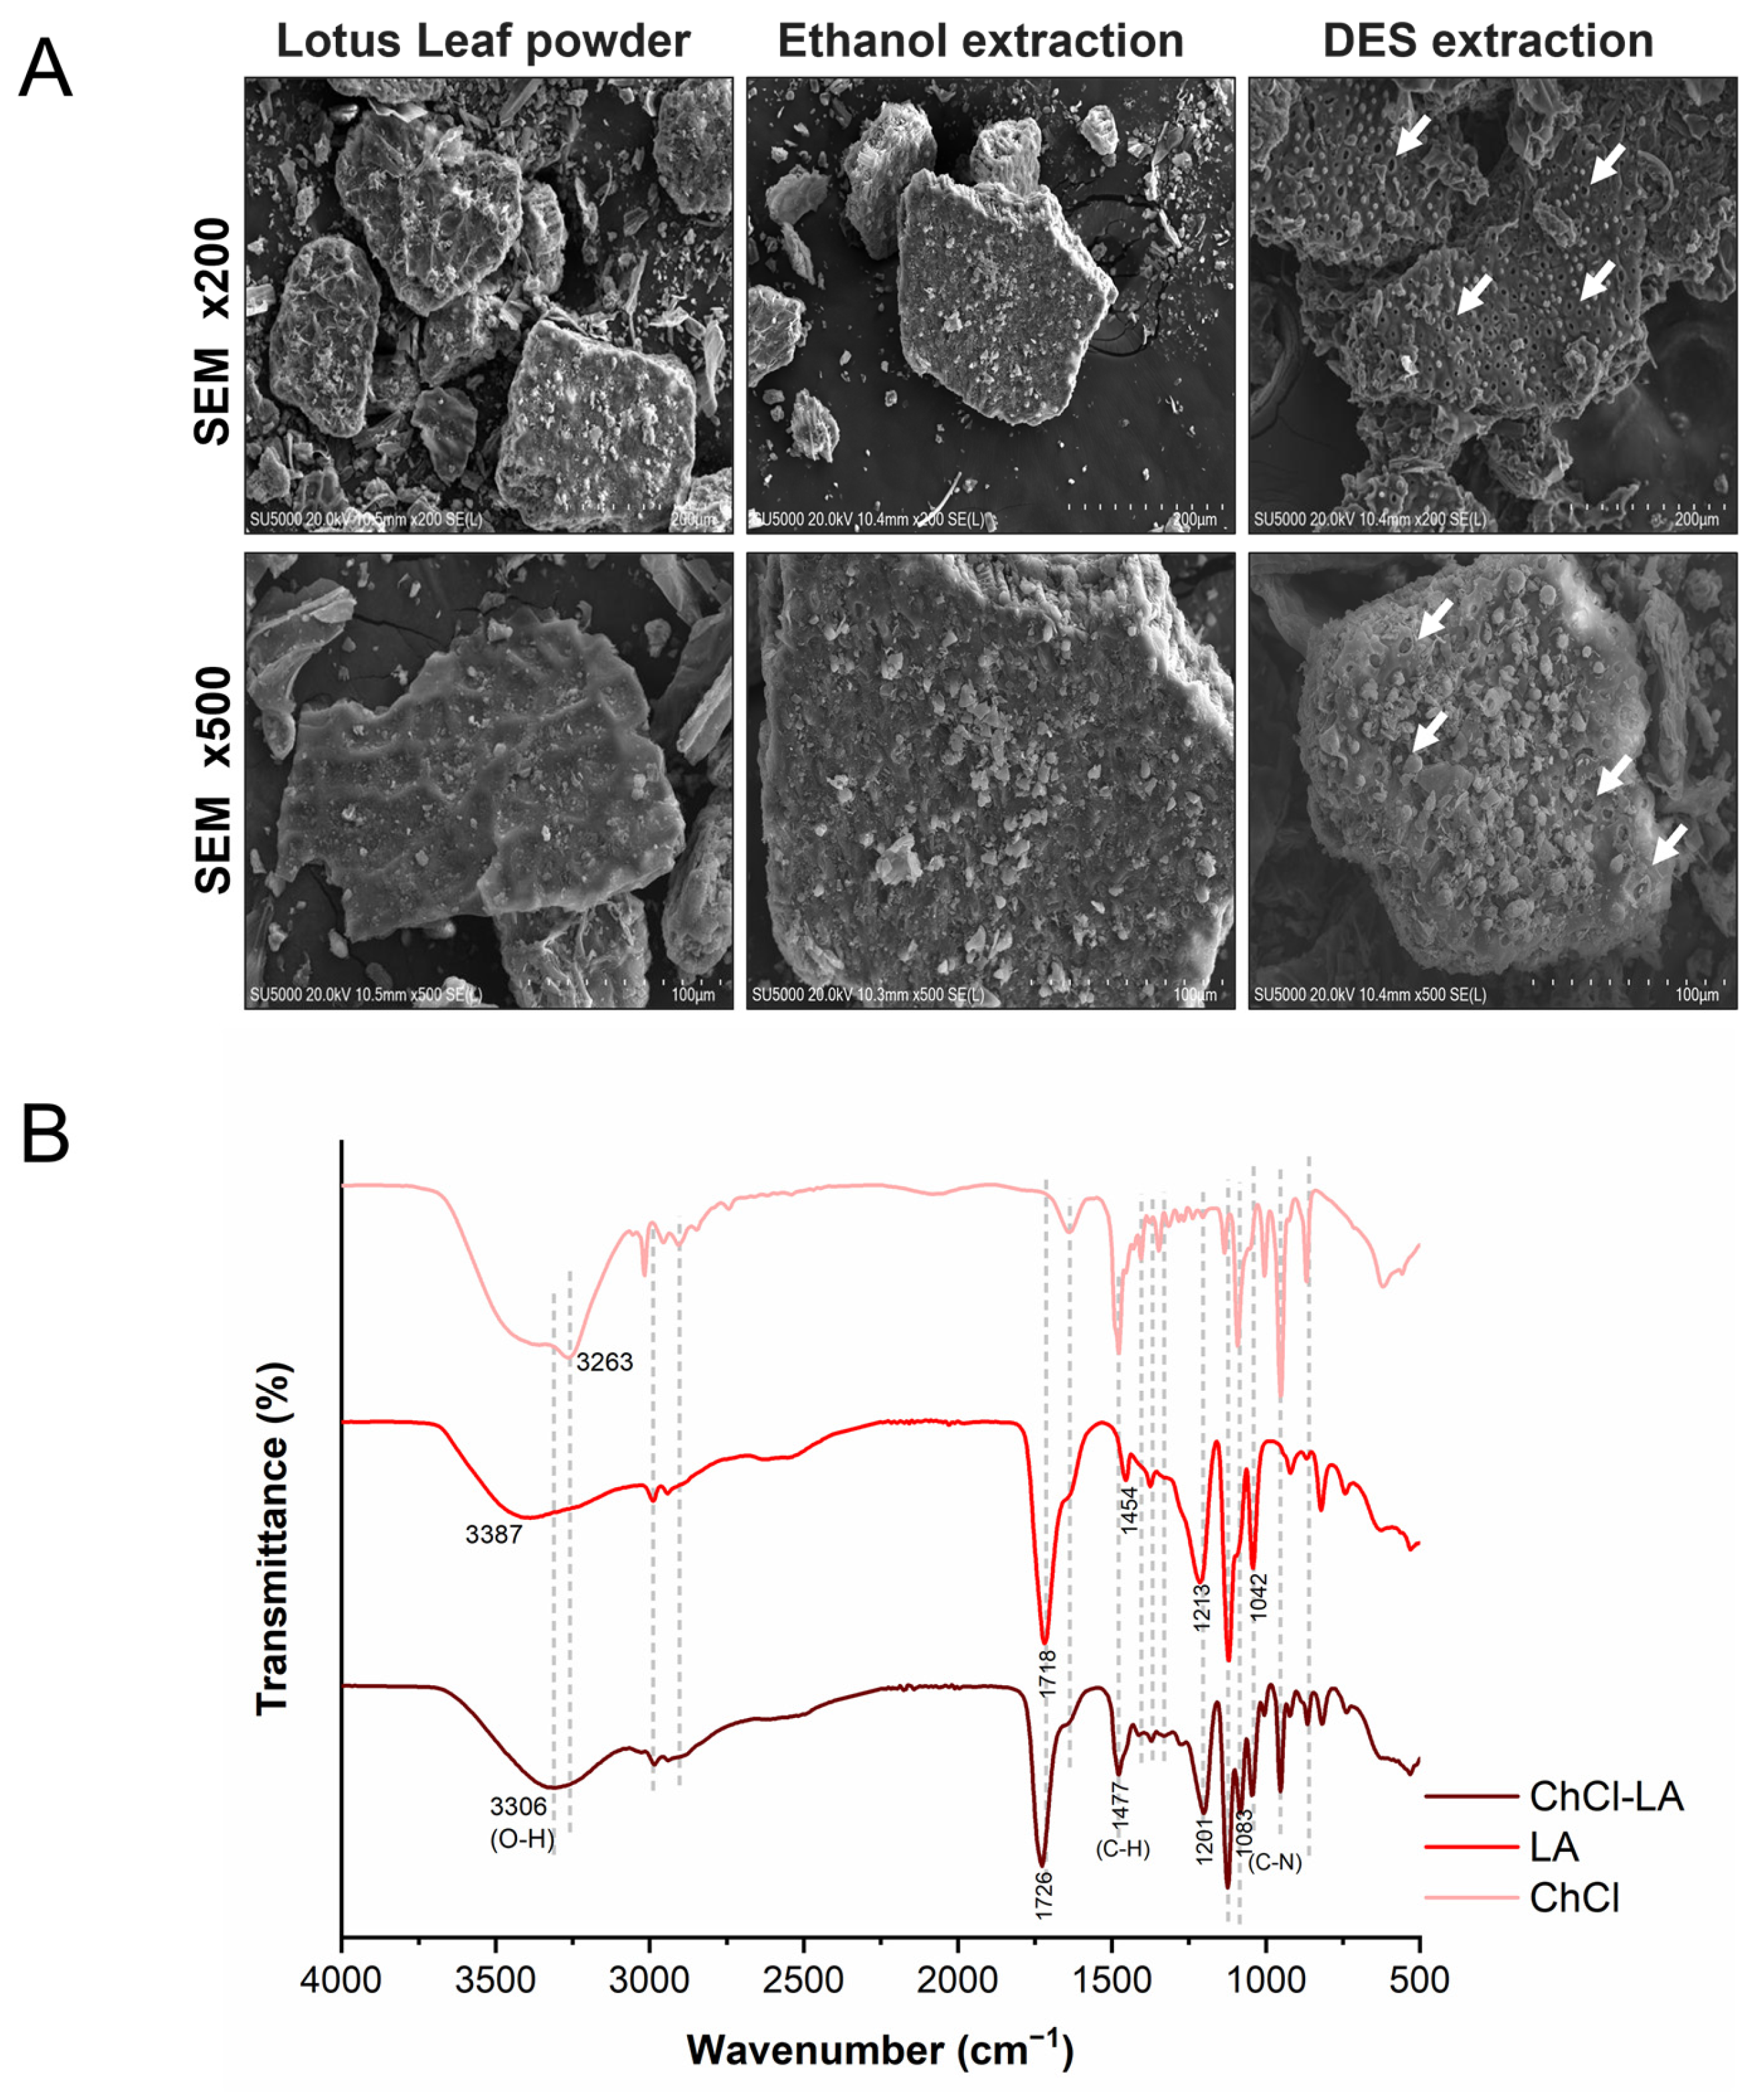
This study assessed the morphological characteristics of lotus leaf powder samples that were untreated, treated with 75% ethanol, and treated with DES: ChCl–lactic acid. As illustrated in Figure 5A, the untreated powder exhibited a smooth surface, whereas the powder treated with 75% ethanol displayed a rough surface characterized by agglomerated particles. Treatment with DES: ChCl–lactic acid resulted in a markedly altered surface structure, revealing fragmented, porous structures (indicated by arrows). These distinct morphological changes are hallmark features of ultrasonic cavitation effects. Under ultrasonic influence, rapidly forming and collapsing microbubbles (cavitation bubbles) in liquids produce intense microjets and violent shear forces within confined spaces. When this energy is released near solid surfaces, such as plant cell walls, it can cause irreversible mechanical damage to the rigid cell walls [34,42]. These observations suggest that DES extraction enhances mass transfer efficiency.
FTIR spectra of the DES (ChCl–lactic acid) and its components are shown in Figure 5B. Peaks at 3387 cm−1 and 1718 cm−1 correspond to the O–H and C=O stretches of lactic acid, respectively [49]. DES formation is confirmed by C–N stretching (1020–1050 cm−1) and C–H bending (1454 cm−1) [50]. Compared to pure lactic acid, characteristic shifts occur upon DES formation: O–H stretch shift from 3387 to 3306 cm−1, C–H bend shift from 1454 to 1477 cm−1, and C–N stretch shift from 1042 to 1083 cm−1, respectively. These spectral shifts confirm strong hydrogen bonding between ChCl and lactic acid. These bonds disrupt the hydrogen bond networks between polyphenols and plant matrices, such as cellulose and proteins, thereby facilitating the release and solubilization of polyphenols [50]. Therefore, the DES–UAE combination utilized in this study shows considerable potential for extracting phenolic compounds from lotus leaves.

4. Conclusions

This study successfully employed ultrasound-assisted DES extraction technology to isolate polyphenolic compounds from lotus leaves. Following optimization, the optimal conditions established were a ChCl/lactic acid molar ratio of 1:2.6, a water content of 8%, an ultrasound duration of 68 min, and a solid-to-liquid ratio of 1:20. These conditions resulted in a yield of 187.23 ± 14.67 mg GAE/g DW, reflecting a 48.48% increase compared to the previous study. In addition, we found that the DES: ChCl/lactic acid system was significantly better than water or ethanol extraction in terms of their clearing ability of DPPH radicals (DPPH IC50: 0.92 ± 0.23 mg/mL) and Fe3+ reducing capacity (FRAP: 21.56 ± 3.05 mg Trolox/g DW).
Experiments have demonstrated that altering the HBA/HBD molar ratio and adding water changes the DES properties, which facilitates the formation of hydrogen bond networks and improves mass transfer efficiency. Additionally, extended ultrasonic treatment decreases mass transfer resistance associated with high solid–liquid ratio and disrupts cell walls through the formation and collapse of cavitation bubbles, thus further enhancing mass transfer efficiency.
This study demonstrates the potential of novel DESs as alternatives to conventional chemical solvents for the extraction of bioactive compounds. Unlike traditional chemical reagents, which are often volatile, toxic, and environmentally harmful, the novel DES: ChCl/lactic acid, are non-toxic, cost-effective, and readily accessible. These properties are consistent with the principles of sustainable development and green chemistry. Furthermore, future research will focus on the quantitative analysis of the elemental composition (e.g., Mg2+, Mn2+, Zn2+, Fe2+) of both the raw materials and the DES extracts. Investigating the potential coordination between these metal cations and the extracted polyphenols will be essential for fully elucidating the mechanisms underlying their bioactivity and stability, thereby enhancing our understanding of the DES extraction process.
Although this extraction technology has shown high efficiency at the laboratory scale, validation of the process at larger industrial scales has yet to be conducted. Consequently, future research will concentrate on kinetic studies to establish a theoretical foundation for subsequent process design and scale-up. Additionally, it will systematically compare the combined application of various physical and mechanical pretreatments with modern extraction technologies, such as supercritical solvent extraction. We believe that ultrasound-assisted DES extraction represents a novel and promising green extraction method with substantial potential for large-scale application. This approach is poised to significantly advance the high-value utilization of lotus leaves and the development of functional foods.

Author Contributions

J.S.: Writing—original draft; writing—review and editing; visualization; M.Q.: Software and data curation; L.C.: Data curation and formal analysis; X.L.: Visualization and investigation; X.W.: Methodology and software; G.Y.: Supervision and resources; J.D.: Methodology and supervision; H.Y.: Funding acquisition and supervision. All authors have read and agreed to the published version of the manuscript.

Funding

This work was financially supported by the CNS-NSF-Nutrilite Research Fund for Plant Functional Substances (CNS-NCL2024-312), the State Key Laboratory of Vegetable Biobreeding (SKLVB202503), the National Natural Science Foundation of China (32422069), and the 2115 Talent Development Program of China Agricultural University.

Institutional Review Board Statement

Not applicable.

Informed Consent Statement

Not applicable.

Data Availability Statement

The original contributions presented in this study are included in the article. Further inquiries can be directed to the corresponding author.

Conflicts of Interest

The authors declare that they have no known competing financial interests or personal relationships that could have appeared to influence the work reported in this paper.

References

  1. Wang, Z.; Li, Y.; Ma, D.; Zeng, M.; Wang, Z.; Qin, F.; Chen, J.; Christian, M.; He, Z. Alkaloids from lotus (Nelumbo nucifera): Recent advances in biosynthesis, pharmacokinetics, bioactivity, safety, and industrial applications. Crit. Rev. Food Sci. Nutr. 2023, 63, 4867–4900. [Google Scholar] [CrossRef]
  2. Guo, C.; Zhang, N.; Liu, C.; Xue, J.; Chu, J.; Yao, X. Qualities and antioxidant activities of lotus leaf affected by different drying methods. Acta Physiol. Plant. 2020, 42, 14. [Google Scholar] [CrossRef]
  3. Limwachiranon, J.; Huang, H.; Shi, Z.; Li, L.; Luo, Z. Lotus Flavonoids and Phenolic Acids: Health Promotion and Safe Consumption Dosages. Compr. Rev. Food Sci. Food Saf. 2018, 17, 458–471. [Google Scholar] [CrossRef]
  4. Chen, X.; He, Y.; Liu, Z.; Huang, Z.; Xu, C.; Liu, Y.; Haran, Y.; Nisar, W.; Yan, S.; Li, J. Ultrasound-assisted extraction of polyphenols from lotus rhizome epidermis by alcohol/salt-based aqueous two-phase system: Optimization, extraction mechanism and antioxidant activities. Food Chem. 2024, 453, 139620. [Google Scholar] [CrossRef] [PubMed]
  5. Shen, Y.; Guan, Y.; Song, X.; He, J.; Xie, Z.; Zhang, Y.; Zhang, H.; Tang, D. Polyphenols extract from lotus seedpod (Nelumbo nucifera Gaertn.): Phenolic compositions, antioxidant, and antiproliferative activities. Food Sci. Nutr. 2019, 7, 3062–3070. [Google Scholar] [CrossRef] [PubMed]
  6. Liu, G.; Qiu, L.; Deng, H.; Wang, J.; Yao, L.; Deng, L. Ultrahigh surface area carbon nanosheets derived from lotus leaf with super capacities for capacitive deionization and dye adsorption. Appl. Surf. Sci. 2020, 524, 146485. [Google Scholar] [CrossRef]
  7. Atiya, A.; Majrashi, T.A.; Begum, M.Y.; Abdul Qadir, S.F.; Alqahtani, A.S.; Ali Alosman, A.S.; Alahmari, A.A.; Mesfer Al Aldabsh, A.N.; Alshahrani, A.T.; Alshahrani, R.R.M. Influence of solvent selection and extraction methods on the determination of polyphenols, antioxidant, lipoxygenase and tyrosinase inhibition activities of Opuntia ficus-indica fruits peel and pulp collected from the Kingdom of Saudi Arabia (KSA). Nat. Prod. Res. 2023, 37, 514–521. [Google Scholar] [CrossRef]
  8. Pogorzelska-Nowicka, E.; Hanula, M.; Pogorzelski, G. Extraction of polyphenols and essential oils from herbs with green extraction methods—An insightful review. Food Chem. 2024, 460, 140456. [Google Scholar] [CrossRef]
  9. Sridhar, A.; Ponnuchamy, M.; Kumar, P.S.; Kapoor, A.; Vo, D.-V.N.; Prabhakar, S. Techniques and modeling of polyphenol extraction from food: A review. Environ. Chem. Lett. 2021, 19, 3409–3443. [Google Scholar] [CrossRef]
  10. Ajila, C.M.; Brar, S.K.; Verma, M.; Tyagi, R.D.; Godbout, S.; Valéro, J.R. Extraction and Analysis of Polyphenols: Recent trends. Crit. Rev. Biotechnol. 2011, 31, 227–249. [Google Scholar] [CrossRef]
  11. Yenduri, S.; Venkatesh, K.G.; Naga Prashant, K. Recent Advances in Extraction of Polyphenols by Advanced Extraction Methods. Phytochem. Anal. 2025, 36, 1875–1892. [Google Scholar] [CrossRef]
  12. Duarte, H.; Gomes, V.; Aliaño-González, M.J.; Faleiro, L.; Romano, A.; Medronho, B. Ultrasound-Assisted Extraction of Polyphenols from Maritime Pine Residues with Deep Eutectic Solvents. Foods 2022, 11, 3754. [Google Scholar] [CrossRef] [PubMed]
  13. Chen, S.; Yuan, Y.; Zhang, F.; Lin, S.; Zou, P.; Farag, M.A.; Simal-Gandara, J.; Cao, H.; Xiao, J. UPLC-ESI-MS/MS-based chemometric approach for investigating the effect of conventional versus modern extraction methods on polyphenols recovery from grape seed wastes. Food Chem. 2025, 487, 144619. [Google Scholar] [CrossRef] [PubMed]
  14. Souadia, A.; Djemoui, A.; Souli, L.; Haiouani, K.; Atoki, A.V.; Djemoui, D.; Messaoudi, M.; Hegazy, S.; Alsaeedi, H.; Barhoum, A. Ultrasound-assisted extraction for maximizing total phenolics, flavonoid content, and antioxidant activity in Thymus algeriensis: Box-Behnken experimental design. Biomass Convers. Biorefinery 2025, 15, 12979–12994. [Google Scholar] [CrossRef]
  15. Wang, H.; Ma, X.; Cheng, Q.; Wang, L.; Zhang, L. Deep Eutectic Solvent-Based Ultrahigh Pressure Extraction of Baicalin from Scutellaria baicalensis Georgi. Molecules 2018, 23, 3233. [Google Scholar] [CrossRef]
  16. Satlewal, A.; Agrawal, R.; Bhagia, S.; Sangoro, J.; Ragauskas, A.J. Natural deep eutectic solvents for lignocellulosic biomass pretreatment: Recent developments, challenges and novel opportunities. Biotechnol. Adv. 2018, 36, 2032–2050. [Google Scholar] [CrossRef]
  17. Fernandes, C.; Melro, E.; Magalhães, S.; Alves, L.; Craveiro, R.; Filipe, A.; Valente, A.J.M.; Martins, G.; Antunes, F.E.; Romano, A.; et al. New deep eutectic solvent assisted extraction of highly pure lignin from maritime pine sawdust (Pinus pinaster Ait.). Int. J. Biol. Macromol. 2021, 177, 294–305. [Google Scholar] [CrossRef]
  18. Hammond, O.S.; Bowron, D.T.; Edler, K.J. The Effect of Water upon Deep Eutectic Solvent Nanostructure: An Unusual Transition from Ionic Mixture to Aqueous Solution. Angew. Chem. Int. Ed. 2017, 56, 9782–9785. [Google Scholar] [CrossRef]
  19. Ozbek Yazici, S.; Ozmen, İ. Ultrasound assisted extraction of phenolic compounds from Capparis Ovata var canescens fruit using deep eutectic solvents. J. Food Process. Preserv. 2022, 46, e16286. [Google Scholar] [CrossRef]
  20. Wu, L.; Li, L.; Chen, S.; Wang, L.; Lin, X. Deep eutectic solvent-based ultrasonic-assisted extraction of phenolic compounds from Moringa oleifera L. leaves: Optimization, comparison and antioxidant activity. Sep. Purif. Technol. 2020, 247, 117014. [Google Scholar] [CrossRef]
  21. Zhou, P.; Wang, X.; Liu, P.; Huang, J.; Wang, C.; Pan, M.; Kuang, Z. Enhanced phenolic compounds extraction from Morus alba L. leaves by deep eutectic solvents combined with ultrasonic-assisted extraction. Ind. Crops Prod. 2018, 120, 147–154. [Google Scholar] [CrossRef]
  22. Meng, Z.; Zhao, J.; Duan, H.; Guan, Y.; Zhao, L. Green and efficient extraction of four bioactive flavonoids from Pollen Typhae by ultrasound-assisted deep eutectic solvents extraction. J. Pharm. Biomed. Anal. 2018, 161, 246–253. [Google Scholar] [CrossRef] [PubMed]
  23. Ali, M.C.; Chen, J.; Zhang, H.; Li, Z.; Zhao, L.; Qiu, H. Effective extraction of flavonoids from Lycium barbarum L. fruits by deep eutectic solvents-based ultrasound-assisted extraction. Talanta 2019, 203, 16–22. [Google Scholar] [CrossRef] [PubMed]
  24. Ivanović, M.; Alañón, M.E.; Arráez-Román, D.; Segura-Carretero, A. Enhanced and green extraction of bioactive compounds from Lippia citriodora by tailor-made natural deep eutectic solvents. Food Res. Int. 2018, 111, 67–76. [Google Scholar] [CrossRef] [PubMed]
  25. Yang, J.; Yan, Z.; Li, L.; Zhang, L.; Zhao, M.; Yi, H.; Wang, Z.; Li, G.; Wang, Z.; Li, M.; et al. Green Extraction of Phenolic Compounds from Lotus (Nelumbo nucifera Gaertn) Leaf Using Deep Eutectic Solvents: Process Optimization and Antioxidant Activity. Separations 2023, 10, 272. [Google Scholar] [CrossRef]
  26. Benítez-Correa, E.; Bastías-Montes, J.M.; Acuña-Nelson, S.; Muñoz-Fariña, O. Effect of choline chloride-based deep eutectic solvents on polyphenols extraction from cocoa (Theobroma cacao L.) bean shells and antioxidant activity of extracts. Curr. Res. Food Sci. 2023, 7, 100614. [Google Scholar] [CrossRef]
  27. Nam, Y.H.; Ahn, S.M.; Seo, G.J.; Kim, N.W.; Shin, S.W.; Nuankaew, W.; Murughanantham, N.; Pandian, S.; Hwang, J.S.; Hong, B.N.; et al. Optimization of NADES-based green extraction of ellagitannins from rambutan peel with enhanced antioxidant activity. Food Chem. 2025, 475, 143308. [Google Scholar] [CrossRef]
  28. Alsaud, N.; Shahbaz, K.; Farid, M. Application of deep eutectic solvents in the extraction of polyphenolic antioxidants from New Zealand Manuka leaves (Leptospermum Scoparium): Optimization and antioxidant activity. J. Mol. Liq. 2021, 337, 116385. [Google Scholar] [CrossRef]
  29. El Achkar, T.; Greige-Gerges, H.; Fourmentin, S. Basics and properties of deep eutectic solvents: A review. Environ. Chem. Lett. 2021, 19, 3397–3408. [Google Scholar] [CrossRef]
  30. Gao, Y.; Fan, M.; Cheng, X.; Liu, X.; Yang, H.; Ma, W.; Guo, M.; Li, L. Deep eutectic solvent: Synthesis, classification, properties and application in macromolecular substances. Int. J. Biol. Macromol. 2024, 278, 134593. [Google Scholar] [CrossRef]
  31. Boateng, I.D. Evaluating the status quo of deep eutectic solvent in food chemistry. Potentials and limitations. Food Chem. 2023, 406, 135079. [Google Scholar] [CrossRef]
  32. García, G.; Aparicio, S.; Ullah, R.; Atilhan, M. Deep Eutectic Solvents: Physicochemical Properties and Gas Separation Applications. Energy Fuels 2015, 29, 2616–2644. [Google Scholar] [CrossRef]
  33. Saini, A.; Kumar, A.; Panesar, P.S.; Thakur, A. Potential of deep eutectic solvents in the extraction of value-added compounds from agro-industrial by-products. Appl. Food Res. 2022, 2, 100211. [Google Scholar] [CrossRef]
  34. Cvjetko Bubalo, M.; Ćurko, N.; Tomašević, M.; Kovačević Ganić, K.; Radojčić Redovniković, I. Green extraction of grape skin phenolics by using deep eutectic solvents. Food Chem. 2016, 200, 159–166. [Google Scholar] [CrossRef] [PubMed]
  35. Saha, S.K.; Dey, S.; Chakraborty, R. Effect of choline chloride-oxalic acid based deep eutectic solvent on the ultrasonic assisted extraction of polyphenols from Aegle marmelos. J. Mol. Liq. 2019, 287, 110956. [Google Scholar] [CrossRef]
  36. Soukaina, K.; Safa, Z.; Soukaina, H.; Hicham, C.; Bouchra, C. Choline chloride-based deep eutectic solvents (NADES): Potential use as green extraction media for polyphenols from Mentha pulegium, antioxidant activity, and antifungal activity. Microchem. J. 2024, 199, 110174. [Google Scholar] [CrossRef]
  37. Ruesgas-Ramón, M.; Suárez-Quiroz, M.L.; González-Ríos, O.; Baréa, B.; Cazals, G.; Figueroa-Espinoza, M.C.; Durand, E. Biomolecules extraction from coffee and cocoa by- and co-products using deep eutectic solvents. J. Sci. Food Agric. 2020, 100, 81–91. [Google Scholar] [CrossRef]
  38. Yu, P.; Li, Q.; Feng, Y.; Ma, S.; Chen, Y.; Li, G. Extraction and Analysis of Six Effective Components in Glycyrrhiza uralensis Fisch by Deep Eutectic Solvents (DES) Combined with Quantitative Analysis of Multi-Components by Single Marker (QAMS) Method. Molecules 2021, 26, 1310. [Google Scholar] [CrossRef]
  39. Tomas, M.; Wen, Y.; Liao, W.; Zhang, L.; Zhao, C.; McClements, D.J.; Nemli, E.; Bener, M.; Apak, R.; Capanoglu, E. Recent progress in promoting the bioavailability of polyphenols in plant-based foods. Crit. Rev. Food Sci. Nutr. 2025, 65, 2343–2364. [Google Scholar] [CrossRef]
  40. Cao, J.; Wang, C.; Shi, L.; Cheng, Y.; Hu, H.; Zeng, B.; Zhao, F. Water based-deep eutectic solvent for ultrasound-assisted liquid–liquid microextraction of parabens in edible oil. Food Chem. 2022, 383, 132586. [Google Scholar] [CrossRef]
  41. Rashid, R.; Mohd Wani, S.; Manzoor, S.; Masoodi, F.A.; Masarat Dar, M. Green extraction of bioactive compounds from apple pomace by ultrasound assisted natural deep eutectic solvent extraction: Optimisation, comparison and bioactivity. Food Chem. 2023, 398, 133871. [Google Scholar] [CrossRef] [PubMed]
  42. Kaur, K.; Schmitt-Kopplin, P.; Malik, A.K. Green and efficient extraction of phenolic compounds from Neem leaves using deep eutectic solvents based ultrasonic-assisted extraction. Food Chem. 2024, 451, 139500. [Google Scholar] [CrossRef] [PubMed]
  43. Lin, X.-T.; Zhou, S.-X.; Sun, Z.-P.; Cao, M.-Y.; Zhou, T.; Zhao, L.-Y.; Chen, G.-T. Deep eutectic solvent-based ultrasonic-assisted extraction of polyphenol from Chenopodium quinoa Willd.: Optimization and lipid-lowering activity. Food Chem. 2025, 464, 141733. [Google Scholar] [CrossRef] [PubMed]
  44. Zhen, S.; Chen, S.; Geng, S.; Zhang, H.; Chen, Y.; Liu, B. Ultrasound-Assisted Natural Deep Eutectic Solvent Extraction and Bioactivities of Flavonoids in Ampelopsis grossedentata Leaves. Foods 2022, 11, 668. [Google Scholar] [CrossRef]
  45. Milani, G.; Vian, M.; Cavalluzzi, M.M.; Franchini, C.; Corbo, F.; Lentini, G.; Chemat, F. Ultrasound and deep eutectic solvents: An efficient combination to tune the mechanism of steviol glycosides extraction. Ultrason. Sonochemistry 2020, 69, 105255. [Google Scholar] [CrossRef]
  46. Ling, J.K.; Hadinoto, K. Deep Eutectic Solvent as Green Solvent in Extraction of Biological Macromolecules: A Review. Int. J. Mol. Sci. 2022, 23, 3381. [Google Scholar] [CrossRef]
  47. Vilková, M.; Płotka-Wasylka, J.; Andruch, V. The role of water in deep eutectic solvent-base extraction. J. Mol. Liq. 2020, 304, 112747. [Google Scholar] [CrossRef]
  48. Esclapez, M.D.; García-Pérez, J.V.; Mulet, A.; Cárcel, J.A. Ultrasound-Assisted Extraction of Natural Products. Food Eng. Rev. 2011, 3, 108–120. [Google Scholar] [CrossRef]
  49. Song, X.; Zhang, R.; Xie, T.; Wang, S.; Cao, J. Deep Eutectic Solvent Micro-Functionalized Graphene Assisted Dispersive Micro Solid-Phase Extraction of Pyrethroid Insecticides in Natural Products. Front. Chem. 2019, 7, 594. [Google Scholar] [CrossRef]
  50. Qin, G.; Zhang, F.; Ren, M.; Chen, X.; Liu, C.; Li, G.; Gao, Q.; Qiao, L.; Jiang, Y.; Zhu, L.; et al. Eco-friendly and efficient extraction of polyphenols from Ligustrum robustum by deep eutectic solvent assisted ultrasound. Food Chem. 2023, 429, 136828. [Google Scholar] [CrossRef]
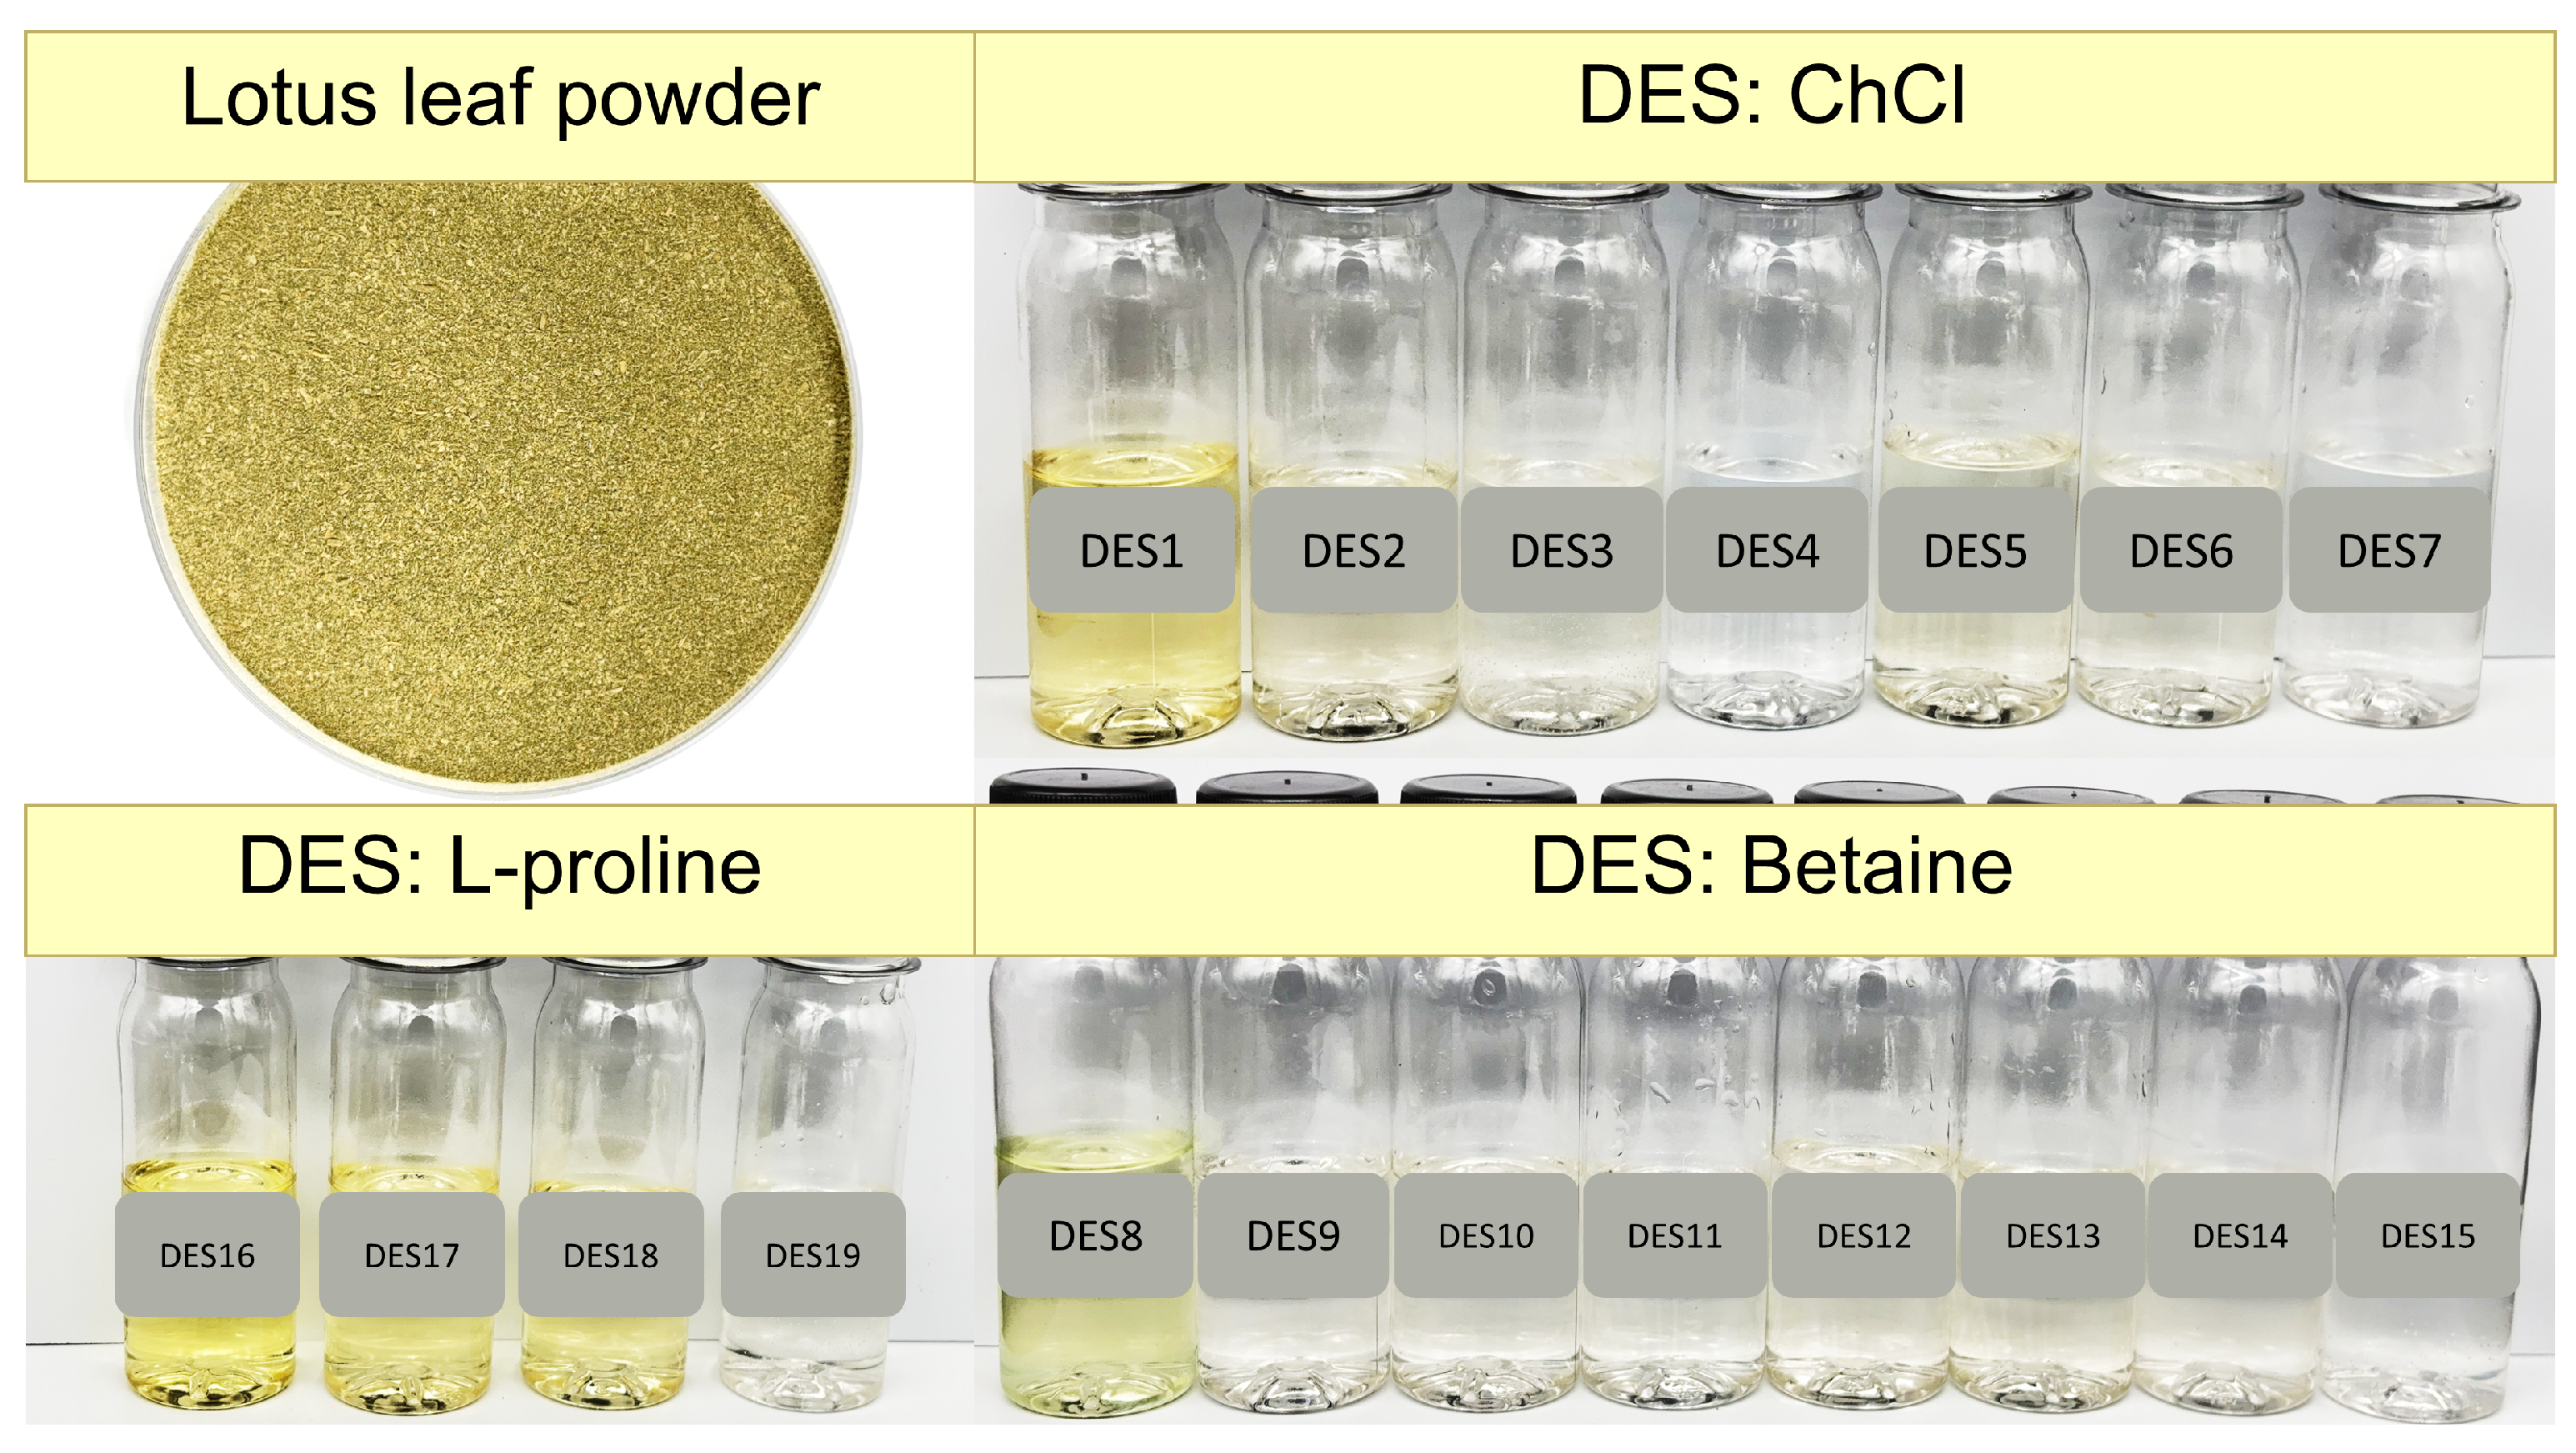
Figure 1. Images of dried lotus leaf powder and the prepared DES systems composed of choline chloride (ChCl), betaine, and L-proline as HBAs.
Foods 14 04045 g001
Figure 2. Total phenolic content (TPC) extracted from different DES combinations based on (A) ChCl, (B) betaine, and (C) L-proline. “ns” indicate not significant, “*”, “**”, “***”, and “****” indicate significant differences (p < 0.05, <0.01, <0.001, and <0.0001, respectively). (D) Pearson correlation analysis between TPC and viscosity, density, and pH. Values represent correlation coefficients.
Foods 14 04045 g002
Figure 3. (A) DPPH radical scavenging capacity (IC50) and (B) ferric reducing antioxidant power (FRAP) of extracts obtained using water, 75% ethanol, DES-2, DES-15, and DES-19. “ns” indicate not significant, “*”, “**”, and “****” indicate significant differences (p < 0.05, <0.01, and <0.0001, respectively).
Foods 14 04045 g003
Figure 4. (A) Effects of molar ratio, water content, solid-to-liquid ratio, and ultrasonic time on TPC yield in single-factor experiments. “ns” indicate not significant, “*”, “**”, and “***” indicate significant differences (p < 0.05, <0.01, and <0.001, respectively) (B) Three-dimensional response surface plots showing interactions between variables for polyphenol extraction using DES ChCl–lactic acid.
Foods 14 04045 g004
Figure 5. (A) SEM images (×200 & ×500) of untreated lotus leaf powder, and samples extracted with 75% ethanol and DES ChCl–lactic acid. Arrows indicate fragmented and porous structures. (B) FTIR spectra of ChCl, lactic acid, and DES ChCl–lactic acid.
Foods 14 04045 g005
Table 1. The common combinations for the extraction of plant polyphenols using DESs.
Plant
Material
DESs CombinationExtraction
Conditions
Extraction YieldResultsRef.
Lotus leavesChCl–Glycerol (1:2)
ChCl–Propylene glycol (1:2)
ChCl–Lactic acid (1:2)
ChCl–Citric acid (1:2)
ChCl–Malic acid (1:2)
Bet–Glycerol (1:2)
Bet–Propylene glycol (1:2)
Bet–Citric acid (1:2)
Bet–Malic acid (1:2)
Lactic acid–Glycerol (1:2)
Lactic acid–Propylene glycol (1:2)
Citric acid–Glycerol (1:2)
Citric acid–Propylene glycol (1:2)
50 °C/60 min (140 r/min)Flavonoids: 126.10 mg/g
Polyphenols: 126.10 mg/g
More efficient extraction yields were demonstrated by DES made of lactic acid and glycerol in a 1:2 ratio, 29% of water content, 37:1 mL/g of liquid–solid ratio, 61 min of extraction time, and 53 °C of extraction temperature.[25]
Capparis ovata var canescens fruitChCl–Urea (1:2)
ChCl–Glycerol (1:3)
ChCl–Lactic acid (1:3)
30 °C/25 min, assisted by ultrasound extractionFlavonoids: 13.04 mg QE/g DW
Polyphenols: 30.55 mg GAE/g DW
The DES with a molar ratio of 1:2 between ChCl and lactic acid performed better for extraction under the ideal circumstances of 20% water, 20 mL/g, 50 °C and 30 min.[19]
Moringa oleifera L. leavesChCl–Glycerol (1:1)
ChCl–Levulinic acid (1:2)
ChCl–Ethylene glycol (1:2)
Bet–Levulinic acid (1:2)
Bet–Glycerol (1:2)
Pro–Levulinic acid (1:2)
Pro–Glycerol (2:5)
Pro–Lactic acid (1:1)
40 °C/30 min, assisted by ultrasound extractionVicenin-2: 17.6 mg/g
Orientin: 23.6 mg/g
The combination of DES L-Proline and glycerol produced the highest total phenolic content. 37% water content, 144 W ultrasonic power, and 40 °C were the ideal extraction conditions. [20]
Mulberry leavesChCl–Urea (1:2)
ChCl–Glycerol (1:2)
ChCl–Citric acid (2:1)
Bet–Lactic acid (1:1)
Bet–Glycerol (1:2)
Pro–Glycerol (2:5)
Pro–Lactic acid (1:1)
40 °C/30 min, assisted by ultrasound extractionPolyphenols: 22.66 mg/gThe ideal circumstances for obtaining the high level of total phenolic content were ChCl: citric acid (2:1) DES with a 75% water content, 50 mg/mL of solid/liquid ratios, 40 °C and 30 min of extraction time. [21]
Pollen TyphaeChCl–Glycerol (1:4)
ChCl-D–glucose (1:4)
ChCl–Lactic acid (1:4)
ChCl:1,2–propanediol (1:4)
Pro–Glycerol (4:11)
Room temperature/35 min, assisted by ultrasound extractionQuercetin: 0.383 μg /mg
Naringenin: 0.048 μg /mg
Kaempferol: 0.391 μg /mg
Isorhamnetin: 3.149 μg /mg
ChCl:1,2-propanediol (1:4) produced the best polyphenols production under optimal circumstances: 30% of water content, 50 mg/mL of solid/liquid ratios.[22]
Lycium barbarum L. fruitsChCl–Glycerol (1:2)
ChCl–Urea (1:2)
ChCl-p-Toluenesulfonic acid (1:2)
Room temperature/1.5 h, assisted by ultrasound extractionMyricetin: 57.2 mg/g
Morin:12.7 mg/g
Rutin:9.1 mg/g
The highest polyphenols production was detected in the ChCl-p-Toluenesulfonic acid (1:2) extracts over a period of 90 min and a solid/liquid ratio of 50 mg/mL. [23]
L. citriodora leavesChCl–Lactic acid (1:2)
ChCl–Ethylene Glycol (1:2)
ChCl–Maltose (3:1)
ChCl–Urea (1:2)
Microwaved irradiated at 65 °C for 20 minFlavonoids: 9.02 mg/g Iridoids: 7.25 mg/g
Phenylpropanoids: 17.23 mg/g
The maximum phenol extraction was obtained after 17.08 min of microwave irradiation time, 63.68 °C, 32.19% of water content with a ChCl: lactic acid (1:2) mixture.[24]
ChCl: choline chloride; Bet: betaine; Pro: L-Proline.
Table 2. Parameters factor and their levels used in the study.
Parameters FactorSymbolUnitLowMediumHigh
Molar ratio of HBA/HBDA 123
Liquid–solid ratioB 152025
Ultrasonic timeCmin506070
Water content D%01020
Table 3. Composition and properties of DES combinations and their polyphenol extraction efficiency.
No.HBAHBDMole Ratio (HBA/HBD)Water Content (%)Heating Time (min)Viscosity/mPa·sDensity/g/cm3pH
DES-1Choline chlorideLevulinic acid1:220%6219.1 ± 3.561.13 ± 0.121.63 ± 0.02
DES-2Lactic acid1:23.5167.4 ± 2.041.14 ± 0.130.72 ± 0.02
DES-3D-glucose2:111.5618.2 ± 3.421.20 ± 0.023.88 ± 0.01
DES-4Maltose4:1123.4 ± 1.981.15 ± 0.043.71 ± 0.02
DES-5Glycerol1:22347.7 ± 1.231.19 ± 0.104.14 ± 0.04
DES-6Glycerol1:32357.3 ± 5.781.20 ± 0.103.95 ± 0.03
DES-7Urea1:21.513.2 ± 0.681.16 ± 0.128.51 ± 0.05
DES-8BetaineLevulinic acid1:220%231055.1 ± 5.441.16 ± 0.154.88 ± 0.03
DES-9Lactic acid1:213754.2 ± 4.321.18 ± 0.053.72 ± 0.02
DES-10D-glucose2:14052 ± 9.781.27 ± 0.136.94 ± 0.03
DES-11Maltose4:11695.8 ± 2.071.19 ± 0.147.52 ± 0.01
DES-12Ethylene glycol1:2356 ± 1.221.12 ± 0.088.77 ± 0.04
DES-13Glycerol1:21378.7 ± 1.261.18 ± 0.037.94 ± 0.02
DES-14Glycerol1:31341.3 ± 0.741.20 ± 0.026.07 ± 0.02
DES-15Urea1:224.8 ± 1.661.13 ± 0.049.87 ± 0.03
DES-16L-ProlineMaltose4:120%1661.6 ± 1.561.25 ± 0.046.48 ± 0.05
DES-17Glycerol1:222744.8 ± 7.871.29 ± 0.107.64 ± 0.04
DES-18Glycerol1:317145.5 ± 4.671.26 ± 0.126.55 ± 0.02
DES-19Urea1:2920.8 ± 5.791.20 ± 0.168.07 ± 0.01
Table 4. Box–Behnken design (BBD) with experimental value for lotus leaf TPC yield (mg GAE/g DW), response surface quadratic model analysis of variance (ANOVA), and response fitting statistics.
RunBBD ExperimentsANOVA
ABC (min)D (%)Y (mg GAE/g DW) Sum of SquaresDegree of FreedomMean SquareF-Valuep-Value
11156010100.43model30,556.63142182.6216.07<0.0001
23156010177.64A. Molar ratio of HBA/HBD9914.4619914.4673.01<0.0001
31256010132.78B. Liquid–solid ratio547.561547.564.030.0643
43256010187.80C. Ultrasonic time2071.9412071.9415.260.0016
5220500111.48D. Water contents2.8612.860.02110.8866
6220700162.37AB123.031123.030.9060.3573
72205020107.31AC940.281940.286.920.0197
82207020148.10AD4023.0914023.0929.63<0.0001
912060066.19BC1046.3511046.357.710.0149
10320600181.01BD89.7189.70.66060.43
111206020139.30CD25.47125.470.18750.6716
123206020127.27A23342.3713342.3724.610.0002
132155010128.79B21314.711314.79.680.0077
142255010166.05C21502.1311502.1311.060.005
152157010187.80D29899.9719899.9772.9<0.0001
162257010160.37Residual1901.1114135.79
17120501095.16Lack of fit1733.9710173.44.150.0913
183205010180.78Pure error167.14441.78
191207010132.15Cor total32,457.7428
203207010156.44
21215600112.60
22225600136.43
232156020124.54
242256020129.43
252206010190.76
262206010193.68
272206010181.56
282206010181.05
292206010179.38
Table 5. Analysis of validation test results.
WaterEthanolDES-2
TPC (mg GAE/g DW)19.92 ± 3.50 a31.13 ± 9.41 a187.23 ± 14.67 b
DPPH-IC50 (mg/mL)7.36 ± 1.08 a4.38 ± 0.83 b0.92 ± 0.23 c
FRAP (mg Trolox/g DW)13.27 ± 0.10 a14.92 ± 1.00 a21.56 ± 3.05 b
The letters in the upper-right corner of the same row indicate standard deviations, and a, b, and c indicate significant differences (p < 0.05).
Disclaimer/Publisher’s Note: The statements, opinions and data contained in all publications are solely those of the individual author(s) and contributor(s) and not of MDPI and/or the editor(s). MDPI and/or the editor(s) disclaim responsibility for any injury to people or property resulting from any ideas, methods, instructions or products referred to in the content.