


Research on the Process and Quality of Prepacked Braised Meat Products


Abstract
1. Introduction
2. Materials and Methods
2.1. Materials
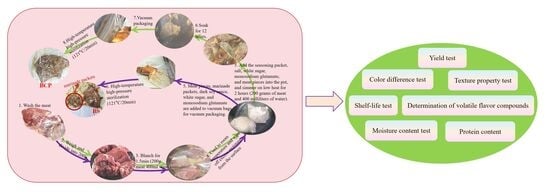
2.2. Preparation of the Experimental Group
2.3. Preparation of the Control Group
2.4. Shelf-Life Test
2.5. Color Difference Test
2.6. Texture Property Test
2.7. Moisture Content Test
2.8. Yield Test
2.9. Protein Content
2.10. Determination of Volatile Flavor Compounds
2.11. Sensory Evaluation
2.12. Statistical Analysis
3. Results and Discussion
3.1. Shelf-Life Analysis
3.1.1. Total Bacterial Colony Analysis
3.1.2. Analysis of Coliform Bacteria
3.1.3. Pathogenic Bacteria Analysis
3.1.4. Calculate Shelf-Life
3.2. Color Difference Analysis
3.3. Texture Analysis
3.4. Moisture Content Analysis
3.5. Analysis of Meat Yield
3.6. Protein Content Analysis
3.7. Sensory Evaluation Analysis
3.8. Analysis of Volatile Flavor Substances
4. Conclusions
Author Contributions
Funding
Institutional Review Board Statement
Informed Consent Statement
Data Availability Statement
Conflicts of Interest
References
- Zeng, W.; Wen, W.; Deng, Y.; Tian, Y.; Sun, H.; Sun, Q. Chinese Ethnic Meat Products: Continuity and Development. Meat Sci. 2016, 120, 37–46. [Google Scholar] [CrossRef]
- Wang, X.; Yao, Y.; Yu, J.; Cui, H.; Hayat, K.; Zhang, X.; Ho, C.-T. Evolution of Lean Meat Tenderness Stimulated by Coordinated Variation of Water Status, Protein Structure and Tissue Histology during Cooking of Braised Pork. Food Res. Int. 2023, 171, 113081. [Google Scholar] [CrossRef]
- Cao, Y.; Sun, M.; Huang, T.; Zhu, Z.; Huang, M. Effects of Heat Sterilization on Protein Physicochemical Properties and Release of Metabolites of Braised Chicken after in vitro Digestion. Food Chem. 2024, 445, 138670. [Google Scholar] [CrossRef]
- Rajkumar, V.; Dushyanthan, K.; Das, A.K. Retort pouch processing of Chettinad style goat meat curry—A heritage meat product. Food Sci. Technol. 2010, 47, 372–379. [Google Scholar] [CrossRef]
- Rajan, S.; Kulkarni, V.V.; Chandirasekaran, V. Preparation and storage stability of retort processed Chettinad chicken. Food Sci. Technol. 2014, 51, 173–177. [Google Scholar] [CrossRef]
- Devadason, I.P.; Anjaneyulu, A.S.R.; Mendiratta, S.K.; Murthy, T.R.K. Quality and shelf life of buffalo meat blocks processed in retort pouches. Food Sci. Technol. 2014, 51, 3991–3997. [Google Scholar] [CrossRef]
- Zhang, Z.; Sun, H.; Liu, J.; Zhang, H.; Huang, F. Changes in Eating Quality of Chinese Braised Beef Produced from Three Different Muscles. Int. J. Gastron. Food Sci. 2022, 29, 100584. [Google Scholar] [CrossRef]
- Gooding, E.G.B.; Duckworth, R.B. Accelerated Storage Tests for Dehydrated Vegetables. Nature 1956, 177, 897–898. [Google Scholar] [CrossRef]
- GB 4789.4-2024; National Food Safety Standards—Food Microbiological Testing—Salmonella Testing. National Health Commission of the People’s Republic of China & State Administration for Market Regulation: Beijing, China, 2024.
- GB 4789.30-2016; National Food Safety Standards—Food Microbiological Testing—Enumeration of Listeria Monocytogenes. National Health and Family Planning Commission of the People’s Republic of China & China Food and Drug Administration: Beijing, China, 2016.
- GB 4789.10-2016; National Food Safety Standards—Food Microbiological Testing—Enumeration of Staphylococcus Aureus. National Health and Family Planning Commission of the People’s Republic of China & China Food and Drug Administration: Beijing, China, 2016.
- GB 4789.2-2022; National Food Safety Standards—Food Microbiological Testing—Coliforms and Escherichia coli/O157:H7 Testing. National Health Commission of the People’s Republic of China & State Administration for Market Regulation: Beijing, China, 2022.
- GB 4789.3-2016; National Food Safety Standards—Food Microbiological Testing—Enumeration of Coliforms. National Health and Family Planning Commission of the People’s Republic of China & China Food and Drug Administration: Beijing, China, 2016.
- Du, J.; Zhang, M.; Zhang, L.; Law, C.L.; Liu, K. Shelf-Life Prediction and Critical Value of Quality Index of Sichuan Sauerkraut Based on Kinetic Model and Principal Component Analysis. Foods 2022, 11, 1762. [Google Scholar] [CrossRef] [PubMed]
- Wang, S.; Wang, M.; Wang, Y.; Wu, Z.; Yang, J.; Li, H.; Li, H.; Yu, J. Control of the Maillard Reaction and Secondary Shelf-Life Prediction of Infant Formula during Domestic Use. J. Food Sci. 2023, 88, 681–695. [Google Scholar] [CrossRef]
- Wang, Y.; Liang, H.; Xu, R.; Lu, B.; Song, X.; Liu, B. Effects of Temperature Fluctuations on the Meat Quality and Muscle Microstructure of Frozen Beef. Int. J. Refrig. 2020, 116, 1–8. [Google Scholar] [CrossRef]
- Luzardo, S.; Saadoun, A.; Cabrera, M.C.; Terevinto, A.; Brugnini, G.; Rodriguez, J.; de Souza, G.; Rovira, P.; Rufo, C. Effect of Beef Long-Storage under Different Temperatures and Vacuum-Packaging Conditions on Meat Quality, Oxidation Processes and Microbial Growth. J. Sci. Food Agric. 2024, 104, 1143–1153. [Google Scholar] [CrossRef]
- GB 5009.3-2016; National Food Safety Standards—Determination of Moisture in Food. National Health and Family Planning Commission of the People’s Republic of China: Beijing, China, 2016.
- Guo, L.; Hong, C.; Wang, W.; Zhang, X.; Chen, J.; Chen, Z.; Ashokkumar, M.; Ma, H. Evaluation of Low-Temperature Ultrasonic Marination of Pork Meat at Various Frequencies on Physicochemical Properties, Myoglobin Levels, and Volatile Compounds. Meat Sci. 2024, 217, 109606. [Google Scholar] [CrossRef] [PubMed]
- GB 5009.5-2016; National Food Safety Standard—Determination of Protein in Foods. National Health and Family Planning Commission of the People’s Republic of China: Beijing, China, 2016.
- Meng, R.; Pu, D.; Xu, Z.; Liu, J.; Zhang, Q.; Xu, M.; Sun, B.; Zhang, Y. Decoding the Aroma Changes of Stir-Fried Shredded Potatoes with Different Soy Sauces Using Thermal Desorption Combined with Gas Chromatography-Mass Spectrometry and Sensory Evaluation. Food Chem. 2025, 467, 142252. [Google Scholar] [CrossRef] [PubMed]
- GB/T 22210-2008; Criterion for Sensory Evaluation of Meat and Meat Products. General Administration of Quality Supervision, Inspection and Quarantine of the People’s Republic of China & Standardization Administration of China: Beijing, China, 2008.
- GB 4789.2-2022; National Food Safety Standard—Food Microbiological Examination—Determination of Total Bacterial Count. National Health Commission of the People’s Republic of China: Beijing, China, 2022.
- GB 29921-2016; National Food Safety Standard—Maximum Limits of Pathogenic Microorganisms in Prepackaged Foods. National Health and Family Planning Commission of the People’s Republic of China & China Food and Drug Administration: Beijing, China, 2016.
- Swatland, H.J. Iridescence in Beef Caused by Multilayer Interference from Sarcomere Discs. Meat Sci. 2012, 90, 398–401. [Google Scholar] [CrossRef]
- Kim, A.-N.; Lee, K.-Y.; Park, C.E.; Choi, S.-G. Effect of Heating under Different Vacuum Levels on Physicochemical and Oxidative Properties of Beef Sirloin. Foods 2023, 12, 1393. [Google Scholar] [CrossRef]
- Duque-Estrada, P.; Berton-Carabin, C.C.; Nieuwkoop, M.; Dekkers, B.L.; Janssen, A.E.M.; van der Goot, A.J. Protein Oxidation and in vitro Gastric Digestion of Processed Soy-Based Matrices. J. Agric. Food Chem. 2019, 67, 9591–9600. [Google Scholar] [CrossRef]
- Zhao, Y.; Wang, G.; Zhang, M.; Ma, X.; Pang, H.; Ding, Y. Synergistic Effects of Glycosylation and Ginger Essential Oils on Soy Protein Isolate—Artemisia sphaerocephala Krasch. Gum Composite Films for Chilled Grass Carp Preservation. Int. J. Biol. Macromol. 2025, 318, 145052. [Google Scholar] [CrossRef] [PubMed]
- Chen, W.; Yang, J.; Huang, N.; Zhang, Q.; Zhong, Y.; Yang, H.; Liu, W.; Yue, Y. Effect of Combined Treatments of Electron Beam Irradiation with Antioxidants on the Microbial Quality, Physicochemical Characteristics and Volatiles of Vacuum-Packed Fresh Pork during Refrigerated Storage. Food Control 2023, 145, 109480. [Google Scholar] [CrossRef]
- Lefèvre, C.; Bohuon, P.; Lullien-Pellerin, V.; Mestres, C. Modeling the Thermal Denaturation of the Protein-Water System in Pulses (Lentils, Beans, and Chickpeas). J. Agric. Food Chem. 2022, 70, 9980–9989. [Google Scholar] [CrossRef]
- Zhang, M.; Zhu, S.; Li, Q.; Xue, D.; Jiang, S.; Han, Y.; Li, C. Effect of Thermal Processing on the Conformational and Digestive Properties of Myosin. Foods 2023, 12, 1249. [Google Scholar] [CrossRef]
- Yashin, A.; Yashin, Y.; Xia, X.; Nemzer, B. Antioxidant Activity of Spices and Their Impact on Human Health: A Review. Antioxidants 2017, 6, 70. [Google Scholar] [CrossRef] [PubMed]
- Han, L.; Lin, Q.; Liu, G.; Han, D.; Niu, L. Review of the Formation and Influencing Factors of Food-Derived Glycated Lipids. Crit. Rev. Food Sci. Nutr. 2022, 62, 3490–3498. [Google Scholar] [CrossRef] [PubMed]
- Wang, N.; Wang, J.; Zhang, Y.; Wu, Z.; Wang, D.; Xiao, H.; Lyu, X.; Chen, H.; Wei, F. Comprehensive Lipidomics and Volatile Compounds Profiling Reveals Correlation of Lipids and Flavors in DHA-Enriched Egg Yolk. Oil Crop Sci. 2023, 8, 27–34. [Google Scholar] [CrossRef]
- Zhang, Z.; Kuang, H.; Wang, B.; Cao, Y. Metabolomics Reveals Factors Affecting the Radical Reaction of Sulfides during Thermal Processing for Meaty Aroma. Food Res. Int. 2024, 182, 114149. [Google Scholar] [CrossRef]


| Sample | Temperature/℃ | TCV/(CFU/g) | TC/(CFU/g) | S/(CFU/25 g) | SA/(CFU/g) | LM/(CFU/g) |
|---|---|---|---|---|---|---|
| 80 d | ||||||
| BS | 35 | <10 | <10 | - | <10 | - |
| 45 | <10 | <10 | - | <10 | - | |
| BCP | 35 | <10 | <10 | - | <10 | - |
| 45 | <10 | <10 | - | <10 | - | |
| PS | 35 | <10 | <10 | - | <10 | - |
| 45 | <10 | <10 | - | <10 | - | |
| PCP | 35 | <10 | <10 | - | <10 | - |
| 45 | <10 | <10 | - | <10 | - | |
| CS | 35 | <10 | <10 | - | <10 | - |
| 45 | <10 | <10 | - | <10 | - | |
| CCP | 35 | <10 | <10 | - | <10 | - |
| 45 | <10 | <10 | - | <10 | - | |
| 100 d | ||||||
| BS | 35 | <10 | <10 | - | <10 | - |
| 45 | <10 | <10 | - | <10 | - | |
| BCP | 35 | <10 | <10 | - | <10 | - |
| 45 | <10 | <10 | - | <10 | - | |
| PS | 35 | <10 | <10 | - | <10 | - |
| 45 | <10 | <10 | - | <10 | - | |
| PCP | 35 | <10 | <10 | - | <10 | - |
| 45 | <10 | <10 | - | <10 | - | |
| CS | 35 | <10 | <10 | - | <10 | - |
| 45 | <10 | <10 | - | <10 | - | |
| CCP | 35 | <10 | <10 | - | <10 | - |
| 45 | <10 | <10 | - | <10 | - | |
| 120 d | ||||||
| BS | 35 | <10 | <10 | - | <10 | - |
| 45 | <10 | <10 | - | <10 | - | |
| BCP | 35 | <10 | <10 | - | <10 | - |
| 45 | <10 | <10 | - | <10 | - | |
| PS | 35 | <10 | <10 | - | <10 | - |
| 45 | <10 | <10 | - | <10 | - | |
| PCP | 35 | <10 | <10 | - | <10 | - |
| 45 | <10 | <10 | - | <10 | - | |
| CS | 35 | <10 | <10 | - | <10 | - |
| 45 | <10 | <10 | - | <10 | - | |
| CCP | 35 | <10 | <10 | - | <10 | - |
| 45 | <10 | <10 | - | <10 | - | |
| 140 d | ||||||
| BS | 35 | <10 | <10 | - | <10 | - |
| 45 | 15 | <10 | - | <10 | - | |
| BCP | 35 | <10 | <10 | - | <10 | - |
| 45 | 130 | <10 | - | <10 | - | |
| PS | 35 | <10 | <10 | - | <10 | - |
| 45 | 44 | <10 | - | <10 | - | |
| PCP | 35 | <10 | <10 | - | <10 | - |
| 45 | 93 | <10 | - | <10 | - | |
| CS | 35 | <10 | <10 | - | <10 | - |
| 45 | 65 | <10 | - | <10 | - | |
| CCP | 35 | <10 | <10 | - | <10 | - |
| 45 | 110 | <10 | - | <10 | - | |
| 160 d | ||||||
| BS | 35 | <10 | <10 | - | <10 | - |
| 45 | >1 × 10⁵ | <10 | - | <10 | - | |
| BCP | 35 | <10 | <10 | - | <10 | - |
| 45 | >1 × 10⁵ | <10 | - | <10 | - | |
| PS | 35 | <10 | <10 | - | <10 | - |
| 45 | >1 × 10⁵ | <10 | - | <10 | - | |
| PCP | 35 | <10 | <10 | - | <10 | - |
| 45 | >1 × 10⁵ | <10 | - | <10 | - | |
| CS | 35 | <10 | <10 | - | <10 | - |
| 45 | >1 × 10⁵ | <10 | - | <10 | - | |
| CCP | 35 | <10 | <10 | - | <10 | - |
| 45 | >1 × 10⁵ | <10 | - | <10 | - | |
| 180 d | ||||||
| BS | 35 | <10 | <10 | - | <10 | - |
| BCP | 35 | <10 | <10 | - | <10 | - |
| PS | 35 | <10 | <10 | - | <10 | - |
| PCP | 35 | <10 | <10 | - | <10 | - |
| CS | 35 | <10 | <10 | - | <10 | - |
| CCP | 35 | <10 | <10 | - | <10 | - |
| 200 d | ||||||
| BS | 35 | <10 | <10 | - | <10 | - |
| BCP | 35 | <10 | <10 | - | <10 | - |
| PS | 35 | <10 | <10 | - | <10 | - |
| PCP | 35 | <10 | <10 | - | <10 | - |
| CS | 35 | <10 | <10 | - | <10 | - |
| CCP | 35 | <10 | <10 | - | <10 | - |
| Parameter | Time | Uncertainty (δ) | Relative Uncertainty |
|---|---|---|---|
| F2 | 140 days | ±20 days | 14.30% |
| F1 | 200 days | ±20 days | 10.00% |
| Q10 | 1.43 | ±0.25 | 17.40% |
| F | 286 days | ±46 days | 16.20% |
| NO. | Compounds | CAS | Similarity | Quantitative/ Reference Ions | Category | BS-1 | BCP-1 | BS-200 | BCP-200 | PS-1 | PCP-1 | PS-200 | PCP-2 | CS-1 | CCP-1 | CS-200 | CCP-200 |
|---|---|---|---|---|---|---|---|---|---|---|---|---|---|---|---|---|---|
| 1 | Dimethyl disulfide | 624-92-0 | 99 | 94, 79, 45 | Ethers | - | - | - | - | - | 5.564 ± 0.585 | - | 8.204 ± 0.879 | - | - | - | - |
| 2 | Hexanal | 66-25-1 | 99 | 56, 44, 41 | Aldehydes | 0.991 ± 0.031 | 1.698 ± 0.098 | 0.022 ± 0.004 | 0.917 ± 0.065 | 0.295 ± 0.078 | 1.240 ± 0.086 | 0.049 ± 0.001 | 2.737 ± 0.206 | 0.343 ± 0.041 | 0.633 ± 0.028 | 0.115 ± 0.029 | 2.081 ± 0.136 |
| 3 | Dodecane | 112-40-3 | 91 | 57, 43, 71 | Alkanes | 0.486 ± 0.206 | - | 0.023 ± 0.004 | 0.374 ± 0.136 | 0.378 ± 0.225 | 0.372 ± 0.335 | - | 0.388 ± 0.252 | 0.158 ± 0.022 | 0.239 ± 0.087 | - | 0.519 ± 0.173 |
| 4 | Eucalyptol | 470-82-6 | 98 | 43, 108, 81 | Alcohols | 3.286 ± 1.522 | 1.636 ± 0.644 | 2.010 ± 0.498 | 1.671 ± 0.948 | 1.999 ± 1.125 | 0.609 ± 0.313 | 5.245 ± 0.293 | 1.317 ± 0.548 | 1.921 ± 0.786 | 0.551 ± 0.355 | 6.436 ± 1.290 | 0.516 ± 0.348 |
| 5 | 2-Pentyl-furan, | 3777-69-3 | 97 | 81, 82, 138 | Others | - | - | - | 1.518 ± 0.812 | - | - | - | 1.880 ± 0.627 | - | 1.209 ± 0.718 | - | 5.848 ± 2.148 |
| 6 | 4-Octanone | 589-63-9 | 96 | 71, 57, 85 | Ketones | 0.237 ± 0.097 | - | - | - | - | 0.349 ± 0.154 | - | 0.234 ± 0.058 | 0.146 ± 0.066 | 0.196 ± 0.020 | - | 0.445 ± 0.040 |
| 7 | Cyclohexane, ethoxy | 932-92-3 | 98 | 85, 57, 41 | Alkanes | - | - | - | - | - | 0.823 ± 0.492 | - | 1.691 ± 0.372 | - | - | - | - |
| 8 | 3-methyl-5-propylnonane | 31081-18-2 | 96 | 71, 57, 85 | Alkanes | - | - | - | 0.902 ± 0.448 | - | - | - | 0.280 ± 0.179 | - | - | - | - |
| 9 | Tridecane | 629-50-5 | 98 | 57, 71, 43 | Alkanes | - | - | 0.049 ± 0.032 | 0.483 ± 0.593 | 0.287 ± 0.394 | - | 0.155 ± 0.040 | 0.684 ± 0.423 | - | - | - | - |
| 10 | 2-Heptanol | 543-49-7 | 96 | 45, 55, 83 | Alcohols | 2.341 ± 1.568 | - | 1.467 ± 0.036 | - | - | 0.448 ± 0.317 | 2.994 ± 0.137 | 0.918 ± 0.039 | - | 0.395 ± 0.032 | 0.691 ± 0.151 | - |
| 11 | 6-Methylhept-5-en-2-one | 110-93-0 | 100 | 43, 108, 41 | Ketones | 10.329 ± 0.223 | 7.724 ± 0.374 | 3.748 ± 0.820 | 9.768 ± 0.342 | 6.093 ± 0.459 | 4.299 ± 0.305 | 7.093 ± 0.294 | 7.715 ± 0.604 | 11.056 ± 1.078 | 8.589 ± 0.177 | 4.194 ± 0.891 | 3.550 ± 0.091 |
| 12 | Dimethyl trisulfide | 3658-80-8 | 100 | 126, 76, 45 | Ethers | 12.460 ± 1.284 | 12.131 ± 0.361 | 0.107 ± 0.128 | 14.371 ± 3.359 | - | 35.478 ± 5.654 | - | 14.159 ± 10.207 | 5.700 ± 1.874 | 2.443 ± 0.136 | 0.618 ± 0.138 | 9.044 ± 3.260 |
| 13 | 2-Nonanone | 821-55-6 | 97 | 58, 43, 71 | Ketones | 1.949 ± 0.054 | - | 1.019 ± 0.165 | 0.765 ± 0.021 | 6.097 ± 0.736 | 0.515 ± 0.018 | 1.807 ± 0.086 | 0.559 ± 0.045 | 14.371 ± 0.548 | 12.644 ± 0.190 | 0.589 ± 0.137 | 0.648 ± 0.007 |
| 14 | (E)-1-methyl-4-(prop-1-en-1-yl)benzene | 2077-30-7 | 98 | 132, 117, 115 | Alkanes | 0.515 ± 0.036 | 0.721 ± 0.076 | 0.335 ± 0.040 | 0.538 ± 0.030 | - | - | 0.587 ± 0.003 | 0.444 ± 0.021 | 0.119 ± 0.161 | - | 0.524 ± 0.069 | - |
| 15 | Tetradecane | 629-59-4 | 95 | 57, 71, 43 | Alkanes | 1.676 ± 0.179 | 1.215 ± 0.276 | 0.177 ± 0.135 | 1.668 ± 1.206 | 0.631 ± 0.499 | 0.837 ± 0.597 | 0.281 ± 0.061 | 1.161 ± 0.062 | 0.681 ± 0.515 | 0.591 ± 0.424 | 0.142 ± 0.032 | 2.272 ± 0.521 |
| 16 | 1-Octen-3-ol | 3391-86-4 | 99 | 57, 43, 72 | Alcohols | - | 1.286 ± 0.094 | - | 6.125 ± 0.407 | 0.944 ± 0.081 | 2.479 ± 0.116 | - | 7.453 ± 0.477 | - | 1.827 ± 0.049 | 0.962 ± 0.211 | 10.899 ± 0.366 |
| 17 | Benzaldehyde | 100-52-7 | 100 | 106, 105, 77 | Aldehydes | 3.513 ± 0.103 | 18.347 ± 1.280 | 0.587 ± 0.104 | 7.854 ± 0.296 | 3.723 ± 0.264 | 8.033 ± 0.578 | - | 8.941 ± 1.237 | 3.037 ± 0.424 | 4.306 ± 0.022 | 0.434 ± 0.094 | 5.552 ± 0.132 |
| 18 | Heptadecane | 629-78-7 | 99 | 57, 71, 43 | Alkanes | 0.128 ± 0.088 | 0.134 ± 0.076 | - | 0.349 ± 0.227 | - | 0.500 ± 0.477 | 0.494 ± 0.082 | 1.613 ± 0.693 | 0.067 ± 0.032 | 0.097 ± 0.044 | - | 0.109 ± 0.132 |
| 19 | Linalool | 78-70-6 | 99 | 71, 73, 55 | Alcohols | 3.081 ± 0.032 | 1.006 ± 0.135 | 3.473 ± 0.659 | 1.250 ± 0.096 | 1.650 ± 0.097 | 0.527 ± 0.040 | 1.980 ± 0.086 | 0.646 ± 0.179 | 1.181 ± 0.137 | 0.692 ± 0.008 | 1.363 ± 0.316 | 0.565 ± 0.018 |
| 20 | (-)-Terpinen-4-ol | 20126-76-5 | 97 | 71, 111, 93 | Alcohols | 1.874 ± 0.039 | 0.894 ± 0.114 | 1.779 ± 0.349 | 1.037 ± 0.087 | 1.236 ± 0.059 | - | - | 0.765 ± 0.198 | 1.232 ± 0.173 | - | 3.092 ± 0.690 | 0.571 ± 0.027 |
| 21 | (Z)-2-octen-1-ol | 26001-58-1 | 95 | 57, 41, 55 | Alcohols | - | - | - | - | - | - | - | 0.250 ± 0.130 | - | 0.121 ± 0.009 | - | 0.380 ± 0.012 |
| 22 | Heneicosane | 629-94-7 | 97 | 57, 71, 85 | Alkanes | 1.180 ± 0.125 | 0.842 ± 0.240 | - | 1.310 ± 0.056 | 0.829 ± 0.143 | 1.341 ± 0.186 | 0.250 ± 0.070 | 0.457 ± 0.350 | 0.907 ± 0.134 | 0.440 ± 0.068 | 0.122 ± 0.013 | 1.469 ± 0.211 |
| 23 | Estragole | 140-67-0 | 97 | 148, 147, 117 | Ethers | 0.626 ± 0.016 | 0.466 ± 0.045 | 2.222 ± 0.378 | 0.511 ± 0.020 | 0.875 ± 0.053 | - | 0.511 ± 0.025 | 0.229 ± 0.141 | 0.679 ± 0.480 | 0.886 ± 0.008 | 1.305 ± 0.252 | 0.412 ± 0.002 |
| 24 | (-)-Borneol | 464-45-9 | 97 | 95, 110, 93 | Alcohols | 4.640 ± 0.111 | 2.725 ± 0.243 | 2.240 ± 0.446 | 3.023 ± 0.127 | 1.622 ± 0.098 | 1.266 ± 0.097 | 4.312 ± 0.160 | 1.998 ± 0.487 | 2.061 ± 0.265 | 1.889 ± 0.017 | 2.070 ± 0.457 | 1.625 ± 0.025 |
| 25 | Terpineol | 98-55-5 | 98 | 59, 93, 1 21 | Alcohols | 2.453 ± 0.070 | 1.246 ± 0.167 | 1.227 ± 0.257 | 1.454 ± 0.097 | 1.161 ± 0.028 | 0.613 ± 0.051 | 2.304 ± 0.053 | 0.599 ± 0.276 | 0.797 ± 0.104 | 0.704 ± 0.009 | 1.562 ± 0.354 | 0.605 ± 0.003 |
| 26 | (Z)-anethol | 25679-28-1 | 98 | 148, 147, 117 | Alkenes | 0.493 ± 0.034 | 1.066 ± 0.107 | 2.896 ± 0.245 | 1.565 ± 0.029 | 0.499 ± 0.058 | 0.459 ± 0.030 | 0.661 ± 0.011 | 1.248 ± 0.407 | 0.966 ± 0.020 | 0.867 ± 0.018 | 2.928 ± 0.382 | 1.054 ± 0.009 |
| 27 | Anethole | 104-46-1 | 100 | 148, 147, 117 | Ethers | 22.976 ± 1.001 | 32.954 ± 3.484 | 58.532 ± 6.828 | 31.522 ± 1.664 | 27.984 ± 0.897 | 14.154 ± 0.598 | 26.974 ± 0.517 | 30.849 ± 6.821 | 29.240 ± 2.134 | 30.008 ± 0.409 | 41.825 ± 11.890 | 28.459 ± 0.580 |
| 28 | 3-Methoxybenzaldehyde | 591-31-1 | 96 | 135, 136, 77 | Aldehydes | 3.029 ± 0.240 | 3.725 ± 0.864 | 1.186 ± 0.318 | 1.450 ± 0.096 | 3.931 ± 0.116 | 3.143 ± 0.167 | 2.212 ± 0.259 | 2.210 ± 0.962 | 2.522 ± 0.295 | 2.604 ± 0.164 | 0.802 ± 0.168 | 2.794 ± 0.110 |
| 29 | Undecane | 1120-21-4 | 93 | 57, 43, 71 | Alkanes | - | - | - | - | - | 0.256 ± 0.032 | - | - | - | 0.118 ± 0.016 | - | 0.413 ± 0.079 |
| 30 | Isopropyl Pentanoate | 18362-97-5 | 95 | 85, 103, 43 | Esters | 0.342 ± 0.033 | 0.418 ± 0.026 | - | 0.417 ± 0.041 | 0.196 ± 0.026 | 0.519 ± 0.048 | - | - | 0.218 ± 0.030 | 0.241 ± 0.022 | 0.044 ± 0.006 | 0.489 ± 0.040 |
| 31 | Dodecane,4,6-dimethyl | 61141-72-8 | 97 | 71, 57, 85 | Alkanes | 0.066 ± 0.084 | 0.695 ± 0.154 | - | 0.153 ± 0.180 | 0.104 ± 0.021 | 0.579 ± 0.349 | 0.108 ± 0.011 | - | - | 0.232 ± 0.017 | 0.094 ± 0.028 | 0.165 ± 0.074 |
| 32 | Octadecane | 593-45-3 | 97 | 57, 71, 43 | Alkanes | 0.271 ± 0.171 | - | - | - | - | 1.325 ± 0.969 | - | - | 1.465 ± 0.042 | - | - | 0.322 ± 0.035 |
| 33 | 2,6,10-Trimethyltridecane | 3891-99-4 | 92 | 71, 57, 85 | Alkanes | 0.575 ± 0.014 | - | - | - | - | 0.403 ± 0.071 | 0.071 ± 0.014 | - | - | 0.130 ± 0.014 | - | - |
| 34 | Eicosane | 112-95-8 | 96 | 71, 85, 57 | Alkanes | 0.293 ± 0.044 | 0.220 ± 0.111 | 0.137 ± 0.039 | 0.546 ± 0.007 | 0.423 ± 0.064 | 0.399 ± 0.031 | - | - | 0.139 ± 0.013 | 0.213 ± 0.029 | - | 0.228 ± 0.052 |
| 35 | Nonadecane | 629-92-5 | 99 | 57, 71, 43 | Alkanes | 2.025 ± 0.133 | 1.645 ± 0.431 | 0.308 ± 0.096 | 2.501 ± 0.139 | - | 2.514 ± 0.052 | - | - | - | - | 0.093 ± 0.014 | - |
| 36 | 1-Dodecanol | 112-53-8 | 91 | 56, 57, 55 | Alcohols | - | - | - | - | - | 0.204 ± 0.022 | - | - | - | - | - | - |
| 37 | Terpinen-4-ol | 562-74-3 | 96 | 71, 93, 111 | Alcohols | - | - | - | - | - | 0.593 ± 0.047 | 2.550 ± 0.133 | - | - | 0.607 ± 0.012 | - | - |
| 38 | Pentasulfide, dimethyl | 7330-31-6 | 92 | 158, 79, 80 | Sulfide | - | 1.393 ± 0.214 | - | - | - | 2.589 ± 1.953 | - | - | - | - | - | - |
| 39 | 2,4-dimethylbenzaldehyde | 15764-16-6 | 94 | 133, 134, 105 | Aldehydes | 0.476 ± 0.019 | - | - | - | - | 0.570 ± 0.101 | 0.182 ± 0.007 | - | 0.360 ± 0.063 | 0.562 ± 0.011 | 0.095 ± 0.021 | 0.635 ± 0.034 |
| 40 | 2,2,4-Trimethyl-1,3-pentanediol diisobutyrate | 6846-50-0 | 92 | 71, 43, 159 | Esters | - | - | 0.109 ± 0.039 | - | 1.440 ± 0.240 | 0.727 ± 0.073 | - | - | 0.932 ± 0.060 | 1.119 ± 0.155 | 0.112 ± 0.024 | 1.235 ± 0.103 |
| 41 | Hexadecanal | 629-80-1 | 97 | 82, 57, 43 | Aldehydes | 1.081 ± 0.097 | 0.292 ± 0.070 | - | - | - | 0.818 ± 0.084 | - | - | - | - | - | - |
| 42 | AmphetOthers | 300-62-9 | 91 | 44, 91, 92 | Others | - | - | - | 0.521 ± 0.083 | - | - | - | - | - | - | - | - |
| 43 | 3,3,5-trimethylheptane | 7154-80-5 | 96 | 71, 57, 43 | Alkanes | - | - | - | 0.243 ± 0.012 | - | - | - | - | - | - | - | - |
| 44 | Carbamic acid, monoammonium salt | 1111-78-0 | 97 | 44, 45, 30 | Others | - | - | - | 0.348 ± 0.289 | - | - | - | - | - | - | - | - |
| 45 | o-Cymene | 527-84-4 | 94 | 119, 134, 91 | Alcohols | - | 1.219 ± 0.598 | 0.436 ± 0.301 | 0.549 ± 0.508 | - | - | 1.005 ± 0.049 | - | - | 0.134 ± 0.164 | 2.158 ± 0.275 | - |
| 46 | Dihydro Tagetone | 1879-00-1 | 98 | 85, 57, 41 | Ketones | - | - | - | 1.281 ± 0.579 | - | - | - | - | - | - | - | - |
| 47 | 2-Isopropyl-5-methyl-1-hexanol | 2051-33-4 | 98 | 71, 57, 43 | Alcohols | - | - | - | 0.168 ± 0.012 | - | - | - | - | - | - | - | - |
| 48 | Cyclooctyl alcohol | 696-71-9 | 98 | 57, 41, 55 | Alcohols | - | - | - | 0.497 ± 0.026 | - | - | - | - | - | - | - | - |
| 49 | Acetophenone | 98-86-2 | 97 | 105, 77, 120 | Ketones | - | - | 0.146 ± 0.032 | 0.896 ± 0.033 | 0.361 ± 0.027 | - | 0.161 ± 0.008 | - | 0.540 ± 0.150 | 0.399 ± 0.017 | - | - |
| 50 | Citronellol | 106-22-9 | 98 | 69, 41, 81 | Alcohols | 0.901 ± 0.051 | 0.361 ± 0.068 | 0.407 ± 0.092 | 0.549 ± 0.035 | 0.101 ± 0.025 | - | 1.001 ± 0.039 | - | - | 0.314 ± 0.013 | 0.764 ± 0.162 | - |
| 51 | 2-Acetyl-1H-pyrrole | 1072-83-9 | 96 | 94, 109, 66 | Others | 0.576 ± 0.048 | - | 0.505 ± 0.213 | 0.801 ± 0.083 | 1.445 ± 0.031 | - | 0.916 ± 0.119 | - | 0.388 ± 0.074 | - | - | - |
| 52 | 2,4-Di-tert-butylphenol | 96-76-4 | 91 | 191, 206, 57 | Phenols | - | 0.467 ± 0.031 | - | 0.511 ± 0.024 | 0.281 ± 0.034 | - | - | - | 0.307 ± 0.016 | 0.471 ± 0.046 | 0.065 ± 0.013 | 0.611 ± 0.055 |
| 53 | 3-Methyl-2-Heptanone | 2371-19-9 | 96 | 43, 72, 85 | Ketones | - | 0.846 ± 0.291 | - | - | - | - | - | - | - | - | - | - |
| 54 | 5,6-Decanedione | 5579-73-7 | 99 | 85, 57, 41 | Ketones | - | 1.164 ± 0.900 | - | - | - | - | - | - | - | - | - | - |
| 55 | n-Caproic acid vinyl ester | 3050-69-9 | 98 | 43, 99, 71 | Esters | 0.797 ± 0.583 | 1.013 ± 0.176 | - | - | - | - | - | - | - | - | - | - |
| 56 | 5-Methyl-2-hexanol | 627-59-8 | 98 | 45, 55, 43 | Alcohols | - | 0.954 ± 0.016 | - | - | - | - | - | - | - | - | - | - |
| 57 | 2,5-Dimethylbenzaldehyde | 5779-94-2 | 92 | 133, 134, 105 | Aldehydes | - | 0.457 ± 0.023 | - | - | - | - | - | - | - | - | - | - |
| 58 | o-Anisaldehyde | 135-02-4 | 95 | 136, 77, 135 | Aldehydes | - | 0.162 ± 0.006 | - | - | - | - | - | - | - | - | - | - |
| 59 | Cinnamic aldehyde | 14371-10-9 | 99 | 131, 132, 103 | Aldehydes | 0.288 ± 0.028 | 2.392 ± 0.443 | 0.230 ± 0.068 | - | 0.595 ± 0.046 | - | - | - | - | 0.250 ± 0.024 | 0.151 ± 0.030 | - |
| 60 | Coumarin | 91-64-5 | 93 | 146, 118, 90 | Ketones | - | 0.449 ± 0.137 | - | - | - | - | - | - | - | - | - | - |
| 61 | Alpha-pinene | 80-56-8 | 99 | 93, 91, 92 | Alkenes | - | - | - | - | - | - | 0.348 ± 0.021 | - | - | - | - | - |
| 62 | Toluene | 108-88-3 | 96 | 91, 92, 71 | Aromatics | - | - | - | - | - | - | 0.273 ± 0.065 | - | 0.989 ± 0.132 | 0.890 ± 0.102 | - | - |
| 63 | Camphene | 79-92-5 | 99 | 93, 121, 79 | Alkenes | - | - | 0.175 ± 0.023 | - | - | - | 0.800 ± 0.032 | - | - | 0.180 ± 0.023 | 1.317 ± 0.357 | - |
| 64 | α-Phellandrene | 99-83-2 | 98 | 93, 91, 92 | Alkenes | 0.167 ± 0.008 | - | 0.228 ± 0.038 | - | - | - | 0.509 ± 0.016 | - | - | - | 0.662 ± 0.144 | - |
| 65 | β-Myrcene | 123-35-3 | 98 | 93, 69, 41 | Alkenes | - | - | - | - | - | - | 0.674 ± 0.012 | - | - | - | - | - |
| 66 | alpha-Terpinene | 99-86-5 | 97 | 121, 93, 136 | Alkenes | - | - | 0.135 ± 0.025 | - | - | - | 0.202 ± 0.008 | - | - | - | 0.360 ± 0.035 | - |
| 67 | β-phellandrene | 555-10-2 | 95 | 93, 91, 136 | Alkenes | - | - | 0.642 ± 0.257 | - | - | - | 2.092 ± 0.245 | - | - | - | 7.080 ± 1.824 | - |
| 68 | 2-Heptanone | 110-43-0 | 98 | 43, 58, 71 | Ketones | 0.763 ± 0.028 | - | 0.421 ± 0.207 | - | - | - | 0.395 ± 0.224 | - | - | - | 0.410 ± 0.105 | 1.249 ± 0.736 |
| 69 | trans-.beta.-Ocimene | 3779-61-1 | 98 | 93, 91, 92 | Alkenes | - | - | - | - | - | - | 0.264 ± 0.024 | - | - | - | 0.559 ± 0.071 | - |
| 70 | gamma.-Terpinene | 99-85-4 | 98 | 93, 91, 136 | Alkenes | - | - | 0.234 ± 0.077 | - | - | - | 0.179 ± 0.126 | - | - | - | 0.615 ± 0.098 | - |
| 71 | (Z)-3,7-dimethylocta-1,3,6,-triene | 3338-55-4 | 99 | 93, 91, 80 | Alkenes | - | - | 0.293 ± 0.096 | - | - | - | 0.455 ± 0.001 | - | - | - | - | - |
| 72 | Styrene | 100-42-5 | 98 | 104, 103, 78 | Alkenes | 0.267 ± 0.060 | - | 0.140 ± 0.021 | - | 3.234 ± 1.439 | - | 0.219 ± 0.015 | - | 5.615 ± 2.131 | 5.928 ± 0.294 | 0.241 ± 0.058 | - |
| 73 | Terpinolene | 586-62-9 | 99 | 121, 93, 136 | Alkenes | - | - | 0.287 ± 0.042 | - | - | - | 0.251 ± 0.002 | - | - | - | 0.616 ± 0.106 | - |
| 74 | 2-Heptanol, acetate | 5921-82-4 | 100 | 43, 87, 56 | Esters | - | - | 0.217 ± 0.021 | - | - | - | 0.746 ± 0.036 | - | - | - | 0.363 ± 0.094 | - |
| 75 | 1-Methyl-3-Prop-1-En-2-Ylbenzene | 1124-20-5 | 93 | 132, 117, 115 | Aromatics | - | - | 0.041 ± 0.001 | - | - | - | 0.060 ± 0.001 | - | - | - | - | - |
| 76 | 2,3,5-Trimethylpyrazine | 14667-55-1 | 99 | 122, 42, 81 | Pyrazine | - | - | 0.358 ± 0.007 | - | - | - | 0.415 ± 0.012 | - | - | - | - | - |
| 77 | Acetic acid | 64-19-7 | 98 | 43, 45, 60 | Acids | 2.681 ± 2.446 | - | 1.107 ± 0.748 | - | 3.654 ± 2.802 | - | 2.003 ± 0.185 | - | 1.431 ± 0.740 | 0.892 ± 0.626 | - | - |
| 78 | Copaene | 3856-25-5 | 91 | 105, 119, 161 | Alkenes | - | - | 0.122 ± 0.002 | - | - | - | 0.029 ± 0.008 | - | - | - | 0.084 ± 0.024 | - |
| 79 | 2-Nonanol, acetate | 14936-66-4 | 95 | 43, 87, 55 | Esters | - | - | - | - | - | - | 0.118 ± 0.009 | - | - | - | 0.071 ± 0.020 | - |
| 80 | (+)-2-Bornanone | 464-49-3 | 97 | 95, 81, 108 | Ketones | - | - | 0.165 ± 0.062 | - | - | - | 0.208 ± 0.034 | - | - | - | 0.074 ± 0.015 | - |
| 81 | 2-Nonanol | 628-99-9 | 94 | 45, 69, 55 | Alcohols | - | - | - | - | - | - | 1.245 ± 0.053 | - | - | 0.455 ± 0.006 | - | - |
| 82 | (Z)-para-2-menthen-1-ol | 29803-82-5 | 95 | 43, 93, 139 | Alcohols | - | - | - | - | - | - | 0.036 ± 0.006 | - | - | - | 0.022 ± 0.005 | - |
| 83 | Bornyl acetate | 76-49-3 | 99 | 95, 93, 121 | Esters | - | - | - | - | - | - | 0.330 ± 0.005 | - | - | - | 0.303 ± 0.064 | - |
| 84 | Camphene hydrate | 465-31-6 | 96 | 71, 43, 69 | Alcohols | - | - | - | - | - | - | 0.090 ± 0.004 | - | - | - | - | - |
| 85 | 2-Undecanone | 112-12-9 | 95 | 58, 43, 59 | Ketones | - | - | - | - | 0.090 ± 0.016 | - | 1.039 ± 0.044 | - | - | 0.395 ± 0.003 | - | - |
| 86 | Trans-2-Octen-1-ol | 18409-17-1 | 96 | 57, 41, 55 | Alcohols | - | - | - | - | - | - | 0.056 ± 0.007 | - | - | - | - | 0.292 ± 0.004 |
| 87 | Butanoic acid | 107-92-6 | 94 | 60, 73, 42 | Acids | - | - | - | - | 0.369 ± 0.056 | - | 0.230 ± 0.027 | - | - | - | - | - |
| 88 | 6-Octen-1-ol, 3,7-dimethyl-, acetate | 150-84-5 | 97 | 81, 95, 69 | Esters | - | - | - | - | - | - | 0.123 ± 0.011 | - | - | - | 0.198 ± 0.038 | - |
| 89 | alpha,alpha-Dimethyl-4-Methylenecyclohexanemethanol | 7299-42-5 | 97 | 59, 81, 93 | Alcohols | - | - | 0.083 ± 0.017 | - | 0.134 ± 0.005 | - | 0.228 ± 0.005 | - | - | - | 0.183 ± 0.042 | - |
| 90 | 4-Isopropylcyclohex-2-En-1-One | 500-02-7 | 94 | 96, 95, 43 | Ketones | - | - | - | - | - | - | 0.057 ± 0.009 | - | - | - | 0.109 ± 0.028 | - |
| 91 | α-Terpinyl acetate | 80-26-2 | 100 | 121, 93, 136 | Esters | - | - | - | - | 0.446 ± 0.008 | - | 0.715 ± 0.032 | - | 0.458 ± 0.099 | 0.733 ± 0.031 | 1.051 ± 0.219 | 0.453 ± 0.022 |
| 92 | Pentanoic acid | 109-52-4 | 94 | 60, 73, 41 | Acids | - | - | - | - | 0.497 ± 0.122 | - | 0.138 ± 0.083 | - | - | - | - | - |
| 93 | (1S,4R,5R)-1,3,3-Trimethyl-2-oxabicyclo[2.2.2]octan-5-yl acetate | 81781-24-0 | 92 | 43, 109, 137 | Esters | - | - | - | - | - | - | 0.069 ± 0.004 | - | - | - | - | - |
| 94 | Geranyl acetate | 105-87-3 | 99 | 69, 68, 41 | Esters | 0.558 ± 0.083 | - | 0.141 ± 0.045 | - | - | - | 1.193 ± 0.106 | - | - | - | 1.242 ± 0.210 | - |
| 95 | 4′-Methylacetophenone | 122-00-9 | 93 | 119, 91, 134 | Ketones | - | - | - | - | - | - | 0.095 ± 0.005 | - | - | - | - | - |
| 96 | Benzenecarboximidic acid, N-hydroxy-, methyl ester_ | 67160-14-9 | 99 | 133, 151, 135 | Others | - | - | - | - | 15.486 ± 1.737 | - | 5.949 ± 0.839 | - | - | - | - | - |
| 97 | cis-3,7-Dimethyl-2,6-octadien-1-ol | 106-25-2 | 90 | 69, 41, 93 | Alcohols | - | - | 0.064 ± 0.016 | - | - | - | 0.081 ± 0.011 | - | - | - | 0.123 ± 0.031 | - |
| 98 | 1-(2-Butoxyethoxy)-Ethanol | 54446-78-5 | 97 | 57, 45, 41 | Alcohols | - | - | - | - | - | - | 0.177 ± 0.053 | - | - | - | - | - |
| 99 | Hexanoic acid | 142-62-1 | 99 | 60, 73, 41 | Acids | - | - | - | - | 0.738 ± 0.008 | - | 0.528 ± 0.144 | - | - | - | - | - |
| 100 | Geraniol | 106-24-1 | 100 | 69, 41, 68 | Alcohols | 3.920 ± 0.350 | - | 1.460 ± 0.479 | - | - | - | 2.842 ± 0.247 | - | - | 0.538 ± 0.030 | 2.838 ± 0.662 | - |
| 101 | 2-(2-Butoxyethoxy)ethyl acetate | 124-17-4 | 94 | 87, 57, 43 | Esters | - | - | - | - | - | - | 0.096 ± 0.019 | - | - | - | - | - |
| 102 | Methyleugenol | 93-15-2 | 100 | 178, 163, 147 | Phenols | - | - | 0.401 ± 0.124 | - | - | - | 0.391 ± 0.039 | - | 0.145 ± 0.017 | 0.179 ± 0.014 | 0.253 ± 0.055 | - |
| 103 | Octanoic acid | 124-07-2 | 98 | 60, 73, 43 | Acids | - | - | - | - | 0.240 ± 0.168 | - | 0.223 ± 0.054 | - | - | - | - | - |
| 104 | (1S,2S,4R)-(-)-alpha, alpha-Dimethyl-1-Vinyl-o-Menth-8-Ene-4-Methanol | 639-99-6 | 93 | 73, 59, 107 | Alcohols | - | - | - | - | - | - | 0.037 ± 0.004 | - | - | - | 0.020 ± 0.005 | - |
| 105 | Benzoic acid, 4-methoxy-, methyl ester | 121-98-2 | 95 | 135, 166, 77 | Esters | - | - | 0.137 ± 0.049 | - | - | - | 0.230 ± 0.029 | - | - | - | 0.098 ± 0.022 | - |
| 106 | Ethyl (E)-cinnamate; Ethyl trans-cinnamate; trans-3-Phenyl-2-propenoic acid ethyl ester | 4192-77-2 | 97 | 131, 103, 176 | Esters | - | - | - | - | - | - | 4.062 ± 0.340 | - | 0.947 ± 0.135 | - | - | - |
| 107 | Nonanoic acid | 112-05-0 | 98 | 73, 60, 57 | Acids | - | - | - | - | 0.514 ± 0.174 | - | 0.194 ± 0.032 | - | - | 0.239 ± 0.095 | - | - |
| 108 | 3-Allyl-6-methoxyphenol | 501-19-9 | 99 | 164, 149, 131 | Phenols | - | - | 0.161 ± 0.077 | - | 0.385 ± 0.014 | - | 0.475 ± 0.056 | - | - | 0.222 ± 0.017 | 0.129 ± 0.037 | 0.258 ± 0.008 |
| 109 | 4-Methoxyphenylacetone | 122-84-9 | 98 | 121, 164, 122 | Ketones | - | - | 0.418 ± 0.140 | - | 0.727 ± 0.021 | - | 0.744 ± 0.097 | - | 0.467 ± 0.046 | 0.612 ± 0.056 | 0.328 ± 0.064 | - |
| 110 | (E)-1,2-Dimethoxy-4-(1-propenyl)benzene | 6379-72-2 | 96 | 178, 163, 107 | Phenols | - | - | - | - | - | - | 0.169 ± 0.011 | - | - | - | 0.180 ± 0.038 | - |
| 111 | n-Decanoic acid | 334-48-5 | 92 | 73, 60, 129 | Acids | - | - | - | - | - | - | 0.065 ± 0.012 | - | - | - | - | - |
| 112 | 3-Phenyl-2-propene-1-ol | 104-54-1 | 98 | 92, 91, 134 | Alcohols | 0.159 ± 0.027 | - | 0.318 ± 0.162 | - | 0.189 ± 0.009 | - | 0.282 ± 0.031 | - | - | - | 0.114 ± 0.030 | - |
| 113 | Eugenol | 97-53-0 | 99 | 164, 149, 131 | Phenols | - | - | - | - | - | - | 0.286 ± 0.024 | - | - | - | - | - |
| 114 | 2-Hydroxycinnamic acid | 614-60-8 | 98 | 146, 118, 90 | Acids | 0.438 ± 0.053 | - | 0.387 ± 0.181 | - | 0.740 ± 0.042 | - | 0.561 ± 0.078 | - | 0.379 ± 0.061 | - | 0.120 ± 0.025 | - |
| 115 | Ethyl p-methoxycinnamate | 1929-30-2 | 100 | 161, 206, 134 | Esters | - | - | - | - | - | - | 1.580 ± 0.139 | - | - | 0.833 ± 0.091 | 0.351 ± 0.062 | 1.052 ± 0.100 |
| 116 | Ethylbenzene | 100-41-4 | 95 | 91, 106, 78 | Aromatics | - | - | - | - | 0.254 ± 0.029 | - | - | - | 0.547 ± 0.052 | 0.450 ± 0.025 | - | - |
| 117 | p-Xylene | 106-42-3 | 95 | 91, 106, 105 | Alcohols | - | - | - | - | 0.254 ± 0.022 | - | - | - | 0.517 ± 0.034 | 0.402 ± 0.021 | - | - |
| 118 | o-Xylene | 95-47-6 | 96 | 91, 106, 105 | Aromatics | - | - | - | - | 0.458 ± 0.043 | - | - | - | 0.995 ± 0.060 | 0.792 ± 0.057 | - | - |
| 119 | Hexanoic acid, ethyl ester | 123-66-0 | 98 | 88, 99, 43 | Esters | - | - | - | - | 0.710 ± 0.460 | - | - | - | 1.188 ± 0.458 | 1.837 ± 0.071 | - | - |
| 120 | 2-Methyldodecane | 1560-97-0 | 97 | 57, 43, 85 | Alkanes | - | - | - | - | 0.046 ± 0.027 | - | - | - | - | - | - | - |
| 121 | Hydroxyacetone | 116-09-6 | 98 | 43, 31, 74 | Ketones | - | - | - | - | 0.395 ± 0.551 | - | - | - | - | - | - | - |
| 122 | 1-Hexanol | 111-27-3 | 92 | 56, 43, 55 | Alcohols | - | - | - | - | 0.064 ± 0.033 | - | - | - | 0.264 ± 0.022 | 0.378 ± 0.002 | 0.217 ± 0.048 | 0.400 ± 0.023 |
| 123 | Nonanal | 124-19-6 | 96 | 57, 41, 56 | Aldehydes | - | - | - | - | 0.165 ± 0.056 | - | - | - | - | 0.232 ± 0.117 | - | - |
| 124 | 2-Methyl-1-Phenylpropene | 768-49-0 | 94 | 117, 132, 115 | Alkenes | - | - | - | - | 0.134 ± 0.120 | - | - | - | - | - | - | - |
| 125 | 2-Octanol | 123-96-6 | 92 | 45, 55, 43 | Alcohols | - | - | - | - | 0.348 ± 0.078 | - | - | - | - | - | - | - |
| 126 | 2-Methoxy-3-Methylbutane | 62016-49-3 | 91 | 59, 58, 43 | Alkanes | - | - | - | - | 1.717 ± 0.273 | - | - | - | - | - | - | - |
| 127 | 2-Ethylhexan-1-ol | 104-76-7 | 95 | 57, 70, 83 | Alcohols | 0.853 ± 0.115 | - | 0.251 ± 0.049 | - | 1.143 ± 0.138 | - | - | - | 1.984 ± 0.435 | 1.532 ± 0.206 | 0.138 ± 0.030 | 0.919 ± 0.142 |
| 128 | Formic acid | 64-18-6 | 96 | 46, 45, 44 | Acids | - | - | - | - | 0.575 ± 0.359 | - | - | - | - | - | - | - |
| 129 | 3-Furanmethanol | 4412-91-3 | 96 | 98, 77, 97 | Alcohols | - | - | 0.081 ± 0.023 | - | 0.375 ± 0.003 | - | - | - | - | - | - | - |
| 130 | 3,4-Dimethylbenzaldehyde | 5973-71-7 | 96 | 133, 134, 105 | Aldehydes | - | - | - | - | 0.342 ± 0.007 | - | - | - | - | - | - | - |
| 131 | Bis(2-ethylhexyl) adipate | 103-23-1 | 94 | 129, 70, 147 | Esters | - | - | - | - | 0.642 ± 0.147 | - | - | - | - | - | - | - |
| 132 | (+)-alpha-Pinene | 7785-70-8 | 100 | 93, 91, 92 | Alkenes | - | - | 0.402 ± 0.044 | - | - | - | - | - | - | - | 0.763 ± 0.320 | - |
| 133 | Sabinene | 3387-41-5 | 97 | 93, 91, 69 | Alkenes | - | - | - | - | - | - | - | - | - | - | 0.141 ± 0.048 | - |
| 134 | (+)-3-Carene | 498-15-7 | 94 | 93, 91, 77 | Alkenes | - | - | - | - | - | - | - | - | - | - | 0.054 ± 0.016 | - |
| 135 | Beta-pinene | 18172-67-3 | 100 | 93, 69, 41 | Alkenes | 0.380 ± 0.014 | - | 0.549 ± 0.077 | - | - | - | - | - | - | - | 1.428 ± 0.256 | - |
| 136 | 3-Carene | 13466-78-9 | 99 | 93, 91, 79 | Alkenes | 0.290 ± 0.122 | - | 0.234 ± 0.023 | - | - | - | - | - | - | - | 0.800 ± 0.142 | - |
| 137 | 2-Octen-4-one | 4643-27-0 | 98 | 69, 41, 84 | Ketones | - | - | - | - | - | - | - | - | - | - | 0.317 ± 0.103 | - |
| 138 | 1-Pentanol | 71-41-0 | 95 | 42, 55, 70 | Alcohols | - | - | - | - | - | - | - | - | - | - | 0.098 ± 0.012 | 0.274 ± 0.275 |
| 139 | 2,6-Dimethyl-4-heptanone | 108-83-8 | 93 | 85, 57, 41 | Ketones | - | - | - | - | - | - | - | - | - | - | 0.124 ± 0.005 | - |
| 140 | 3,4-Dimethyl-2,4,6-octatriene | 57396-75-5 | 94 | 121, 105, 136 | Alkenes | - | - | - | - | - | - | - | - | - | - | 0.058 ± 0.011 | - |
| 141 | (4E,6Z)-2,6-Dimethylocta-2,4,6-triene | 7216-56-0 | 94 | 121, 105, 136 | Alkenes | - | - | - | - | - | - | - | - | - | - | 0.039 ± 0.006 | - |
| 142 | Formic acid, heptyl ester | 112-23-2 | 95 | 70, 55, 56 | Esters | - | - | - | - | - | - | - | - | - | - | 0.054 ± 0.010 | - |
| 143 | 2-Methyl-2-dodecanol | 1653-37-8 | 95 | 59, 43, 41 | Alcohols | - | - | - | - | - | - | - | - | - | - | 0.229 ± 0.044 | - |
| 144 | 4-Ethylcyclohexanol | 4534-74-1 | 97 | 81, 84, 58 | Alcohols | - | - | - | - | - | - | - | - | - | - | 0.053 ± 0.012 | 0.582 ± 0.019 |
| 145 | 1-Octanol | 111-87-5 | 98 | 56, 55, 69 | Alcohols | - | - | - | - | - | - | - | - | - | 0.169 ± 0.009 | 0.075 ± 0.018 | 0.403 ± 0.012 |
| 146 | 2-Butylpyridine | 5058-19-5 | 97 | 93, 106, 120 | Others | - | - | - | - | - | - | - | - | - | - | 0.135 ± 0.032 | 0.765 ± 0.018 |
| 147 | (E)-para-2-menthen-1-ol | 29803-81-4 | 95 | 43, 93, 139 | Alcohols | - | - | - | - | - | - | - | - | - | - | 0.033 ± 0.008 | - |
| 148 | 2-(4-Methylenecyclohexyl)propan-2-yl acetate | 93836-50-1 | 96 | 93, 43, 136 | Esters | - | - | - | - | - | - | - | - | - | - | 0.085 ± 0.020 | - |
| 149 | (E)-citral | 141-27-5 | 98 | 69, 41, 84 | Aldehydes | - | - | - | - | - | - | - | - | - | - | 0.135 ± 0.034 | - |
| 150 | alpha-Curcumene | 644-30-4 | 99 | 119, 132, 105 | Alkenes | - | - | - | - | - | - | - | - | - | 0.254 ± 0.005 | 0.206 ± 0.043 | - |
| 151 | Ethyl cinnamate | 103-36-6 | 100 | 131, 103, 176 | Esters | - | - | 3.933 ± 1.251 | - | - | - | - | - | - | - | 0.978 ± 0.175 | - |
| 152 | m-Xylene | 108-38-3 | 91 | 91, 106, 105 | Alcohols | - | - | - | - | - | - | - | - | 0.257 ± 0.011 | 0.221 ± 0.015 | - | - |
| 153 | m-cymene | 535-77-3 | 95 | 119, 134, 91 | Aromatics | 0.448 ± 0.324 | - | - | - | - | - | - | - | 0.294 ± 0.279 | - | - | - |
| 154 | (+)-4-Carene | 29050-33-7 | 97 | 93, 121, 136 | Alkenes | - | - | - | - | - | - | - | - | 0.120 ± 0.054 | - | - | - |
| 155 | Acetic acid, 2-ethylhexyl ester | 103-09-3 | 95 | 43, 70, 57 | Esters | - | - | - | - | - | - | - | - | 0.116 ± 0.080 | - | - | - |
| 156 | Phytane | 638-36-8 | 97 | 71, 85, 57 | Alkanes | - | - | - | - | - | - | - | - | 0.096 ± 0.040 | - | - | - |
| 157 | Naphthalene | 91-20-3 | 95 | 128, 127, 129 | Others | - | - | - | - | - | - | - | - | 0.451 ± 0.044 | - | - | - |
| 158 | Tetracosane | 646-31-1 | 98 | 57, 71, 85 | Alkanes | 0.629 ± 0.134 | - | - | - | - | - | - | - | 0.321 ± 0.101 | - | - | 0.798 ± 0.133 |
| 159 | Benzothiazole | 95-16-9 | 93 | 135, 108, 69 | Others | - | - | - | - | - | - | - | - | 0.304 ± 0.055 | 0.274 ± 0.020 | - | - |
| 160 | 3,5-Dimethyloctane | 15869-93-9 | 96 | 57, 43, 71 | Alkanes | - | - | - | - | - | - | - | - | - | - | - | 0.283 ± 0.050 |
| 161 | 5-Methyl-5-propylnonane | 17312-75-3 | 97 | 71, 57, 85 | Alkanes | - | - | - | - | - | - | - | - | - | - | - | 0.499 ± 0.068 |
| 162 | 2-Pentylthiophene | 4861-58-9 | 90 | 97, 154, 98 | Others | - | - | - | - | - | - | - | - | - | - | - | 0.325 ± 0.226 |
| 163 | Didecyl ether | 2456-28-2 | 93 | 57, 71, 70 | Ethers | - | - | - | - | - | - | - | - | - | - | - | 0.140 ± 0.090 |
| 164 | 1-Heptanol | 111-70-6 | 95 | 70, 56, 55 | Alcohols | - | - | - | - | - | - | - | - | - | - | - | 0.421 ± 0.006 |
| 165 | Octacosane | 630-02-4 | 96 | 57, 71, 85 | Alkanes | 0.171 ± 0.041 | - | - | - | - | - | - | - | - | - | - | 0.180 ± 0.057 |
| 166 | Bornyl acetate | 5655-61-8 | 95 | 95, 93, 121 | Esters | - | - | 0.098 ± 0.013 | - | - | - | - | - | - | 0.141 ± 0.096 | - | - |
| 167 | Dimethyltetrasulfane | 5756-24-1 | 93 | 158, 79, 80 | Sulfide | - | - | - | - | - | - | - | - | - | 0.798 ± 0.341 | - | - |
| 168 | Geranylacetone | 3796-70-1 | 93 | 43, 69, 136 | Ketones | - | - | - | - | - | - | - | - | - | 0.227 ± 0.026 | - | - |
| 169 | Dimethyl phthalate | 131-11-3 | 93 | 163, 77, 164 | Esters | - | - | - | - | - | - | - | - | - | 0.258 ± 0.011 | - | - |
| 170 | (E)-2-methoxy-4-(prop-1-enyl)phenol | 5932-68-3 | 95 | 164, 149, 131 | Phenols | - | - | - | - | - | - | - | - | - | 0.235 ± 0.025 | - | - |
| 171 | Acetone | 67-64-1 | 98 | 43, 58, 44 | Ketones | - | - | 0.263 ± 0.057 | - | - | - | - | - | - | - | - | - |
| 172 | 1,3,3-trimethyltricyclo[2.2.1.02,6]heptane | 488-97-1 | 99 | 93, 91, 92 | Alkanes | - | - | 0.205 ± 0.051 | - | - | - | - | - | - | - | - | - |
| 173 | 2,6-Dimethylpyrazine | 108-50-9 | 97 | 108, 42, 40 | Pyrazine | - | - | 0.165 ± 0.061 | - | - | - | - | - | - | - | - | - |
| 174 | 3-Ethyl-2,5-diMethylpyrazine | 13360-65-1 | 93 | 135, 136, 108 | Pyrazine | - | - | 0.125 ± 0.019 | - | - | - | - | - | - | - | - | - |
| 175 | 2,6,6-Trimethyl-2,4-cycloheptadien-1-one | 503-93-5 | 93 | 107, 91, 108 | Ketones | - | - | 0.050 ± 0.011 | - | - | - | - | - | - | - | - | - |
| 176 | (1R,2R,5S)-5-Methyl-2-(prop-1-en-2-yl)cyclohexanol | 29141-10-4 | 94 | 67, 81, 71 | Alcohols | - | - | 0.017 ± 0.003 | - | - | - | - | - | - | - | - | - |
| 177 | 4-n-propylanisole | 104-45-0 | 97 | 121, 150, 122 | Ethers | - | - | 0.236 ± 0.043 | - | - | - | - | - | - | - | - | - |
| 178 | 2,4-Cyclohexadiene-1-methanol | 1686-20-0 | 94 | 94, 59, 79 | Alcohols | - | - | 0.059 ± 0.016 | - | - | - | - | - | - | - | - | - |
| 179 | Citral | 5392-40-5 | 94 | 69, 41, 84 | Aldehydes | 1.234 ± 0.187 | - | 0.053 ± 0.013 | - | - | - | - | - | - | - | - | - |
| 180 | trans-Calamenene | 73209-42-4 | 94 | 159, 160, 202 | Alkenes | - | - | 0.122 ± 0.020 | - | - | - | - | - | - | - | - | - |
| 181 | 3-Phenylpropanol | 122-97-4 | 91 | 117, 91, 118 | Alcohols | - | - | 0.108 ± 0.042 | - | - | - | - | - | - | - | - | - |
| 182 | Cinnamyl acetat | 103-54-8 | 91 | 115, 43, 133 | Esters | - | - | 0.032 ± 0.017 | - | - | - | - | - | - | - | - | - |
| 183 | 2,6,10-Trimethyldodecane | 3891-98-3 | 98 | 71, 57, 85 | Alkanes | 0.207 ± 0.145 | - | - | - | - | - | - | - | - | - | - | - |
| 184 | Acetic acid, 1,7,7-trimethyl-bicyclo [2.2.1]hept-2-yl ester | 92618-89-8 | 93 | 95, 93, 43 | Acids | 0.052 ± 0.056 | - | - | - | - | - | - | - | - | - | - | - |
| 185 | Tetratetracontane | 7098-22-8 | 91 | 57, 43, 85 | Alkanes | 0.190 ± 0.029 | - | - | - | - | - | - | - | - | - | - | - |
| 186 | Neral | 106-26-3 | 96 | 69, 41, 109 | Aldehydes | 0.559 ± 0.077 | - | - | - | - | - | - | - | - | - | - | - |
Disclaimer/Publisher’s Note: The statements, opinions and data contained in all publications are solely those of the individual author(s) and contributor(s) and not of MDPI and/or the editor(s). MDPI and/or the editor(s) disclaim responsibility for any injury to people or property resulting from any ideas, methods, instructions or products referred to in the content. |
© 2025 by the authors. Licensee MDPI, Basel, Switzerland. This article is an open access article distributed under the terms and conditions of the Creative Commons Attribution (CC BY) license (https://creativecommons.org/licenses/by/4.0/).
Share and Cite
Zhao, M.; Zhang, L.; Liang, L.; Sun, S.; Chen, S.; Chen, L.; Zhang, Y. Research on the Process and Quality of Prepacked Braised Meat Products. Foods 2025, 14, 3937. https://doi.org/10.3390/foods14223937
Zhao M, Zhang L, Liang L, Sun S, Chen S, Chen L, Zhang Y. Research on the Process and Quality of Prepacked Braised Meat Products. Foods. 2025; 14(22):3937. https://doi.org/10.3390/foods14223937
Chicago/Turabian StyleZhao, Mingxia, Lili Zhang, Li Liang, Shihao Sun, Shuxing Chen, Lishui Chen, and Yuyu Zhang. 2025. "Research on the Process and Quality of Prepacked Braised Meat Products" Foods 14, no. 22: 3937. https://doi.org/10.3390/foods14223937
APA StyleZhao, M., Zhang, L., Liang, L., Sun, S., Chen, S., Chen, L., & Zhang, Y. (2025). Research on the Process and Quality of Prepacked Braised Meat Products. Foods, 14(22), 3937. https://doi.org/10.3390/foods14223937