
Melatonin-Induced Modulation of Polyphenols and Glycolytic Pathways in Relation to Postharvest Quality of Blue Honeysuckle Fruits


 ,
, 
Abstract
1. Introduction
2. Materials and Methods
2.1. Chemicals
2.2. Sample Treatment
2.3. Surface Color
2.4. Weight Loss and Firmness
2.5. Sugars and Total Soluble Solids
2.6. Organic Acids, Acidity, and pH
2.7. Determination of Total Phenolic Content (TPC), Total Anthocyanin Content (TAC), and Total Flavonoid Content (TFC)
2.8. Characterization and Quantification of Polyphenols
2.9. Antioxidant Capacity
2.10. MDA Content
2.11. Statistical Analysis
3. Results and Discussion
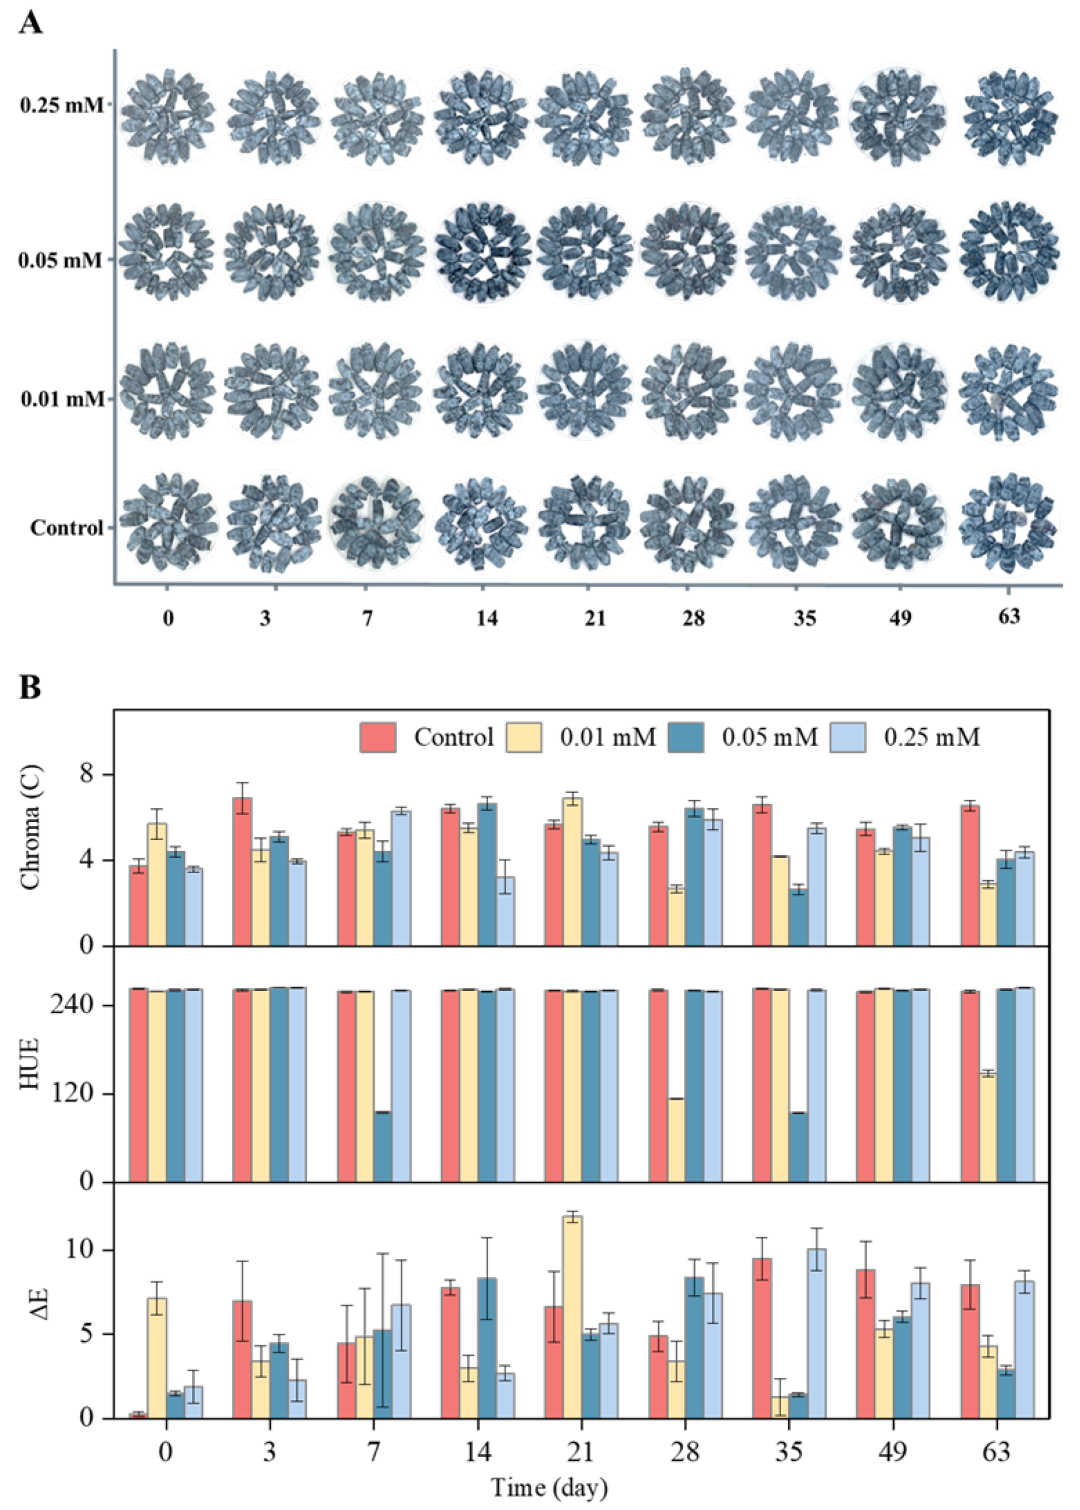
3.1. Appearance and Color of Blue Honeysuckle Fruits
3.2. Weight Loss and Fruit Firmness of Blue Honeysuckle Fruits
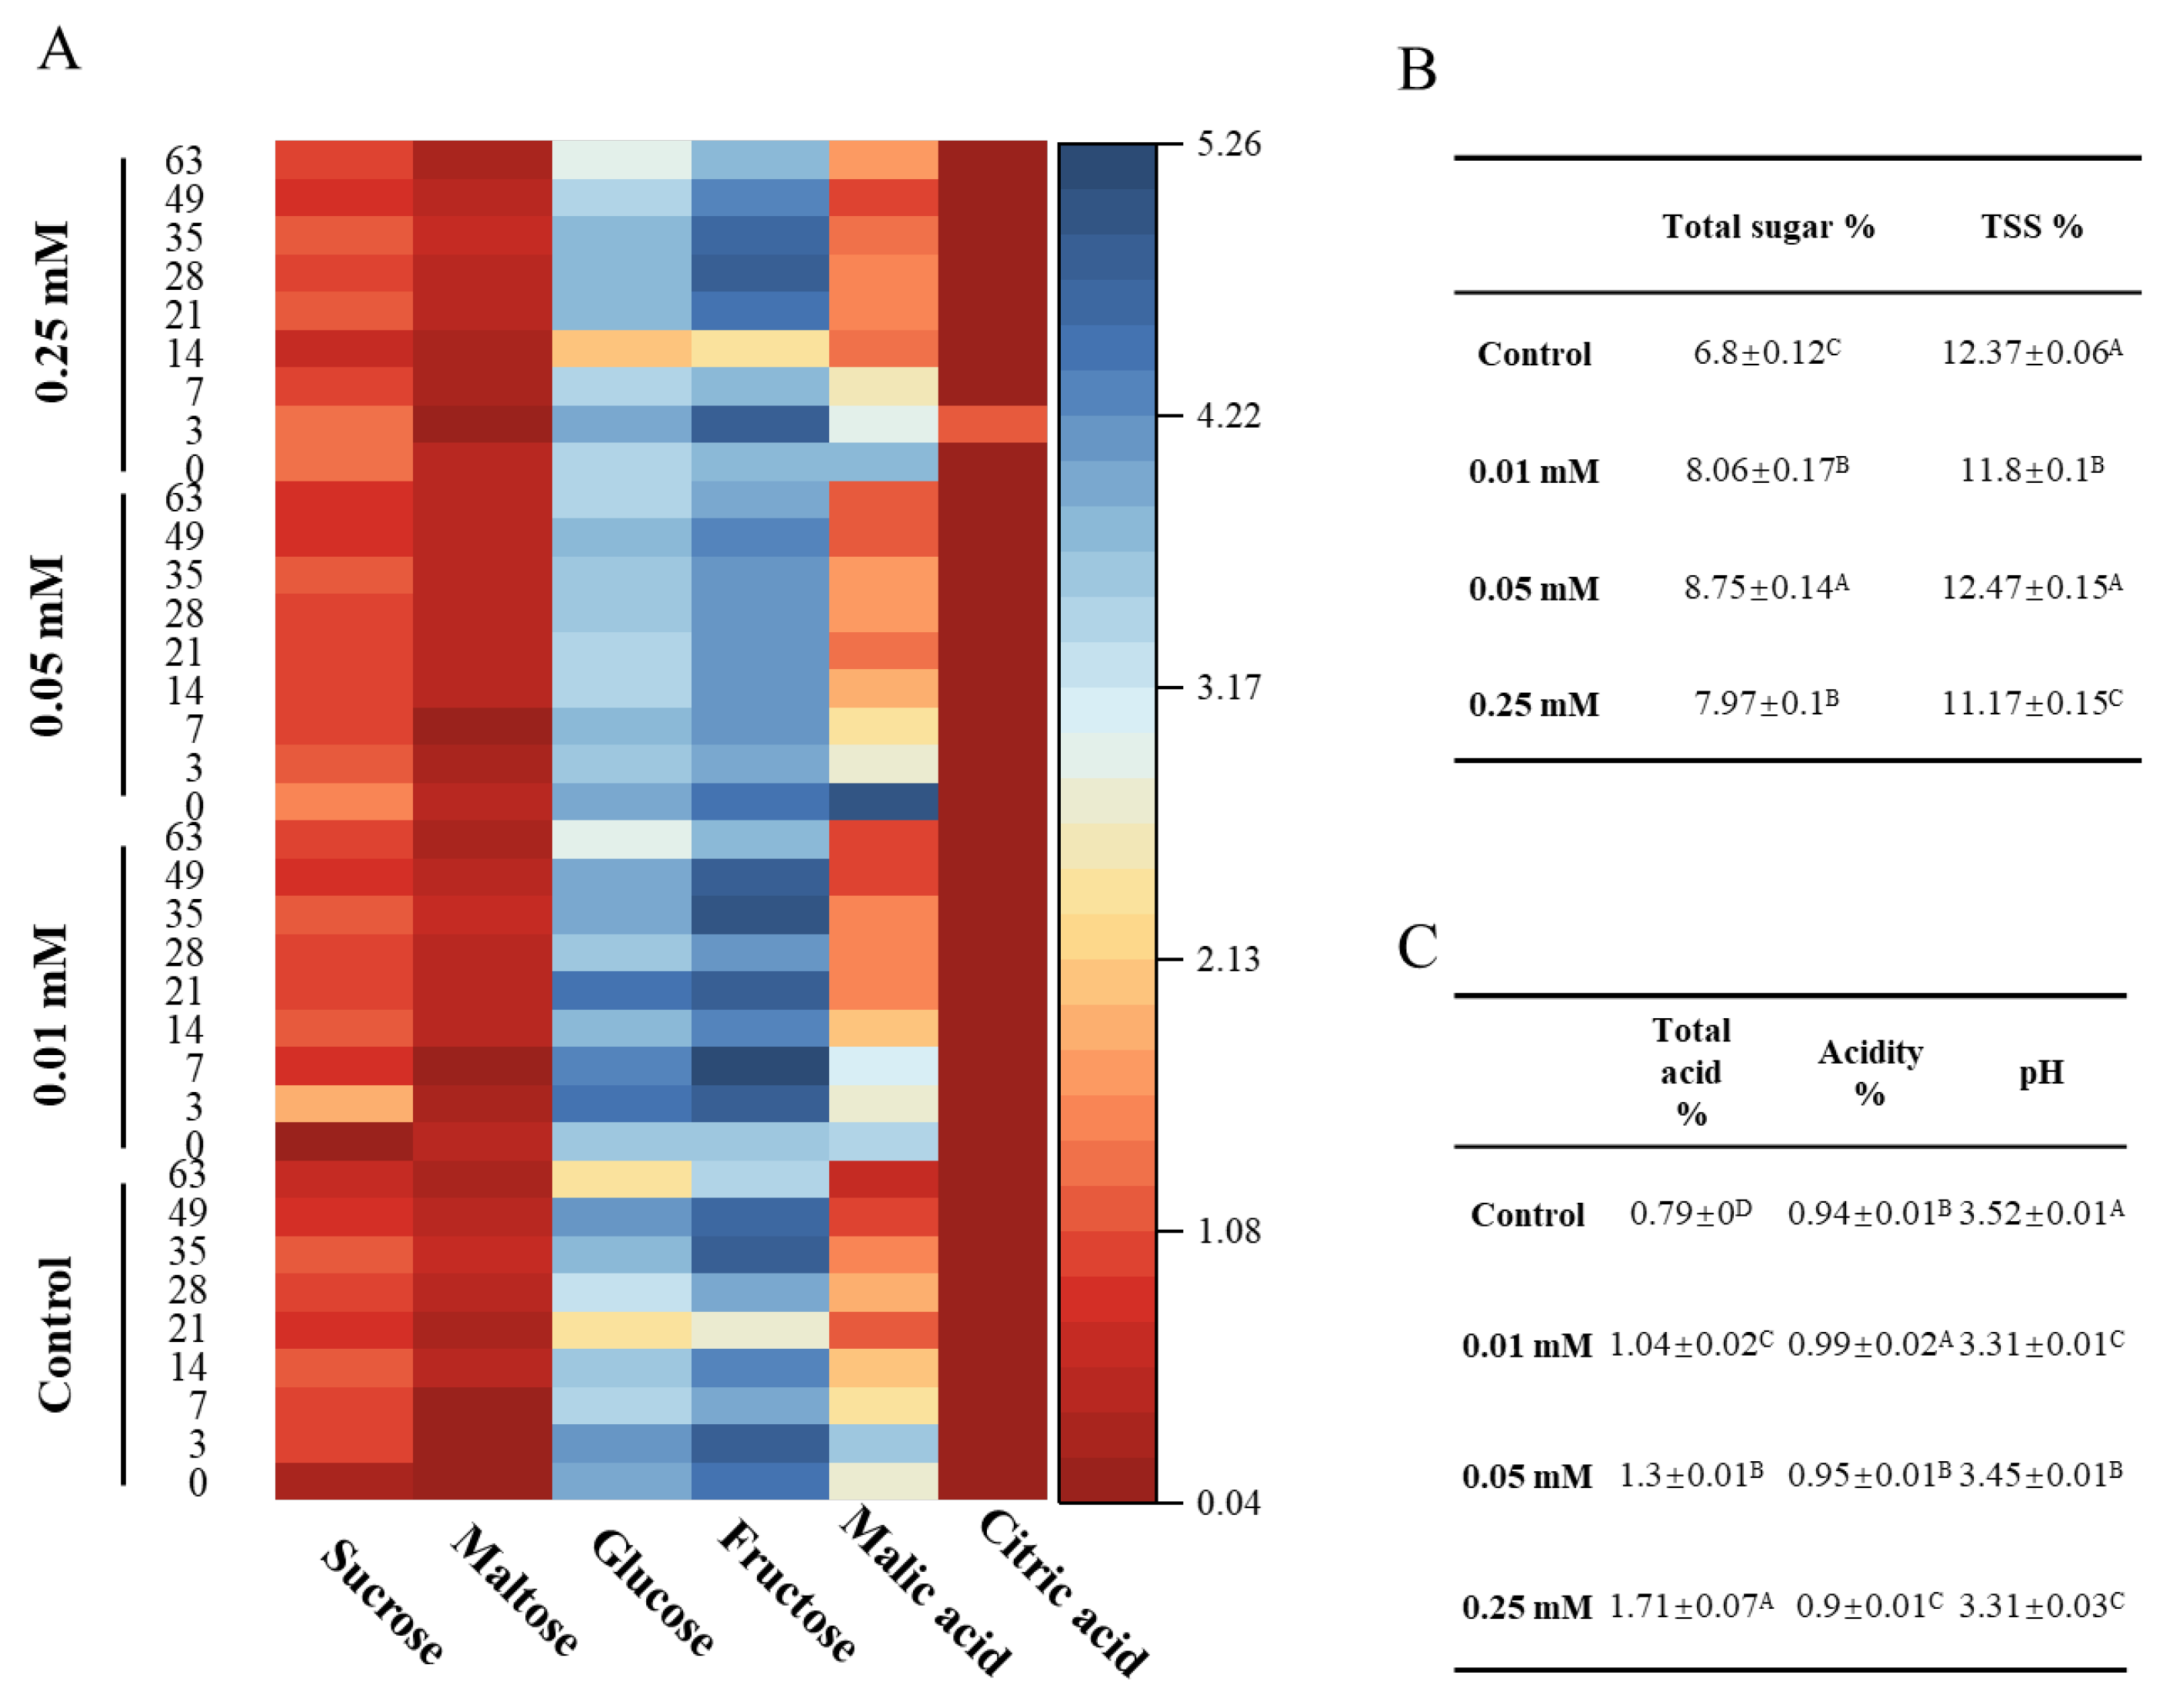
3.3. Sugars and Acids of Blue Honeysuckle Fruits
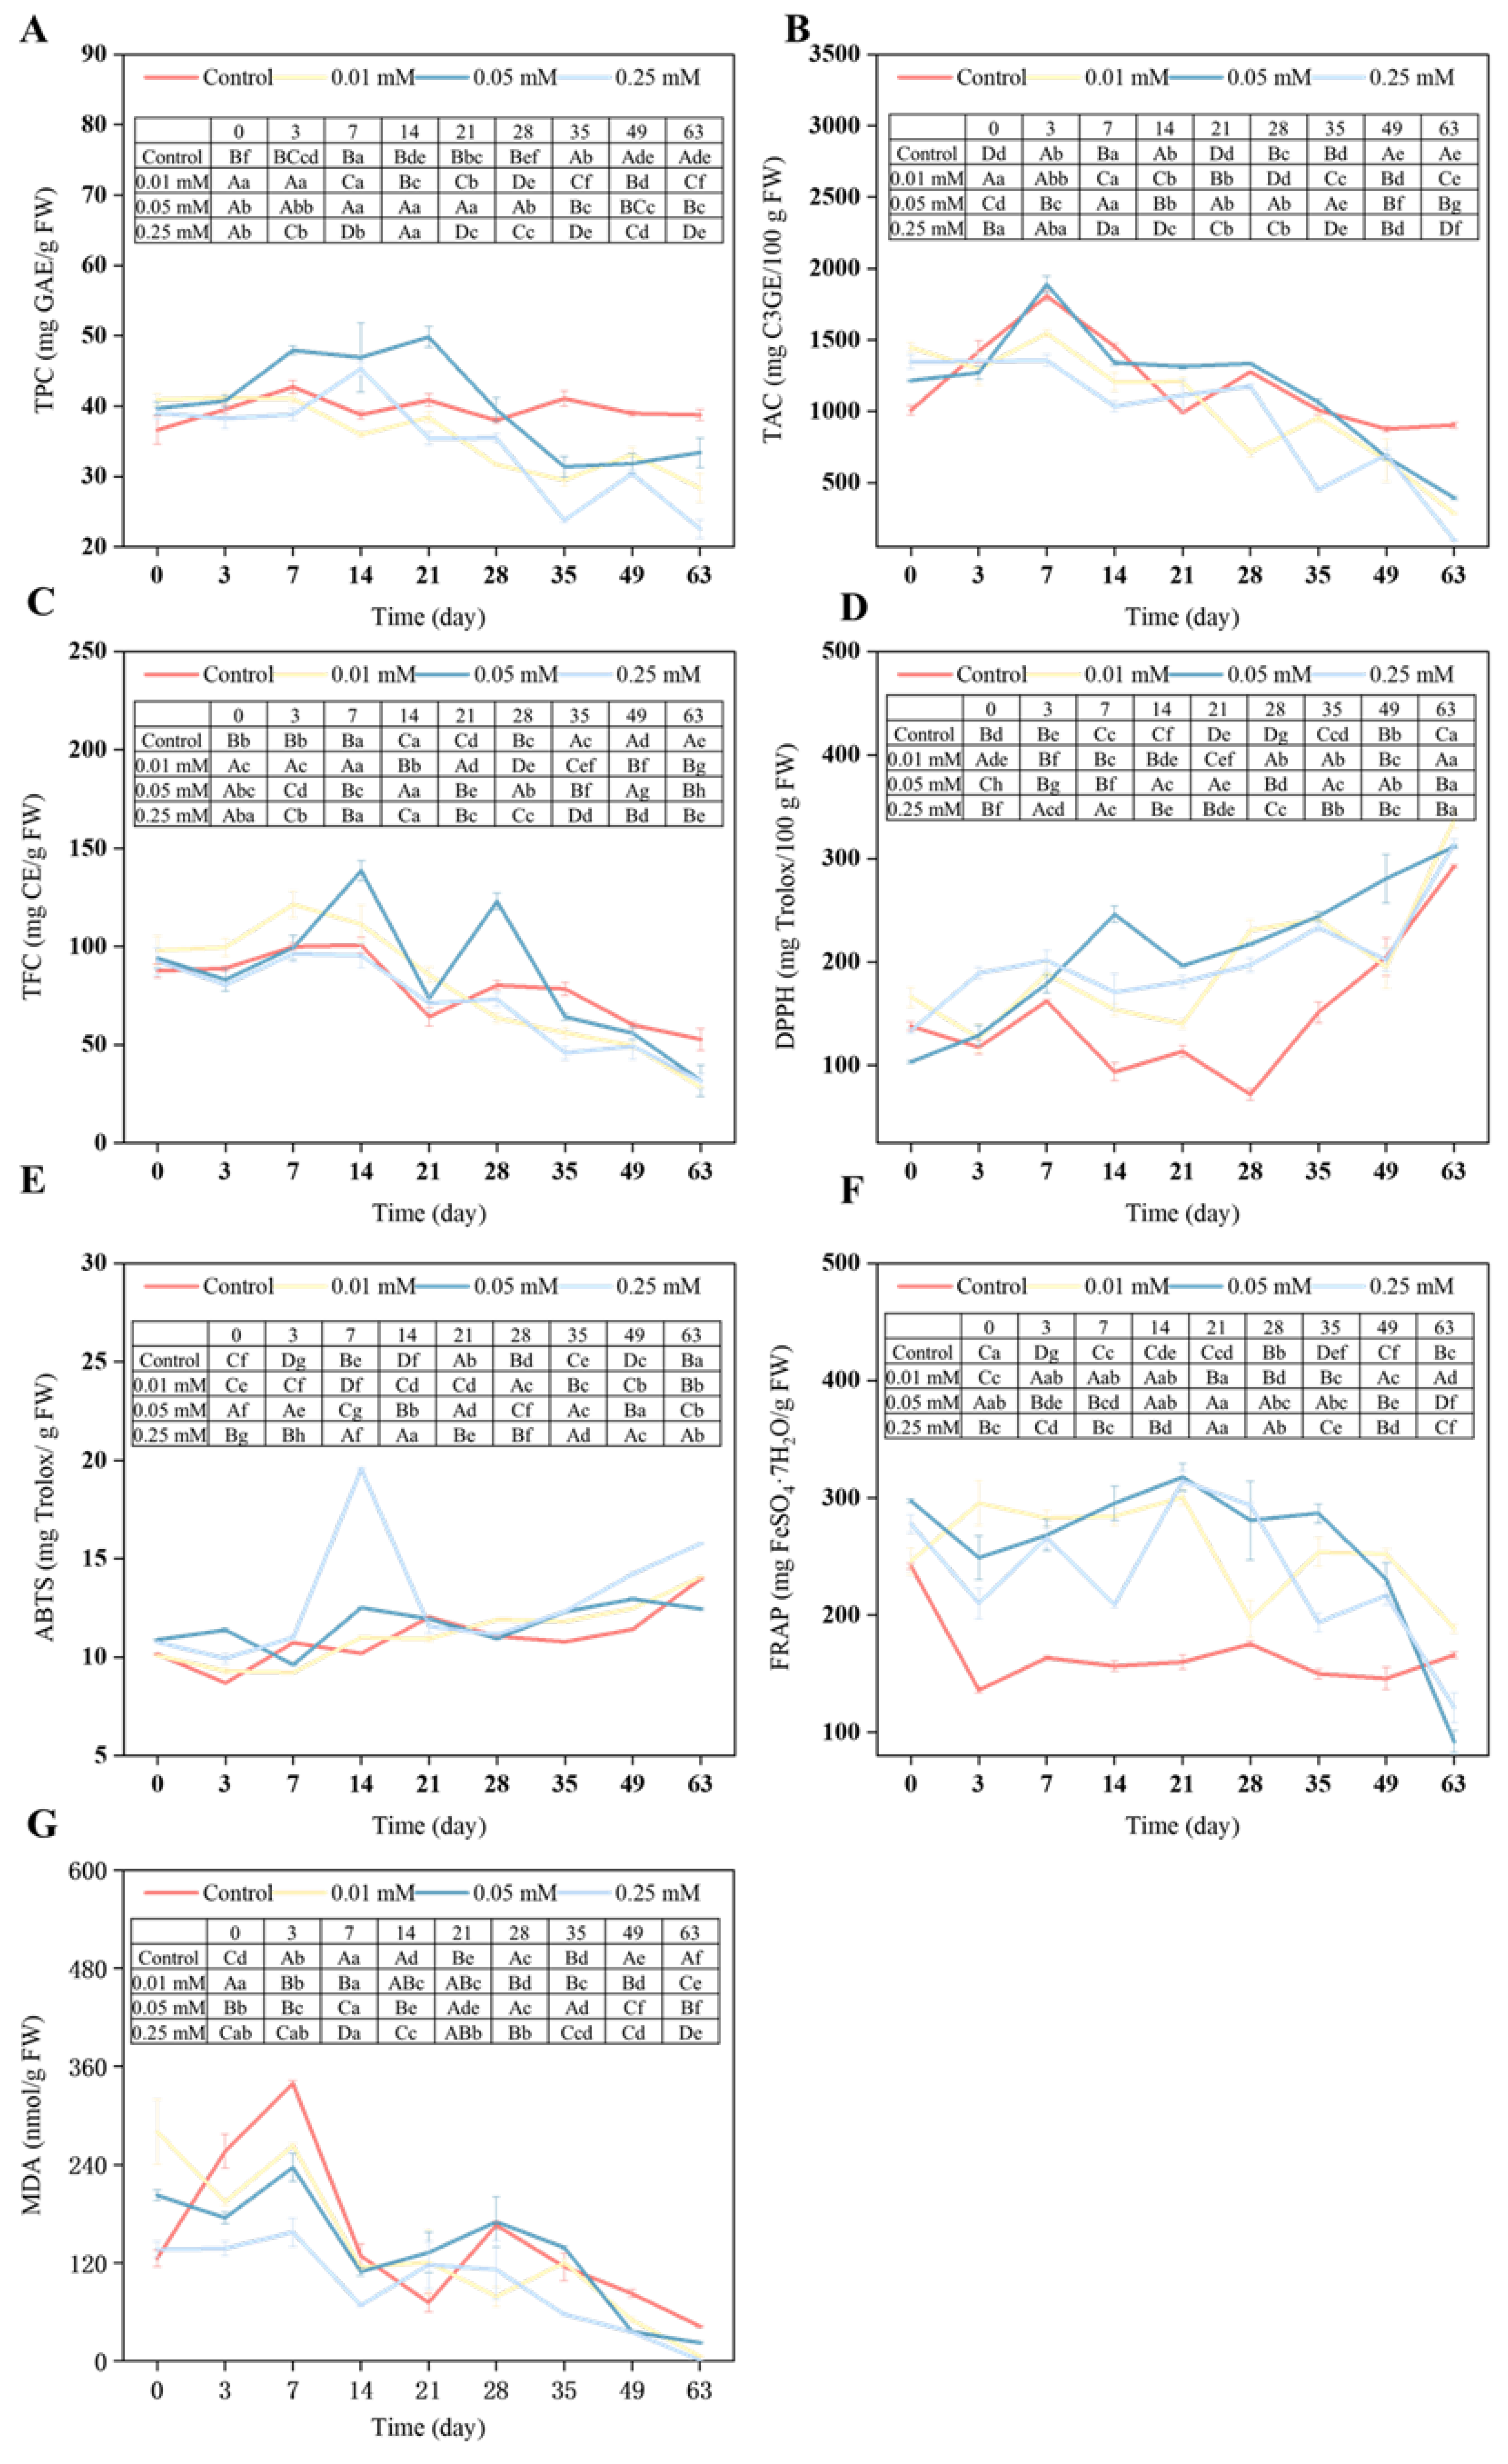
3.4. TPC, TAC, and TFC of Blue Honeysuckle Fruits
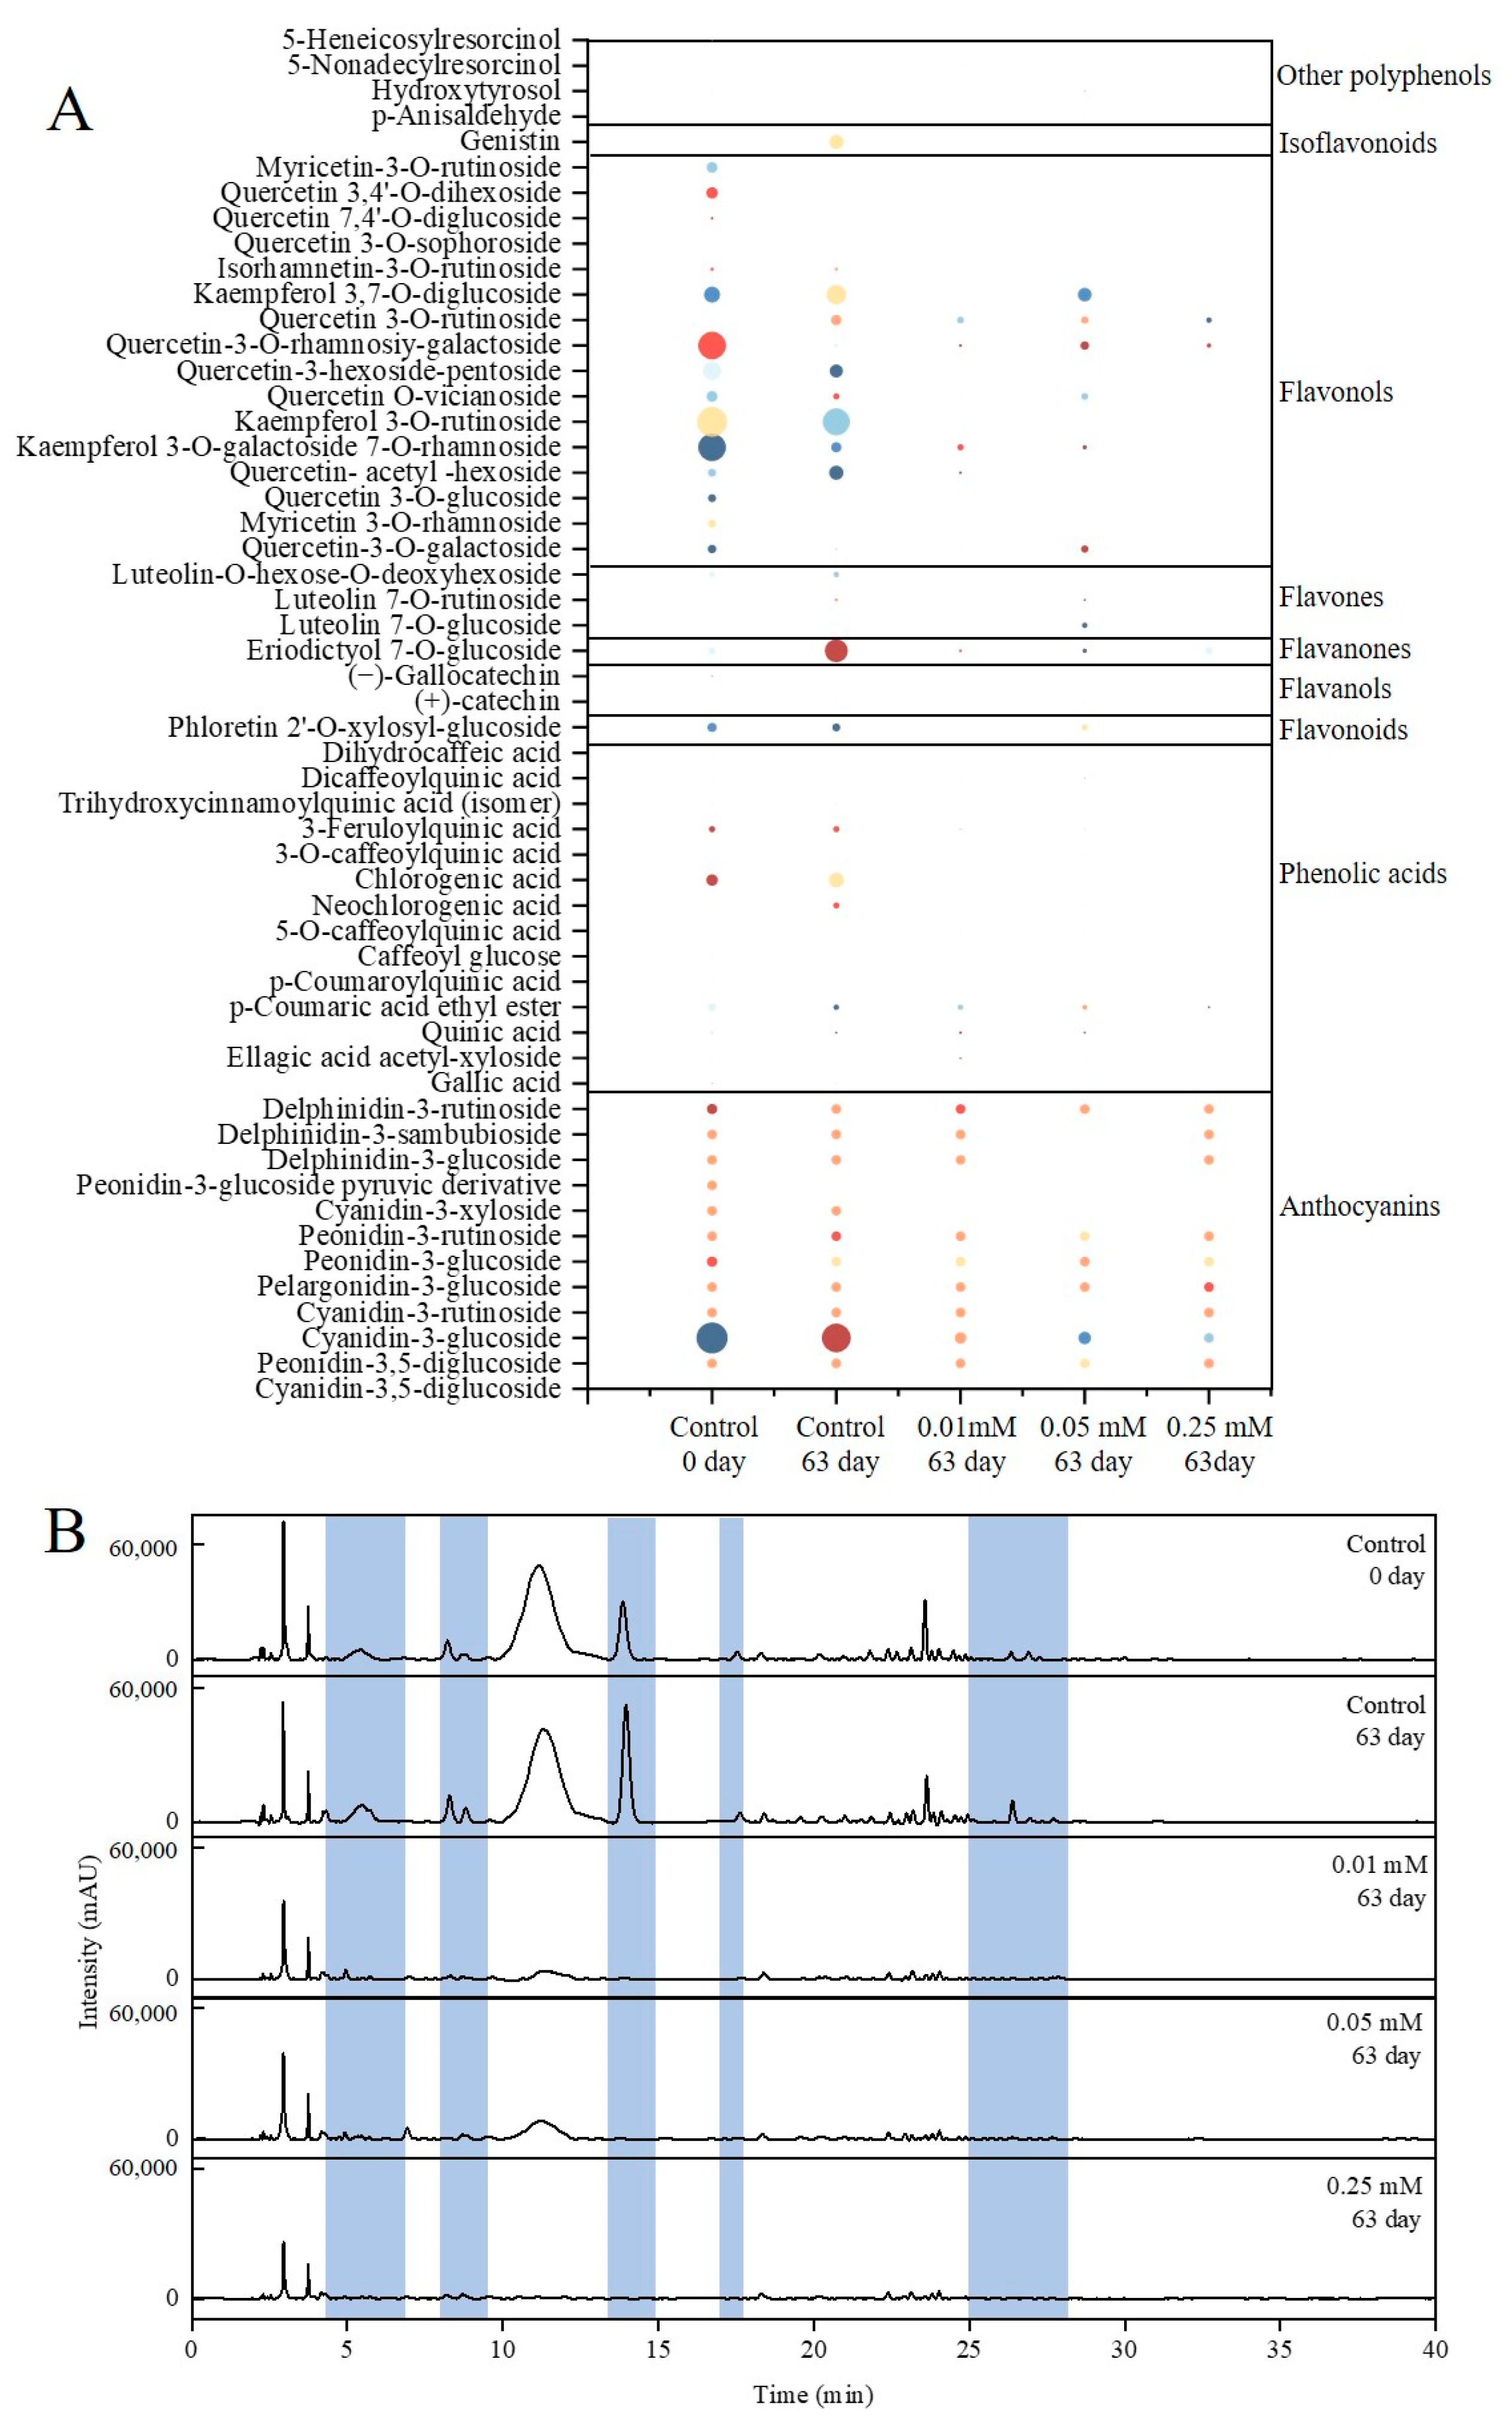
3.5. Qualitative Analysis of Polyphenols of Blue Honeysuckle Fruits
3.6. Quantitative Analysis of Polyphenols of Blue Honeysuckle Fruits
3.7. Antioxidant Capacity of Blue Honeysuckle Fruits
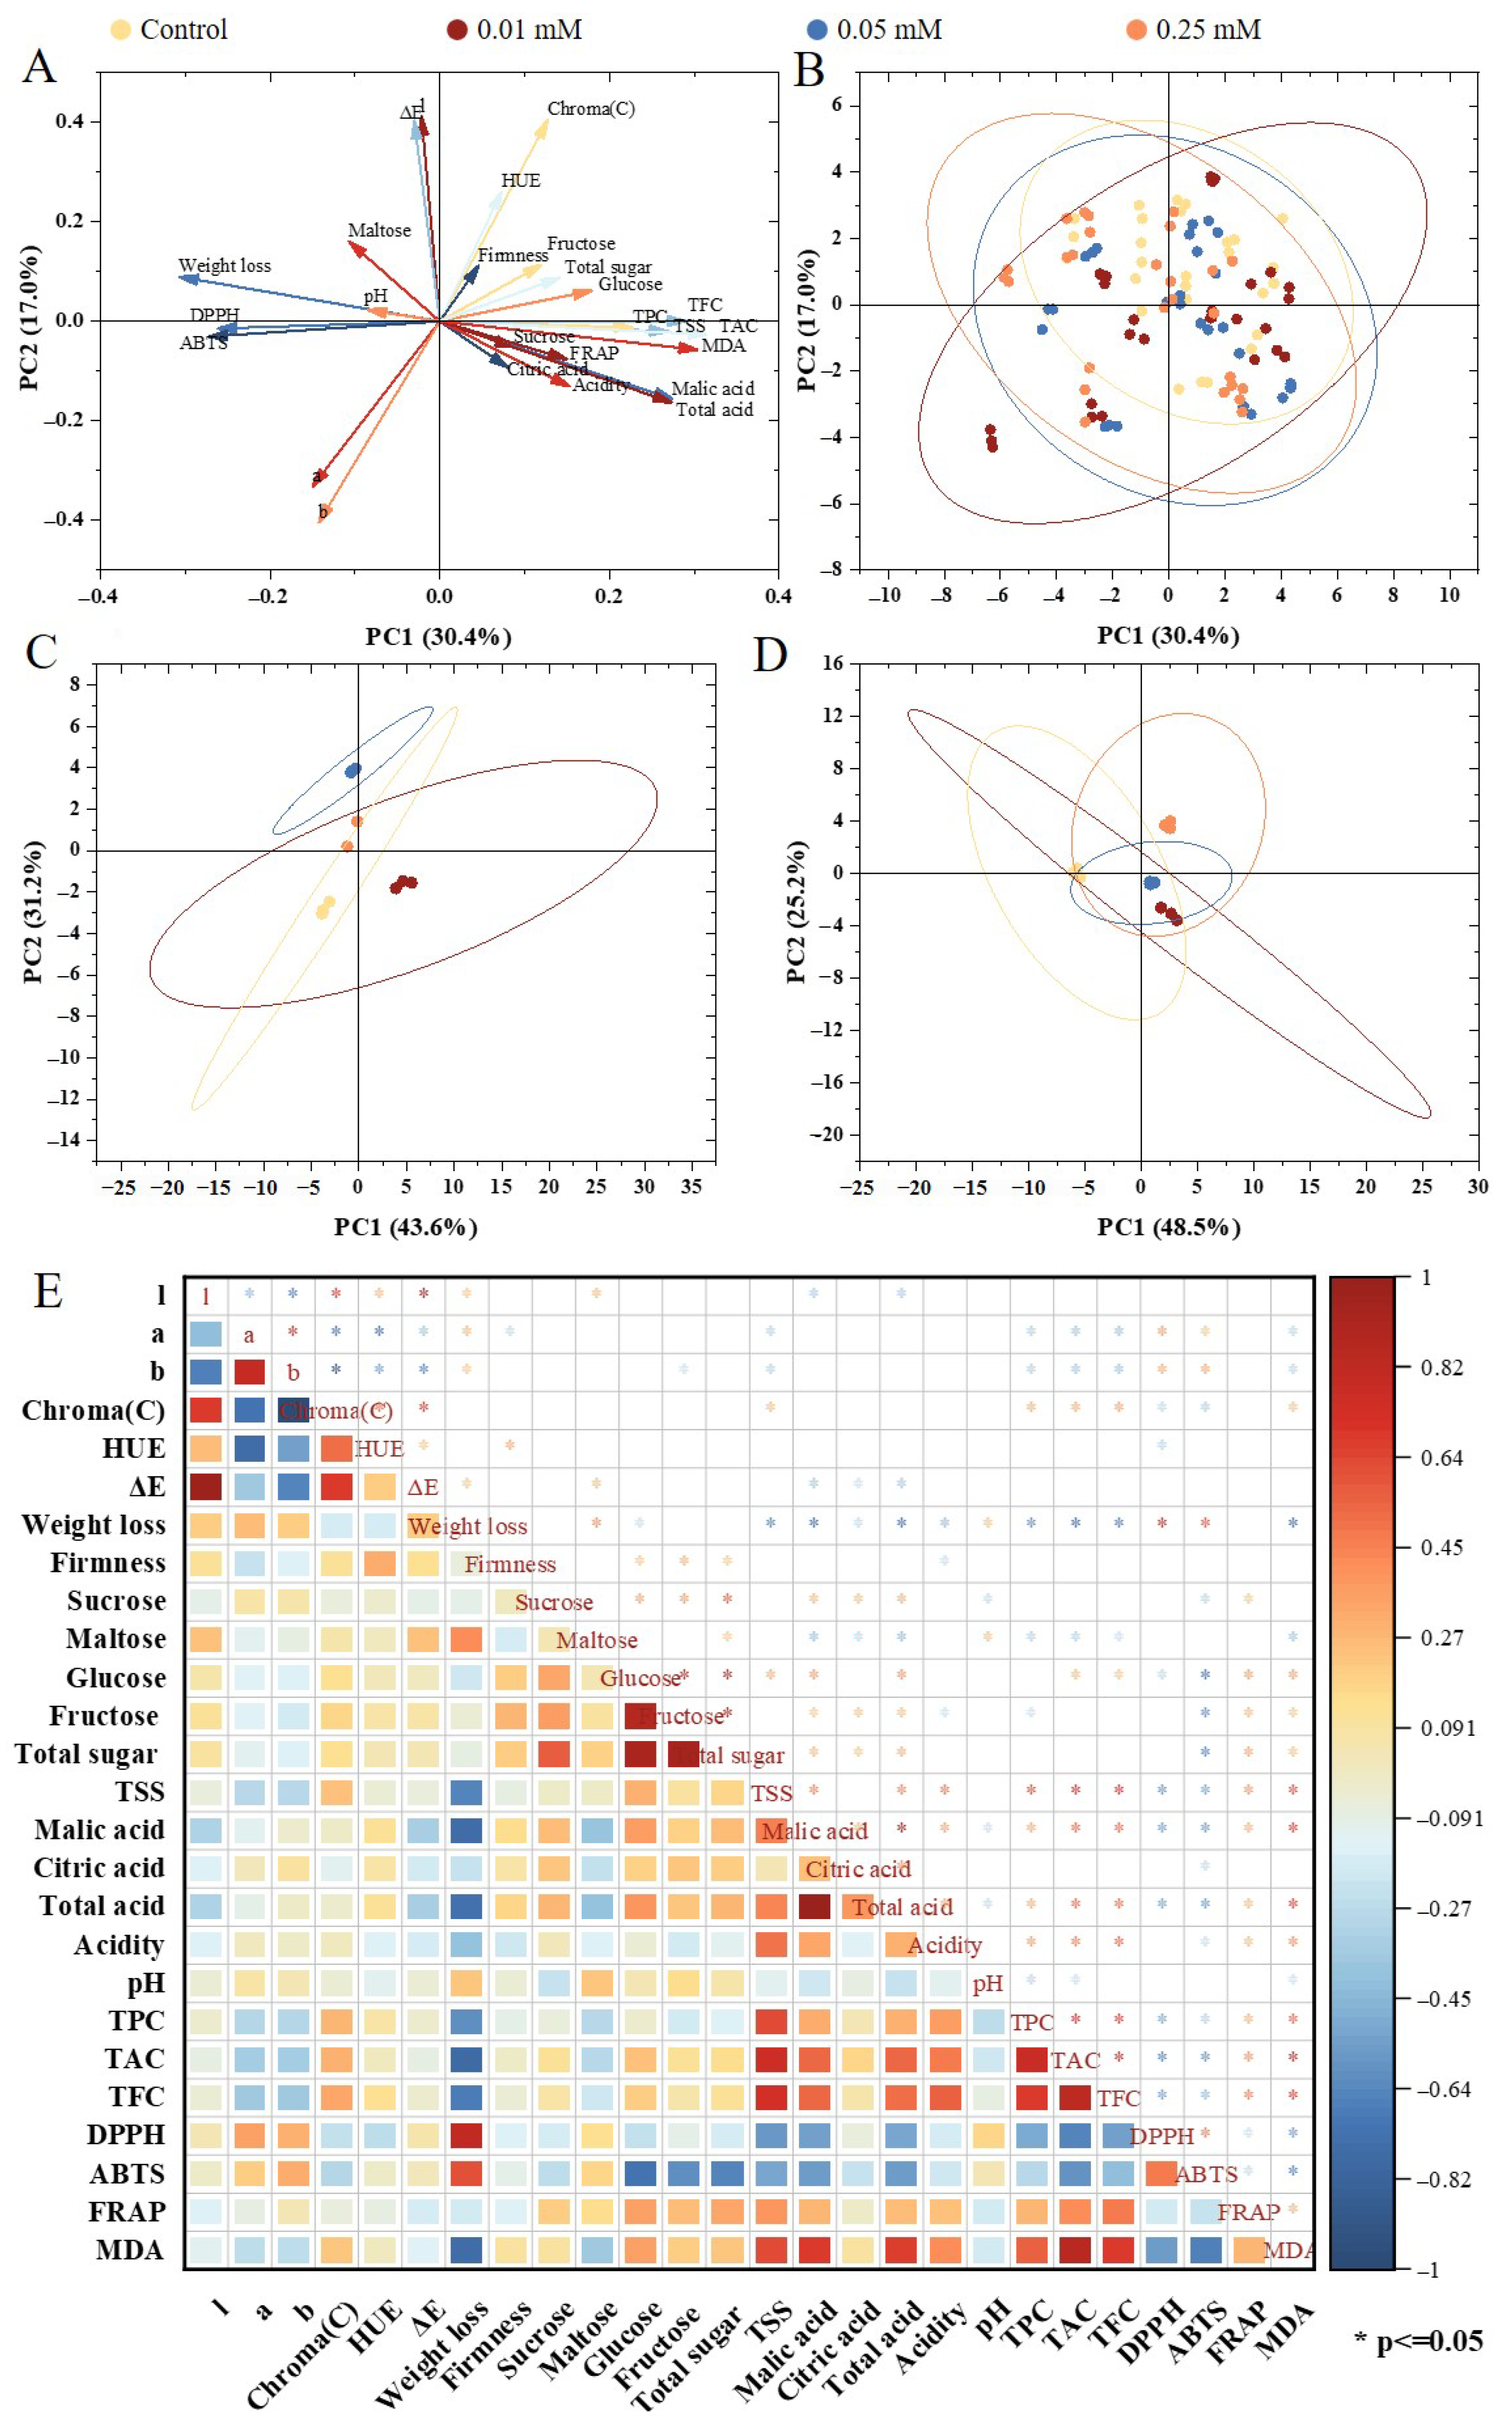
3.8. Multivariate Statistical Analysis
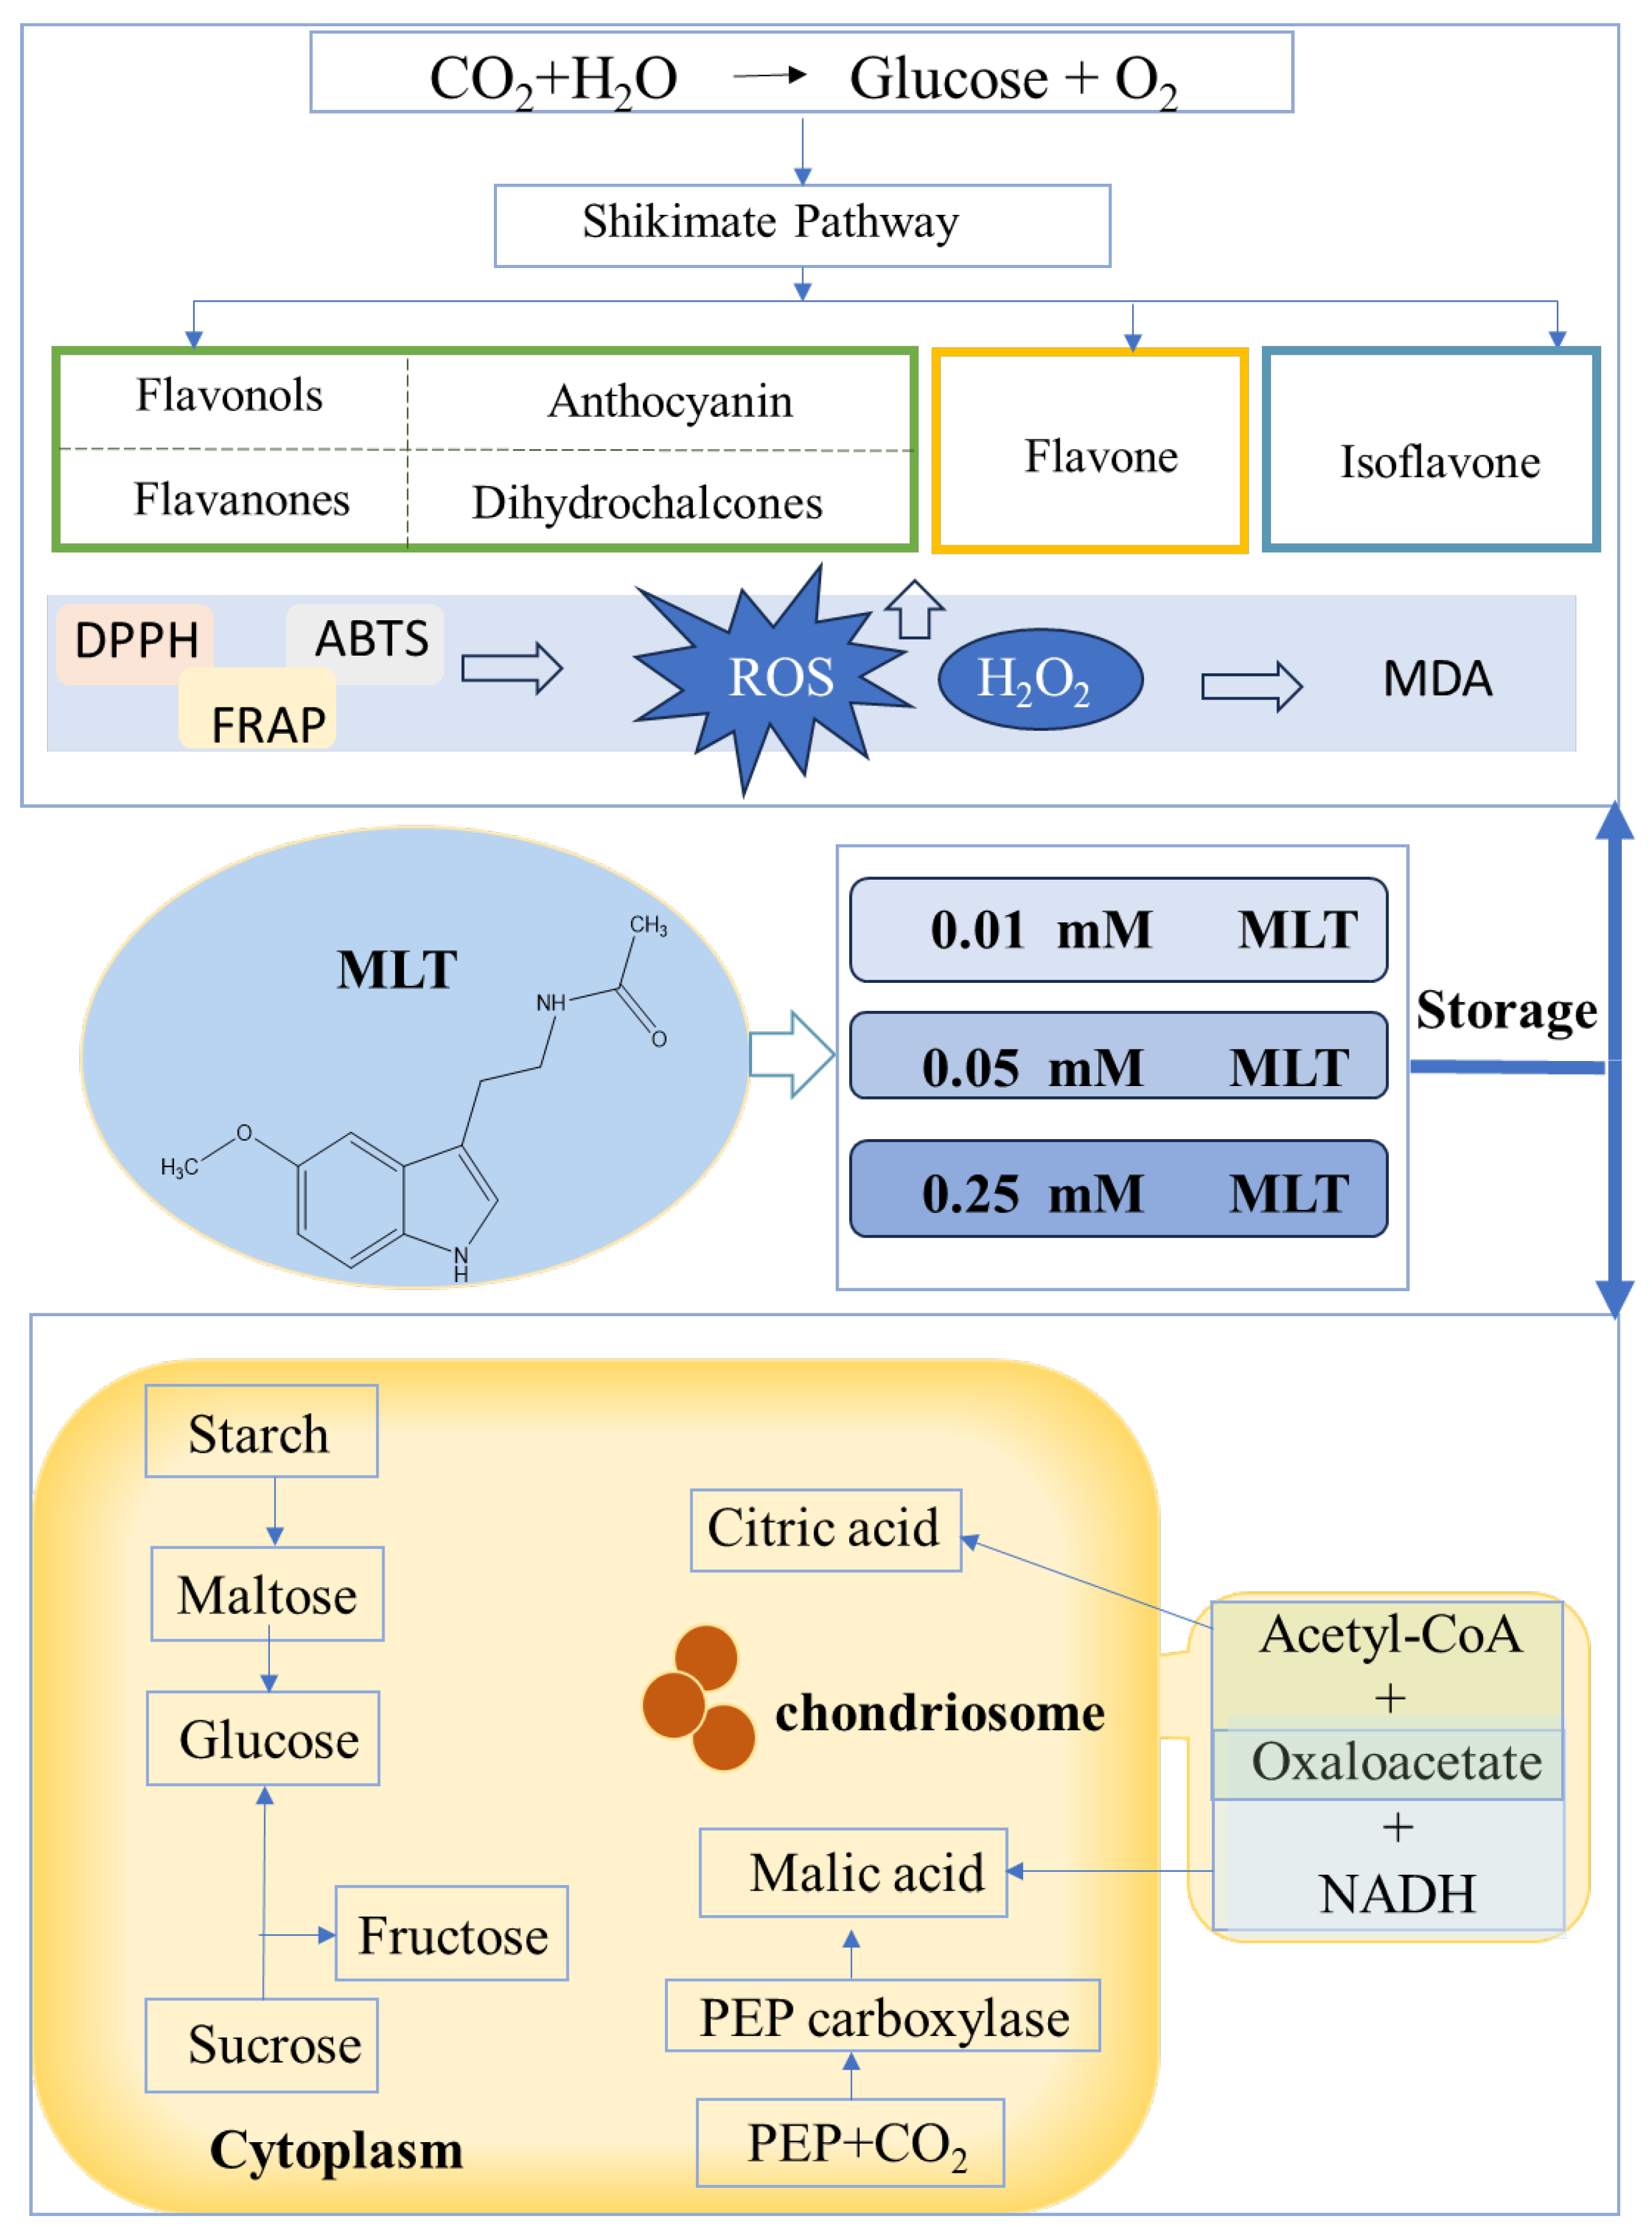
3.9. Regulatory Mechanisms of Melatonin on Sugars, Acids, and Polyphenols
4. Conclusions
Author Contributions
Funding
Institutional Review Board Statement
Informed Consent Statement
Data Availability Statement
Conflicts of Interest
Appendix A

| Treatment | 0 Day | 3 Day | 7 Day | 14 Day | 21 Day | 28 Day | 35 Day | 49 Day | 63 Day |
|---|---|---|---|---|---|---|---|---|---|
| l | |||||||||
| control | 26.39 ± 0 Bd | 32.53 ± 2.62 Aabc | 30.47 ± 2.46 Ac | 33.69 ± 0.45 Aab | 32.73 ± 2.15 Babc | 30.89 ± 0.96 Bbc | 35.41 ± 1.42 Aa | 35.04 ± 1.67 Aa | 33.81 ± 1.45 Aab |
| 0.01 mM | 33.24 ± 0.85 Ab | 29.64 ± 1.02 ABcd | 30.19 ± 4.19 Abcd | 28.66 ± 1.24 Bcd | 37.96 ± 0.39 Aa | 29.09 ± 1.44 Bcd | 27.37 ± 1.37 Bd | 31.65 ± 0.52 Bbc | 28.47 ± 1.34 Bcd |
| 0.05 mM | 27.69 ± 0.3 Bcd | 30.63 ± 0.49 ABabc | 31.1 ± 5.14 Aabc | 34.14 ± 2.52 Aa | 31.22 ± 0.36 Babc | 34.32 ± 1.12 Aa | 26.46 ± 0.73 Bd | 32.15 ± 0.34 Bab | 29.21 ± 0.3 Bbcd |
| 0.25 mM | 26.32 ± 2.49 Bc | 28.65 ± 1.28 Bc | 32.53 ± 2.98 Ab | 27.38 ± 2.91 Bc | 32 ± 0.6 Bb | 33.49 ± 1.77 Aab | 36.27 ± 1.28 Aa | 34.31 ± 0.83 Aab | 34.49 ± 0.68 Aab |
| a | |||||||||
| control | −0.47 ± 0.02 Aa | −1.05 ± 0.05 Ccd | −1.07 ± 0.07 Bcd | −1.06 ± 0.04 Ccd | −0.98 ± 0.06 Bcbd | −0.88 ± 0.1 Bbc | −0.83 ± 0.07 Cb | −1.09 ± 0.1 Dde | −1.25 ± 0.22 Ce |
| 0.01 mM | −1.05 ± 0.13 Ce | −0.64 ± 0.03 Bcd | −1.06 ± 0.05 Be | −0.77 ± 0.05 Bd | −1.28 ± 0.09 Cf | 1.05 ± 0.05 Ab | −0.59 ± 0.04 Bc | −0.59 ± 0.02 Ac | 2.42 ± 0.23 Aa |
| 0.05 mM | −0.71 ± 0.08 Be | −0.49 ± 0.04 Ac | 0.38 ± 0.05 Aa | −1.33 ± 0.03 Dh | −0.99 ± 0.04 Bfg | −1.05 ± 0.02 Cg | 0.18 ± 0.02 Ab | −0.95 ± 0.03 Cf | −0.57 ± 0.03 Bd |
| 0.25 mM | −0.54 ± 0.03 Ab | −0.42 ± 0.04 Aa | −1.11 ± 0.05 Be | −0.43 ± 0.02 Aa | −0.72 ± 0.04 Ac | −1.11 ± 0.07 Ce | −0.87 ± 0.06 Cd | −0.73 ± 0.03 Bc | −0.47 ± 0.02 Bab |
| b | |||||||||
| control | −3.7 ± 0.34 Ba | −6.81 ± 0.73 Cc | −5.2 ± 0.17 Bb | −6.31 ± 0.21 Cc | −5.58 ± 0.19 Cb | −5.48 ± 0.24 Bb | −6.53 ± 0.39 Dc | −5.33 ± 0.33 Bb | −6.39 ± 0.21 Cc |
| 0.01 mM | −5.57 ± 0.69 Ad | −4.42 ± 0.55 ABc | −5.3 ± 0.37 Bd | −5.44 ± 0.24 Bd | −6.75 ± 0.32 De | −2.44 ± 0.16 Ab | −4.12 ± 0.04 Bc | −4.36 ± 0.13 Ac | −1.52 ± 0.19 Aa |
| 0.05 mM | −4.32 ± 0.24 Bbc | −5.04 ± 0.24 Bde | −4.37 ± 0.48 Abc | −6.5 ± 0.3 Cf | −4.84 ± 0.21 Bcd | −6.32 ± 0.38 Cf | −2.61 ± 0.25 Aa | −5.45 ± 0.12 Be | −4 ± 0.42 Bb |
| 0.25 mM | −3.52 ± 0.14 Bab | −3.9 ± 0.12 Aabc | −6.18 ± 0.18 Cg | −3.18 ± 0.8 Aa | −4.26 ± 0.34 Abcd | −5.77 ± 0.48 BCfg | −5.39 ± 0.26 Cef | −4.99 ± 0.66 ABde | −4.34 ± 0.26 Bcd |
| Chroma (c) | |||||||||
| control | 3.73 ± 0.34 BCc | 6.89 ± 0.72 Aa | 5.31 ± 0.16 Bb | 6.4 ± 0.2 Aa | 5.66 ± 0.19 Bb | 5.55 ± 0.22 Bb | 6.58 ± 0.38 Aa | 5.44 ± 0.31 Ab | 6.52 ± 0.24 Aa |
| 0.01 mM | 5.67 ± 0.7 Ab | 4.47 ± 0.55 BCc | 5.41 ± 0.37 Bb | 5.49 ± 0.23 Bb | 6.87 ± 0.3 Aa | 2.66 ± 0.17 Cd | 4.16 ± 0.04 Cc | 4.4 ± 0.12 Bcd | 2.86 ± 0.16 Cd |
| 0.05 mM | 4.38 ± 0.23 Bd | 5.06 ± 0.24 Bbc | 4.39 ± 0.48 Cd | 6.63 ± 0.29 Aa | 4.94 ± 0.2 Cc | 6.41 ± 0.37 Aa | 2.62 ± 0.25 De | 5.53 ± 0.12 Ab | 4.04 ± 0.41 Bd |
| 0.25 mM | 3.56 ± 0.14 Cf | 3.93 ± 0.12 Cef | 6.28 ± 0.19 Aa | 3.21 ± 0.79 Cd | 4.32 ± 0.34 Dde | 5.88 ± 0.48 ABab | 5.46 ± 0.24 Bbc | 5.04 ± 0.65 ABcd | 4.37 ± 0.26 Bde |
| Hue (h) | |||||||||
| control | 262.68 ± 0.37 Aa | 261.17 ± 1.02 Bab | 258.4 ± 0.84 Bd | 260.45 ± 0.66 ABbcd | 260.07 ± 0.28 Abcd | 260.81 ± 1.41 Abc | 262.74 ± 1.02 Aa | 258.39 ± 1.61 Cd | 258.94 ± 1.62 Acd |
| 0.01 mM | 259.29 ± 0.16 Cab | 261.74 ± 0.91 Bab | 258.63 ± 0.7 ABb | 261.92 ± 0.74 Aab | 259.2 ± 1.12 ABab | 113.27 ± 0.34 Bd | 261.89 ± 0.58 ABab | 262.33 ± 0.49 Aa | 147.68 ± 4.89 Bc |
| 0.05 mM | 260.67 ± 1.41 BCbc | 264.41 ± 0.32 Aa | 95.06 ± 0.9 Ce | 258.44 ± 0.62 Bd | 258.45 ± 0.8 Bd | 260.52 ± 0.64 Ac | 93.89 ± 0.63 Ce | 260.15 ± 0.28 BCbc | 261.8 ± 0.67 Ab |
| 0.25 mM | 261.24 ± 0.14 Bbc | 263.84 ± 0.76 Aa | 259.85 ± 0.39 Acd | 262.05 ± 1.82 Ab | 260.4 ± 0.43 Abcd | 259.11 ± 0.86 Acd | 260.76 ± 1.08 Bbc | 261.56 ± 0.84 ABb | 263.82 ± 0.28 Aa |
| ΔE | |||||||||
| control | 0.25 ± 0.15 Cd | 7 ± 2.37 Abc | 4.44 ± 2.3 Ac | 7.78 ± 0.46 Ab | 6.64 ± 2.09 Babc | 4.87 ± 0.88 Bbc | 9.48 ± 1.27 Aa | 8.83 ± 1.67 Aa | 7.94 ± 1.44 Aa |
| 0.01 mM | 7.13 ± 0.99 Ab | 3.38 ± 0.94 ABcd | 4.87 ± 2.85 Ac | 2.99 ± 0.78 Bcd | 11.99 ± 0.33 Aa | 3.41 ± 1.2 Bcd | 1.26 ± 1.1 Bd | 5.31 ± 0.51 Bbc | 4.29 ± 0.65 Bc |
| 0.05 mM | 1.49 ± 0.16 BCc | 4.45 ± 0.51 ABbc | 5.24 ± 4.54 Aab | 8.3 ± 2.43 Aa | 5 ± 0.33 Bb | 8.38 ± 1.09 Aa | 1.41 ± 0.11 Bc | 6.04 ± 0.34 Bab | 2.86 ± 0.3 Bbc |
| 0.25 mM | 1.88 ± 0.99 Bc | 2.29 ± 1.25 Bc | 6.73 ± 2.69 Ab | 2.68 ± 0.45 Bc | 5.65 ± 0.62 Bb | 7.43 ± 1.8 Ab | 10.04 ± 1.25 Aa | 8.04 ± 0.92 Aab | 8.13 ± 0.67 Aab |
| Weight loss (%) | |||||||||
| control | 0.00% ± 0.00 Ag | 0.05% ± 0.00 Cg | 0.08% ± 0.00 Bg | 0.69% ± 0.00 Cf | 1.11% ± 0.00 Ce | 1.49% ± 0.00 Bd | 2.14% ± 0.00 Cc | 2.91% ± 0.00 Cb | 3.66% ± 0.00 Ca |
| 0.01 mM | 0.00% ± 0.00 Ai | 0.47% ± 0.00 Bh | 1.25% ± 0.00 Ag | 2.12% ± 0.00 Bf | 2.75% ± 0.00 Be | 3.21% ± 0.00 Ad | 3.74% ± 0.00 Bc | 4.65% ± 0.00 Bb | 5.47% ± 0.00 Ba |
| 0.05 mM | 0.00% ± 0.00 Ai | 0.82% ± 0.00 Ah | 1.58% ± 0.00 Ag | 2.59% ± 0.00 Af | 3.27% ± 0.00 Ae | 3.74% ± 0.00 Ad | 4.35% ± 0.00 Ac | 5.37% ± 0.00 Ab | 6.30% ± 0.01 Aa |
| 0.25 mM | 0.00% ± 0.00 Ah | 0.74% ± 0.00 Ag | 1.58% ± 0.00 Af | 2.59% ± 0.00 Ae | 3.41% ± 0.00 Ad | 3.64% ± 0.00 Ad | 4.17% ± 0.00 ABc | 5.51% ± 0.00 Ab | 6.44% ± 0.00 Aa |
| Firmness (N) | |||||||||
| control | 1.31 ± 0.13 Aab | 1.57 ± 0.52 Aa | 1.32 ± 0.8 Aab | 1.35 ± 0.15 Aab | 0.90 ± 0.25 BCb | 0.88 ± 0.13 Bb | 1.35 ± 0.13 Aab | 1.23 ± 0.13 Aab | 0.73 ± 0.02 Cb |
| 0.01 mM | 1.04 ± 0.15 Aabcd | 0.99 ± 0.2 Abcd | 1.32 ± 0.37 Aa | 0.83 ± 0.1 Ccd | 1.15 ± 0.14 Babc | 0.87 ± 0.16 Bcd | 1.02 ± 0.13 Aabcd | 1.22 ± 0.05 Aab | 0.76 ± 0.03 Cd |
| 0.05 mM | 1.08 ± 0.13 Abc | 1.3 ± 0.25 Aa | 0.85 ± 0.05 Ad | 0.88 ± 0.03 Cd | 0.77 ± 0.03 Cd | 0.92 ± 0.05 Bcd | 0.83 ± 0.05 Ad | 1.19 ± 0.07 Aab | 1.25 ± 0.03 Bab |
| 0.25 mM | 1.2 ± 0.39 Aabc | 1.22 ± 0.25 Aabc | 0.93 ± 0.21 Ac | 1.1 ± 0.12 Babc | 1.57 ± 0.24 Aa | 1.52 ± 0.28 Aab | 0.88 ± 0.22 Ac | 1.19 ± 0.23 Aabc | 1.55 ± 0.02 Aab |
| Sucrose (%) | |||||||||
| control | 0.28 ± 0 Ch | 1.04 ± 0.01 Dc | 1.01 ± 0.01 Ad | 1.19 ± 0 Aa | 0.75 ± 0.01 Cf | 1.03 ± 0.01 Bc | 1.12 ± 0 Cb | 0.86 ± 0 Ae | 0.67 ± 0 Dg |
| 0.01 mM | 0.18 ± 0.01 Dh | 1.82 ± 0 Aa | 0.83 ± 0.02 Cg | 1.12 ± 0 Bc | 1.01 ± 0.01 Be | 0.97 ± 0.01 Cf | 1.2 ± 0 Ab | 0.81 ± 0.02 Bg | 1.04 ± 0.01 Be |
| 0.05 mM | 1.48 ± 0.01 Aa | 1.23 ± 0 Cb | 0.97 ± 0 Bg | 0.98 ± 0 Cf | 1 ± 0.01 Be | 1.06 ± 0 Ad | 1.1 ± 0.01 Dc | 0.77 ± 0 Ci | 0.86 ± 0 Ch |
| 0.25 mM | 1.29 ± 0.01 Ba | 1.28 ± 0.01 Bb | 0.97 ± 0.01 Bg | 0.58 ± 0 Di | 1.15 ± 0 Ad | 1.02 ± 0.01 Bf | 1.18 ± 0 Bc | 0.8 ± 0 Bh | 1.06 ± 0.01 Ae |
| Maltose (%) | |||||||||
| control | 0.13 ± 0 Dg | 0.05 ± 0 Dh | 0.2 ± 0.01 Bf | 0.48 ± 0.01 Bc | 0.34 ± 0 Cd | 0.53 ± 0.01 Ab | 0.58 ± 0 Ba | 0.52 ± 0 Bb | 0.31 ± 0.01 BCe |
| 0.01 mM | 0.54 ± 0 Ab | 0.26 ± 0 Af | 0.12 ± 0.01 Cg | 0.48 ± 0 Bd | 0.5 ± 0.01 Ac | 0.5 ± 0.01 Cc | 0.61 ± 0 Aa | 0.55 ± 0.01 Ab | 0.3 ± 0 Ce |
| 0.05 mM | 0.41 ± 0.01 Ce | 0.23 ± 0 Bf | 0.2 ± 0.01 Bg | 0.51 ± 0 Ab | 0.47 ± 0 Bc | 0.51 ± 0 Bb | 0.56 ± 0.01 Ca | 0.47 ± 0.02 Cc | 0.43 ± 0 Ad |
| 0.25 mM | 0.46 ± 0.01 Be | 0.2 ± 0.01 Ch | 0.36 ± 0.01 Af | 0.31 ± 0.01 Cg | 0.47 ± 0.01 Bd | 0.53 ± 0.01 Ab | 0.57 ± 0 Ba | 0.49 ± 0.01 Cc | 0.32 ± 0.01 Bg |
| Glucose (%) | |||||||||
| control | 3.96 ± 0 ABb | 4.05 ± 0.1 Ba | 3.37 ± 0.07 Cc | 3.52 ± 0.16 Ac | 2.43 ± 0.01 Dd | 3.32 ± 0.05 Bc | 3.77 ± 0.08 ABb | 4.06 ± 0.12 Aa | 2.43 ± 0.31 Cd |
| 0.01 mM | 3.61 ± 0.37 BCc | 4.44 ± 0.06 Aa | 4.23 ± 0.07 Aab | 3.76 ± 0.05 Bc | 4.45 ± 0.24 Aa | 3.67 ± 0.16 Ac | 3.95 ± 0.33 Abc | 3.87 ± 0.11 ABc | 2.97 ± 0.04 Bd |
| 0.05 mM | 3.99 ± 0.04 Aa | 3.54 ± 0.15 Cbcd | 3.71 ± 0.11 Bbc | 3.46 ± 0.13 Bd | 3.41 ± 0.08 Cd | 3.57 ± 0.06 ABbcd | 3.58 ± 0.1 Bbcd | 3.74 ± 0.17 Bb | 3.51 ± 0.12 Acd |
| 0.25 mM | 3.4 ± 0.05 Cb | 3.93 ± 0.22 Ba | 3.37 ± 0.11 Cb | 2.02 ± 0.08 Cd | 3.77 ± 0.04 Ba | 3.7 ± 0.31 Aa | 3.74 ± 0.04 ABa | 3.42 ± 0.01 Cb | 2.87 ± 0.03 Bc |
| Fructose (%) | |||||||||
| control | 4.42 ± 0.13 Ac | 4.88 ± 0.05 Aa | 3.92 ± 0.01 Bd | 4.36 ± 0.12 Ac | 2.8 ± 0.31 Cf | 3.97 ± 0.04 Bd | 4.82 ± 0.04 ABab | 4.61 ± 0.08 Bbc | 3.4 ± 0.22 Be |
| 0.01 mM | 3.69 ± 0.19 Bd | 4.85 ± 0.13 Aab | 5.24 ± 0.25 Aa | 4.35 ± 0.19 Ac | 4.77 ± 0.26 Ab | 4.18 ± 0.27 Bc | 5.03 ± 0.33 Aab | 4.8 ± 0.08 Ab | 3.75 ± 0.21 Ad |
| 0.05 mM | 4.39 ± 0.1 Aa | 4.01 ± 0.01 Bcd | 4.1 ± 0.18 Bcd | 4.09 ± 0.12 Bcd | 4.04 ± 0.17 Bcd | 4.21 ± 0.1 Babc | 4.15 ± 0.15 Cbcd | 4.37 ± 0.15 Cab | 3.95 ± 0.02 Ad |
| 0.25 mM | 3.82 ± 0.09 Bd | 4.8 ± 0.27 Aa | 3.87 ± 0.11 Bd | 2.31 ± 0.03 Ce | 4.56 ± 0.03 Ab | 4.84 ± 0.13 Aa | 4.63 ± 0.14 Bab | 4.28 ± 0.01 Cc | 3.73 ± 0.1 Ad |
| TSS (%) | |||||||||
| control | 13.3 ± 0.78 Bc | 14.07 ± 0.55 Aab | 14.37 ± 0.06 Ca | 14.57 ± 0.47 Aa | 14.23 ± 0.23 Aa | 13.93 ± 0.06 ABabc | 13.5 ± 0.17 Abc | 14.3 ± 0.1 Aa | 12.37 ± 0.06 Ad |
| 0.01 mM | 15.2 ± 0.62 Aa | 13.77 ± 0.8 Acd | 14.8 ± 0.2 Bab | 14.97 ± 0.21 Aab | 14.3 ± 0.1 Abc | 14.37 ± 0.32 Abc | 13.27 ± 0.42 Ad | 13.5 ± 0.2 Bd | 11.8 ± 0.1 Be |
| 0.05 mM | 14.67 ± 0.6 Ab | 12.97 ± 0.6 Ade | 15.33 ± 0.12 Aa | 14.73 ± 0.4 Aab | 13.9 ± 0.17 Bc | 13.63 ± 0.25 Bcd | 13.37 ± 0.4 Acd | 13.3 ± 0.1 Bcd | 12.47 ± 0.15 Ae |
| 0.25 mM | 14.3 ± 0.53 ABab | 13.77 ± 0.49 Ab | 14.63 ± 0.06 Ba | 13.87 ± 0.15 Bb | 13.77 ± 0.06 Bb | 13.83 ± 0.29 Bb | 12.57 ± 0.32 Bc | 12.33 ± 0.15 Cc | 11.17 ± 0.15 Cd |
| Malic acid (%) | |||||||||
| control | 2.69 ± 0.15 Db | 3.58 ± 0.13 Aa | 2.36 ± 0 Dc | 2.05 ± 0.03 Ad | 1.11 ± 0.01 Cg | 1.79 ± 0.02 Ae | 1.58 ± 0.01 Af | 1.07 ± 0.02 Bg | 0.73 ± 0 Dh |
| 0.01 mM | 3.46 ± 0.07 Ca | 2.81 ± 0.05 BCc | 3.07 ± 0.01 Ab | 1.99 ± 0.01 ABd | 1.54 ± 0.02 Ae | 1.47 ± 0.06 Bf | 1.6 ± 0.01 Ae | 1.06 ± 0.01 Bg | 0.97 ± 0.01 Ch |
| 0.05 mM | 5.06 ± 0.05 Aa | 2.68 ± 0.02 Cb | 2.42 ± 0.03 Cc | 1.93 ± 0.07 Bd | 1.29 ± 0.01 Bg | 1.71 ± 0.02 Ae | 1.61 ± 0 Af | 1.18 ± 0 Ah | 1.23 ± 0.01 Bh |
| 0.25 mM | 3.79 ± 0.16 Ba | 2.86 ± 0.03 Bb | 2.49 ± 0 Bc | 1.3 ± 0.03 Cf | 1.57 ± 0.02 Ae | 1.46 ± 0.18 Be | 1.31 ± 0.04 Bf | 1.01 ± 0.02 Cg | 1.64 ± 0.07 Ad |
| Citric acid (%) | |||||||||
| control | 0.09 ± 0 Bc | 0.14 ± 0 Ba | 0.09 ± 0 Bbc | 0.11 ± 0.01 Ab | 0.06 ± 0.01 Be | 0.08 ± 0.01 Bd | 0.1 ± 0 Ac | 0.08 ± 0.01 Ad | 0.06 ± 0 Ae |
| 0.01 mM | 0.09 ± 0.01 Bcde | 0.13 ± 0.01 Ba | 0.11 ± 0.01 Ab | 0.1 ± 0 Abc | 0.09 ± 0 Ade | 0.08 ± 0 Bef | 0.09 ± 0.01 ABcd | 0.07 ± 0.01 Af | 0.07 ± 0.01 Af |
| 0.05 mM | 0.13 ± 0.01 Aa | 0.1 ± 0.01 Cb | 0.08 ± 0 Cde | 0.09 ± 0.01 Bbcd | 0.08 ± 0 Acde | 0.09 ± 0 Abc | 0.09 ± 0.01 ABbcd | 0.07 ± 0.01 Aef | 0.06 ± 0.01 Af |
| 0.25 mM | 0.1 ± 0 Bb | 1.09 ± 0.01 Aa | 0.09 ± 0 Bbc | 0.05 ± 0 Cg | 0.09 ± 0 Ac | 0.08 ± 0 ABde | 0.09 ± 0 Bde | 0.08 ± 0 Ae | 0.07 ± 0 Af |
| Acidity (%) | |||||||||
| control | 1.03 ± 0.23 Abc | 0.74 ± 0.13 Ae | 1.27 ± 0.09 Aa | 1.16 ± 0.03 Aab | 1.01 ± 0.11 Abcd | 0.96 ± 0.06 Acd | 0.96 ± 0.06 Acd | 0.83 ± 0.01 Bde | 0.94 ± 0.01 Bcd |
| 0.01 mM | 1.11 ± 0.25 Aab | 1.06 ± 0.27 Aabc | 1.18 ± 0.04 Aa | 1.13 ± 0.03 Aab | 0.92 ± 0.03 Abc | 1.03 ± 0.1 Aabc | 0.93 ± 0.05 Aabc | 0.82 ± 0.01 Bc | 0.99 ± 0.02 Aabc |
| 0.05 mM | 1.11 ± 0.13 Aabc | 0.98 ± 0.18 Acd | 1.2 ± 0.04 Aa | 1.17 ± 0.08 Aab | 0.94 ± 0.02 Acd | 1.04 ± 0.04 Aabcd | 1 ± 0.15 Abcd | 0.87 ± 0.01 Ad | 0.95 ± 0.01 Bcd |
| 0.25 mM | 1.12 ± 0.25 Aab | 0.86 ± 0.05 Acd | 1.23 ± 0.11 Aa | 1.03 ± 0.03 Bbc | 0.94 ± 0.03 Abc | 0.94 ± 0.07 Abc | 0.85 ± 0.05 Acd | 0.73 ± 0.02 Cd | 0.9 ± 0.01 Ccd |
| pH | |||||||||
| control | 3.68 ± 0.25 Aa | 3.3 ± 0.02 Ad | 3.3 ± 0.02 Ad | 3.42 ± 0.03 Acd | 3.05 ± 0.03 Ae | 3.7 ± 0.01 Ca | 3.4 ± 0.01 Bcd | 3.6 ± 0.01 Aab | 3.52 ± 0.01 Abc |
| 0.01 mM | 3.31 ± 0.09 Bde | 3.25 ± 0.09 Ae | 3.33 ± 0.05 Ade | 3.44 ± 0.04 Ac | 3.06 ± 0.01 Af | 3.76 ± 0.01 Aa | 3.39 ± 0.01 Bcd | 3.57 ± 0.01 Bb | 3.31 ± 0.01 Cde |
| 0.05 mM | 3.3 ± 0.02 Be | 3.35 ± 0.03 Acde | 3.34 ± 0.03 Ade | 3.42 ± 0.16 Acd | 3.07 ± 0.03 Af | 3.72 ± 0.01 Ba | 3.44 ± 0.01 Acd | 3.58 ± 0.02 Bb | 3.45 ± 0.01 Bc |
| 0.25 mM | 3.25 ± 0.08 Bd | 3.33 ± 0.05 Ac | 3.27 ± 0.04 Acd | 3.34 ± 0.02 Ac | 3.05 ± 0.02 Ae | 3.75 ± 0.01 Aa | 3.44 ± 0.01 Ab | 3.48 ± 0.01 Cb | 3.31 ± 0.03 Ccd |
| TPC (g GAE·kg−1) | |||||||||
| control | 36.35 ± 2.18 Bf | 39.43 ± 0.46 BCcd | 42.59 ± 0.47 Ba | 38.77 ± 0.79 Bde | 40.75 ± 0.83 Bbc | 37.87 ± 0.44 Bef | 40.86 ± 1.18 Ab | 38.88 ± 0.41 Ade | 38.59 ± 0.68 Ade |
| 0.01 mM | 40.88 ± 1.06 Aa | 41.16 ± 0.8 Aa | 41.04 ± 0.7 Ca | 36 ± 0.28 Bc | 38.26 ± 0.53 Cb | 31.7 ± 0.15 De | 29.33 ± 0.94 Cf | 32.86 ± 1.15 Bd | 28.9 ± 2.02 Cf |
| 0.05 mM | 39.49 ± 1.01 Ab | 40.6 ± 0.99 Abb | 47.83 ± 0.6 Aa | 45.9 ± 3.79 Aa | 49.51 ± 1.67 Aa | 39.74 ± 1.13 Ab | 31.75 ± 1.33 Bc | 31.9 ± 1.52 BCc | 33.82 ± 1.44 Bc |
| 0.25 mM | 38.86 ± 0.96 Ab | 38.41 ± 1.32 Cb | 38.61 ± 0.84 Db | 45.14 ± 1.18 Aa | 35.56 ± 0.46 Dc | 35.55 ± 0.52 Cc | 23.84 ± 0.28 De | 30.38 ± 0.19 Cd | 22.93 ± 1.34 De |
| TAC (g C3 GE·kg−1) | |||||||||
| control | 10.04 ± 0.2 Dd | 13.97 ± 0.77 Ab | 18.1 ± 0.09 Ba | 14.5 ± 0.22 Ab | 9.91 ± 0.02 Dd | 12.76 ± 0.06 Bc | 10.12 ± 0.25 Bd | 8.72 ± 0.23 Ae | 9.06 ± 0.15 Ae |
| 0.01 mM | 14.38 ± 0.37 Aa | 13.02 ± 0.68 Abb | 15.43 ± 0.31 Ca | 11.94 ± 0.69 Cb | 12.08 ± 0 Bb | 7.17 ± 0.26 Dd | 9.5 ± 0.36 Cc | 6.94 ± 1.28 Bd | 2.81 ± 0.08 Ce |
| 0.05 mM | 12.12 ± 0.07 Cd | 12.66 ± 0.15 Bc | 18.79 ± 0.4 Aa | 13.39 ± 0.17 Bb | 13.14 ± 0.06 Ab | 13.34 ± 0.04 Ab | 10.6 ± 0.23 Ae | 6.79 ± 0.18 Bf | 3.91 ± 0.11 Bg |
| 0.25 mM | 13.44 ± 0.37 Ba | 13.52 ± 0.23 Aba | 13.48 ± 0.45 Da | 10.23 ± 0.39 Dc | 11.3 ± 1.27 Cb | 11.74 ± 0.22 Cb | 4.48 ± 0.1 De | 6.86 ± 0.37 Bd | 0.97 ± 0.05 Df |
| TFC (g CE·kg−1) | |||||||||
| control | 86.73 ± 2.91 Bb | 88.64 ± 0.9 Bb | 99.61 ± 1.14 Ba | 99.78 ± 3.48 Ca | 64.24 ± 5.4 Cd | 79.81 ± 2.34 Bc | 78 ± 3.38 Ac | 60.22 ± 1.76 Ad | 52.82 ± 3.48 Ae |
| 0.01 mM | 97.5 ± 8.87 Ac | 99.11 ± 2.68 Ac | 119.9 ± 5.35 Aa | 109.4 ± 7.45 Bb | 84.42 ± 3.76 Ad | 63.67 ± 1.2 De | 56.48 ± 1.29 Cef | 49.16 ± 1.96 Bf | 28.27 ± 0.2 Bg |
| 0.05 mM | 94.64 ± 6.01 Abc | 83.19 ± 2.27 Cd | 100.92 ± 5.28 Bc | 139.21 ± 2.34 Aa | 73.56 ± 1.53 Be | 123.45 ± 1.82 Ab | 63.87 ± 1.34 Bf | 56.28 ± 3.64 Ag | 30.91 ± 3.04 Bh |
| 0.25 mM | 93.52 ± 8.07 Aba | 80.45 ± 1.05 Cb | 95.06 ± 4.38 Ba | 95.7 ± 4.94 Ca | 71.51 ± 5.17 Bc | 72.45 ± 2.85 Cc | 44.97 ± 3.17 Dd | 48.71 ± 7.79 Bd | 32.2 ± 4.36 Be |
| DPPH (g TE·kg−1) | |||||||||
| control | 138.09 ± 4.11 Bd | 117.55 ± 6.86 Be | 162.06 ± 1.36 Cc | 93.87 ± 8.5 Cf | 113.63 ± 5.47 De | 72.04 ± 5.61 Dg | 152.13 ± 10.82 Ccd | 203.34 ± 5.9 Bb | 292.2 ± 1.14 Ca |
| 0.01 mM | 166.21 ± 9.46 Ade | 126.47 ± 13.52 Bf | 188.69 ± 10.38 Bc | 153.95 ± 5.49 Bde | 140.26 ± 4.33 Cef | 230.58 ± 9.69 Ab | 240.31 ± 4.25 Ab | 199.3 ± 15.47 Bc | 335.46 ± 8.91 Aa |
| 0.05 mM | 103.45 ± 1.44 Ch | 129.22 ± 9.72 Bg | 179.1 ± 8.96 Bf | 246.02 ± 8.1 Ac | 196.17 ± 1.08 Ae | 217.14 ± 1.48 Bd | 244.41 ± 3.02 Ac | 286.03 ± 20.45 Ab | 311.18 ± 1.03 Ba |
| 0.25 mM | 133.62 ± 2.67 Bf | 189.1 ± 5.64 Acd | 201.3 ± 10.02 Ac | 170.97 ± 17.65 Be | 180.9 ± 5.84 Bde | 197.01 ± 6.56 Cc | 232.54 ± 4.05 Bb | 200.72 ± 13.29 Bc | 315.01 ± 3.35 Ba |
| ABTS (g TE·kg−1) | |||||||||
| control | 10.15 ± 0.05 Cf | 8.7 ± 0.02 Dg | 10.74 ± 0.04 Be | 10.19 ± 0.03 Df | 12.03 ± 0.02 Ab | 11.08 ± 0.01 Bd | 10.78 ± 0.03 Ce | 11.43 ± 0.04 Dc | 14 ± 0.06 Ba |
| 0.01 mM | 10.09 ± 0.06 Ce | 9.29 ± 0.17 Cf | 9.23 ± 0.04 Df | 11 ± 0.07 Cd | 10.94 ± 0.16 Cd | 11.93 ± 0.07 Ac | 11.83 ± 0.03 Bc | 12.48 ± 0.03 Cb | 14.06 ± 0.04 Bb |
| 0.05 mM | 10.9 ± 0.04 Af | 11.37 ± 0.08 Ae | 9.63 ± 0.01 Cg | 12.5 ± 0.04 Bb | 11.92 ± 0.09 Ad | 10.94 ± 0.05 Cf | 12.31 ± 0.01 Ac | 12.97 ± 0.08 Ba | 12.44 ± 0.08 Cb |
| 0.25 mM | 10.77 ± 0.03 Bg | 9.97 ± 0.15 Bh | 10.98 ± 0.13 Af | 19.55 ± 0.03 Aa | 11.67 ± 0.34 Be | 11.16 ± 0.11 Bf | 12.33 ± 0.01 Ad | 14.26 ± 0.08 Ac | 15.78 ± 0.05 Ab |
| FRAP (g FeSO4.7 H2O·kg−1) | |||||||||
| control | 241.69 ± 2.56 Ca | 136.33 ± 3.06 Dg | 163.66 ± 1.39 Cc | 157.47 ± 4.47 Cde | 161.49 ± 6.45 Ccd | 175.81 ± 2.73 Bb | 151.13 ± 4.24 Def | 147.81 ± 9.65 Cf | 165.16 ± 2.85 Bc |
| 0.01 mM | 244.74 ± 13.47 Cc | 295.1 ± 15.29 Aab | 284.3 ± 7.19 Aab | 284.03 ± 8.19 Aab | 302.28 ± 6.61 Ba | 192.83 ± 16.94 Bd | 255.09 ± 6.05 Bc | 251.9 ± 1.25 Ac | 187.92 ± 2.49 Ad |
| 0.05 mM | 296.93 ± 1.45 Aab | 250.17 ± 21.3 Bde | 269 ± 12.37 Bcd | 294.91 ± 17.92 Aab | 315.36 ± 8.95 Aa | 276.25 ± 21.42 Abc | 287.77 ± 7.99 Abc | 227.06 ± 12.29 Be | 89.92 ± 8.01 Df |
| 0.25 mM | 276.74 ± 8.62 Bc | 213.62 ± 13.07 Cd | 264.32 ± 6.68 Bc | 209.35 ± 2.33 Bd | 311.95 ± 8.15 Aa | 294.02 ± 3.08 Ab | 195.75 ± 7.23 Ce | 217.99 ± 4.5 Bd | 121.32 ± 12.53 Cf |
| MDA (mmol·kg−1) | |||||||||
| control | 125.77 ± 9.99 Cd | 256.4 ± 20.64 Ab | 339.11 ± 4.07 Aa | 128.67 ± 14.54 Ad | 71.75 ± 11.56 Be | 166.12 ± 5.04 Ac | 115.37 ± 16.83 Bd | 82.7 ± 4.83 Ae | 42.65 ± 1.27 Af |
| 0.01 mM | 280 ± 39.84 Aa | 194.64 ± 3.95 Bb | 262.92 ± 2.75 Ba | 114.74 ± 3.09 ABc | 120.67 ± 39.75 ABc | 78.96 ± 12.19 Bd | 120.21 ± 4.79 Bc | 50.46 ± 2.85 Bd | 6.06 ± 0.58 Ce |
| 0.05 mM | 202.65 ± 6.62 Bb | 175.02 ± 6.95 Bc | 236.5 ± 17.22 Ca | 109.12 ± 4.78 Be | 132.83 ± 24.97 Ade | 170.14 ± 30.57 Ac | 138.88 ± 2.01 Ad | 35.99 ± 0.84 Cf | 22.53 ± 1.23 Bf |
| 0.25 mM | 136.41 ± 9.77 Cab | 137.68 ± 8.7 Cab | 157.57 ± 17.18 Da | 68.18 ± 1.47 Cc | 117.66 ± 28.9 ABb | 111.94 ± 36.11 Bb | 57.28 ± 1.83 Ccd | 35.61 ± 1.19 Cd | 1.18 ± 0.09 De |
| Bioactive Components | 0 Day | 63 Day | |||
|---|---|---|---|---|---|
| Control | Control | 0.01 mM | 0.05 mM | 0.25 mM | |
| Anthocyanins | |||||
| Cyanidin-3,5-diglucoside | 0.04 ± 0 | 0.03 ± 0.01 | 0.04 ± 0 | 0.04 ± 0 | 0.03 ± 0 |
| Peonidin-3,5-diglucoside | 51.7 ± 0.16 | 51.78 ± 0.95 | 51.88 ± 0.64 | 52 ± 0.32 | 51.81 ± 0.5 |
| Cyanidin-3-glucoside | 400.74 ± 0.45 | 345.02 ± 1.3 | 67.4 ± 0.29 | 79.83 ± 0.79 | 54.13 ± 1.24 |
| Cyanidin-3-rutinoside | 51.52 ± 0.11 | 51.35 ± 0.38 | 51.8 ± 0.29 | ND | 51.81 ± 1.15 |
| Pelargonidin-3-glucoside | 51.43 ± 0.13 | 51.68 ± 0.64 | 51.21 ± 0.29 | 51.37 ± 1.17 | 50.7 ± 0.51 |
| Peonidin-3-glucoside | 58.68 ± 0.26 | 52.16 ± 1.1 | 52 ± 0.7 | 51.51 ± 0.63 | 52.11 ± 1.68 |
| Peonidin-3-rutinoside | 51.57 ± 0.1 | 50.75 ± 0.84 | 51.6 ± 0.37 | 52.4 ± 2.44 | 51.83 ± 0.69 |
| Cyanidin-3-xyloside | 51.54 ± 0.31 | 51.82 ± 0.46 | ND | ND | ND |
| Peonidin-3-glucoside pyruvic derivative | 51.5 ± 0.22 | ND | ND | ND | ND |
| Delphinidin-3-glucoside | 51.4 ± 0.54 | 51.53 ± 0.37 | 51.48 ± 0.18 | ND | 51.61 ± 1.85 |
| Delphinidin-3-sambubioside | 51.55 ± 0.13 | 51.51 ± 0.2 | 51.15 ± 0.1 | ND | 51.26 ± 1.78 |
| Delphinidin-3-rutinoside | 57.13 ± 0.89 | 51.87 ± 0.06 | 50.1 ± 0.61 | 51.48 ± 0.13 | 51.4 ± 0.28 |
| Phenolic acids | |||||
| Gallic acid | 6.66 ± 1.58 | 3.93 ± 0.07 | ND | ND | ND |
| Ellagic acid acetyl-xyloside | 5.14 ± 0.35 | 4.01 ± 0.25 | 7.11 ± 0.26 | 4.12 ± 0.11 | 3.37 ± 1.32 |
| Quinic acid | 13.57 ± 0.14 | 8.49 ± 0.12 | 9.04 ± 1.07 | 8.15 ± 0.27 | 4.59 ± 0.83 |
| p-Coumaric acid ethyl ester | 37.93 ± 1.1 | 24.75 ± 0.06 | 22.93 ± 2.15 | 19.25 ± 1.03 | 8.43 ± 0.04 |
| p-Coumaroylquinic acid | 4.79 ± 0.12 | ND | 2.32 ± 0.94 | 3.14 ± 1.26 | ND |
| Caffeoyl glucose | 1.45 ± 0.28 | ND | ND | 0.53 ± 0.01 | ND |
| 5-O-Caffeoylquinic acid | 1.61 ± 0.35 | 0.98 ± 0 | 4 ± 0.25 | 4.36 ± 0.93 | ND |
| Neochlorogenic acid | 0.46 ± 0.04 | 26.85 ± 0.19 | ND | 1.31 ± 0.08 | ND |
| Chlorogenic acid | 65.84 ± 0.26 | 108.01 ± 0.41 | ND | ND | ND |
| 3-O-Caffeoylquinic acid | ND | ND | 0.7 ± 0.26 | 1.11 ± 0.5 | ND |
| 3-Feruloylquinic acid | 25.62 ± 0.42 | 26.69 ± 0.36 | 6 ± 0.89 | 3.62 ± 0.76 | 4 ± 0.61 |
| Trihydroxycinnamoylquinic acid (isomer) | 5.6 ± 0.27 | 3.6 ± 0 | 0.97 ± 0 | 0.87 ± 0.04 | ND |
| Dicaffeoylquinic acid | 2.98 ± 0.22 | 3.51 ± 0.03 | 2.83 ± 0.67 | 6.59 ± 0.63 | ND |
| Dihydrocaffeic acid | 1.17 ± 0.23 | 1.92 ± 0.05 | 0.99 ± 0 | 0.75 ± 0.49 | ND |
| Flavonoids | |||||
| Phloretin 2′-O-xylosyl-glucoside | 47.51 ± 0.16 | 40.18 ± 0.3 | ND | 28.01 ± 0.16 | ND |
| Flavanols | |||||
| (+)-Catechin | 0.7 ± 0.01 | 4.07 ± 0.26 | ND | 4.33 ± 0.47 | ND |
| (-)-Gallocatechin | 6.91 ± 0.32 | 2.96 ± 0.54 | ND | ND | ND |
| Flavanones | |||||
| Eriodictyol 7-O-glucoside | 29.39 ± 1.07 | 225.82 ± 0.44 | 10.32 ± 1.4 | 16.7 ± 0.61 | 29.47 ± 0.14 |
| Flavones | |||||
| Luteolin 7-O-glucoside | ND | ND | ND | 24.2 ± 2.11 | ND |
| Luteolin 7-O-rutinoside | 0.01 ± 0 | 11.42 ± 0.27 | ND | 8.09 ± 1.92 | ND |
| Luteolin-O-hexose-O-deoxyhexoside | 21.09 ± 0.45 | 22.62 ± 0.55 | ND | ND | ND |
| Flavonols | |||||
| Quercetin-3-O-galactoside | 40.79 ± 0.51 | 6.18 ± 0.46 | 1.4 ± 0 | 33.09 ± 0.64 | ND |
| Myricetin 3-O-rhamnoside | 36.5 ± 0.06 | ND | ND | ND | ND |
| Quercetin 3-O-glucoside | 40.16 ± 1.49 | ND | ND | ND | ND |
| Quercetin- acetyl -hexoside | 38.9 ± 0.56 | 96.84 ± 1.63 | 9.1 ± 0.11 | ND | ND |
| Kaempferol 3-O-galactoside 7-O-rhamnoside | 320.48 ± 1.9 | 55.45 ± 0.36 | 26.49 ± 0.49 | 17.27 ± 0.52 | ND |
| Kaempferol 3-O-rutinoside | 372.61 ± 0.80 | 310.64 ± 0.26 | ND | 1.77 ± 0.89 | ND |
| Quercetin O-vicianoside | 62.91 ± 1.09 | 26.97 ± 0.2 | 1.14 ± 0.26 | 30.3 ± 1.96 | ND |
| Quercetin-3-hexoside-pentoside | 157.12 ± 0.39 | 88.76 ± 0.39 | ND | ND | ND |
| Quercetin-3-O-rhamnosiy-galactoside | 322.97 ± 0.63 | 13.15 ± 0.09 | 9.18 ± 0.09 | 41.44 ± 0.53 | 17.83 ± 0.65 |
| Quercetin 3-O-rutinoside | 5.38 ± 0.42 | 59.16 ± 0.17 | 30.58 ± 0.26 | 35.06 ± 2.23 | 24.33 ± 0.64 |
| Kaempferol 3,7-O-diglucoside | 119.41 ± 0.79 | 172.68 ± 0.42 | ND | 95.08 ± 0.09 | ND |
| Isorhamnetin-3-O-rutinoside | 10.75 ± 0.53 | 11.28 ± 0.94 | ND | ND | ND |
| Quercetin 3-O-sophoroside | 0.01 ± 0 | 2.91 ± 0.04 | ND | ND | ND |
| Quercetin 7,4′-O-diglucoside | 9.86 ± 0.51 | ND | ND | ND | ND |
| Quercetin 3,4′-O-dihexoside | 66.52 ± 0.28 | ND | ND | ND | ND |
| Myricetin-3-O-rutinoside | 62.12 ± 0.49 | ND | ND | ND | ND |
| Isoflavonoids | |||||
| Genistin | ND | 100.62 ± 0.65 | ND | ND | ND |
| Other polyphenols | |||||
| p-Anisaldehyde | 3.23 ± 0.48 | 3.59 ± 0.77 | 0.6 ± 0.04 | 1.37 ± 0.07 | ND |
| Hydroxytyrosol | 1.37 ± 0.01 | 4.06 ± 0.61 | 2.01 ± 0.12 | 6.17 ± 1.48 | 3.5 ± 0.85 |
| 5-Nonadecylresorcinol | ND | ND | 2.62 ± 0.05 | 1.62 ± 0.33 | 4.79 ± 0.07 |
| 5-Heneicosylresorcinol | 7.87 ± 0.62 | 2.73 ± 0.51 | 3.27 ± 0.66 | ND | 2.27 ± 0.55 |
| l | a | b | Chroma (C) | HUE | ΔE | Weight Loss | Firmness | Sucrose | Maltose | Glucose | Fructose | Total Sugar | TSS | Malic Acid | Citric Acid | Total Acid | Acidity | pH | TPC | TAC | TFC | DPPH | ABTS | FRAP | MDA | |
|---|---|---|---|---|---|---|---|---|---|---|---|---|---|---|---|---|---|---|---|---|---|---|---|---|---|---|
| l | * | * | * | * | * | * | * | * | * | |||||||||||||||||
| a | −0.43 | * | * | * | * | * | * | * | * | * | * | * | * | * | ||||||||||||
| b | −0.66 | 0.8 | * | * | * | * | * | * | * | * | * | * | * | * | ||||||||||||
| Chroma(C) | 0.69 | −0.72 | −0.99 | * | * | * | * | * | * | * | * | * | ||||||||||||||
| Hue | 0.26 | −0.75 | −0.54 | 0.51 | * | * | * | |||||||||||||||||||
| ΔE | 0.97 | −0.38 | −0.65 | 0.68 | 0.22 | * | * | * | * | * | ||||||||||||||||
| Weight loss | 0.2 | 0.26 | 0.21 | −0.18 | −0.17 | 0.21 | * | * | * | * | * | * | * | * | * | * | * | * | * | * | ||||||
| Firmness | 0.12 | −0.23 | −0.15 | 0.12 | 0.33 | 0.13 | −0.071 | * | * | * | * | |||||||||||||||
| Sucrose | −0.091 | 0.087 | 0.056 | −0.06 | −0.024 | −0.1 | −0.099 | 0.011 | * | * | * | * | * | * | * | * | * | |||||||||
| Maltose | 0.25 | −0.12 | −0.081 | 0.071 | 0.017 | 0.25 | 0.42 | −0.18 | 0.05 | * | * | * | * | * | * | * | * | * | ||||||||
| Glucose | 0.061 | −0.14 | −0.15 | 0.13 | 0.032 | 0.013 | −0.21 | 0.22 | 0.34 | 0.05 | * | * | * | * | * | * | * | * | * | * | * | |||||
| Fructose | 0.12 | −0.14 | −0.19 | 0.18 | 0.09 | 0.076 | −0.038 | 0.29 | 0.37 | 0.092 | 0.85 | * | * | * | * | * | * | * | * | * | ||||||
| Total sugar | 0.094 | −0.13 | −0.15 | 0.13 | 0.054 | 0.047 | −0.081 | 0.21 | 0.56 | 0.2 | 0.92 | 0.94 | * | * | * | * | * | * | ||||||||
| TSS | −0.065 | −0.27 | −0.28 | 0.24 | −0.053 | −0.058 | −0.65 | −0.074 | −0.017 | −0.014 | 0.29 | 0.1 | 0.17 | * | * | * | * | * | * | * | * | * | * | |||
| Malic acid | −0.31 | −0.12 | −0.028 | −0.0069 | 0.12 | −0.33 | −0.75 | 0.16 | 0.26 | −0.4 | 0.37 | 0.19 | 0.26 | 0.46 | * | * | * | * | * | * | * | * | * | * | * | |
| Citric acid | −0.15 | 0.031 | 0.1 | −0.12 | 0.086 | −0.19 | −0.23 | 0.082 | 0.23 | −0.25 | 0.19 | 0.22 | 0.21 | 0.042 | 0.24 | * | * | |||||||||
| Total acid | −0.32 | −0.11 | −0.0094 | −0.027 | 0.12 | −0.34 | −0.74 | 0.17 | 0.28 | −0.42 | 0.38 | 0.22 | 0.28 | 0.44 | 0.99 | 0.4 | * | * | * | * | * | * | * | * | * | |
| Acidity | −0.15 | 0.015 | −0.0029 | 0.0062 | −0.15 | −0.17 | −0.41 | −0.21 | 0.035 | −0.15 | −0.05 | −0.19 | −0.12 | 0.5 | 0.34 | −0.13 | 0.3 | * | * | * | * | * | * | |||
| pH | −0.046 | 0.074 | 0.041 | −0.051 | −0.12 | −0.054 | 0.22 | −0.05 | −0.22 | 0.23 | 0.043 | 0.15 | 0.066 | −0.13 | −0.22 | −0.077 | −0.22 | −0.13 | * | * | * | |||||
| TPC | −0.031 | −0.31 | −0.29 | 0.27 | 0.086 | −0.028 | −0.61 | −0.1 | −0.056 | −0.29 | −0.033 | −0.19 | −0.15 | 0.63 | 0.31 | 0.051 | 0.3 | 0.38 | −0.27 | * | * | * | * | * | * | |
| TAC | −0.076 | −0.35 | −0.35 | 0.31 | 0.018 | −0.079 | −0.77 | −0.0074 | 0.11 | −0.29 | 0.25 | 0.11 | 0.15 | 0.75 | 0.54 | 0.17 | 0.54 | 0.48 | −0.21 | 0.78 | * | * | * | * | * | |
| TFC | −0.037 | −0.37 | −0.37 | 0.34 | 0.14 | −0.025 | −0.68 | −0.037 | 0.087 | −0.21 | 0.22 | 0.061 | 0.12 | 0.72 | 0.54 | 0.07 | 0.53 | 0.55 | −0.085 | 0.69 | 0.82 | * | * | * | * | |
| DPPH | 0.045 | 0.36 | 0.3 | −0.24 | −0.27 | 0.064 | 0.81 | −0.15 | −0.18 | 0.14 | −0.24 | −0.094 | −0.17 | −0.58 | −0.53 | −0.064 | −0.51 | −0.18 | 0.18 | −0.49 | −0.64 | −0.54 | * | * | * | |
| ABTS | −0.018 | 0.21 | 0.32 | −0.31 | −0.011 | 0.022 | 0.6 | −0.1 | −0.27 | 0.18 | −0.71 | −0.62 | −0.64 | −0.51 | −0.55 | −0.23 | −0.56 | −0.21 | 0.042 | −0.28 | −0.6 | −0.43 | 0.49 | * | * | |
| FRAP | −0.16 | −0.081 | 0.041 | −0.063 | −0.074 | −0.17 | −0.18 | −0.16 | 0.21 | 0.15 | 0.36 | 0.26 | 0.34 | 0.39 | 0.28 | −0.0044 | 0.26 | 0.24 | −0.19 | 0.28 | 0.42 | 0.48 | −0.2 | −0.23 | * | |
| MDA | −0.12 | −0.26 | −0.25 | 0.23 | 2.4 × 10⁻⁴ | −0.13 | −0.75 | 0.094 | 0.098 | −0.37 | 0.36 | 0.21 | 0.23 | 0.62 | 0.69 | 0.092 | 0.67 | 0.42 | −0.2 | 0.55 | 0.85 | 0.68 | −0.56 | −0.66 | 0.28 |
References
- Guo, L.; Qiao, J.; Zhang, L.; Yan, W.; Zhang, M.; Lu, Y.; Huo, J. Critical review on anthocyanins in blue honeysuckle (Lonicera caerulea L.) and their function. Plant Physiol. Bioch. 2023, 204, 108090. [Google Scholar] [CrossRef]
- Zhang, M.; Ma, X.; Xiao, Z.; Sun, A.; Zhao, M.; Wang, Y.; Zhang, Y. Polyphenols in twenty cultivars of blue honeysuckle (Lonicera caerulea L.): Profiling, antioxidant capacity, and α-amylase inhibitory activity. Food Chem. 2023, 421, 136148. [Google Scholar] [CrossRef]
- Ze, Y.; Gao, H.; Li, T.; Yang, B.; Jiang, Y. Insights into the roles of melatonin in maintaining quality and extending shelf life of postharvest fruits. Trends Food Sci. Technol. 2021, 109, 569–578. [Google Scholar] [CrossRef]
- Qiao, J.; Guo, L.; Huo, J.; Huang, D.; Zhang, Y. Controlled atmosphere effects on postharvest quality and antioxidant capacity of blue honeysuckle (Lonicera caerulea L.). Food Innov. Adv. 2024, 3, 155–166. [Google Scholar] [CrossRef]
- Qiao, J.; Li, D.; Guo, L.; Hong, X.; He, S.; Huo, J.; Zhang, Y. Enhancing Postharvest Quality and Antioxidant Capacity of Blue Honeysuckle cv. ‘Lanjingling’ with Chitosan and Aloe vera Gel Edible Coatings during Storage. Foods 2024, 13, 630. [Google Scholar] [CrossRef]
- Dziedzic, E.; Błaszczyk, J.; Bieniasz, M.; Dziadek, K.; Kopeć, A. Effect of modified (MAP) and controlled atmosphere (CA) storage on the quality and bioactive compounds of blue honeysuckle fruits (Lonicera caerulea L.). Sci. Hortic-Amsterdam 2020, 265, 109226. [Google Scholar] [CrossRef]
- Li, P.; Zhang, R.; Zhou, H.; Mo, Y.; Wu, S.; Zhang, X.; Deng, M. Melatonin delays softening of postharvest pepper fruits (Capsicum annuum L.) by regulating cell wall degradation, membrane stability and antioxidant systems. Postharvest Bio. Tec. 2024, 212, 112852. [Google Scholar] [CrossRef]
- Luo, Z.; Zhang, J.; Xiang, M.; Zeng, J.; Chen, J.; Chen, M. Exogenous melatonin treatment affects ascorbic acid metabolism in postharvest ‘Jinyan’kiwifruit. Front. Nutr. 2022, 9, 1081476. [Google Scholar] [CrossRef]
- Arnao, M.B.; Hernández-Ruiz, J. Melatonin: A new plant hormone and/or a plant master regulator? Trends Plant Sci. 2019, 24, 38–48. [Google Scholar] [CrossRef] [PubMed]
- Liu, C.; Zheng, H.; Sheng, K.; Liu, W.; Zheng, L. Effects of melatonin treatment on the postharvest quality of strawberry fruit. Postharvest Biol. Tec. 2018, 139, 47–55. [Google Scholar] [CrossRef]
- Wang, S.Y.; Shi, X.C.; Wang, R.; Wang, H.L.; Liu, F.; Laborda, P. Melatonin in fruit production and postharvest preservation: A review. Food Chem. 2020, 320, 126642. [Google Scholar] [CrossRef]
- Yan, Y.; Pico, J.; Gerbrandt, E.M.; Dossett, M.; Castellarin, S.D. Comprehensive anthocyanin and flavonol profiling and fruit surface color of 20 blueberry genotypes during postharvest storage. Postharvest Biol. Tec. 2023, 199, 112274. [Google Scholar] [CrossRef]
- Qian, W.L.; Khan, Z.; Watson, D.G.; Fearnley, J. Analysis of sugars in bee pollen and propolis by ligand exchange chromatography in combination with pulsed amperometric detection and mass spectrometry. J. Food Compos. Anal. 2008, 21, 78–83. [Google Scholar] [CrossRef]
- Wang, R.; Sun, J.; Lassabliere, B.; Yu, B.; Liu, S.Q. Green tea fermentation with Saccharomyces boulardii CNCM I-745 and Lactiplantibacillus plantarum 299V. LWT-Food Sci. Technol. 2022, 157, 113081. [Google Scholar] [CrossRef]
- Singleton, V.L.; Orthofer, R.; Lamuela-Raventós, R.M. Analysis of total phenols and other oxidation substrates and antioxidants by means of folin-ciocalteu reagent. In Methods in Enzymology; Academic Press: Cambridge, MA, USA, 1999; Volume 299, pp. 152–178. [Google Scholar] [CrossRef]
- Giusti, M.M.; Wrolstad, R.E. Characterization and measurement of anthocyanins by UV-visible spectroscopy. Curr. Protoc. Food Anal. Chem. 2001, 1, F1–F2. [Google Scholar] [CrossRef]
- Chang, C.C.; Yang, M.H.; Wen, H.M.; Chern, J.C. Estimation of total flavonoid content in propolis by two complementary colorimetric methods. J. Food Drug Anal. 2002, 10, 178–182. [Google Scholar]
- Brand-Williams, W.; Cuvelier, M.-E.; Berset, C. Use of a free radical method to evaluate antioxidant activity. LWT-Food Sci. Technol. 1995, 28, 25–30. [Google Scholar] [CrossRef]
- Re, R.; Pellegrini, N.; Proteggente, A.; Pannala, A.; Yang, M.; Rice-Evans, C. Antioxidant activity applying an improved ABTS radical cation decolorization assay. Free. Radic. Bio. Med. 1999, 26, 1231–1237. [Google Scholar] [CrossRef]
- Benzie, I.F.; Strain, J.J. The ferric reducing ability of plasma (FRAP) as a measure of “antioxidant power”: The FRAP assay. Anal. Biochem. 1996, 239, 70–76. [Google Scholar] [CrossRef]
- Li, H. Principles and Techniques of Plant Physiological Biochemical Experiment; Higher Education Press: Beijing, China, 2000; pp. 195–197. [Google Scholar]
- Wu, C.; Hao, W.; Yan, L.; Zhang, H.; Zhang, J.; Liu, C.; Zheng, L. Postharvest melatonin treatment enhanced antioxidant activity and promoted GABA biosynthesis in yellow-flesh peach. Food Chem. 2023, 419, 136088. [Google Scholar] [CrossRef]
- Gidado, M.J.; Gunny, A.A.N.; Gopinath, S.C.; Ali, A.; Wongs-Aree, C.; Salleh, N.H.M. Challenges of postharvest water loss in fruits: Mechanisms, influencing factors, and effective control strategies—A comprehensive review. J. Agric. Food Res. 2024, 17, 101249. [Google Scholar] [CrossRef]
- Zhang, Y.; Lin, B.; Tang, G.; Chen, Y.; Deng, M.; Lin, Y.; Tang, H. Application of γ-aminobutyric acid improves the postharvest marketability of strawberry by maintaining fruit quality and enhancing antioxidant system. Food Chem. X 2024, 21, 101252. [Google Scholar] [CrossRef] [PubMed]
- Li, J.; Wang, Y.; Li, J.; Li, Y.; Lu, C.; Hou, Z.; Wu, L. Exogenous Melatonin Application Delays Senescence and Improves Postharvest Antioxidant Capacity in Blueberries. Agronomy 2025, 15, 428. [Google Scholar] [CrossRef]
- Dou, J.; Wang, J.; Tang, Z.; Yu, J.; Wu, Y.; Liu, Z.; Tian, Q. Application of exogenous melatonin improves tomato fruit quality by promoting the accumulation of primary and secondary metabolites. Foods 2022, 11, 4097. [Google Scholar] [CrossRef] [PubMed]
- Li, Z.; Zhang, S.; Xue, J.; Mu, B.; Song, H.; Liu, Y. Exogenous melatonin treatment induces disease resistance against Botrytis cinerea on post-harvest grapes by activating defence responses. Foods 2022, 11, 2231. [Google Scholar] [CrossRef]
- Guo, L.; Qiao, J.; Mikhailovich, M.S.; Wang, L.; Chen, Y.; Ji, X.; Huo, J. Comprehensive structural analysis of anthocyanins in blue honeysuckle (Lonicera caerulea L.), bilberry (Vaccinium uliginosum L.), cranberry (Vaccinium macrocarpon Ait.), and antioxidant capacity comparison. Food Chem. X 2024, 23, 101734. [Google Scholar] [CrossRef]
- Kiselova-Kaneva, Y.; Galunska, B.; Nikolova, M.; Dincheva, I.; Badjakov, I. High resolution LC-MS/MS characterization of polyphenolic composition and evaluation of antioxidant activity of Sambucus ebulus fruit tea traditionally used in Bulgaria as a functional food. Food Chem. 2022, 367, 130759. [Google Scholar] [CrossRef]
- Rodríguez-Medina, I.C.; Segura-Carretero, A.; Fernández-Gutiérrez, A. Use of high-performance liquid chromatography with diode array detection coupled to electrospray-Qq-time-of-flight mass spectrometry for the direct characterization of the phenolic fraction in organic commercial juices. J. Chromatogr. A 2009, 1216, 4736–4744. [Google Scholar] [CrossRef]
- Razola-Díaz, M.D.C.; Aznar-Ramos, M.J.; Benítez, G.; Gómez-Caravaca, A.M.; Verardo, V. Exploring the potential of phenolic and antioxidant compounds in new Rosaceae fruits. J. Sci. Food Agr. 2024, 104, 3705–3718. [Google Scholar] [CrossRef]
- Oszmiański, J.; Wojdyło, A.; Lachowicz, S. Effect of dried powder preparation process on polyphenolic content and antioxidant activity of blue honeysuckle berries (Lonicera caerulea L. var. kamtschatica). LWT-Food Sci. Technol. 2016, 67, 214–222. [Google Scholar] [CrossRef]
- Andersen, I.K.; Laursen, B.B.; Rasmussen, J.; Fomsgaard, I.S. Optimised extraction and LC-MS/MS analysis of flavonoids reveal large field variation in exudation into Lupinus angustifolius L. rhizosphere soil. Rhizosphere-Neth 2022, 22, 100516. [Google Scholar] [CrossRef]
- Volk, J.; Sarafeddinov, A.; Unver, T.; Marx, S.; Tretzel, J.; Zotzel, J.; Warzecha, H. Two novel methylesterases from Olea europaea contribute to the catabolism of oleoside-type secoiridoid esters. Planta 2019, 250, 2083–2097. [Google Scholar] [CrossRef] [PubMed]
- Bautista-Hernández, I.; Gómez-García, R.; Aguilar, C.N.; Martínez-Ávila, G.C.; Torres-León, C.; Chávez-González, M.L. Solid-State Fermentation for Phenolic Compounds Recovery from Mexican Oregano (Lippia graveolens Kunth) Residual Leaves Applying a Lactic Acid Bacteria (Leuconostoc mesenteroides). Agriculture 2024, 14, 1342. [Google Scholar] [CrossRef]
- Rodríguez Martín-Aragón, V.; Trigal Martínez, M.; Cuadrado, C.; Daranas, A.H.; Fernández Medarde, A.; Sánchez López, J.M. OSMAC Approach and Cocultivation for the Induction of Secondary Metabolism of the Fungus Pleotrichocladium opacum. ACS Omega 2023, 8, 39873–39885. [Google Scholar] [CrossRef] [PubMed]
- Amarowicz, R.; Carle, R.; Dongowski, G.; Durazzo, A.; Galensa, R.; Kammerer, D.; Piskula, M.K. Influence of postharvest processing and storage on the content of phenolic acids and flavonoids in foods. Mol. Nutr. Food Res. 2009, 53, S151–S183. [Google Scholar] [CrossRef]
- Reiter, R.J.; Tan, D.X.; Manchester, L.C.; Qi, W. Biochemical reactivity of melatonin with reactive oxygen and nitrogen species: A review of the evidence. Cell Biochem. Biophys. 2001, 34, 237–256. [Google Scholar] [CrossRef]
- Bhardwaj, R.; Pareek, S.; Domínguez-Avila, J.A.; Gonzalez-Aguilar, G.A.; Valero, D.; Serrano, M. An exogenous pre-storage melatonin alleviates chilling injury in some mango fruit cultivars, by acting on the enzymatic and non-enzymatic antioxidant system. Antioxidants 2022, 11, 384. [Google Scholar] [CrossRef] [PubMed]
- Muche, B.M.; Speers, R.A.; Rupasinghe, H.V. Storage temperature impacts on anthocyanins degradation, color changes and haze development in juice of “Merlot” and “Ruby” grapes (Vitis vinifera). Front Nutr. 2018, 5, 100. [Google Scholar] [CrossRef]
- Hasan, M.U.; Singh, Z.; Shah, H.M.S.; Woodward, A.; Afrifa-Yamoah, E. Modified atmosphere packaging and melatonin application alleviates chilling injury in ‘Fuyu’persimmon fruit by reducing ethylene production, mitigating ROS accumulation, and maintaining antioxidant system. Food Packag. Shelf 2025, 48, 101458. [Google Scholar] [CrossRef]
- Wang, Y.; Liu, G.; Zhang, W.; Li, L.; Yang, W.; Liu, Y.; Chen, G. Melatonin treatment delayed fruit softening by regulating postharvest carbohydrate metabolism of hami melon. Plant Physiol. Bioch. 2025, 219, 109328. [Google Scholar] [CrossRef]
- Wang, R.; Lou, L. The Central Role of the Citric Acid Cycle in Energy Metabolism: From Metabolic Intermediates to Regulatory Mechanisms. Biol. Evid. 2024, 14, 110–121. [Google Scholar] [CrossRef]
| Peak | Retention Time (min) | Formula | Molecular Weight (MW) | MS Expected Value [M]+/([M − H]−) (m/z) | MS Found Value ([M]+/([M − H]−))(m/z) | MS2 (m/z) | Error (ppm) | Tentative Assignment | HPLC-DAD λ Max (nm) |
|---|---|---|---|---|---|---|---|---|---|
| Anthocyanins | |||||||||
| A1 | 5.57 | C27H31O16+ | 611 | 611.1609 | 611.1617 | 449.1095/287.0555 | 1.31 | Cyanidin-3,5-diglucoside | 522,285 |
| A2 | 7.9 | C28H33O16+ | 625 | 625.1765 | 625.1771 | 301.0706/463.1242/625.1799 | 0.96 | Peonidin-3,5-diglucoside | 515 |
| A3 | 11.42 | C21H21O11+ | 449 | 449.1077 | 449.1076 | 287.0545 | −0.22 | Cyanidin-3-glucoside | 516,280 |
| A4 | 12.19 | C27H31O15+ | 595 | 595.1654 | 595.166 | 287.0554/595.1626 | 1.01 | Cyanidin-3-rutinoside | 517 |
| A5 | 14.69 | C21H21O10+ | 433 | 433.1131 | 433.1129 | 271.0607 | −0.46 | Pelargonidin-3-glucoside | 508,273 |
| A6 | 16.76 | C22H23O11+ | 463 | 463.1234 | 463.1238 | 301.0703, 286.0455 | 0.86 | Peonidin-3-glucoside | 513,278 |
| A7 | 17.98 | C28H33O15+ | 609 | 609.1813 | 609.1815 | 301.0708/609.1806 | 0.33 | Peonidin-3-rutinoside | 517 |
| A8 | 18.65 | C20H19O10+ | 419 | 419.0976 | 419.0981 | 287.0543 | 1.19 | Cyanidin-3-xyloside | 524 |
| A9 | 18.73 | C23H31O14+ | 531 | 531.2042 | 531.2042 | 301.1443/369.1039 | 0 | Peonidin-3-glucoside pyruvic derivative | 527,246 |
| A10 | 20.93 | C21H21O12+ | 465 | 465.1731 | 465.1729 | 303.1207/465.1716 | −0.43 | Delphinidin-3-glucoside | 520,279 |
| A11 | 22.63 | C26H29O14+ | 597 | 597.1451 | 597.1456 | 303.0512/465.0996 | 0.84 | Delphinidin-3-sambubioside | 527 |
| A12 | 23.52 | C27H31O16+ | 611 | 611.2808 | 611.2813 | 303.0504 | 0.82 | Delphinidin-3-rutinoside | 550,261 |
| Phenolic acids | |||||||||
| Hydroxybenzoic acids | |||||||||
| 9 | 4.13 | C21H16O13 | 478 | 477.9508 | 477.9531 | 477.9506/303.8766 | 4.81 | Ellagic acid acetyl-xyloside | 259,281 |
| 42 | 7.89 | C7H6O5 | 170 | 169.0145 | 169.0149 | 169.0108/151.0021 | 2.37 | Gallic acid | 284 |
| Hydroxycinnamic acids | |||||||||
| 4 | 2.65 | C16H20O10 | 372 | 371.0473 | 371.048 | 191.05 | 1.89 | Trihydroxycinnamoylquinic acid (isomer) | 252 |
| 5 | 2.73 | C11H12O3 | 192 | 191.0558 | 191.0562 | 87.0122/111.0099/85.0330/129.0197 | 2.09 | p-Coumaric acid ethyl ester | 287 |
| 6 | 2.95 | C17H20O9 | 368 | 367.0674 | 367.068 | 367.0725/191.0509/135.0447 | 1.63 | 3-Feruloylquinic acid | 251 |
| 7 | 3.74 | C7H12O6 | 192 | 191.0201 | 191.0204 | 191.0497/173.0418 | 1.57 | Quinic acid | 242,277 |
| 11 | 5.13 | C25H24O12 | 516 | 515.1409 | 515.1425 | 515.0887/323.0542/191.0507 | 3.11 | Dicaffeoylquinic acid | 282 |
| 14 | 7.14 | C15H18O9 | 342 | 341.0873 | 341.0893 | 341.0633/191.0520/179.0305 | 5.86 | Caffeoyl glucose | 278 |
| 15 | 7.72 | C16H18O9 | 354 | 353.0878 | 353.0887 | 353.0632/191.0502/179.0297 | 2.55 | Neochlorogenic acid | 287 |
| 18 | 12.78 | C16H18O9 | 354 | 353.0871 | 353.0886 | 191.0499 | 4.25 | Chlorogenic acid | 281 |
| 22 | 17.40 | C16H18O9 | 354 | 353.0869 | 353.0885 | 191.0497 | 4.53 | 5-O-caffeoylquinic acid | 294 |
| 27 | 19.23 | C16H18O9 | 354 | 353.0718 | 353.0733 | 191.0499 | 4.25 | 3-O-caffeoylquinic acid | 234,285 |
| 28 | 19.44 | C16H18O8 | 338 | 337.0921 | 337.0937 | 191.0506/163.0376 | 4.75 | p-Coumaroylquinic acid | 233,283 |
| Hydroxyphenylpropanoic acids | |||||||||
| 3 | 2.55 | C9H10O4 | 182 | 181.0566 | 181.0564 | 181.0664/73.0340/59.0189 | −1.1 | Dihydrocaffeic acid | 243,283 |
| Flavonoids | |||||||||
| Dihydrochalcones | |||||||||
| 1 | 2.26 | C26H32O14 | 568 | 567.1907 | 567.195 | 567.1353/227.0822/191.0507 | 7.58 | Phloretin 2′-O-xylosyl-glucoside | 252 |
| Flavanols | |||||||||
| 25 | 18.67 | C15H14O6 | 290 | 289.0715 | 289.0727 | 245.0545 | 4.15 | (+)-Catechin | 242,275 |
| 42 | 26.27 | C15H14O7 | 306 | 305.0667 | 305.068 | 305.0514/287.0401 | 4.26 | (-)-Gallocatechin | 262 |
| Flavanones | |||||||||
| 19 | 16.11318602 | C21H22O11 | 450 | 449.1069 | 449.1091 | 449.0677/287.0401/269.0300/151.0019 | 4.9 | Eriodictyol 7-O-glucoside | 278 |
| Flavones | |||||||||
| 30 | 20.66 | C21H20O11 | 448 | 447.0922 | 447.0938 | 285.0224 | 3.58 | Luteolin 7-O-glucoside | 252 |
| 35 | 22.72 | C27H30O16 | 594 | 593.1533 | 593.153 | 593.0891/285.0233 | −0.51 | Luteolin 7-O-rutinoside | 261 |
| 37 | 23.29 | C26H28O16 | 594 | 593.1501 | 593.1516 | 593.0874/285.0220/284.0148 | 2.53 | Luteolin-O-hexose-O-deoxyhexoside | 254 |
| Flavonols | |||||||||
| 9 | 4.27 | C21H20O12 | 464 | 463.1081 | 463.1106 | 315.0501/153.0176/129.0188 | 5.4 | Myricetin 3-O-rhamnoside | 255 |
| 10 | 4.58 | C27H30O16 | 610 | 609.145 | 609.1487 | 609.0844/447.0542/285.0231 | 6.07 | Kaempferol 3,7-O-diglucoside | 275 |
| 13 | 7.12 | C27H30O17 | 626 | 625.1403 | 625.1424 | 625.0735/300.0073/301.0150/271.0087 | 3.36 | Quercetin 7,4′-O-diglucoside | 245,283 |
| 20 | 16.68 | C27H30O15 | 594 | 593.271 | 593.2746 | 593.0872/285.0216 | 6.07 | Kaempferol 3-O-galactoside 7-O-rhamnoside | 254 |
| 23 | 18.32 | C27H30O17 | 626 | 625.1202 | 625.12 | 625.0721/301.0151/300.0079 | −0.32 | Quercetin 3-O-sophoroside | 242,276 |
| 24 | 18.35 | C27H30O17 | 464 | 463.0858 | 463.0887 | 463.0450/301.0157/300.0071 | 6.26 | Quercetin-3-O-galactoside | 259 |
| 26 | 19.08 | C27H30O15 | 594 | 594.1203 | 594.1231 | 593.0872/285.0228/284.0157 | 4.71 | Kaempferol 3-O-rutinoside | 273 |
| 29 | 20.20 | C27H30O17 | 626 | 625.1786 | 625.1795 | 625.0753/301.0155/300.0074 | 1.44 | Myricetin-3-O-rutinoside | 261 |
| 31 | 21.12 | C26H28O16 | 596 | 595.1283 | 595.1316 | 595.0653/301.0152 | 5.55 | Quercetin O-vicianoside | 249 |
| 32 | 21.88 | C24H34O19 | 626 | 625.1597 | 625.1632 | 625.0735/301.0150 | 5.6 | Quercetin 3,4′-O-dihexoside | 273 |
| 33 | 22.03 | C26H32O18 | 596 | 595.2028 | 595.2052 | 301.0144/300.0062 | 4.03 | Quercetin-3-hexoside-Pentoside | 282 |
| 34 | 22.44 | C27H30O16 | 610 | 610.1485 | 610.1477 | 595.0679/301.0163/300.0086 | −1.31 | Quercetin 3-O-rutinoside | 277 |
| 36 | 22.94 | C27H30O16 | 610 | 609.144 | 609.1472 | 301.0146/300.0063 | 5.25 | Quercetin-3-O-rhamnosiy-galactoside | 243,275 |
| 39 | 23.97 | C21H20O12 | 464 | 463.2171 | 463.2183 | 463.0450/301.0157/300.0071 | 2.59 | Quercetin 3-O-glucoside | 279 |
| 40 | 24.36 | C28H32O16 | 624 | 623.1589 | 623.1625 | 315.0291/314.0215/300.0074 | 5.78 | Isorhamnetin-3-O-rutinoside | 241,273 |
| 41 | 25.65 | C23H25O17 | 506 | 505.0983 | 505.0992 | 505.0482/301.0155/300.0071 | 1.78 | Quercetin- acetyl-hexoside | 250 |
| Isoflavonoids | |||||||||
| 38 | 23.57 | C21H20O10 | 432 | 431.0981 | 431.0991 | 431.0597/269.0302/268.0221 | 2.32 | Genistin | 263 |
| Other polyphenols | |||||||||
| Hydroxybenzaldehydes | |||||||||
| 2 | 2.32 | C8H8O2 | 135 | 134.0475 | 134.0476 | 134.0463/107.0380 | 0.75 | p-Anisaldehyde | 235 |
| Tyrosols | |||||||||
| 17 | 8.51 | C8H10O3 | 154 | 154.0624 | 154.0622 | 109.0321 | −1.3 | Hydroxytyrosol | 270 |
| Alkylphenols | |||||||||
| 12 | 7.04 | C16H24O10 | 376 | 375.2917 | 375.2932 | 191.0649 | 4 | 5-Nonadecylresorcinol | 268, 297 |
| 21 | 17.07 | C27H48O2 | 404 | 403.1591 | 403.1577 | 403.1261/223.0879/179.1023/125.0625 | −3.47 | 5-Heneicosylresorcinol | 237 |
Disclaimer/Publisher’s Note: The statements, opinions and data contained in all publications are solely those of the individual author(s) and contributor(s) and not of MDPI and/or the editor(s). MDPI and/or the editor(s) disclaim responsibility for any injury to people or property resulting from any ideas, methods, instructions or products referred to in the content. |
© 2025 by the authors. Licensee MDPI, Basel, Switzerland. This article is an open access article distributed under the terms and conditions of the Creative Commons Attribution (CC BY) license (https://creativecommons.org/licenses/by/4.0/).
Share and Cite
Qiao, J.; Guo, L.; Xiao, Z.; Huo, J.; Sui, X.; Gao, F.; Zhang, Y. Melatonin-Induced Modulation of Polyphenols and Glycolytic Pathways in Relation to Postharvest Quality of Blue Honeysuckle Fruits. Foods 2025, 14, 2646. https://doi.org/10.3390/foods14152646
Qiao J, Guo L, Xiao Z, Huo J, Sui X, Gao F, Zhang Y. Melatonin-Induced Modulation of Polyphenols and Glycolytic Pathways in Relation to Postharvest Quality of Blue Honeysuckle Fruits. Foods. 2025; 14(15):2646. https://doi.org/10.3390/foods14152646
Chicago/Turabian StyleQiao, Jinli, Liangchuan Guo, Zhen Xiao, Junwei Huo, Xiaonan Sui, Fang Gao, and Yan Zhang. 2025. "Melatonin-Induced Modulation of Polyphenols and Glycolytic Pathways in Relation to Postharvest Quality of Blue Honeysuckle Fruits" Foods 14, no. 15: 2646. https://doi.org/10.3390/foods14152646
APA StyleQiao, J., Guo, L., Xiao, Z., Huo, J., Sui, X., Gao, F., & Zhang, Y. (2025). Melatonin-Induced Modulation of Polyphenols and Glycolytic Pathways in Relation to Postharvest Quality of Blue Honeysuckle Fruits. Foods, 14(15), 2646. https://doi.org/10.3390/foods14152646