Development and Application of the Agricultural Product Safety Index in Major Countries and Imported Food Safety Index for Korea

Abstract
1. Introduction
2. Methodological Framework
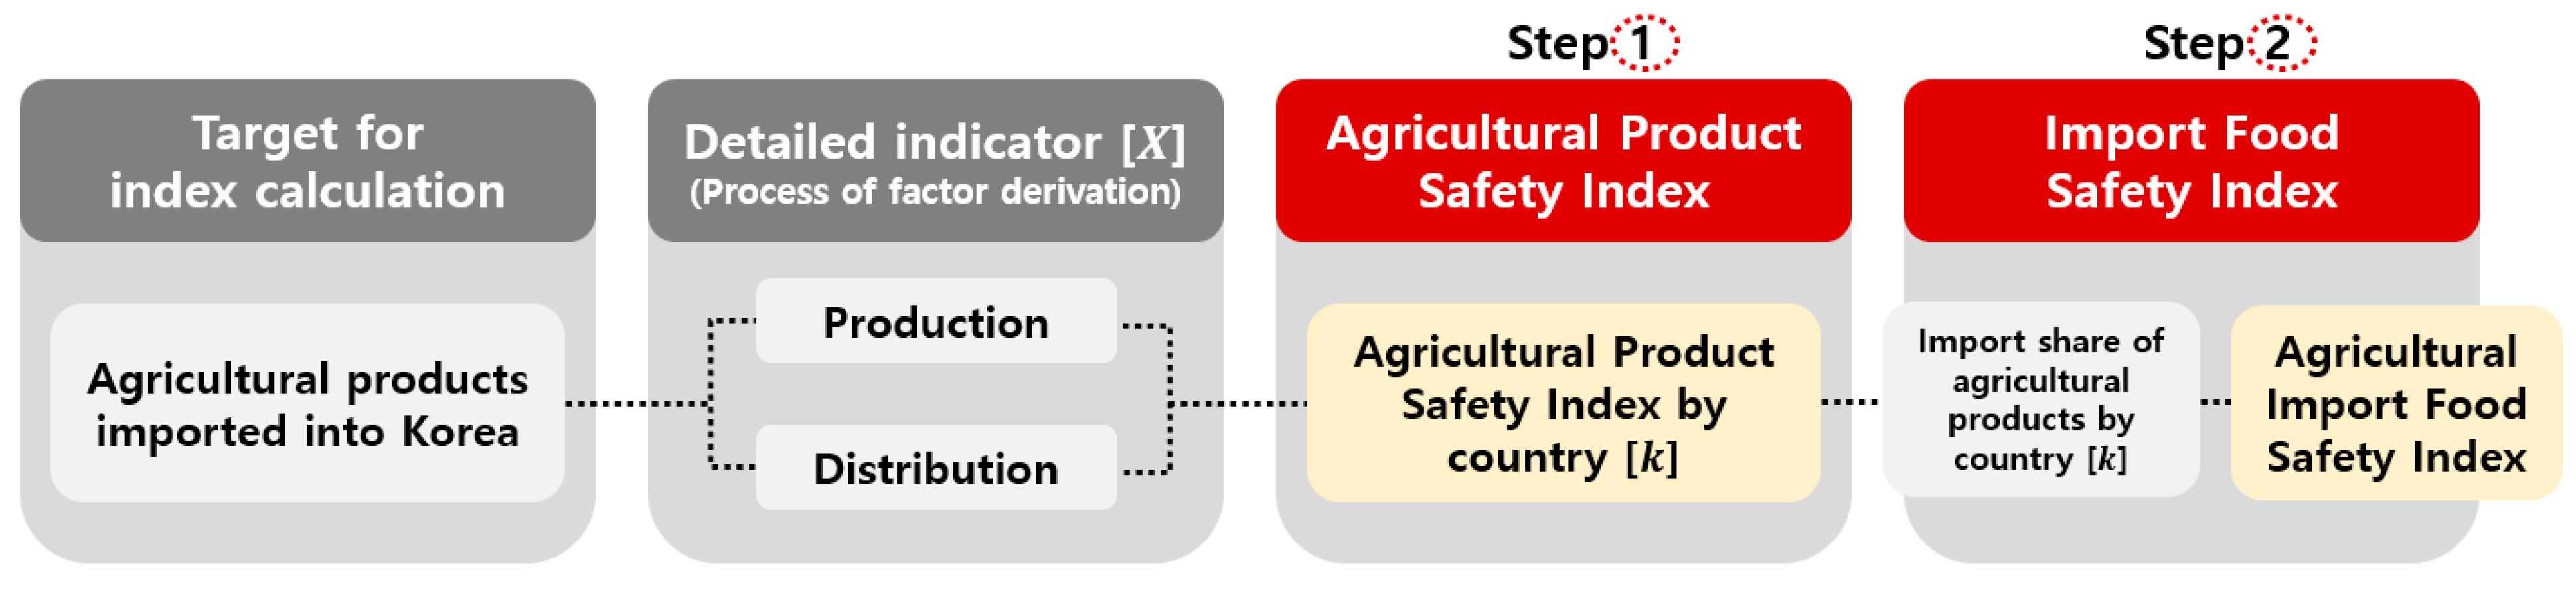
2.1. Analytical Model
- Xmax: maximum value of X in all of the measurable countries (k) and during the entire period (t)
- Xmin: minimum value of X in all of the measurable countries (k) and during the entire period (t)
- Import sharek: calculated in two ways according to the K
- K: representative countries selected based on CR3 criteria
2.2. Analysis Data and Indicator Calculation
3. Results
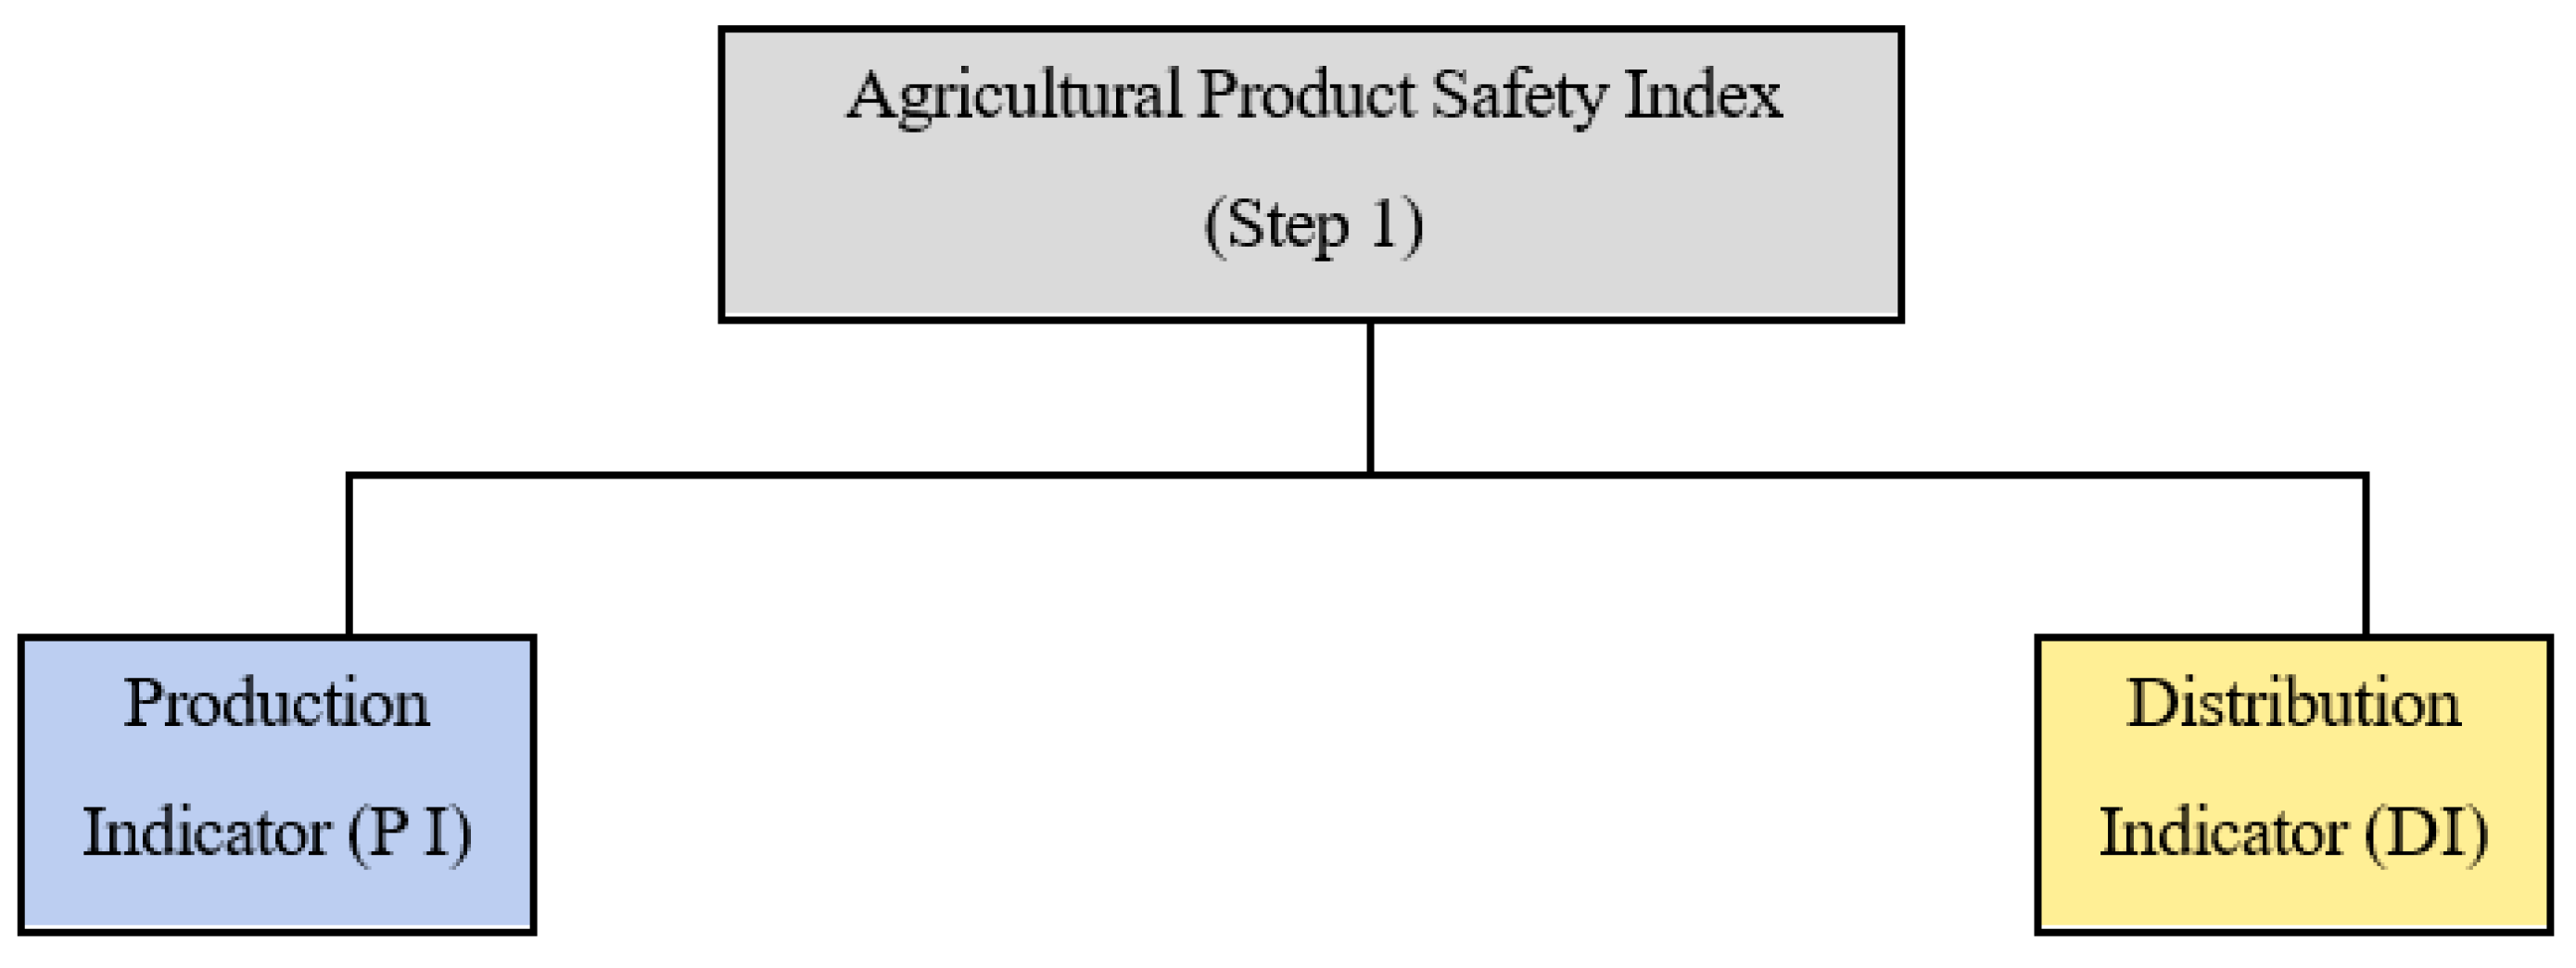
3.1. Calculation of the Agricultural Product Safety Index by Country (Step 1 Index)
3.2. Calculation of the Agricultural Product Safety Index for Korea (Step 2 Index)
4. Discussion
5. Conclusions
Author Contributions
Funding
Data Availability Statement
Acknowledgments
Conflicts of Interest
References
- International Food Policy Research Institute (IFPRI). A New Rapid Assessment Tool for Food Security Risks Posed by Global Price Shocks. Available online: https://www.ifpri.org/blog/new-rapid-assessment-tool-food-security-risks-posed-global-price-shocks/ (accessed on 5 December 2023).
- Jongwanich, J. The Impact of Food Safety Standards on Processed Food Exports from Developing Countries. Food Policy 2009, 34, 447–457. [Google Scholar] [CrossRef]
- Zach, L.; Doyle, M.E.; Bier, V.; Czuprynski, C. Systems and Governance in Food Import Safety: A US Perspective. Food Control 2012, 27, 153–162. [Google Scholar] [CrossRef]
- Cho, S.G.; Jeong, H.S. Research on Advancing the Imported Food Safety Management System; Research Report of the Food Safety Information Center Research Report: Seoul, Republic of Korea, 2018. [Google Scholar]
- Alrobaish, W.S.; Vlerick, P.; Luning, P.A.; Jacxsens, L. Food safety governance in Saudi Arabia: Challenges in control of imported food. J. Food Sci. 2021, 86, 16–30. [Google Scholar] [CrossRef] [PubMed]
- Choi, J.H.; Kim, M.J. Measures to Ensure the Safety of Agri-Food in the Production and Import Stages; Korea Rural Economic Institute Other Research Report: Seoul, Republic of Korea, 2006. [Google Scholar]
- Welburn, J.; Bier, V.; Hoerning, S. Import security: Assessing the risks of imported food. Risk Anal. 2016, 36, 2047–2064. [Google Scholar] [CrossRef] [PubMed]
- Lee, Y.H.; Lee, S.S. Analysis of Consumer Trust Model regarding Food Businesses and Government Food Safety Policies. Korean J. Consum. Stud. 2014, 25, 1–20. [Google Scholar]
- Yang, S.B. A Study on the Development of Index for Food Safety Status based on the Statistical Data. Korean J. Org. Agric. 2011, 30, 21–35. [Google Scholar] [CrossRef]
- Organization for Economic Cooperation and Development(OECD). Handbook on Constructing Composite Indicators: Methodology and User Guide; OECD Publishing: Paris, France, 2008. [Google Scholar]
- United Nations Development Program (UNDP). Human Development Report; United Nations Development Programme: New York, NY, USA, 2022. [Google Scholar]
- Kim, J.S. Policy Tasks for Strengthening Food Safety Management in Response to Climate Change; Korea Rural Economic Institute Research Report: Naju, Republic of Korea, 2013. [Google Scholar]
- Choi, J.H.; Kim, M.J. Measures for Ensuring Food Safety in the Production and Import Stages; Research Report of the Korea Rural Economic Institute: Naju, Republic of Korea, 2006. [Google Scholar]
- Greco, S.; Ishizaka, A.; Tasiou, M.; Torrisi, G. On the Methodological Framework of Composite Indices: A Review of the Issues of Weighting, Aggregation, and Robustness. Soc. Indic. Res. 2019, 141, 61–94. [Google Scholar] [CrossRef]
- United Nations Development Programme (UNDP). Measuring Human Development: A Primer; Human Development Report Office: New York, NY, USA, 2007. [Google Scholar]
- Yang, S.R. Development of Indicators for Evaluating Agricultural Competitiveness by Country and Product; Korea Rural Economic Institute Research Report: Naju, Republic of Korea, 2023. [Google Scholar]
- Food and Agriculture Organization of the United Nations (FAO). FAOSTAT: Food and Agricultural Data. 2023. Available online: https://www.fao.org/faostat/en/#home (accessed on 23 November 2023).
- The Economist Impact. Global Food Security Index. 2023. Available online: https://impact.economist.com/sustainability/project/food-security-index (accessed on 7 December 2023).
- National Oceanic and Atmospheric Administration (NOAA), Global Time Series. 2023. Available online: https://www.ncei.noaa.gov/access/monitoring/climate-at-a-glance/global (accessed on 7 December 2023).
- United States Department of Agriculture (USDA), Custom Query. 2023. Available online: https://apps.fas.usda.gov/psdonline/app/index.html#/app/advQuery (accessed on 1 December 2023).
- Yale University; Columbia University. Environmental Performance Index (EPI). 2023. Available online: https://epi.yale.edu/ (accessed on 5 December 2023).
- Imported Food Information Maru. 2023. Available online: https://impfood.mfds.go.kr/ (accessed on 11 November 2023).
- Centre d’Études Prospectives et d’Informations Internationales (CEPII). GEODIST. 2023. Available online: https://www.cepii.fr/cepii/en/bdd_modele/bdd_modele_item.asp?id=6 (accessed on 7 December 2023).
- World Bank. Political Stability. 2023. Available online: https://www.worldbank.org/en/home (accessed on 10 November 2023).


| Classification | Principle | Description |
|---|---|---|
| Principle 1 | Applicability | Determined based on data quantitatively comparable between countries or between periods |
| Principle 2 | Reliability | Same results produced using publicly reliable data open to anyone |
| Principle 3 | Boundedness | Indicator determined between 0 and 1 |
| Principle 4 | Independence among indicators | No duplication between indicators |
| Principle 5 | Representativeness | Representative countries selected based on the CR3 (Concentration Ratio) |
| Classification 1 | Sub-Detailed Indicator | ||
|---|---|---|---|
| Production indicator () | Chemical factor | Pesticide use per hectare of agricultural land Quality of agricultural water | Agricultural fertilizer use per hectare of agricultural land |
| Environmental factor | Abnormal temperature | Acid rain | |
| Other factors | Stock | Governmental investment into the agricultural sector | |
| Distribution indicator () | Other factors | Trade distance Political stability | Import non-compliance rate |
| Classification | Sub-Detailed Indicator | Source | Description | Equation |
|---|---|---|---|---|
| Production index () | Pesticide use per hectare of agricultural land () | FAO | Reference to the data of pesticide use per hectare of agricultural land | |
| Pesticide use per hectare of agricultural land (agricultural fertilizer use per hectare of agricultural land) () | FAO | Direct calculation in reference to the data of agricultural land and use of agricultural fertilizers | ||
| Agricultural water quality () | GFSI | Reference to data of agricultural water quality released by the GFSI | ||
| Abnormal temperature () | NOAA | Direct calculation of the total sum of the absolute values of monthly observations based on the latitude and longitude inputs of each nation’s capital city | ||
| Stock () | USDA | Reference to data of each nation’s agricultural ending stocks | ||
| Governmental investment () | FAO | Direct calculation of the proportion of investment into the area of ‘Water Use in Agriculture, Forestry, and Fisheries’ among the total expenditure of the central government | ||
| Acid rain () | Yale EPI | Sulfur dioxide and nitrogen oxide increase rates reflected, weighted equally at 50% | ||
| Distribution index () | Trade distance () | CEPII | Trade distance explicitly calculated for the destination country (South Korea) | |
| Import non-compliance rate () | Imported food Information Maru | Data of non-compliance rates for each origin of agricultural products | ||
| Political stability () | World Bank | Dividing the full range into 100 intervals based on calculated class width and assigning evaluation scores accordingly |
| Classification | Index (Unit) | No. of Countries (Period) | No. of Observations | Average | Standard Deviation |
|---|---|---|---|---|---|
| Production index () | Pesticide use per hectare of agricultural land (kg/ha) | 199 countries (1990–2021) | 5768 | 3.37 | 5.23 |
| Agricultural fertilizer use per hectare of agricultural land (kg/ha) | 171 countries (2002–2021) | 1904 | 239.97 | 1295.95 | |
| Quality of agricultural water (point) | 118 countries (2012–2022) | 1243 | 41.79 | 39.13 | |
| Abnormal temperature | 238 countries (1990–2022) | 7689 | 7.24 | 5.23 | |
| Stock volume (1000 ton) | 214 countries (1960–2023) | 13,376 | 13,380.00 | 74,762.00 | |
| Proportion of governmental investment (%) | 190 countries (2001–2021) | 3096 | 2.55 | 2.74 | |
| Acid rain (point) | 225 countries (1995–2022) | 5404 | 61.83 | 26.91 | |
| Distribution index () | Trade distance (km) | 224 countries | 224 | 9626.44 | 3863.08 |
| Import non-compliance rate (%) | 132 countries (2014–2023) | 837 | 0.41 | 5.20 | |
| Political stability | 198 countries (2002–2021) | 3846 | −0.06 | 0.99 |
| Classification | Country | Import Share 1 | Accumulative Share | Country | Import Share 1 | Accumulative Share |
|---|---|---|---|---|---|---|
| Rank | 2014 | 2015 | ||||
| 1 | U.S. | 0.4200 | 0.4200 | U.S. | 0.3215 | 0.3215 |
| 2 | Brazil | 0.1031 | 0.5231 | Brazil | 0.1942 | 0.5157 |
| 3 | Australia | 0.0906 | 0.6137 | Ukraine | 0.1187 | 0.6344 |
| 4 | Ukraine | 0.0873 | 0.7010 | Australia | 0.0812 | 0.7156 |
| 5 | China | 0.0525 | 0.7535 | China | 0.0572 | 0.7728 |
| Rank | 2016 | 2017 | ||||
| 1 | U.S. | 0.3594 | 0.3594 | U.S. | 0.3992 | 0.3992 |
| 2 | Brazil | 0.1533 | 0.5127 | Brazil | 0.1112 | 0.5104 |
| 3 | Argentina | 0.1022 | 0.6149 | Australia | 0.0886 | 0.5990 |
| 4 | Australia | 0.0771 | 0.6920 | Ukraine | 0.0763 | 0.6753 |
| 5 | Ukraine | 0.0689 | 0.7609 | Argentina | 0.0636 | 0.7389 |
| Rank | 2018 | 2019 | ||||
| 1 | U.S. | 0.5041 | 0.5041 | U.S. | 0.3088 | 0.3088 |
| 2 | Australia | 0.0857 | 0.5898 | Brazil | 0.1863 | 0.4950 |
| 3 | Russia | 0.0686 | 0.6584 | Argentina | 0.1412 | 0.6362 |
| 4 | Brazil | 0.0627 | 0.7211 | Australia | 0.0763 | 0.7125 |
| 5 | China | 0.0606 | 0.7816 | China | 0.0572 | 0.7696 |
| Rank | 2020 | 2021 | ||||
| 1 | U.S. | 0.3042 | 0.3042 | U.S. | 0.3122 | 0.3122 |
| 2 | Argentina | 0.1298 | 0.4340 | Argentina | 0.2010 | 0.5132 |
| 3 | Brazil | 0.1179 | 0.5519 | Brazil | 0.1111 | 0.6242 |
| 4 | Ukraine | 0.1119 | 0.6637 | Australia | 0.0839 | 0.7081 |
| 5 | Australia | 0.0710 | 0.7347 | China | 0.0526 | 0.7607 |
| Classification | 2014 | 2015 | 2016 | 2017 | 2018 | 2019 | 2020 | 2021 | |
|---|---|---|---|---|---|---|---|---|---|
| Imported food safety index | 0.8096 | 0.8081 | 0.8136 | 0.8124 | 0.8123 | 0.8101 | 0.8091 | 0.8087 | |
| Production indicator | 0.7995 | 0.8066 | 0.8074 | 0.8151 | 0.8083 | 0.8072 | 0.8120 | 0.8123 | |
| Pesticide use | 0.9593 | 0.9572 | 0.9447 | 0.9487 | 0.9463 | 0.9457 | 0.9457 | 0.9471 | |
| Use of agricultural fertilizers | 0.9995 | 0.9995 | 0.9995 | 0.9996 | (0.9996) | (0.9996) | (0.9996) | (0.9996) | |
| Quality of agricultural water | 1.0000 | 1.0000 | 1.0000 | 1.0000 | 1.0000 | 1.0000 | 1.0000 | 1.0000 | |
| Temperature anomaly | 0.8242 | 0.8300 | 0.7883 | 0.8432 | 0.8206 | 0.8387 | 0.8868 | 0.9051 | |
| Stock | 0.9587 | 0.9575 | 0.9581 | 0.9591 | 0.9594 | 0.9554 | 0.9494 | 0.8309 | |
| Governmental investment | 0.0240 | 0.0229 | 0.0223 | 0.0233 | 0.0218 | 0.0247 | 0.0162 | 0.0176 | |
| Acid rain | 0.8309 | 0.8790 | 0.9388 | 0.9315 | 0.9101 | 0.8860 | 0.8860 | 0.8860 | |
| Distribution indicator | 0.8197 | 0.8097 | 0.8197 | 0.8097 | 0.8164 | 0.8130 | 0.8062 | 0.8051 | |
| Trade distance | 0.5792 | 0.5792 | 0.5792 | 0.5792 | 0.5792 | 0.5792 | 0.5792 | 0.5792 | |
| Import non-compliance rate | 1.0000 | 1.0000 | 1.0000 | 1.0000 | 1.0000 | 0.9999 | 0.9993 | 0.9962 | |
| Political stability | 0.8800 | 0.8500 | 0.8800 | 0.8500 | 0.8700 | 0.8600 | 0.8400 | 0.8400 | |
| Classification | 2014 | 2015 | 2016 | 2017 | 2018 | 2019 | 2020 | 2021 | |
|---|---|---|---|---|---|---|---|---|---|
| Imported food safety index | 0.7189 | 0.7161 | 0.7142 | 0.7150 | 0.7046 | 0.7059 | 0.6919 | 0.6916 | |
| Production indicator | 0.6949 | 0.6826 | 0.6989 | 0.7070 | 0.6764 | 0.6988 | 0.6775 | 0.6803 | |
| Pesticide use | 0.9311 | 0.9295 | 0.9253 | 0.9258 | 0.9245 | 0.9245 | 0.9245 | 0.9245 | |
| Use of agricultural fertilizers | 0.9958 | 0.9960 | 0.9963 | 0.9963 | 0.9963 | 0.9963 | 0.9963 | 0.9963 | |
| Quality of agricultural water | 1.0000 | 1.0000 | 1.0000 | 1.0000 | 1.0000 | 1.0000 | 1.0000 | 1.0000 | |
| Abnormal temperature | 0.7525 | 0.5979 | 0.7580 | 0.7385 | 0.6429 | 0.7527 | 0.6675 | 0.7390 | |
| Stock | 0.1515 | 0.2187 | 0.1755 | 0.2541 | 0.1346 | 0.1702 | 0.0970 | 0.0669 | |
| Governmental investment | 0.0333 | 0.0363 | 0.0369 | 0.0346 | 0.0366 | 0.0477 | 0.0576 | 0.0356 | |
| Acid rain | 1.0000 | 1.000 | 1.0000 | 1.0000 | 1.0000 | 1.0000 | 1.0000 | 1.0000 | |
| Distribution indicator | 0.7430 | 0.7496 | 0.7296 | 0.7229 | 0.7329 | 0.7130 | 0.7062 | 0.7030 | |
| Trade distance | 0.4389 | 0.4389 | 0.4389 | 0.4389 | 0.4389 | 0.4389 | 0.4389 | 0.4389 | |
| Import non-compliance rate | 1.0000 | 1.0000 | 1.0000 | 0.9999 | 0.9997 | 1.0000 | 0.9997 | 1.0000 | |
| Political stability | 0.7900 | 0.8100 | 0.7500 | 0.7300 | 0.7600 | 0.7000 | 0.6800 | 0.6700 | |
| Classification | 2016 | 2017 | 2019 | 2020 | 2021 | |
|---|---|---|---|---|---|---|
| Imported food safety index | 0.5894 | 0.6482 | 0.6477 | 0.6492 | 0.6451 | |
| Production indicator | 0.6057 | 0.7233 | 0.7423 | 0.7454 | 0.7404 | |
| Pesticide use | 0.8710 | 0.8742 | 0.8705 | 0.8513 | 0.8519 | |
| Use of agricultural fertilizers | 0.9990 | 0.9989 | 0.9986 | 0.9986 | (0.9986) | |
| Quality of agricultural water | 0.0000 | 0.7500 | 0.7500 | 0.7500 | 0.7500 | |
| Abnormal temperature | 0.7493 | 0.6877 | 0.8091 | 0.8377 | 0.8062 | |
| Stock | 0.8984 | 0.9061 | 0.8995 | 0.9073 | 0.9082 | |
| Governmental investment | 0.0274 | 0.0303 | 0.0147 | 0.0190 | 0.0140 | |
| Acid rain | 0.6948 | 0.8156 | 0.8537 | 0.8537 | 0.8537 | |
| Distribution indicator | 0.5731 | 0.5731 | 0.5531 | 0.5531 | 0.5498 | |
| Trade distance | 0.0093 | 0.0093 | 0.0093 | 0.0093 | 0.0093 | |
| Import non-compliance rate | 1.0000 | 1.0000 | 1.0000 | 1.0000 | 1.0000 | |
| Political stability | 0.7100 | 0.7100 | 0.6500 | 0.6500 | 0.6400 | |
| Classification | 2014 | 2015 | 2017 | 2020 | |
|---|---|---|---|---|---|
| Imported food safety index | 0.6147 | 0.6171 | 0.6319 | 0.6454 | |
| Production indicator | 0.5989 | 0.6003 | 0.6232 | 0.6002 | |
| Pesticide use | 0.9386 | 0.9489 | 0.9697 | 0.9809 | |
| Use of agricultural fertilizers | (0.9969) | (0.9969) | (0.9969) | 0.9952 | |
| Quality of agricultural water | 0.0000 | 0.0000 | 0.0000 | 0.0000 | |
| Abnormal temperature | 0.5796 | 0.5179 | 0.5820 | 0.2564 | |
| Stock | 0.9786 | 0.9815 | 0.9797 | 0.9771 | |
| Governmental investment | 0.0543 | 0.0346 | 0.0536 | 0.0456 | |
| Acid rain | 0.6441 | 0.7224 | 0.7808 | 0.9464 | |
| Distribution indicator | 0.6305 | 0.6338 | 0.6405 | 0.6905 | |
| Trade distance | 0.6315 | 0.6315 | 0.6315 | 0.6315 | |
| Import non-compliance rate | (1.0000) | 1.0000 | 1.0000 | 1.0000 | |
| Political stability | 0.2600 | 0.2700 | 0.2900 | 0.4400 | |
| Classification | 2014 | 2015 | 2016 | 2017 | 2018 | 2019 | 2020 | 2021 | |
|---|---|---|---|---|---|---|---|---|---|
| Imported food safety index | 0.5923 | 0.5808 | 0.5707 | 0.578217 | 0.5792 | 0.5733 | 0.5963 | 0.5959 | |
| Production indicator | 0.6130 | 0.6067 | 0.5897 | 0.6115 | 0.6100 | 0.6184 | 0.6444 | 0.6468 | |
| Pesticide use | 0.7949 | 0.7902 | 0.7838 | 0.7846 | 0.7726 | 0.7455 | 0.7213 | 0.7104 | |
| Use of agricultural fertilizers | (0.9955) | (0.9955) | (0.9955) | (0.9955) | (0.9955) | (0.9955) | (0.9955) | (0.9955) | |
| Quality of agricultural water | 0.5000 | 0.5000 | 0.5000 | 0.5000 | 0.5000 | 0.5000 | 0.5000 | 0.5000 | |
| Abnormal temperature | 0.8981 | 0.7491 | 0.7592 | 0.8278 | 0.9037 | 0.7532 | 0.8495 | 0.8601 | |
| Stock | 0.5952 | 0.7322 | 0.5480 | 0.5814 | 0.4413 | 0.5997 | 0.7152 | 0.7289 | |
| Governmental investment | 0.0446 | 0.0382 | 0.0410 | 0.0346 | 0.0318 | 0.0311 | 0.0251 | 0.0289 | |
| Acid rain | 0.4627 | 0.4421 | 0.5006 | 0.5570 | 0.6253 | 0.7039 | 0.7039 | 0.7039 | |
| Distribution indicator | 0.5716 | 0.5549 | 0.5516 | 0.5449 | 0.5483 | 0.5283 | 0.5483 | 0.5449 | |
| Trade distance | 0.0648 | 0.0648 | 0.0648 | 0.0648 | 0.0648 | 0.0648 | 0.0648 | 0.0648 | |
| Import non-compliance rate | 1.0000 | 1.0000 | 1.0000 | 1.0000 | 1.0000 | 1.0000 | 1.0000 | 1.0000 | |
| Political stability | 0.6500 | 0.6000 | 0.5900 | 0.5700 | 0.5800 | 0.5200 | 0.5800 | 0.5700 | |
| Classification | Agricultural Product Safety Index | Import Share | Imported Food Safety Index |
|---|---|---|---|
| Year | 2014 | ||
| Australia | 0.8096 | 12.9% | 0.699 |
| U.S. | 0.7189 | 59.9% | |
| Ukraine | 0.6147 | 12.4% | |
| Brazil | 0.5923 | 14.7% | |
| Year | 2015 | ||
| Australia | 0.8081 | 11.3% | 0.673 |
| U.S. | 0.7161 | 44.9% | |
| Ukraine | 0.6171 | 16.6% | |
| Brazil | 0.5808 | 27.1% | |
| Year | 2016 | ||
| Australia | 0.8136 | 11.1% | 0.675 |
| U.S. | 0.7142 | 51.9% | |
| Argentina | 0.5894 | 14.8% | |
| Brazil | 0.5707 | 22.2% | |
| Year | 2017 | ||
| Australia | 0.8124 | 12.0% | 0.692 |
| U.S. | 0.7150 | 54.0% | |
| Argentina | 0.6482 | 8.6% | |
| Ukraine | 0.6319 | 10.3% | |
| Brazil | 0.5782 | 15.0% | |
| Year | 2018 | ||
| Australia | 0.8123 | 11.9% | 0.640 |
| U.S. | 0.7046 | 69.9% | |
| Brazil | 0.5792 | 8.7% | |
| Year | 2019 | ||
| Australia | 0.8101 | 10.7% | 0.671 |
| U.S. | 0.7059 | 43.3% | |
| Argentina | 0.6477 | 19.8% | |
| Brazil | 0.5733 | 26.1% | |
| Year | 2020 | ||
| Australia | 0.8091 | 9.7% | 0.673 |
| U.S. | 0.6919 | 41.4% | |
| Argentina | 0.6492 | 17.7% | |
| Ukraine | 0.6454 | 15.2% | |
| Brazil | 0.5963 | 16.0% | |
| Year | 2021 | ||
| Australia | 0.8087 | 11.8% | 0.677 |
| U.S. | 0.6916 | 44.1% | |
| Argentina | 0.6451 | 28.4% | |
| Brazil | 0.5959 | 15.7% | |
Disclaimer/Publisher’s Note: The statements, opinions and data contained in all publications are solely those of the individual author(s) and contributor(s) and not of MDPI and/or the editor(s). MDPI and/or the editor(s) disclaim responsibility for any injury to people or property resulting from any ideas, methods, instructions or products referred to in the content. |
© 2025 by the authors. Licensee MDPI, Basel, Switzerland. This article is an open access article distributed under the terms and conditions of the Creative Commons Attribution (CC BY) license (https://creativecommons.org/licenses/by/4.0/).
Share and Cite
Jung, D.-E.; Yang, S.-B. Development and Application of the Agricultural Product Safety Index in Major Countries and Imported Food Safety Index for Korea. Foods 2025, 14, 2461. https://doi.org/10.3390/foods14142461
Jung D-E, Yang S-B. Development and Application of the Agricultural Product Safety Index in Major Countries and Imported Food Safety Index for Korea. Foods. 2025; 14(14):2461. https://doi.org/10.3390/foods14142461
Chicago/Turabian StyleJung, Da-Eun, and Sung-Bum Yang. 2025. "Development and Application of the Agricultural Product Safety Index in Major Countries and Imported Food Safety Index for Korea" Foods 14, no. 14: 2461. https://doi.org/10.3390/foods14142461
APA StyleJung, D.-E., & Yang, S.-B. (2025). Development and Application of the Agricultural Product Safety Index in Major Countries and Imported Food Safety Index for Korea. Foods, 14(14), 2461. https://doi.org/10.3390/foods14142461