
Lobster Yield Dynamics in a Warming Ocean: A Generalized Linear Modeling Case Study in Prince Edward Island, Canada


 , , ,
, , , 
Abstract
1. Introduction
2. Data and Methods
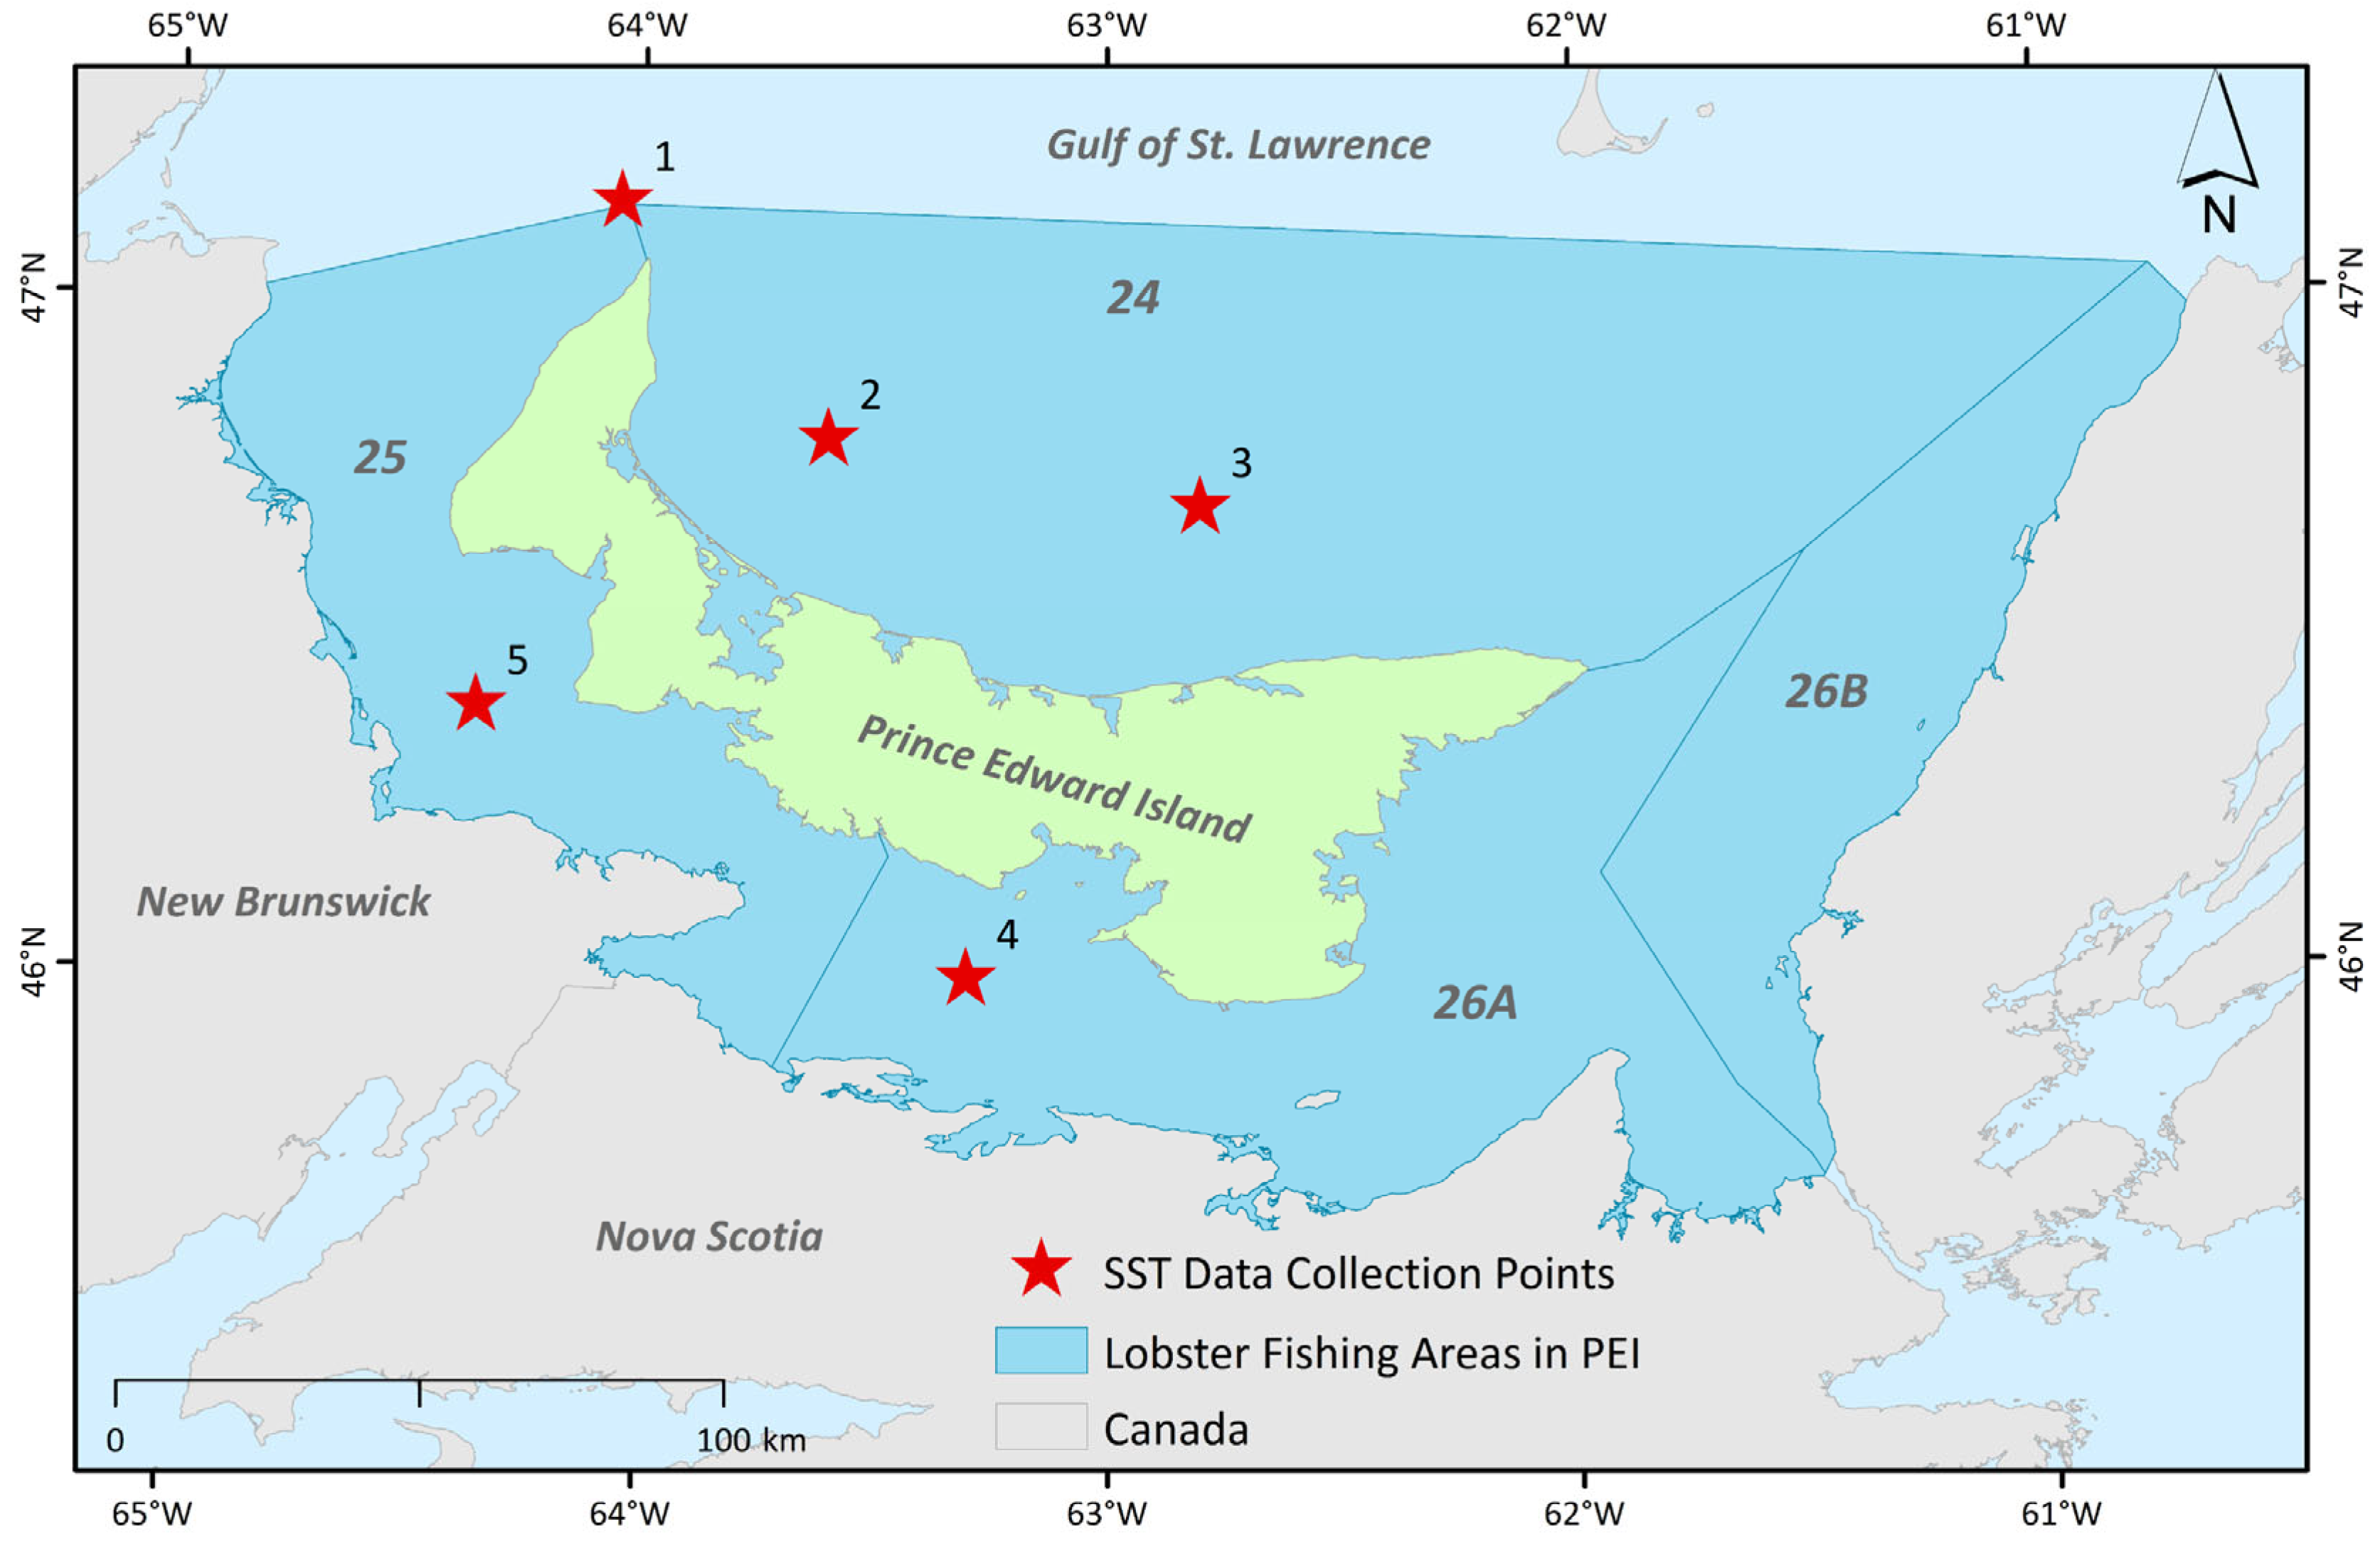
2.1. Data Collection
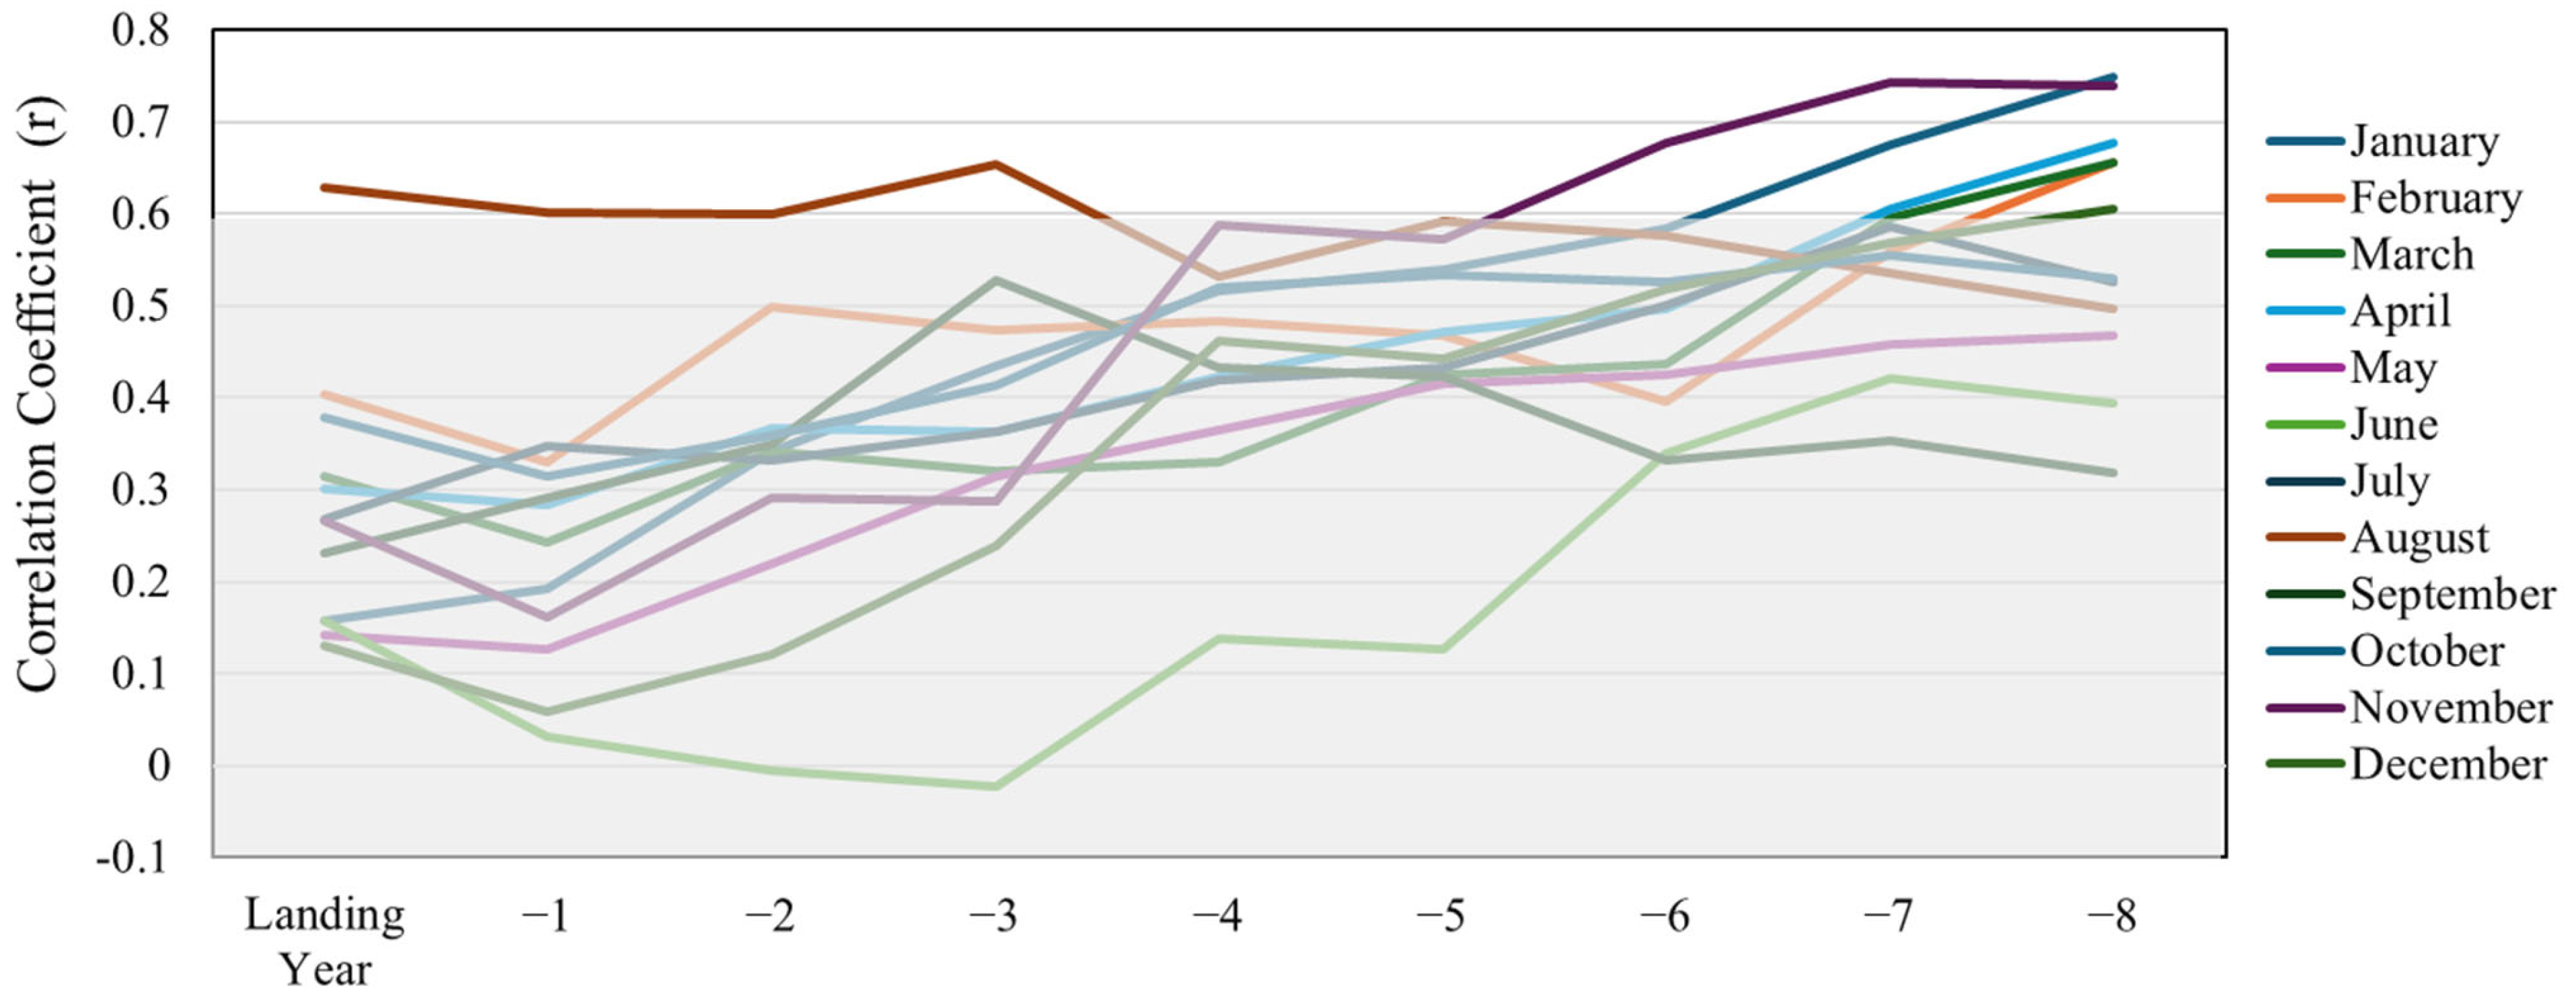
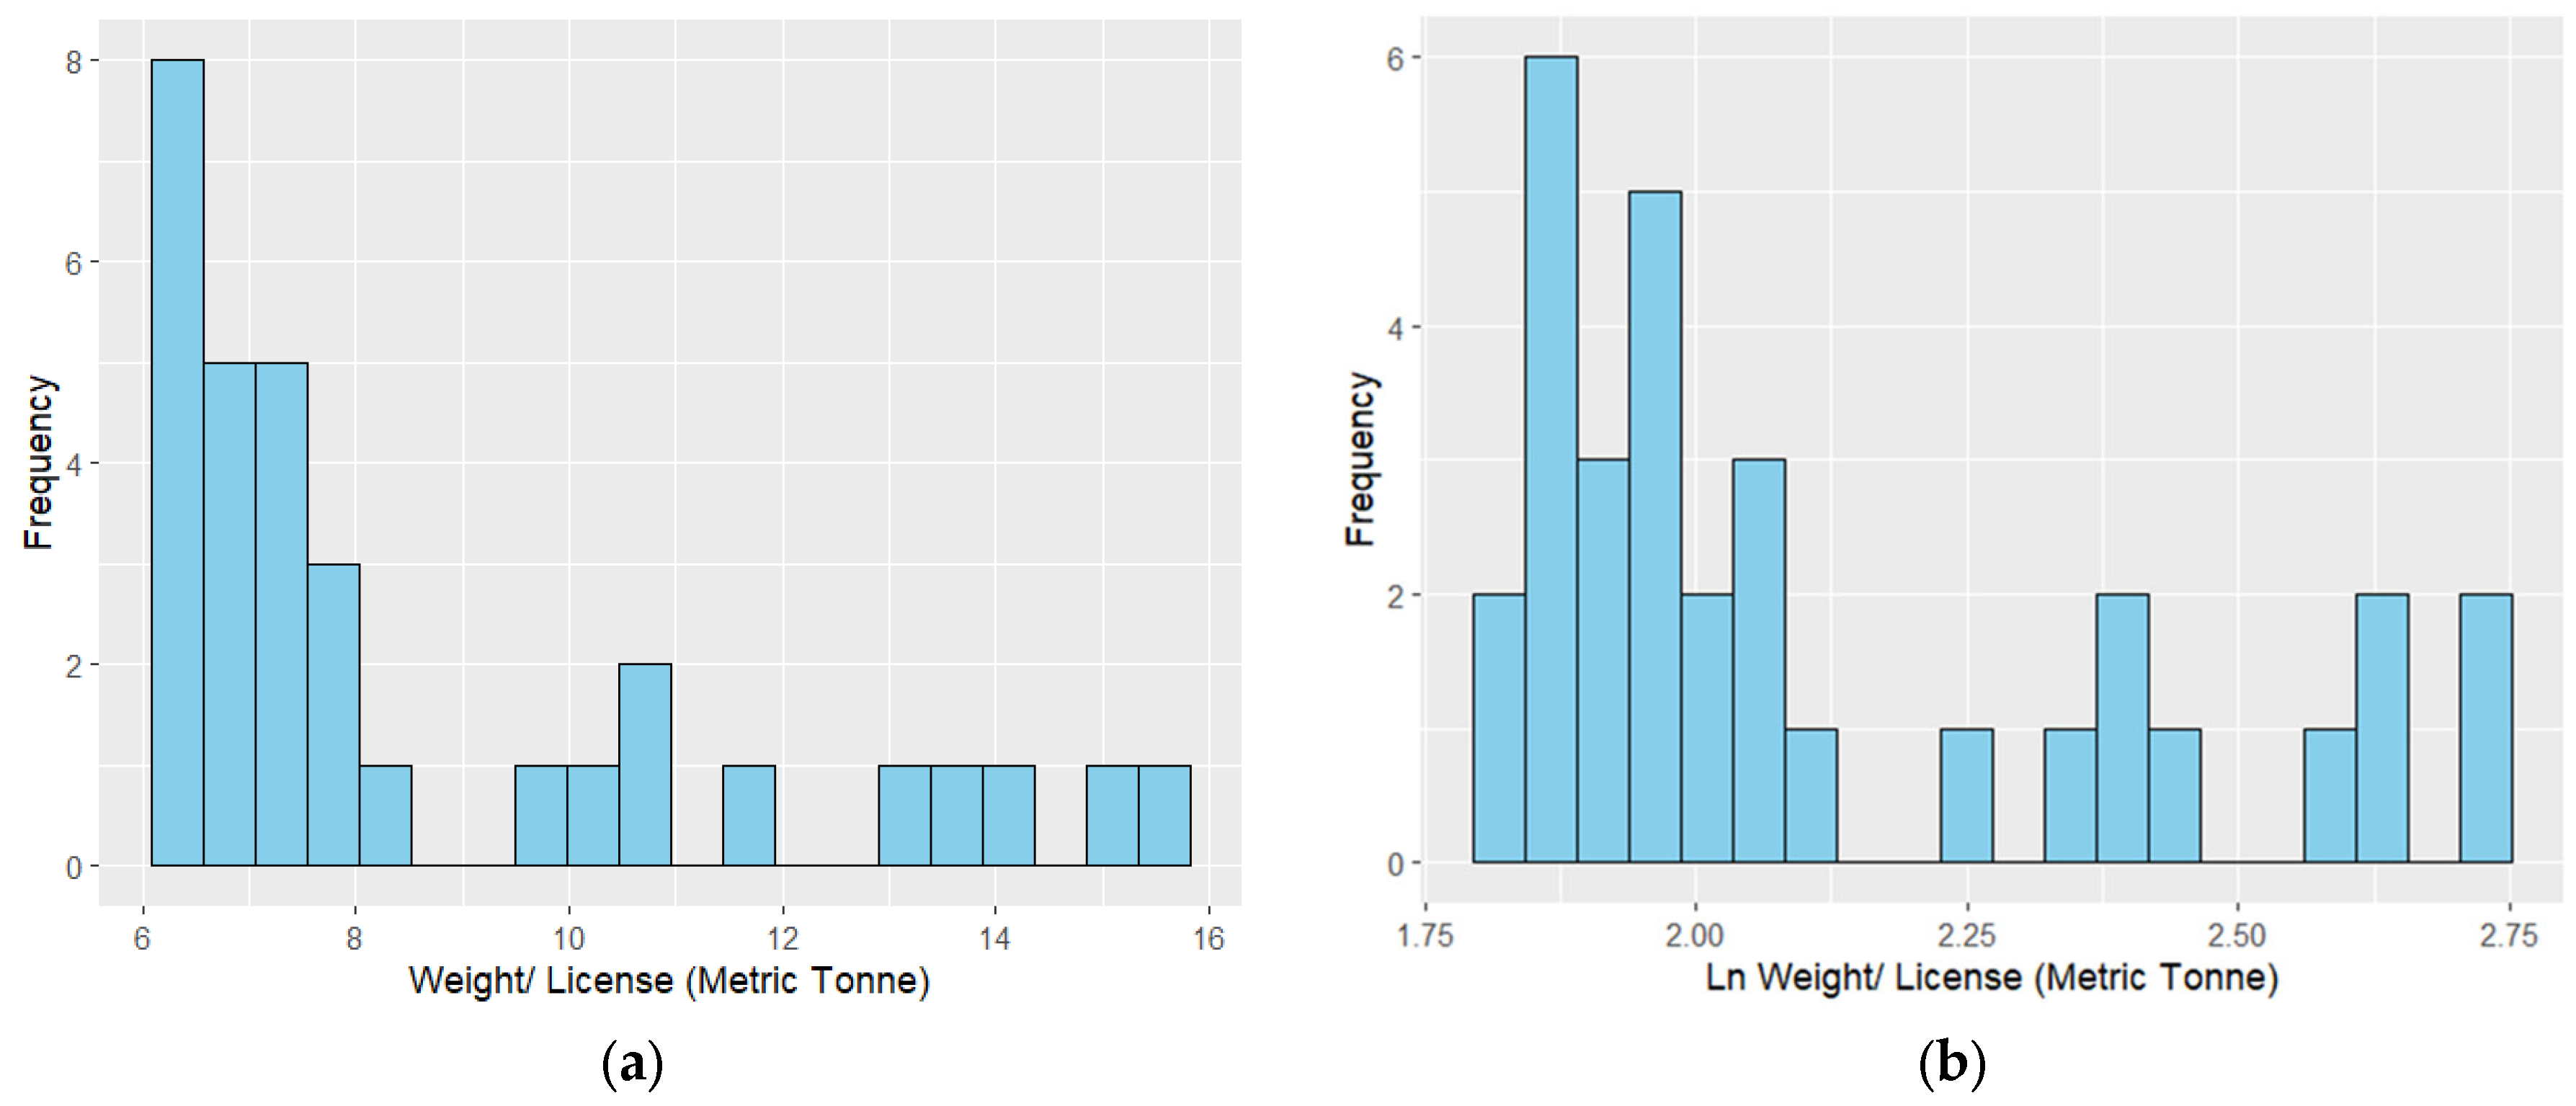
2.2. Feature Selection
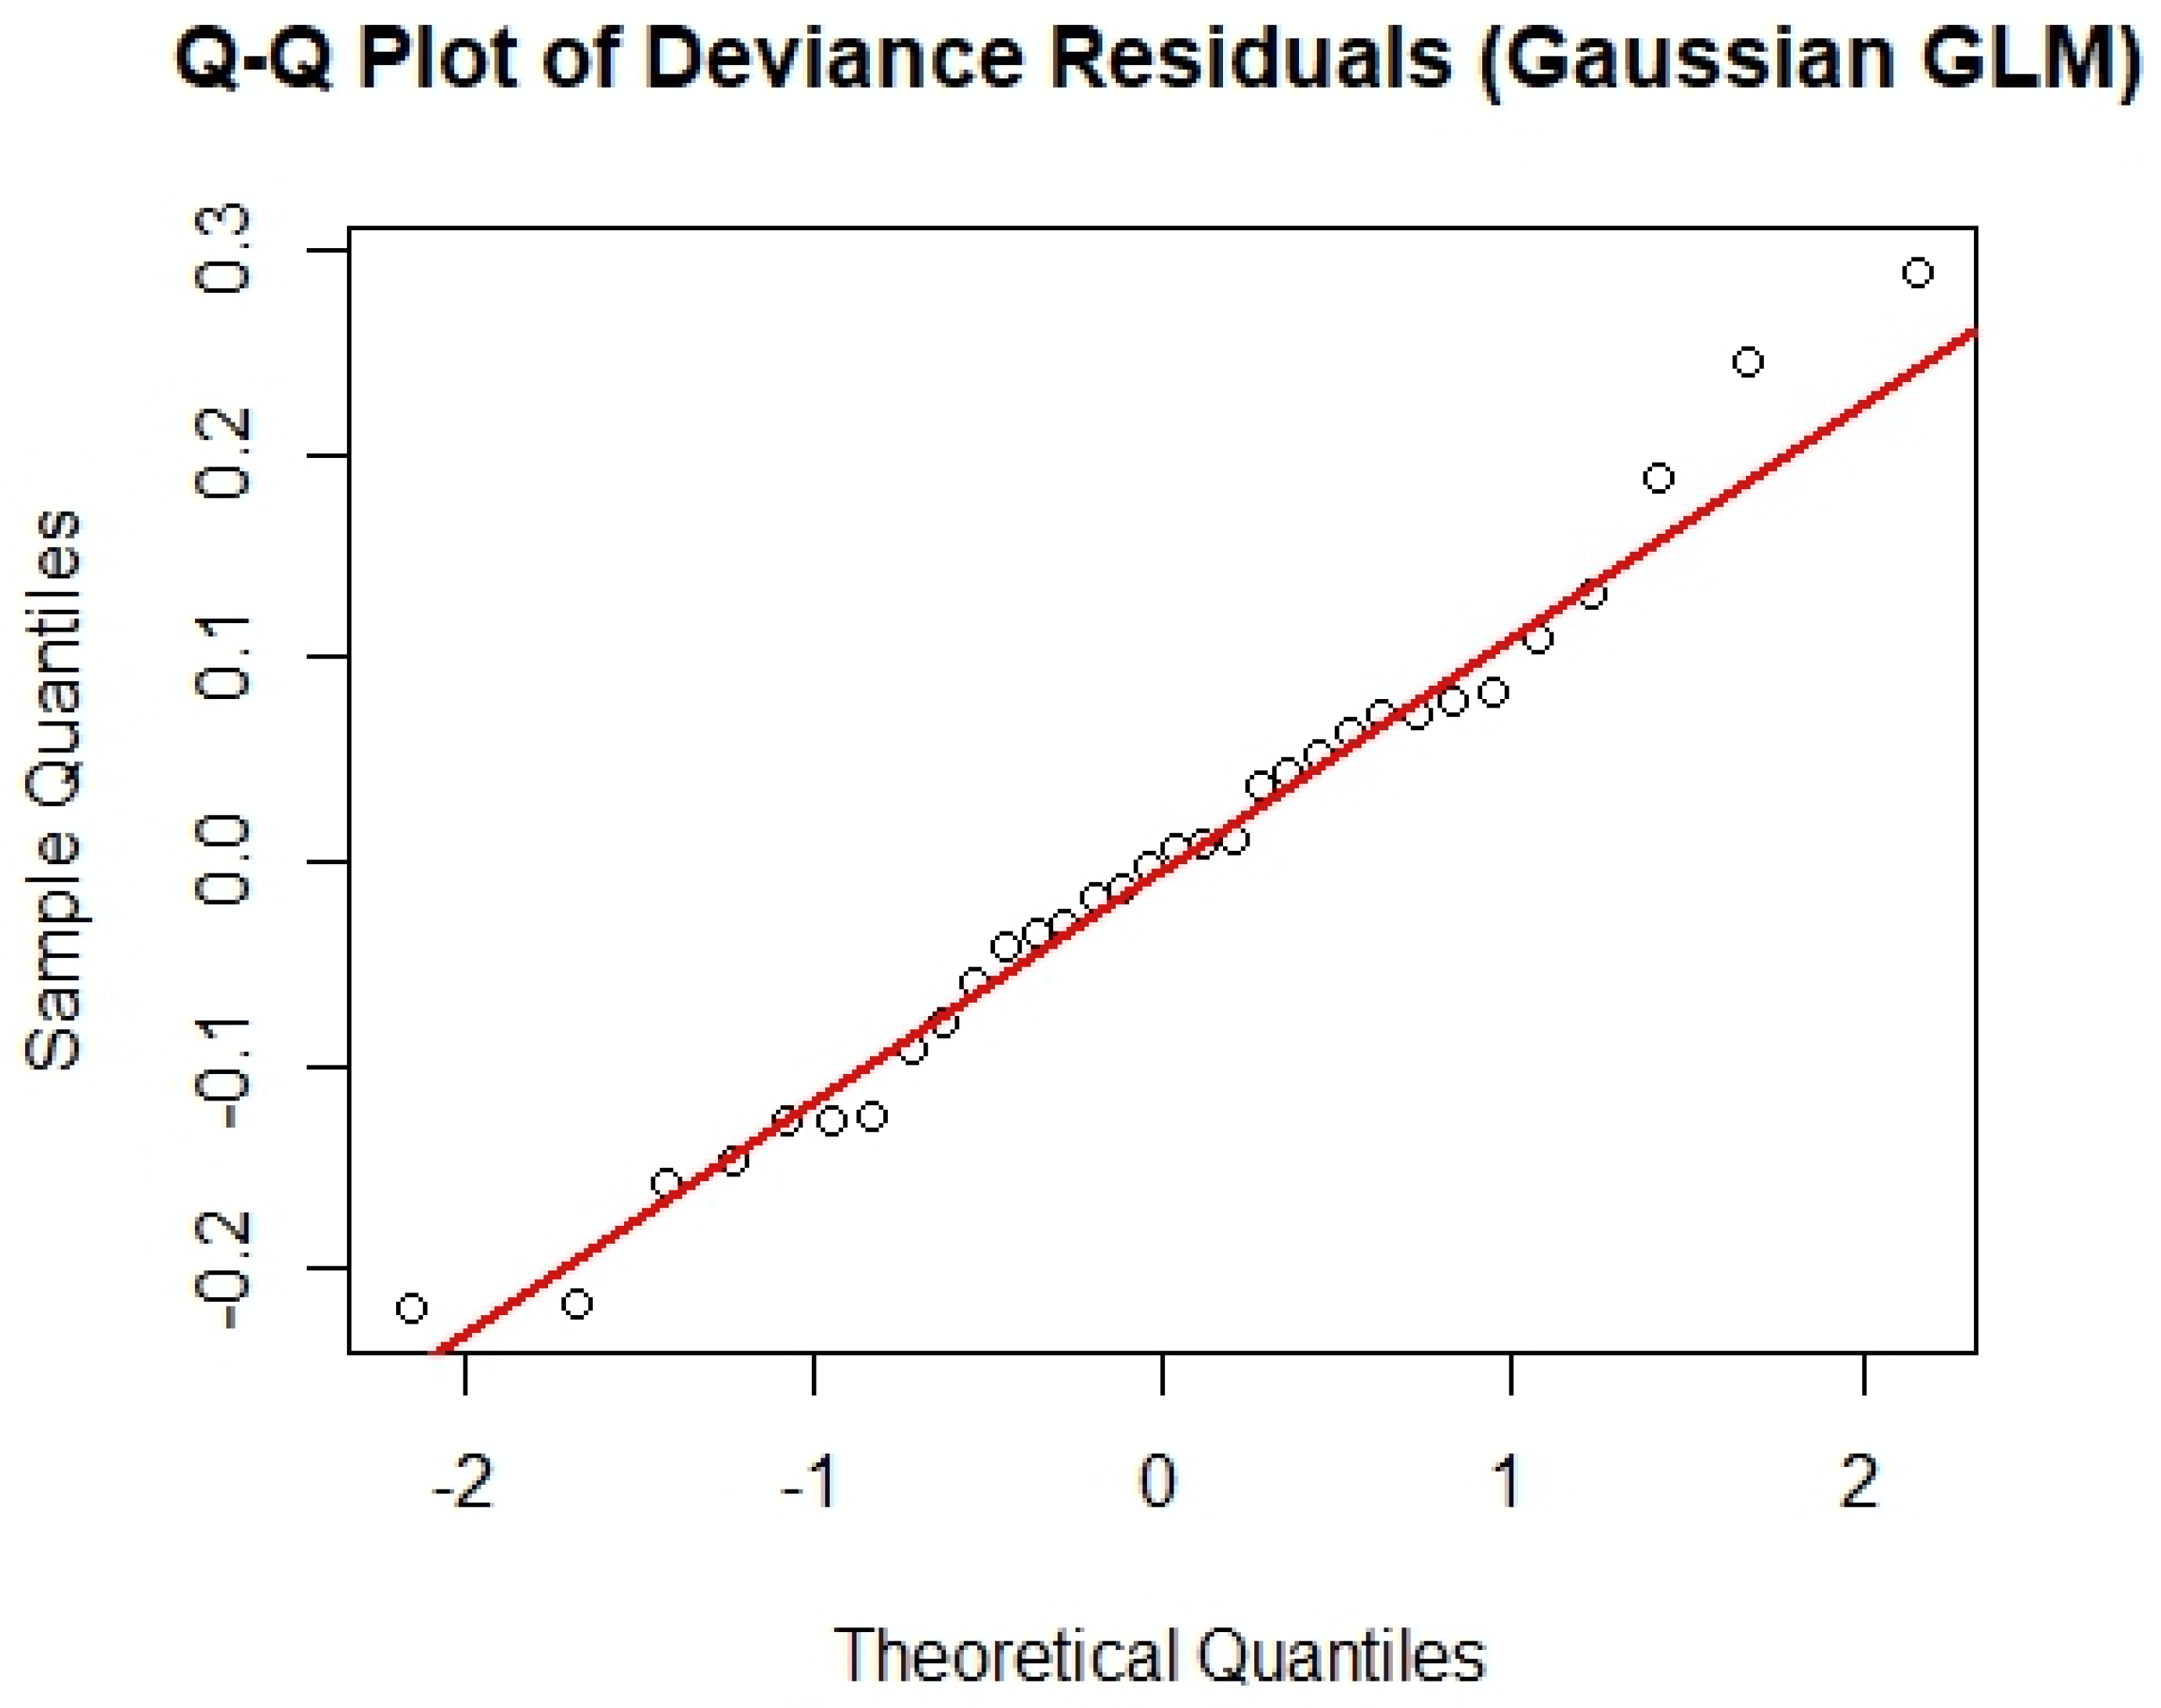
2.3. Model Selection and Statistical Analysis
3. Results
3.1. Lobster Fishery in PEI
3.2. AICc and Generalized Linear Model (GLM) Result
4. Discussions
5. Conclusions
Recommendations for Sustainable Lobster Fisheries
- Conduct expanded studies incorporating biological factors, such as lobster recruitment dynamics, disease prevalence, and predator-prey relationships.
- Evaluate socio-economic factors influencing fishery outcomes, including access to markets and policy regulations.
- Develop predictive models integrating environmental, biological, and economic variables for robust climate-resilient fishery planning.
- Encourage collaboration between researchers, policymakers, and stakeholders to develop adaptive management strategies informed by ongoing scientific research.
- Consider pilot initiatives for habitat restoration and diversification of target species to enhance ecosystem resilience.
Author Contributions
Funding
Institutional Review Board Statement
Informed Consent Statement
Data Availability Statement
Conflicts of Interest
References
- Coulter, M.; PNI Atlantic. P.E.I. lobster fishermen can expect good shore prices this year. The Guardian, 30 April 2018. Available online: https://www.saltwire.com/prince-edward-island/pei-lobster-fishermen-can-expect-good-shore-prices-this-year-206106 (accessed on 8 June 2025).
- Fisheries and Oceans Canada. Information Brochure on the American Lobster. 2022. Available online: https://catalogue.ogsl.ca/dataset/ca-cioos_e9d86c62-9cbb-4cd4-83a2-cff29e626090?local=en (accessed on 10 June 2025).
- P. E. I. Statistics Bureau. Province of Prince Edward Island Forty-Seventh Annual Statistical Review 2020; P. E. I. Statistics Bureau: Charlottetown, PE, Canada, 2021; Available online: https://www.princeedwardisland.ca/sites/default/files/publications/asr_2020_0.pdf (accessed on 10 June 2025).
- Department of Fisheries and Aquaculture. Annual Report 2007–2008; Government of Prince Edward Island: Charlottetown, PE, Canada, 2009. [Google Scholar]
- Lawton, P. Post larval, Juvenile, Adolescent, and Adult Ecology. In Biology of the Lobster Homarus americanus; Academic Press: San Diego, CA, USA, 1995; pp. 47–83. [Google Scholar]
- Pringle, J.D.; Burke, D.L. The Canadian Lobster Fishery and Its Management, with Emphasis on the Scotian Shelf and the Gulf of Maine. Perspect. Can. Mar. Fish. Manag. Can. Bull. Fish. Aquat. Sci. 1993, 226, 91–121. [Google Scholar]
- Cooper, R.A.; Uzmann, J.R. Migrations and Growth of Deep-Sea Lobsters, Homarus americanus. Science 1971, 171, 288–290. [Google Scholar] [CrossRef] [PubMed]
- Cobb, S.J. The American Lobster: The Biology of Homarus americanus; Marine Technical Report No. 49; University of Rhode Island: Kingston, RI, USA, 1976. [Google Scholar]
- Aiken, D.E.; Waddy, S.L. Environmental Influence on Recruitment of the American Lobster Homarus americanus: A Perspective. Can. J. Fish. Aquat. Sci. 1986, 43, 2258–2270. [Google Scholar] [CrossRef]
- Cobb, J.S.; Phillips, B.F. The Biology and Management of Lobsters: Physiology and Behavior, 1st ed.; Elsevier Science: Oxford, UK, 1980. [Google Scholar]
- MacKenzie, C.; Moring, J.R. Species Profiles: Life Histories and Environmental Requirements of Coastal Fishes and Invertebrates (North Atlantic): American Lobster; U.S. Army Corps of Engineers, Coastal Ecology Group, Waterways Experiment Station: Vicksburg, MS, USA, 1985; Available online: http://hdl.handle.net/1834/21283 (accessed on 21 July 2023).
- Quinn, B.K.; Sainte-Marie, B.; Rochette, R.; Ouellet, P. Effect of Temperature on Development Rate of Larvae from Cold-Water American Lobster (Homarus americanus). J. Crustac. Biol. 2013, 33, 527–536. [Google Scholar] [CrossRef]
- Quinn, B.K. Threshold Temperatures for Performance and Survival of American Lobster Larvae: A Review of Current Knowledge and Implications to Modeling Impacts of Climate Change. Fish. Res. 2017, 186, 383–396. [Google Scholar] [CrossRef]
- Wahle, R.A.; Dellinger, L.; Olszewski, S.; Jekielek, P. American Lobster Nurseries of Southern New England Receding in the Face of Climate Change. ICES J. Mar. Sci. 2015, 72 (Suppl. 1), i69–i78. [Google Scholar] [CrossRef]
- García-Echauri, L.L.; Liggins, G.; Cetina-Heredia, P.; Roughan, M.; Coleman, M.A.; Jeffs, A. Future Ocean Temperature Impacting the Survival Prospects of Post-Larval Spiny Lobsters. Mar. Environ. Res. 2020, 156, 104918. [Google Scholar] [CrossRef]
- Drinkwater, K.F.; Tremblay, M.J.; Comeau, M. The Influence of Wind and Temperature on the Catch Rate of the American Lobster (Homarus americanus) during Spring Fisheries off Eastern Canada. Fish. Oceanogr. 2006, 15, 150–165. [Google Scholar] [CrossRef]
- Intergovernmental Panel on Climate Change (IPCC). Climate Change 2021—The Physical Science Basis: Working Group I Contribution to the Sixth Assessment Report of the Intergovernmental Panel on Climate Change, 1st ed.; Cambridge University Press: Cambridge, UK, 2023. [Google Scholar] [CrossRef]
- Intergovernmental Panel on Climate Change (IPCC). The Ocean and Cryosphere in a Changing Climate: Special Report of the Intergovernmental Panel on Climate Change, 1st ed.; Cambridge University Press: Cambridge, UK, 2022. [Google Scholar] [CrossRef]
- Berardelli, J. Maine’s lobster industry is thriving thanks to climate change—But it won’t last if the waters continue to warm. CBS NEWS, 18 December 2021. Available online: https://www.cbsnews.com/news/maine-lobster-climate-change/ (accessed on 8 June 2025).
- Goode, A.G.; Brady, D.C.; Steneck, R.S.; Wahle, R.A. The Brighter Side of Climate Change: How Local Oceanography Amplified a Lobster Boom in the Gulf of Maine. Glob. Change Biol. 2019, 25, 3906–3917. [Google Scholar] [CrossRef]
- Oppenheim, N.G.; Wahle, R.A.; Brady, D.C.; Goode, A.G.; Pershing, A.J. The Cresting Wave: Larval Settlement and Ocean Temperatures Predict Change in the American Lobster Harvest. Ecol. Appl. 2019, 29, e02006. [Google Scholar] [CrossRef]
- Merchant, C.J.; Embury, O.; Bulgin, C.E.; Block, T.; Corlett, G.K.; Fiedler, E.; Good, S.A.; Mittaz, J.; Rayner, N.A.; Berry, D.; et al. Satellite-Based Time-Series of Sea-Surface Temperature since 1981 for Climate Applications. Sci. Data 2019, 6, 223. [Google Scholar] [CrossRef] [PubMed]
- Andrews, M.B.; Ridley, J.K.; Wood, R.A.; Andrews, T.; Blockley, E.W.; Booth, B.; Burke, E.; Dittus, A.J.; Florek, P.; Gray, L.J.; et al. Historical Simulations with HadGEM3-GC3.1 for CMIP6. J. Adv. Model. Earth Syst. 2020, 12, e2019MS001995. [Google Scholar] [CrossRef]
- Siedlecki, S.A.; Salisbury, J.; Gledhill, D.K.; Bastidas, C.; Meseck, S.; McGarry, K.; Hunt, C.W.; Alexander, M.; Lavoie, D.; Wang, Z.A. Projecting Ocean Acidification Impacts for the Gulf of Maine to 2050: New Tools and Expectations. Elem. Sci. Anthr. 2021, 9, 00062. [Google Scholar] [CrossRef]
- Thakur, K.K.; Revie, C.; Stryhn, H.; Tibbetts, S.S.; Lavallée, J.; Vanderstichel, R. Risk Factors Associated with Soft-Shelled Lobsters (Homarus americanus) in Southwestern Nova Scotia, Canada. FACETS 2017, 2, 15–33. [Google Scholar] [CrossRef]
- Wilder, D.G. The Growth Rate of the American Lobster (Homarus americanus). J. Fish. Res. Board Can. 1953, 10, 371–412. [Google Scholar] [CrossRef]
- Tremblay, M.J.; Eagles, M.D. Recent Trends in the Lobster Fishery off Eastern Cape Breton (LFA’s 27-30): Catch Rate and Exploitation. DFO Atlantic Fisheries Research Document 96/141. 1996. Available online: https://waves-vagues.dfo-mpo.gc.ca/library-bibliotheque/211172.pdf (accessed on 10 June 2025).
- NOAA Fisheries. Fun Facts About Luscious Lobsters. NOAA Fisheries. Available online: https://www.fisheries.noaa.gov/national/outreach-and-education/fun-facts-about-luscious-lobsters#how-does-a-lobster-grow (accessed on 8 June 2025).
- Huntsberger, C.J.; Kilada, R.; Ambrose Jr, W.G.; Wahle, R.A. Age-at-Size Relationships of the American Lobster (Homarus americanus) from Three Contrasting Thermal Regimes Using Gastric Mill Band Counts as a Direct Aging Technique. Can. J. Fish. Aquat. Sci. 2020, 77, 1733–1740. [Google Scholar] [CrossRef]
- Maqsood, J.; Wang, X.; Farooque, A.A.; Nawaz, R.A. Future Projections of Temperature-Related Indices in Prince Edward Island Using Ensemble Average of Three CMIP6 Models. Sci. Rep. 2024, 14, 12661. [Google Scholar] [CrossRef]
- Gardner, C.; Larkin, S.; Seijo, J.C. Systems to Maximize Economic Benefits in Lobster Fisheries. In Lobsters: Biology, Management, Aquaculture and Fisheries; Phillips, B.F., Ed.; Wiley: Hoboken, NJ, USA, 2013; pp. 113–138. [Google Scholar] [CrossRef]
- Waterman, M. Ocean Acidification May Affect Lobster Molt, Reproduction. Maine Lobstermen’s Community Alliance, 12 August 2018. [Google Scholar]
- Intergovernmental Panel on Climate Change (IPCC). Climate Change 2022—Impacts, Adaptation and Vulnerability: Working Group II Contribution to the Sixth Assessment Report of the Intergovernmental Panel on Climate Change, 1st ed.; Cambridge University Press: Cambridge, UK, 2023. [Google Scholar] [CrossRef]
- McLeese, D.W.; Wilder, D.G. The Activity and Catchability of the Lobster (Homarus americanus) in Relation to Temperature. J. Fish. Board Can. 1958, 15, 1345–1354. [Google Scholar] [CrossRef]
- Greenhalgh, E. Climate & Lobsters. Climate.gov. Available online: https://www.climate.gov/news-features/climate-and/climate-lobsters (accessed on 8 June 2025).
- Carloni, J.T.; Wahle, R.; Geoghegan, P.; Bjorkstedt, E. Bridging the Spawner-Recruit Disconnect: Trends in American Lobster Recruitment Linked to the Pelagic Food Web. Bull. Mar. Sci. 2018, 94, 719–735. [Google Scholar] [CrossRef]
- Templeman, W. Local Differences in the Life History of the Lobster (Homarus americanus) on the Coast of the Maritime Provinces of Canada. J. Biol. Board Can. 1936, 2, 41–88. [Google Scholar] [CrossRef]
- Perkins, H.C. Developmental Rates at Various Temperatures of Embryos of the Northern Lobster (Homarus americanus Milne-Edwards). U.S. Dep. Commer. Fish. Bull. 1972, 70, 95–99. [Google Scholar]
- Harding, G.C.; Vass, W.P.; Drinkwter, K.F. Aspects of Larval American Lobster (Homarus americanus) Ecology in St. Georges Bay, Nova Scotia. Can. J. Fish. Aquat. Sci. 1982, 39, 1117–1129. [Google Scholar] [CrossRef]
- Harding, G.C.; Drinkwater, K.F.; Vass, W.P. Factors Influencing the Size of American Lobster (Homarus americanus) Stocks along the Atlantic Coast of Nova Scotia, Gulf of St. Lawrence, and Gulf of Maine: A New Synthesis. Can. J. Fish. Aquat. Sci. 1983, 40, 168–184. [Google Scholar] [CrossRef]
- Hughes, J.T.; Matthiessen, G.C. Observations on the Biology of the American Lobster, Homarus americanus. Limnol. Oceanogr. 1962, 7, 414–421. [Google Scholar] [CrossRef]
- Huntsman, A.G. Natural Lobster Breeding; Bulletin of the Biological Board of Canada; 5; Biological Board of Canada: Toronto, ON, Canada, 1923; pp. 1–11. [Google Scholar]
- Caddy, J.F. The Influence of Variations in the Seasonal Temperature Regime on Survival of Larval Stages of the American Lobster (Homarus americanus) in the Southern Gulf of St. Lawrence [Canada]; Rapports et Proces-Verbaux des Reunions: Charlottenlund, Denmark, 1976; Volume 175, pp. 204–216. [Google Scholar]
- MacKenzie, B.R. Assessment of Temperature Effects on Interrelationships between Stage Durations, Mortality, and Growth in Laboratory-Reared Homarus americanus Milne Edwards Larvae. J. Exp. Mar. Biol. Ecol. 1988, 116, 87–98. [Google Scholar] [CrossRef]
- Ennis, G.P. Chapter 3—Larval and Postlarval Ecology. In Biology of the Lobster; Factor, J.R., Ed.; Academic Press: San Diego, CA, USA, 1995; pp. 23–46. [Google Scholar] [CrossRef]
- Wright, D.; Liu, Y. Assessing the Impact of Environmental Variability on Harvest in a Heterogeneous Fishery: A Case Study of the Canadian Lobster Fishery. J. Environ. Econ. Policy 2024, 13, 55–69. [Google Scholar] [CrossRef]
- Perkins, H.C. Egg Loss during Incubation from Offshore Northern Lobsters (Decapoda: Homaridae). Fish. Bull. 1971, 69, 451–453. [Google Scholar]
- Templeman, W. The Influence of Temperature, Salinity, Light and Food Conditions on the Survival and Growth of the Larvae of the Lobster (Homarus americanus). J. Biol. Board Can. 1936, 2, 485–497. [Google Scholar] [CrossRef]
- Watson, W.H.; Jury, S.H.; Gutzler, B.C.; Lippmann, T.C.; Choi, J.-G.; Carloni, J.T.; Goldstein, J.S. How Might Climate Change Affect American Lobsters? Front. Young Minds 2023, 11, 1031267. [Google Scholar] [CrossRef]
- Aiken, D.E.; Waddy, S.L. Controlling Growth and Reproduction in the American Lobster. Proc. Annu. Meet.—World Maric. Soc. 1976, 7, 415–430. [Google Scholar] [CrossRef]
- Quinn, B.K.; Rochette, R. Potential Effect of Variation in Water Temperature on Development Time of American Lobster Larvae. ICES J. Mar. Sci. 2015, 72 (Suppl. 1), i79–i90. [Google Scholar] [CrossRef]
- Templeman, W. The Effect of Environmental Conditions on the Survival of Lobster Larvae; 183; Atlantic Biological Station: St. Andrews, NB, Canada, 1933. [Google Scholar]
- Mills, K.E.; Pershing, A.J.; Brown, C.J.; Chen, Y.; Chiang, F.-S.; Holland, D.S.; Lehuta, S.; Nye, J.A.; Sun, J.C.; Thomas, A.C. Fisheries Management in a Changing Climate: Lessons from the 2012 Ocean Heat Wave in the Northwest Atlantic. Oceanography 2013, 26, 191–195. [Google Scholar] [CrossRef]


| Variable | Correlation Coefficient (Landing) | Correlation Coefficient (Landing per License) | AICc |
|---|---|---|---|
| avg_8 | 0.75 | 0.839 | −21.19 |
| avg_7 | 0.75 | 0.796 | −15.01 |
| CL | 0.71 | 0.721 | −8.48 |
| nov_6 | 0.67 | 0.677 | −3.86 |
| aug_3 | 0.65 | 0.652 | −0.29 |
| aug_0 | 0.63 | 0.628 | 0.50 |
| aug_2 | 0.59 | 0.600 | 1.93 |
| aug_1 | 0.59 | 0.600 | 2.81 |
| Variable | Correlation Coefficient (Landing) | Correlation Coefficient (Landing per License) | AICc |
|---|---|---|---|
| avg_8 | 0.75 | 0.839 | −21.19 |
| avg_7 | 0.75 | 0.796 | −15.01 |
| nov_7 | 0.74 | 0.742 | −10.22 |
| nov_8 | 0.74 | 0.739 | −8.91 |
| CL | 0.71 | 0.721 | −8.48 |
| jan_8 | 0.76 | 0.749 | −8.36 |
| nov_6 | 0.67 | 0.677 | −3.86 |
| jan_7 | 0.67 | 0.674 | −2.24 |
| apr_8 | 0.68 | 0.677 | −0.54 |
| aug_3 | 0.65 | 0.652 | −0.29 |
| feb_8 | 0.66 | 0.655 | 0.25 |
| aug_0 | 0.63 | 0.628 | 0.50 |
| aug_2 | 0.59 | 0.600 | 1.93 |
| dec_8 | 0.61 | 0.605 | 2.08 |
| mar_8 | 0.65 | 0.655 | 2.13 |
| aug_1 | 0.59 | 0.600 | 2.81 |
| apr_7 | 0.60 | 0.605 | 3.84 |
| Model # | Intercept | aug_0 | aug_1 | aug_2 | aug_3 | avg_7 | avg_8 | CL | nov_6 | R2 | AICc | Akaike Weight |
|---|---|---|---|---|---|---|---|---|---|---|---|---|
| 171 | −1.543 | 0.0657 | 0.0822 | 0.333 | 0.0919 | 0.8566 | −35.9 | 0.194 | ||||
| 169 | −0.503 | 0.0811 | 0.3606 | 0.1238 | 0.8343 | −34.3 | 0.088 | |||||
| 44 | −2.48 | 0.0634 | 0.0870 | 0.0789 | 0.3378 | 0.8464 | −33.7 | 0.065 | ||||
| 172 | −1.943 | 0.0337 | 0.0669 | 0.0754 | 0.3236 | 0.0724 | 0.8611 | −33.6 | 0.062 | |||
| 48 | −3.369 | 0.0659 | 0.0812 | 0.0535 | 0.0773 | 0.2833 | 0.8599 | −33.3 | 0.054 | |||
| 175 | −1.964 | 0.0666 | 0.0241 | 0.0835 | 0.313 | 0.0821 | 0.859 | −33.1 | 0.049 | |||
| 235 | −1.502 | 0.0712 | 0.0883 | 0.3414 | −0.0044 | 0.0970 | 0.8574 | −32.7 | 0.041 | |||
| 43 | −1.852 | 0.0973 | 0.0981 | 0.3702 | 0.8256 | −32.7 | 0.039 | |||||
| 170 | −0.8477 | 0.03055 | 0.0749 | 0.3526 | 0.1067 | 0.8379 | −32 | 0.027 | ||||
| 47 | −2.658 | 0.0923 | 0.0500 | 0.0973 | 0.3205 | 0.8375 | −31.9 | 0.026 | ||||
| 163 | −0.1374 | 0.0643 | 0.3951 | 0.1126 | 0.8206 | −31.8 | 0.025 | |||||
| 173 | −0.8547 | 0.0208 | 0.0822 | 0.3437 | 0.1157 | 0.8361 | −31.6 | 0.023 | ||||
| 233 | −0.6446 | 0.0744 | 0.3487 | 0.0048 | 0.1152 | 0.8354 | −31.5 | 0.021 | ||||
| 176 | −2.692 | 0.0438 | 0.06873 | 0.0359 | 0.0753 | 0.291 | 0.0519 | 0.866 | −31.1 | 0.018 | ||
| 161 | 0.8618 | 0.4213 | 0.1435 | 0.7993 | −31 | 0.017 | ||||||
| 164 | −0.9528 | 0.0532 | 0.06643 | 0.3722 | 0.0790 | 0.8324 | −30.9 | 0.016 | ||||
| 112 | −3.653 | 0.0780 | 0.09726 | 0.0676 | 0.0921 | 0.2912 | −0.0118 | 0.8647 | −30.8 | 0.016 | ||
| 36 | −1.491 | 0.0868 | 0.08842 | 0.3902 | 0.8149 | −30.7 | 0.015 | |||||
| 108 | −2.491 | 0.0659 | 0.09094 | 0.0823 | 0.3427 | −0.0026 | 0.8467 | −30.4 | 0.013 | |||
| 236 | −1.932 | 0.0380 | 0.07557 | 0.0838 | 0.3353 | −0.0067 | 0.0777 | 0.8629 | −30.4 | 0.013 | ||
| 40 | −2.445 | 0.0889 | 0.08226 | 0.0561 | 0.332 | 0.8297 | −30.4 | 0.012 | ||||
| 225 | 0.1357 | 0.373 | 0.0139 | 0.1141 | 0.8109 | −30.1 | 0.011 | |||||
| 239 | −2.009 | 0.07583 | 0.0304 | 0.0937 | 0.3214 | −0.0071 | 0.0878 | 0.8609 | −29.9 | 0.01 | ||
| 162 | 0.1269 | 0.0499 | 0.4006 | 0.113 | 0.8097 | −29.9 | 0.01 | |||||
| 107 | −1.876 | 0.08995 | 0.0910 | 0.3595 | 0.0044 | 0.8266 | −29.8 | 0.009 |
| avg_8 | aug_3 | aug_1 | nov_6 | aug_0 | aug_2 | CL | |
|---|---|---|---|---|---|---|---|
| The sum of weights: | 1 | 0.85 | 0.75 | 0.72 | 0.39 | 0.27 | 0.18 |
| N containing models: | 40 | 25 | 25 | 27 | 22 | 17 | 16 |
| Estimate | SE | t-Value | p-Value | |
|---|---|---|---|---|
| Intercept | −1.876 | 0.832 | −2.255 | 0.033 * |
| aug_1 | 0.090 | 0.038 | 2.392 | 0.024 * |
| aug_3 | 0.091 | 0.039 | 2.347 | 0.027 * |
| avg_8 | 0.360 | 0.071 | 5.033 | 2.78 × 10⁻⁵ ** |
| CL | 0.004 | 0.012 | 0.381 | 0.706 |
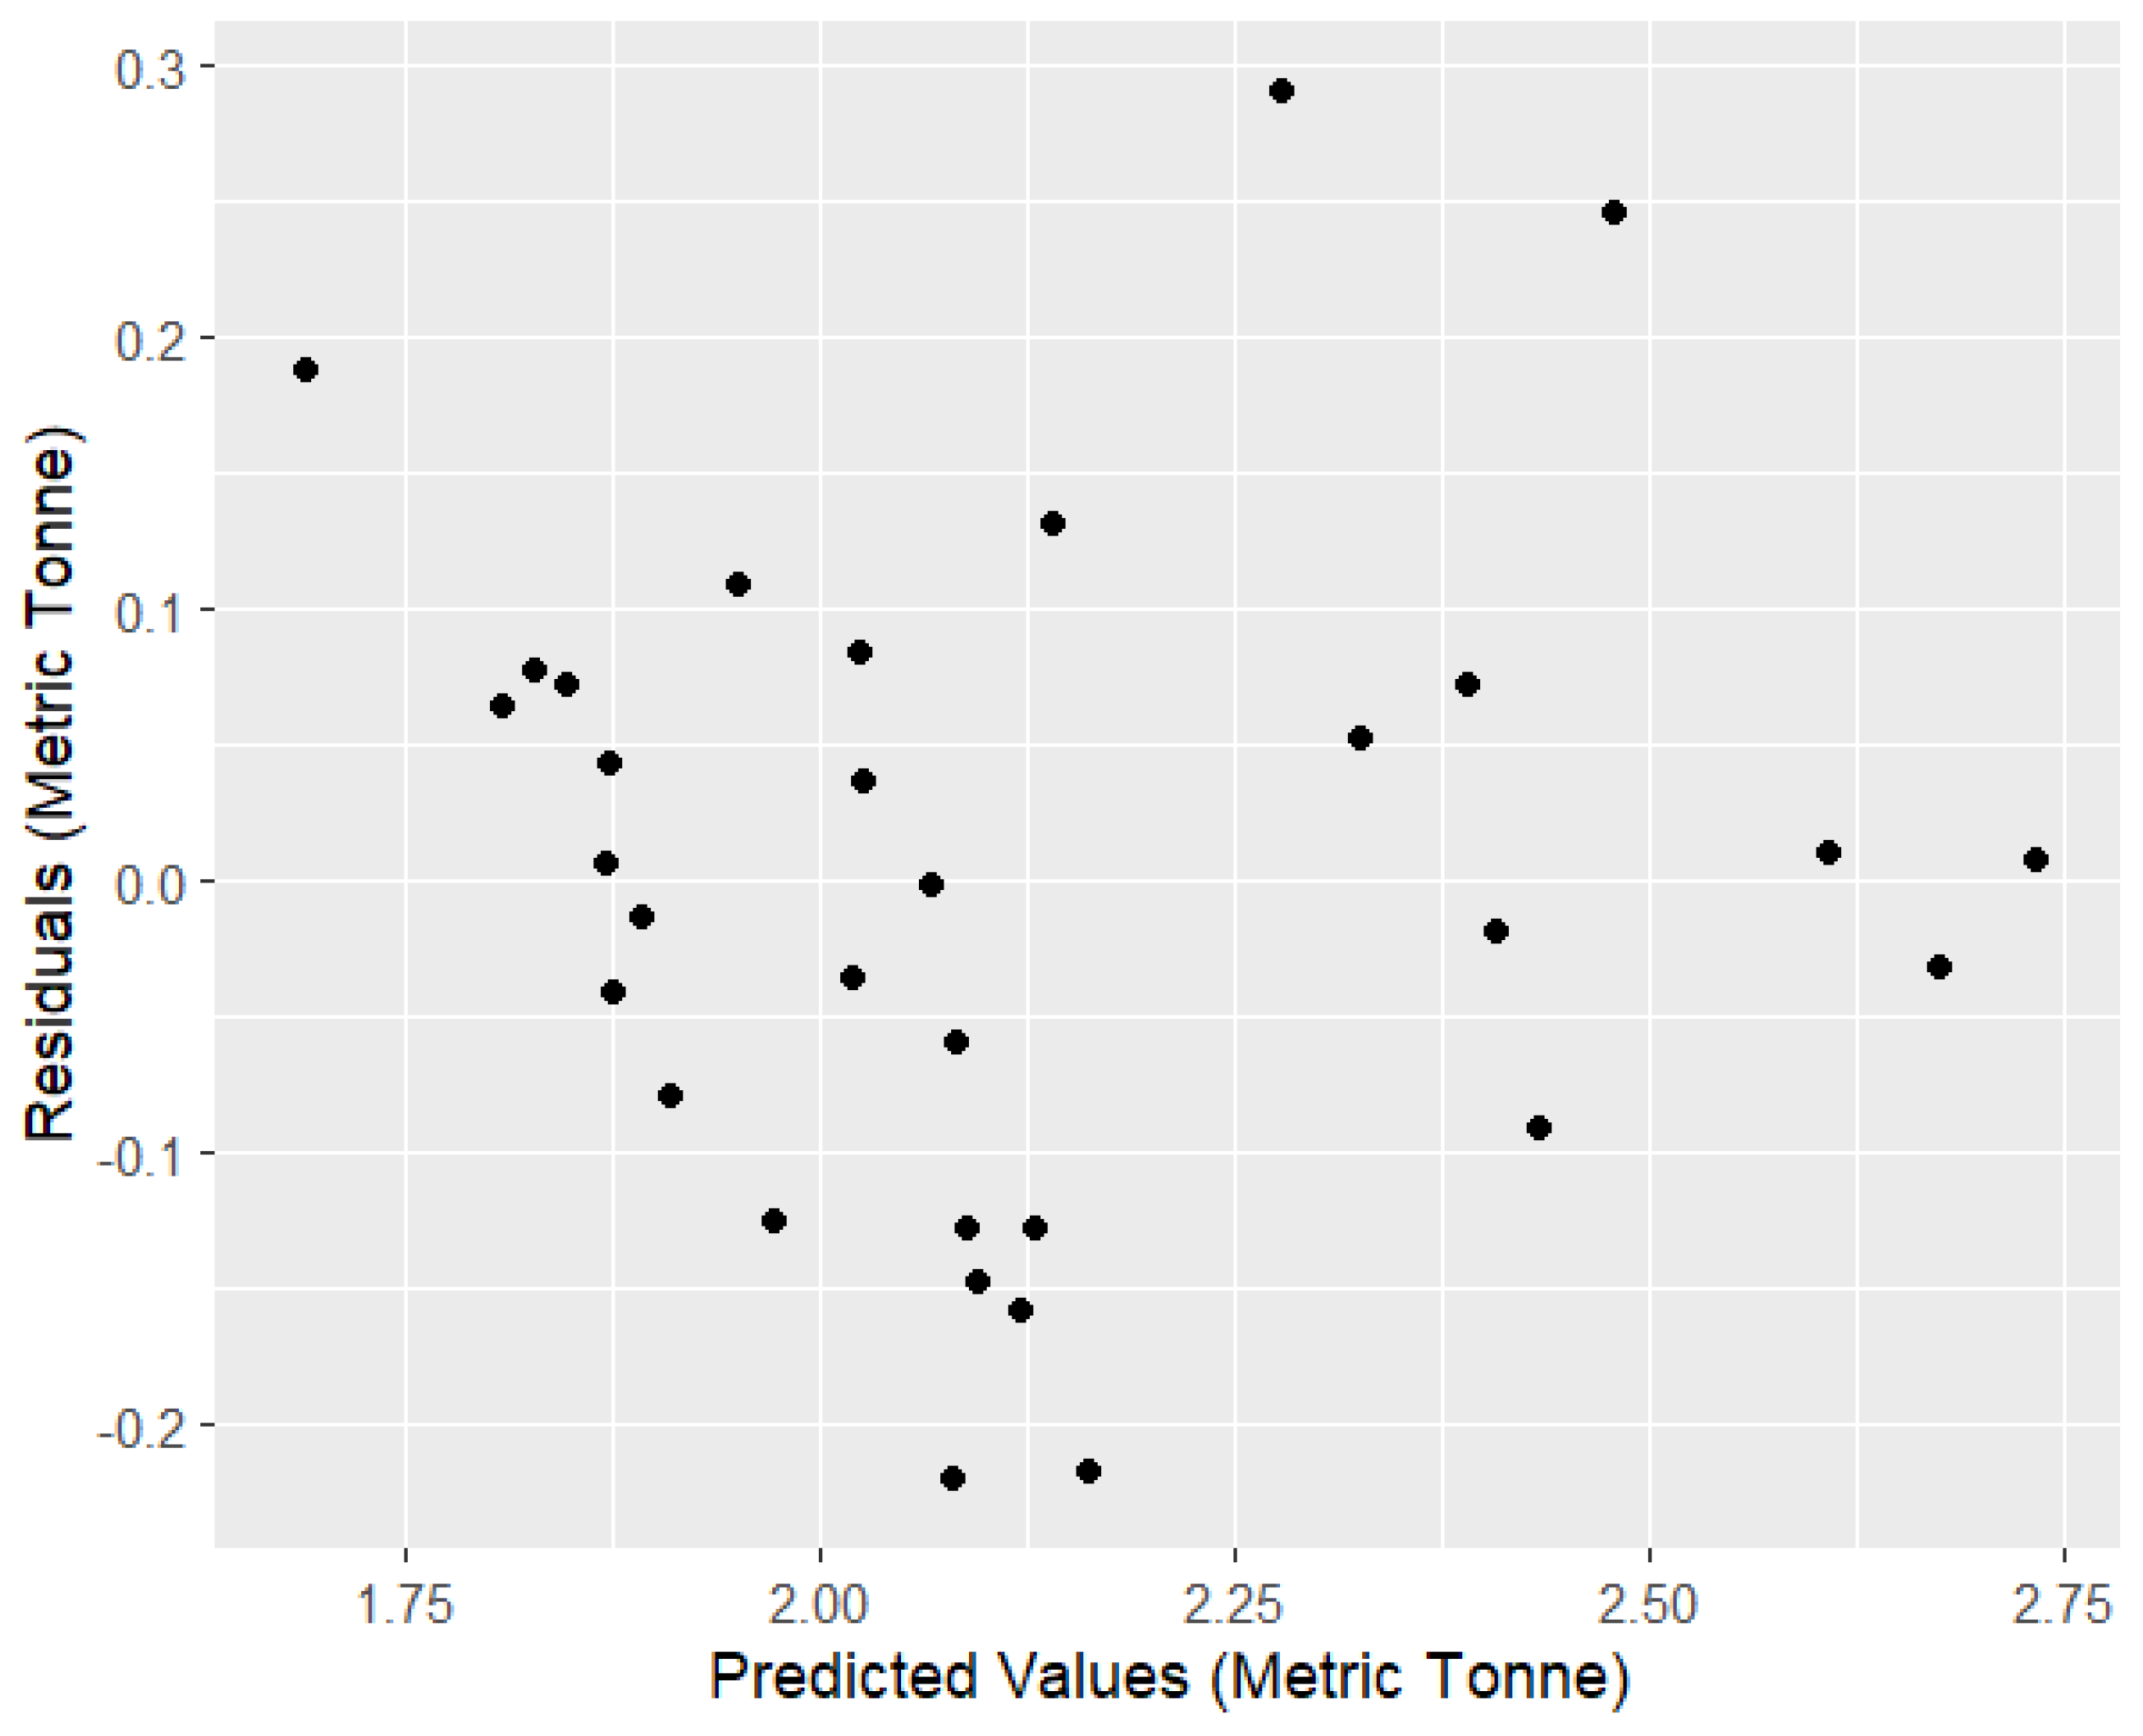
| Min | 1Q | Median | 3Q | Max |
|---|---|---|---|---|
| −0.220 | −0.082 | −0.003 | 0.072 | 0.290 |
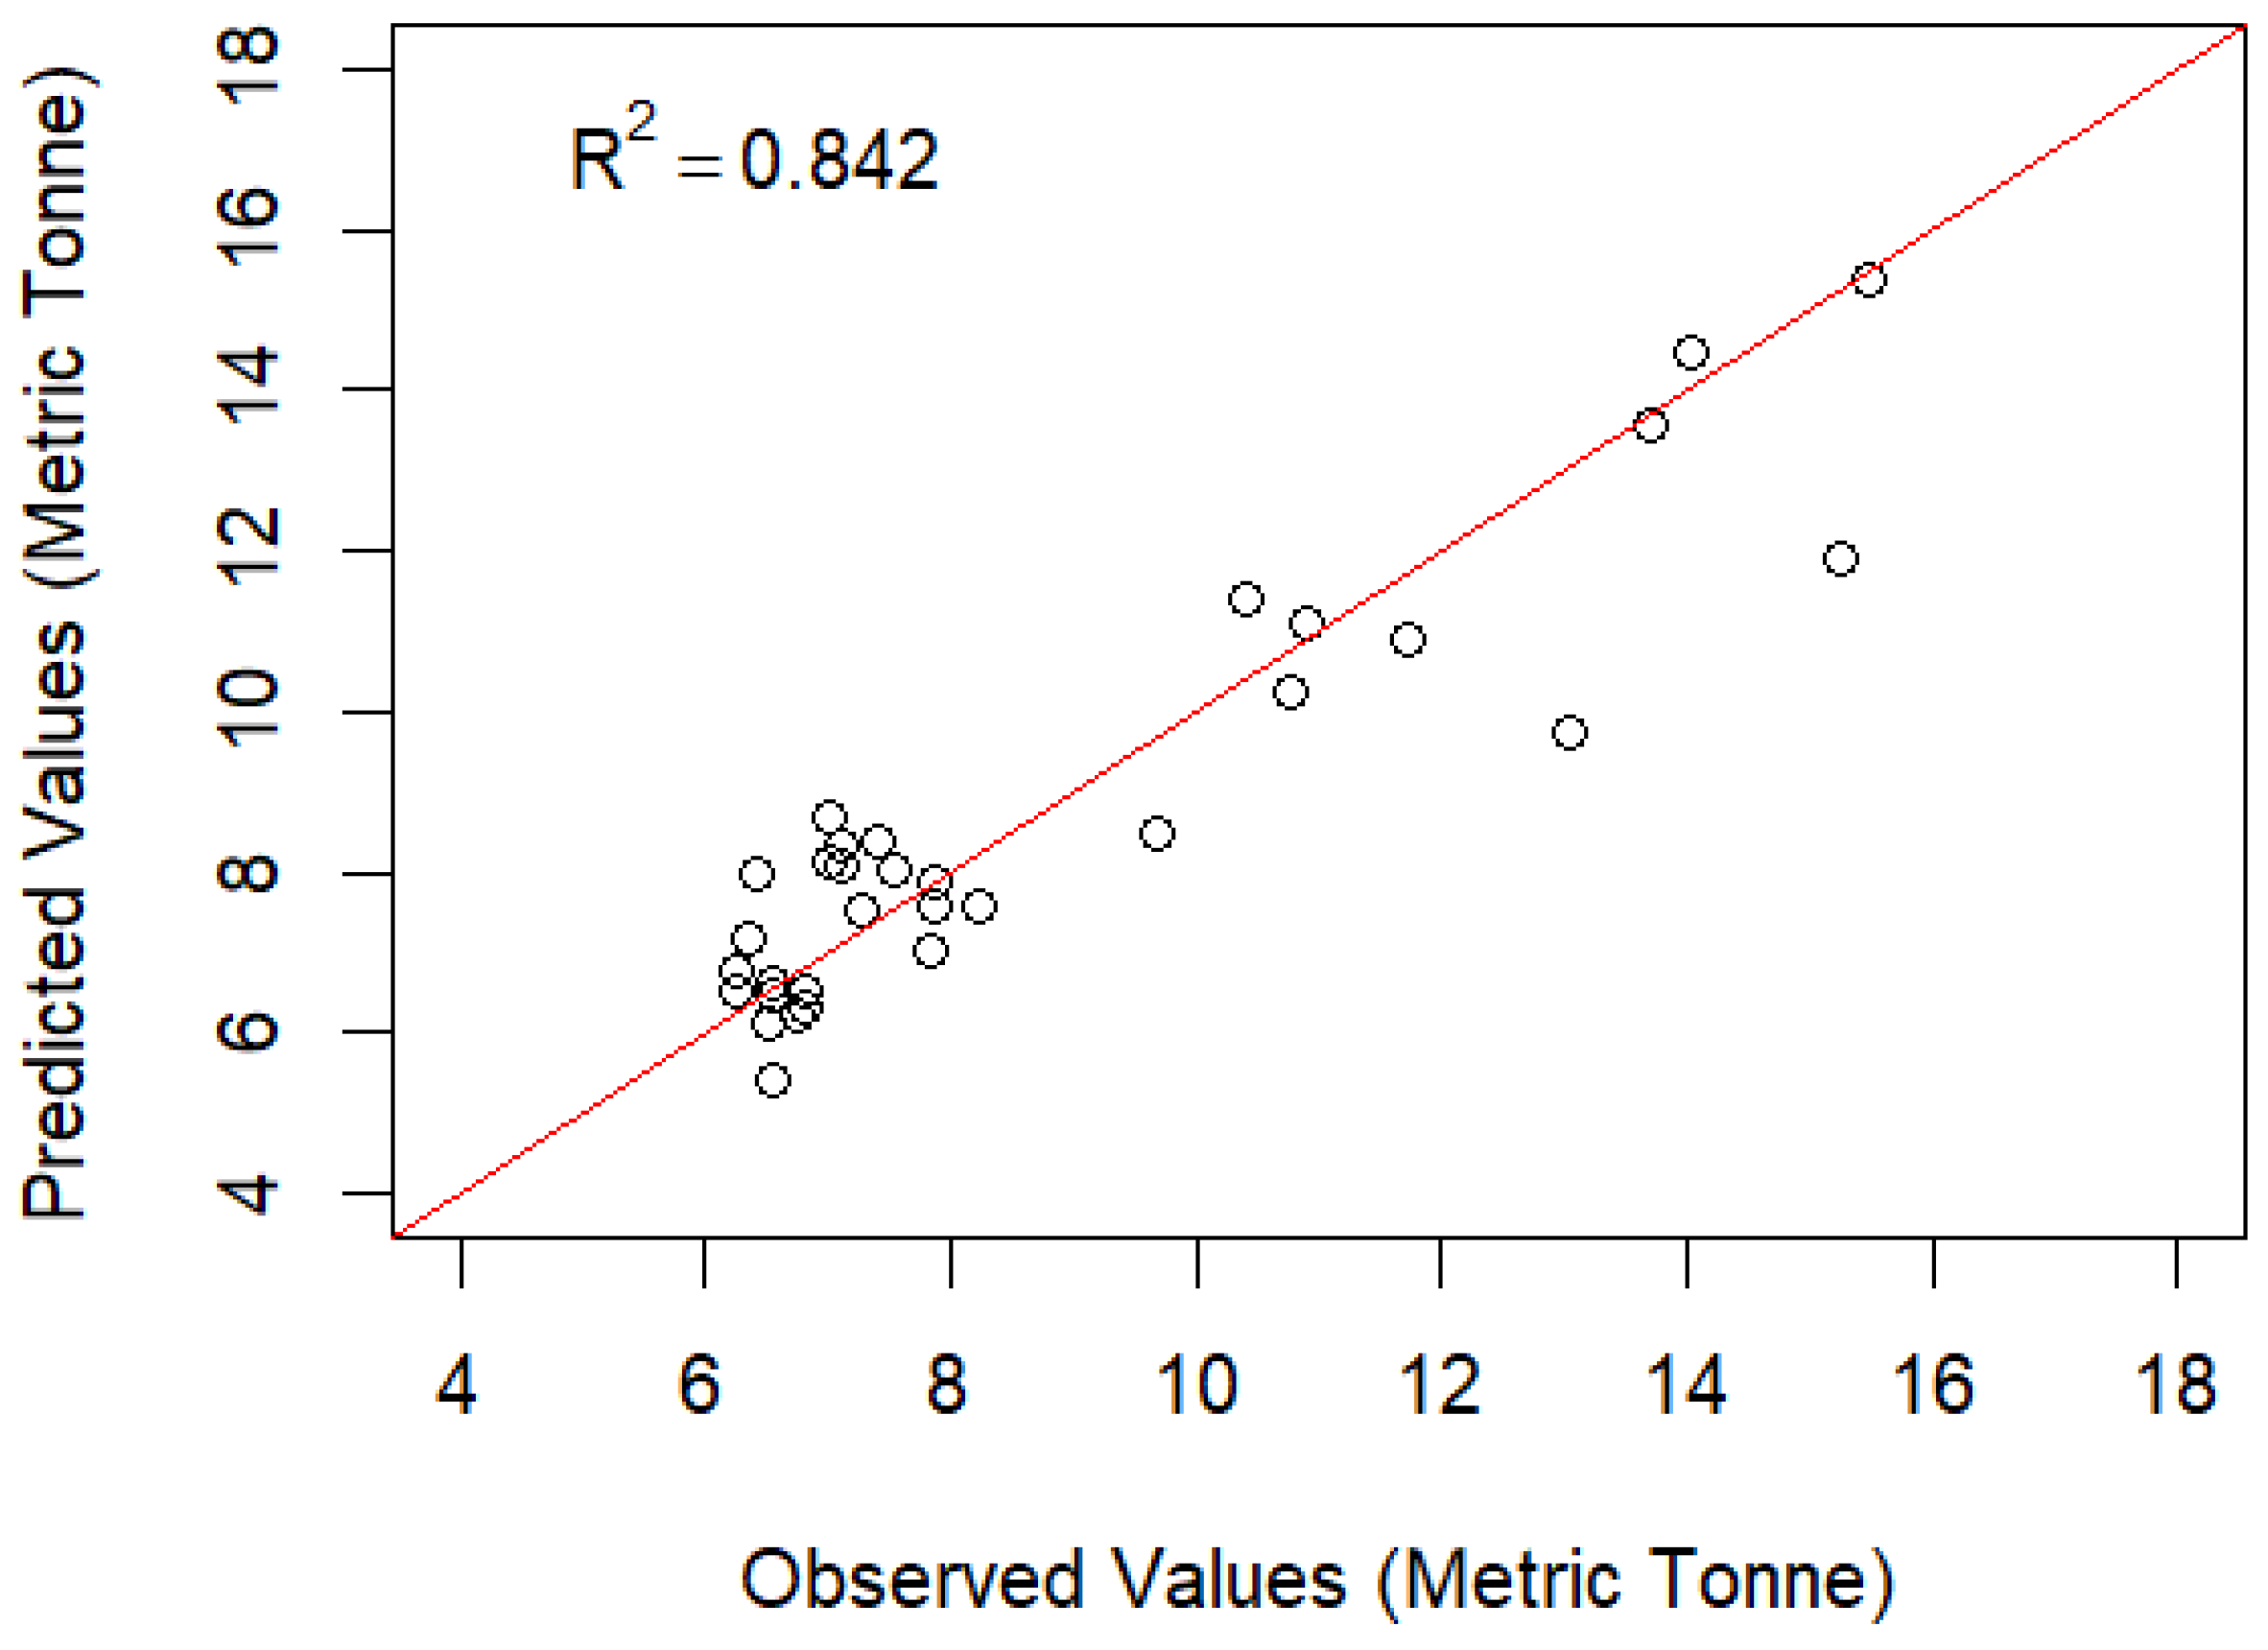
| Parameters | Values |
|---|---|
| Null deviance (metric tonne per license) | 2.635 |
| Residual deviance (metric tonne per license) | 0.457 |
Disclaimer/Publisher’s Note: The statements, opinions and data contained in all publications are solely those of the individual author(s) and contributor(s) and not of MDPI and/or the editor(s). MDPI and/or the editor(s) disclaim responsibility for any injury to people or property resulting from any ideas, methods, instructions or products referred to in the content. |
© 2025 by the authors. Licensee MDPI, Basel, Switzerland. This article is an open access article distributed under the terms and conditions of the Creative Commons Attribution (CC BY) license (https://creativecommons.org/licenses/by/4.0/).
Share and Cite
Khan, M.; Wang, X.; Thakur, K.K.; Guild, R.; Nawaz, R.A.; Awais, M. Lobster Yield Dynamics in a Warming Ocean: A Generalized Linear Modeling Case Study in Prince Edward Island, Canada. Foods 2025, 14, 2072. https://doi.org/10.3390/foods14122072
Khan M, Wang X, Thakur KK, Guild R, Nawaz RA, Awais M. Lobster Yield Dynamics in a Warming Ocean: A Generalized Linear Modeling Case Study in Prince Edward Island, Canada. Foods. 2025; 14(12):2072. https://doi.org/10.3390/foods14122072
Chicago/Turabian StyleKhan, Manzura, Xiuquan Wang, Krishna Kumar Thakur, Ryan Guild, Rana Ali Nawaz, and Muhammad Awais. 2025. "Lobster Yield Dynamics in a Warming Ocean: A Generalized Linear Modeling Case Study in Prince Edward Island, Canada" Foods 14, no. 12: 2072. https://doi.org/10.3390/foods14122072
APA StyleKhan, M., Wang, X., Thakur, K. K., Guild, R., Nawaz, R. A., & Awais, M. (2025). Lobster Yield Dynamics in a Warming Ocean: A Generalized Linear Modeling Case Study in Prince Edward Island, Canada. Foods, 14(12), 2072. https://doi.org/10.3390/foods14122072