
Transcriptome Sequencing Revealed an Inhibitory Mechanism of Recombinant Puroindoline B Protein on Aspergillus flavus


Abstract
1. Introduction
2. Materials and Methods
2.1. Fungal Strains and Growth Conditions
2.2. The Expression, Purification, and Quantification of rPINB
2.3. The Inhibition of rPINB on A. flavus in Corn Meal Matrix
2.4. RNA-Seq and Real-Time Quantitative Polymerase Chain Reaction (RT-qPCR) Validation
2.5. The Construction of Mutant Strains
2.6. Evaluation of the Response of the Mutant Strains to rPINB
2.7. Analysis of Growth Characteristics in Mutant Strains
2.8. Sensitivity of Mutant Strains to Cell Membrane, Osmotic, and Oxidative Stress
2.9. Evaluation of Aflatoxin B1 (AFB1) Production in Mutant Strains
2.10. Statistics
3. Results
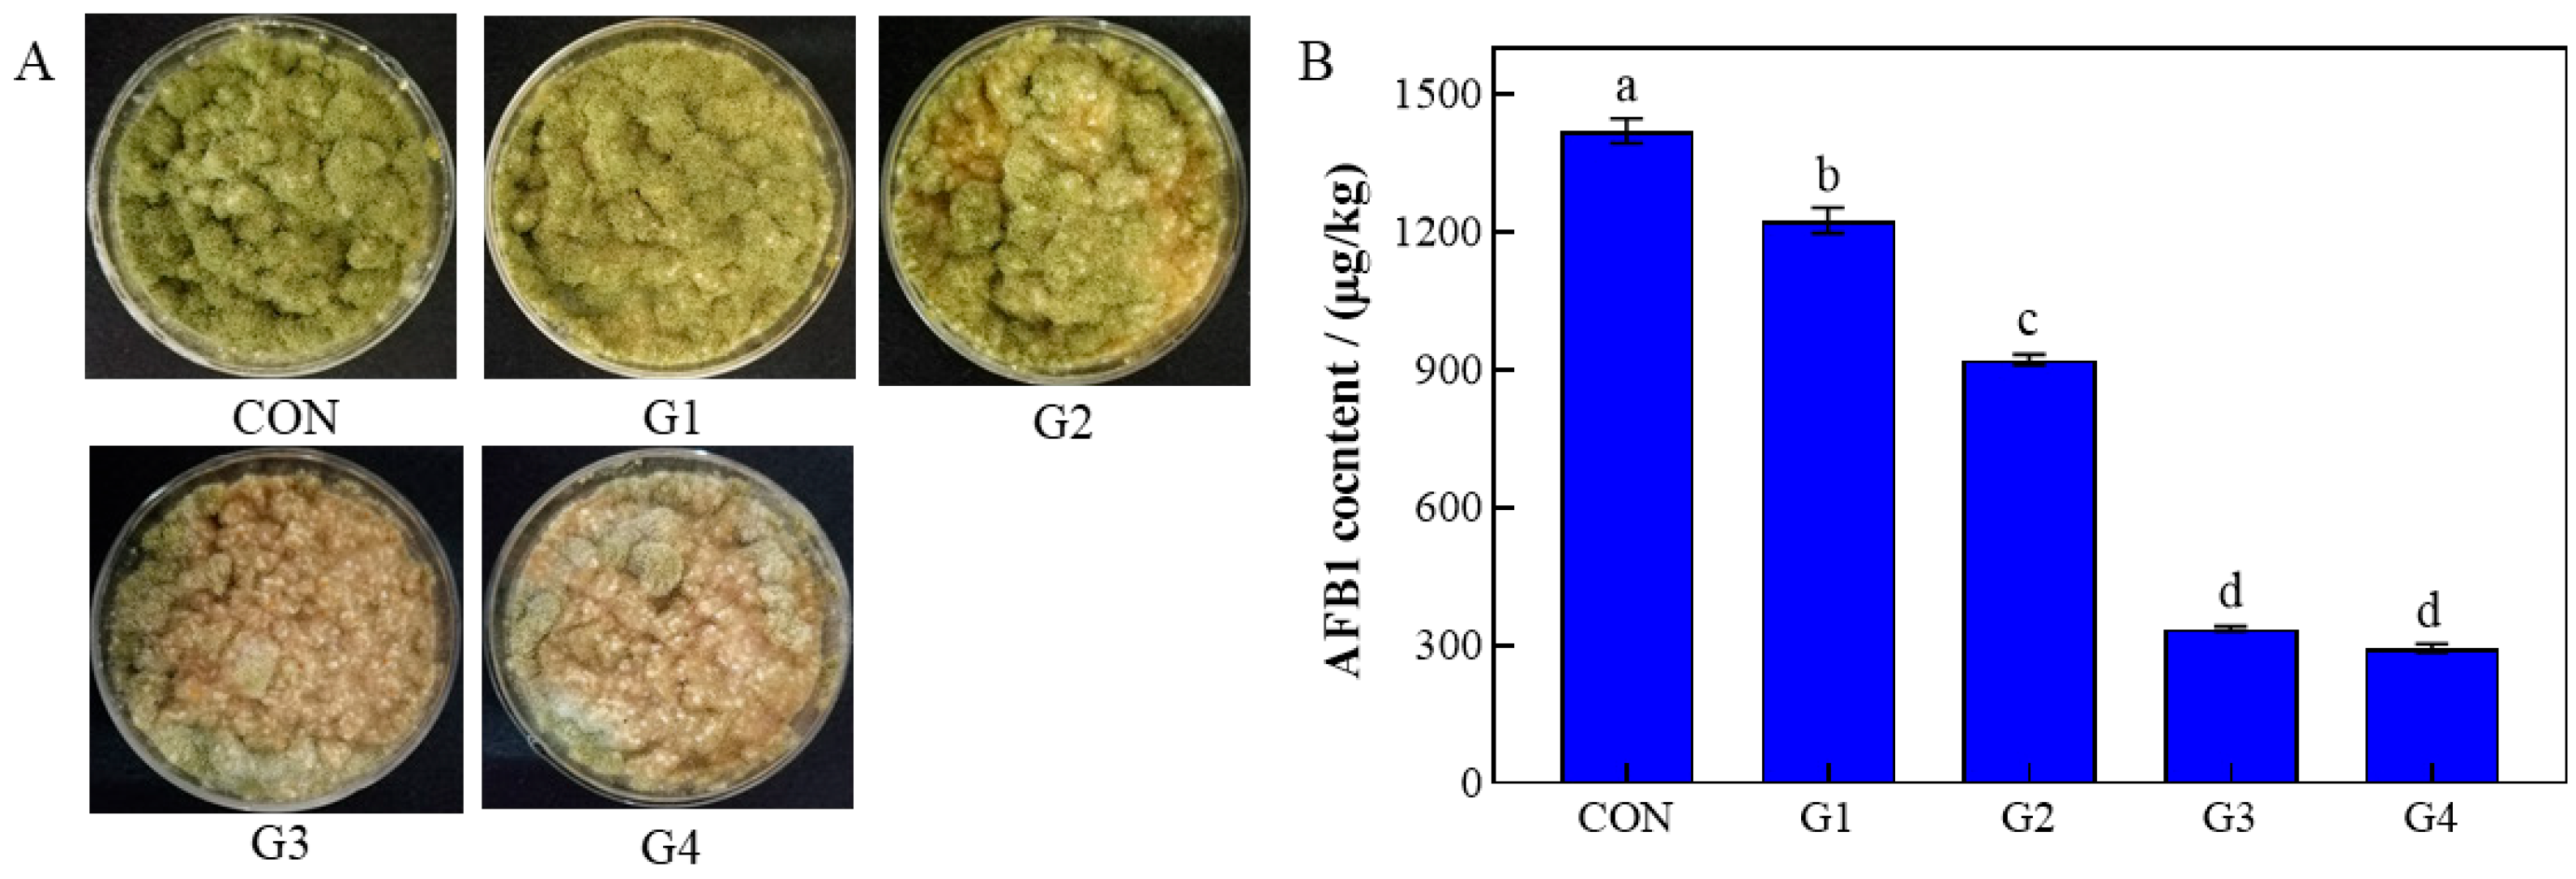
3.1. The Inhibition of rPINB on A. flavus in Corn Meal Matrix
3.2. The Inhibition of rPINB Protein on the A. flavus Genome
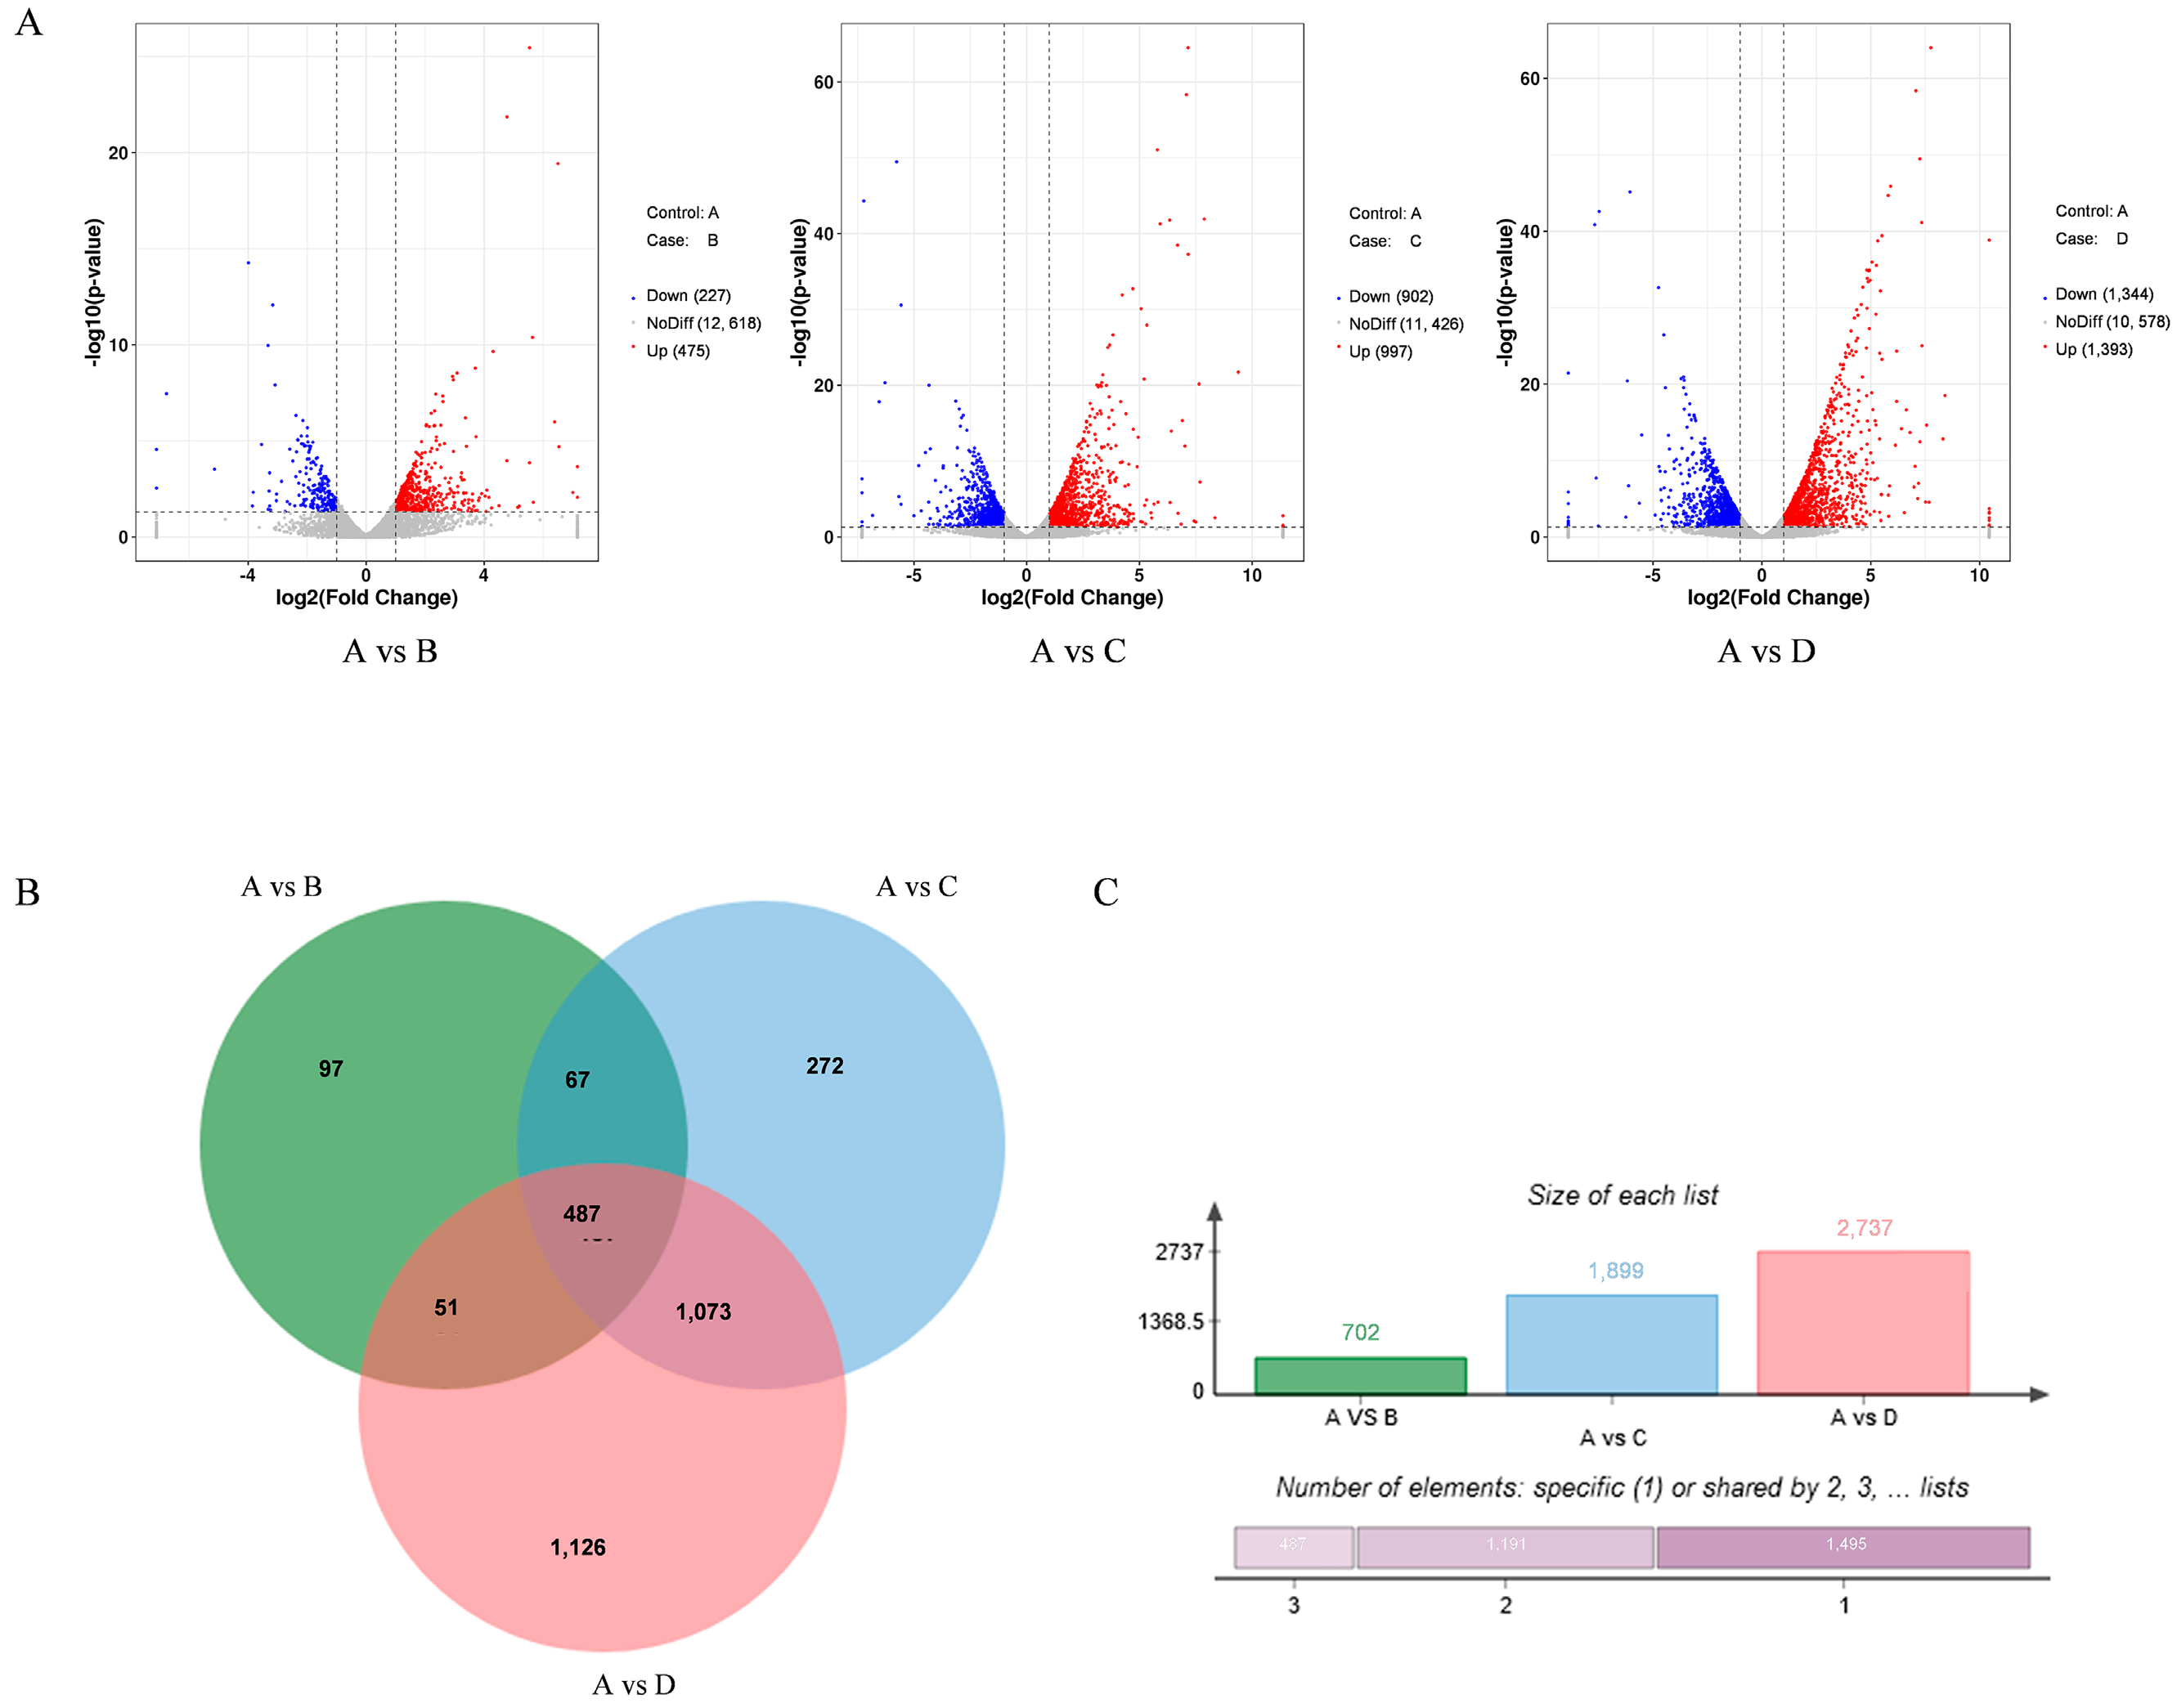
3.2.1. Differentially Expressed Genes (DEGs) in A. flavus
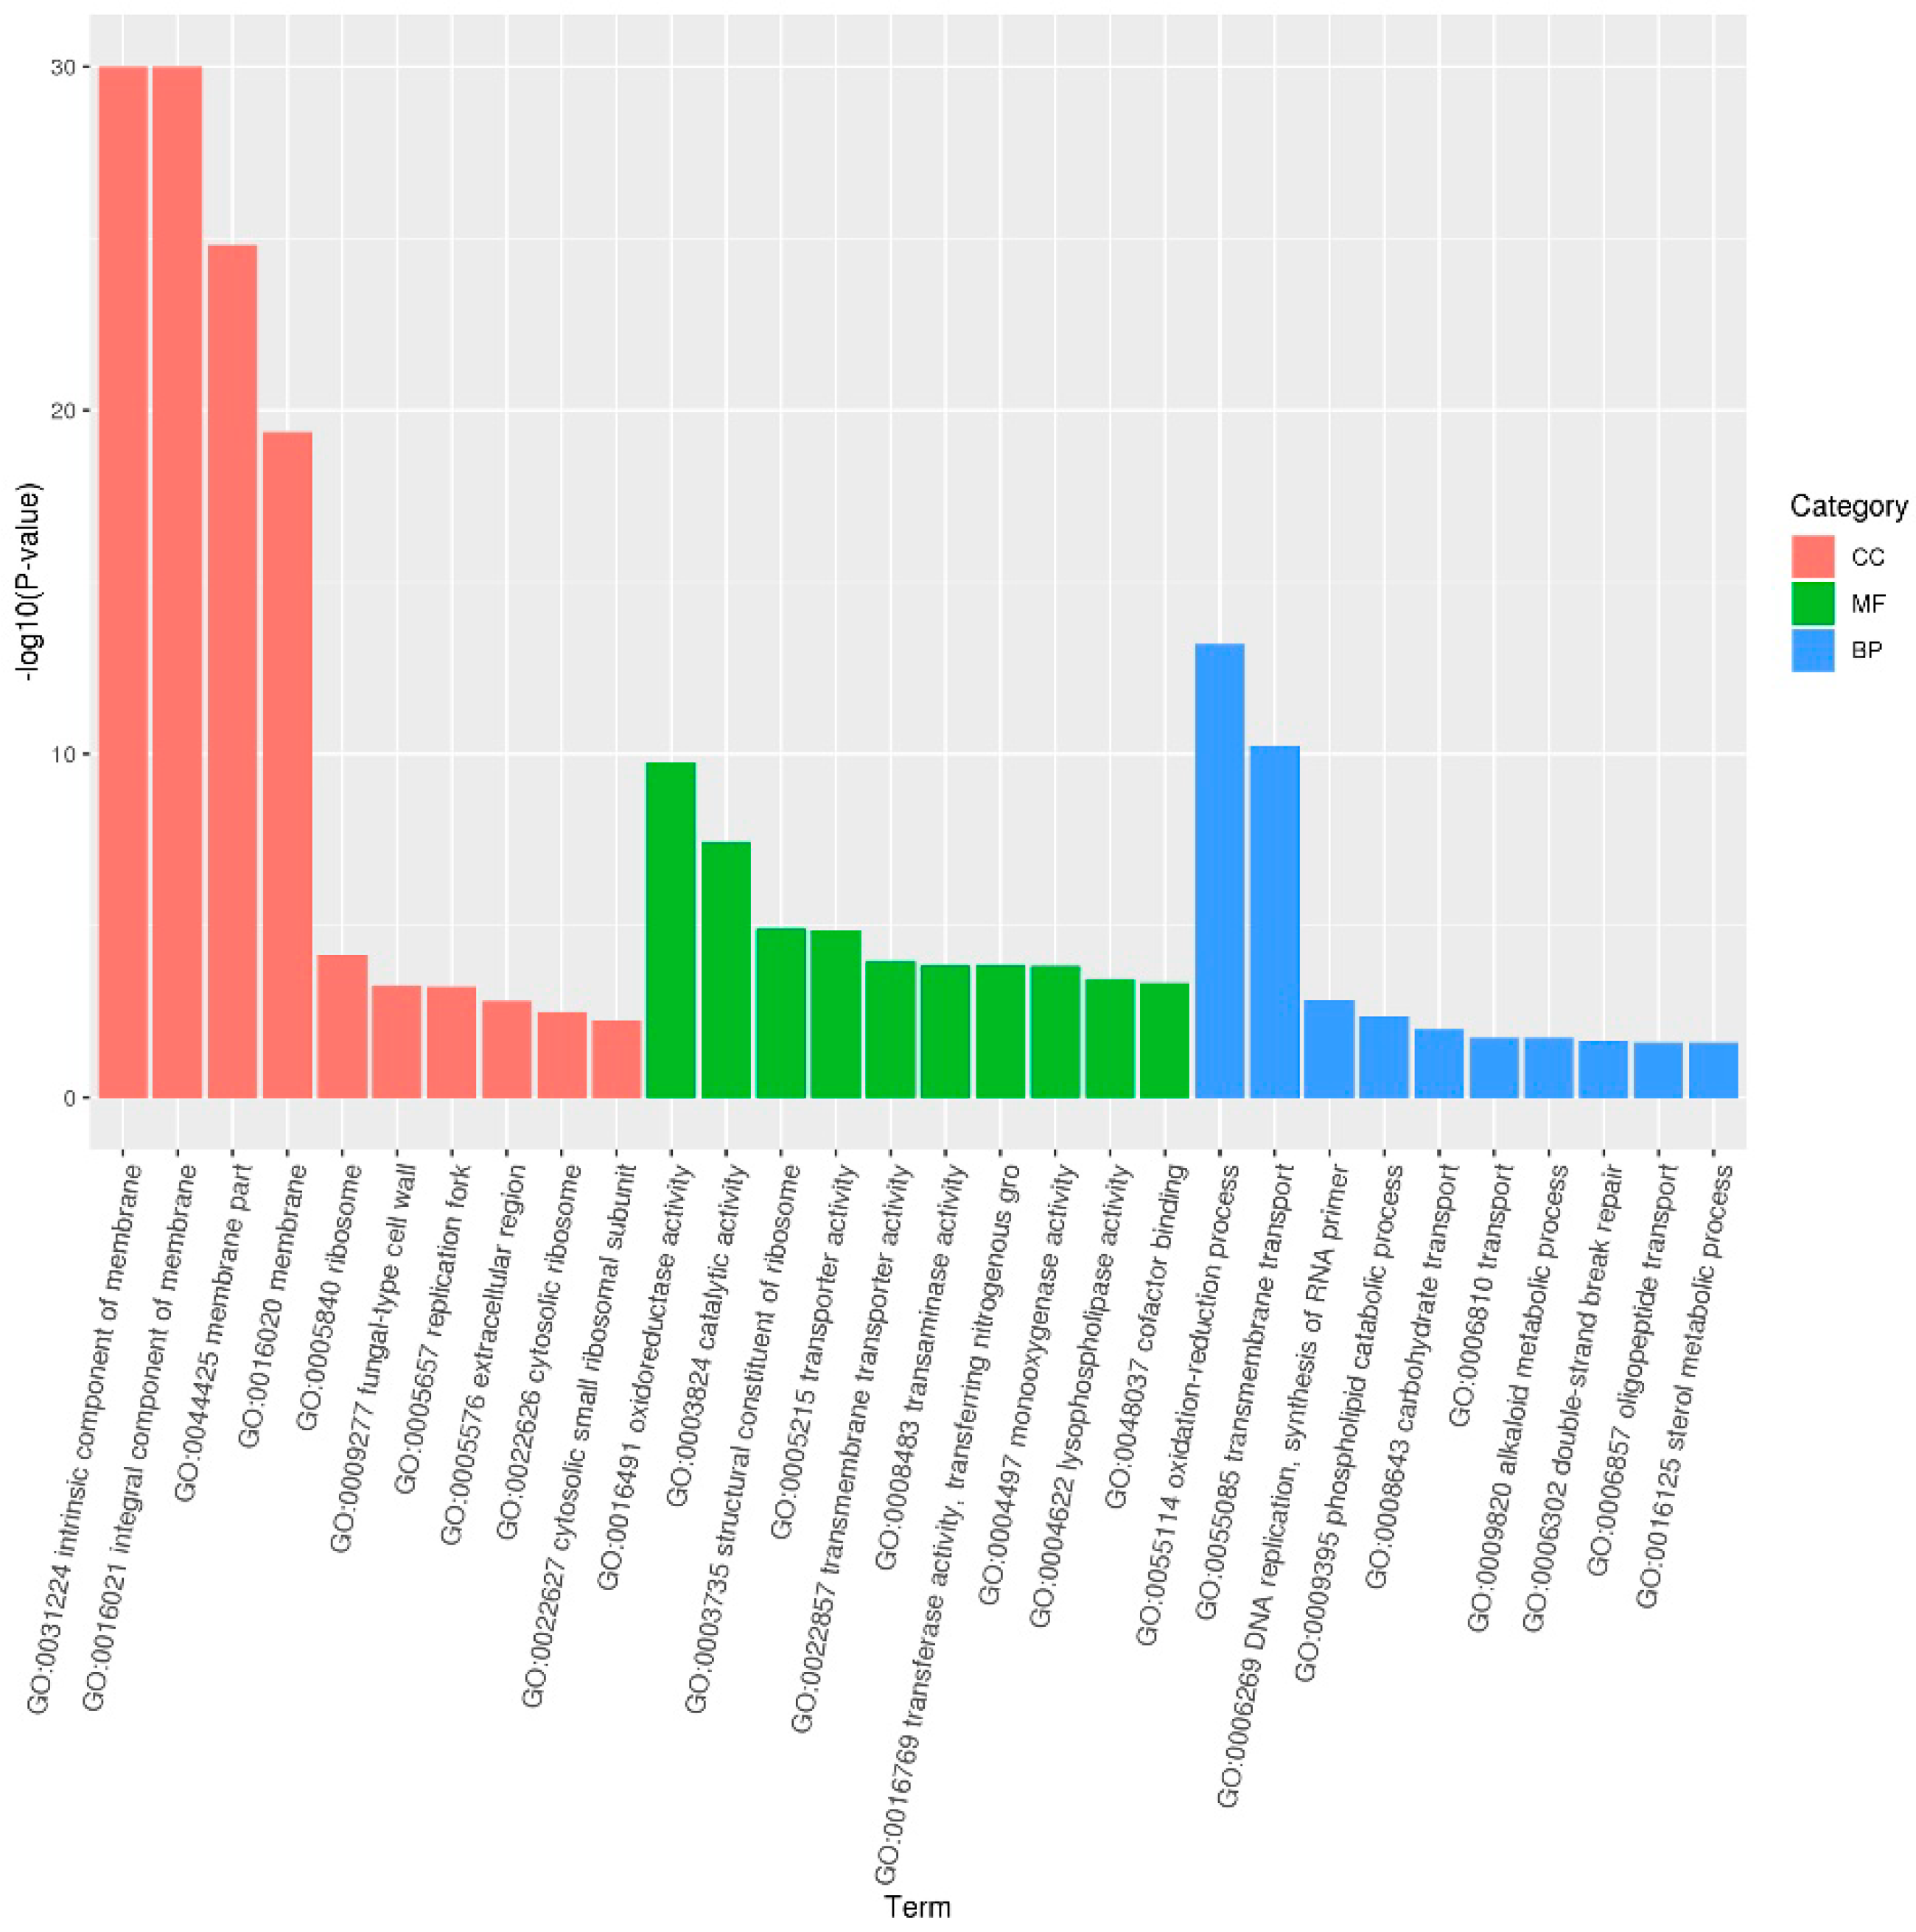
3.2.2. GO Enrichment Analysis in A. flavus
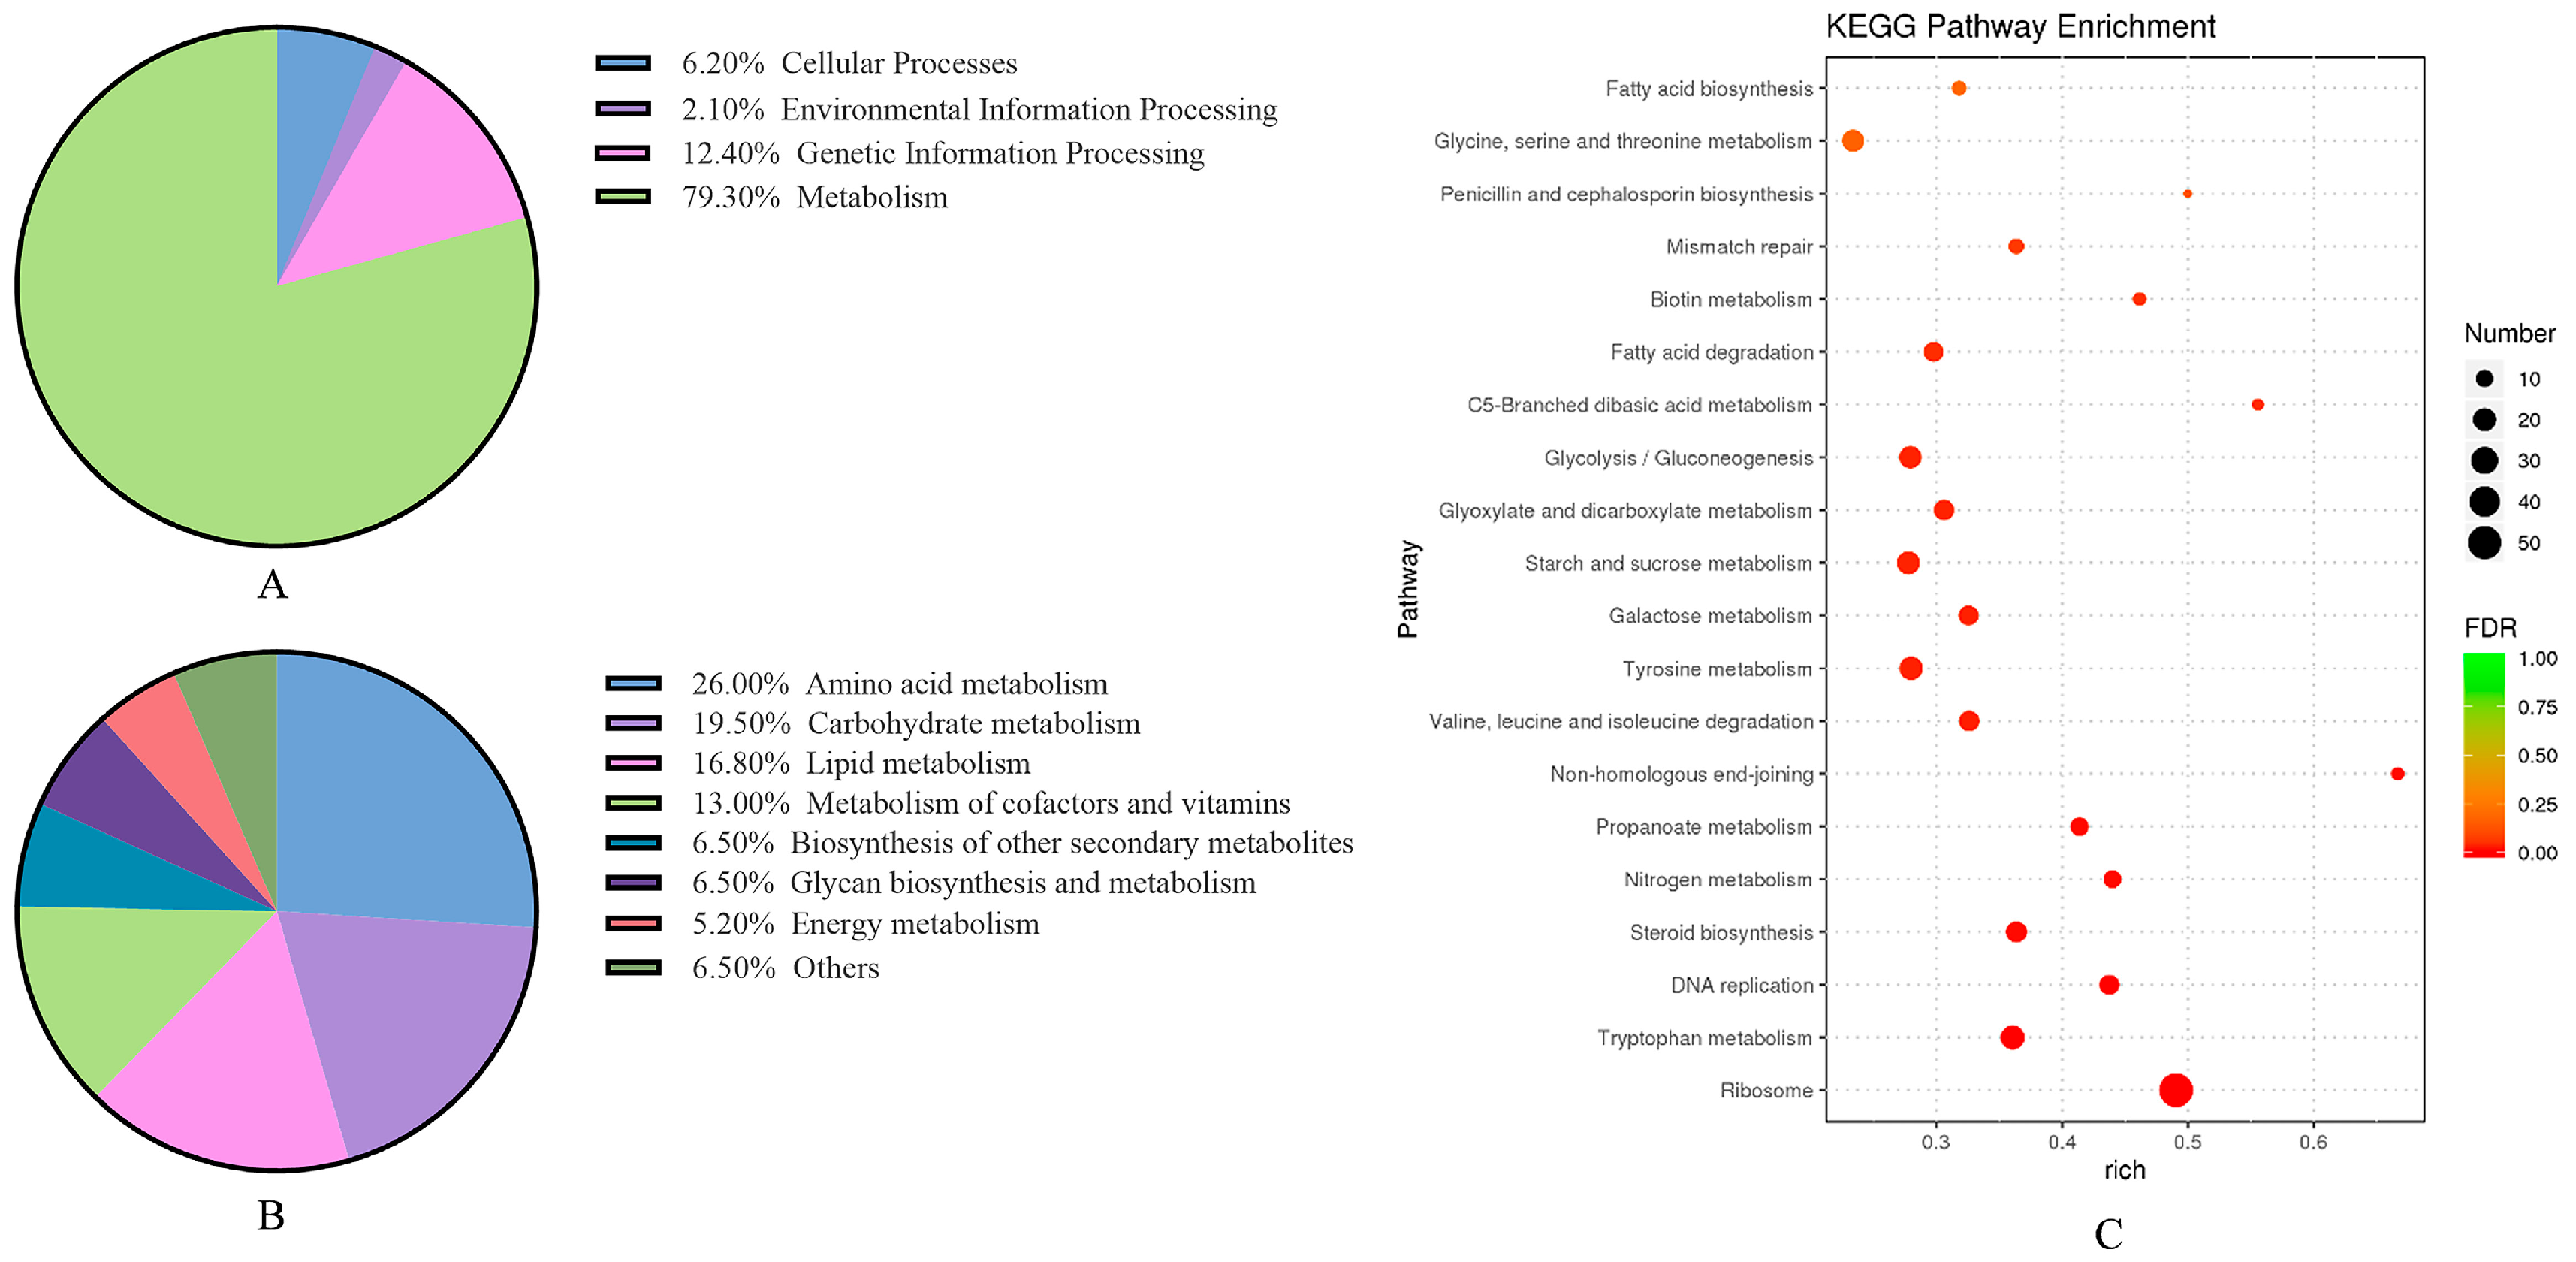
3.2.3. Enrichment of KEGG Metabolic Pathway in A. flavus
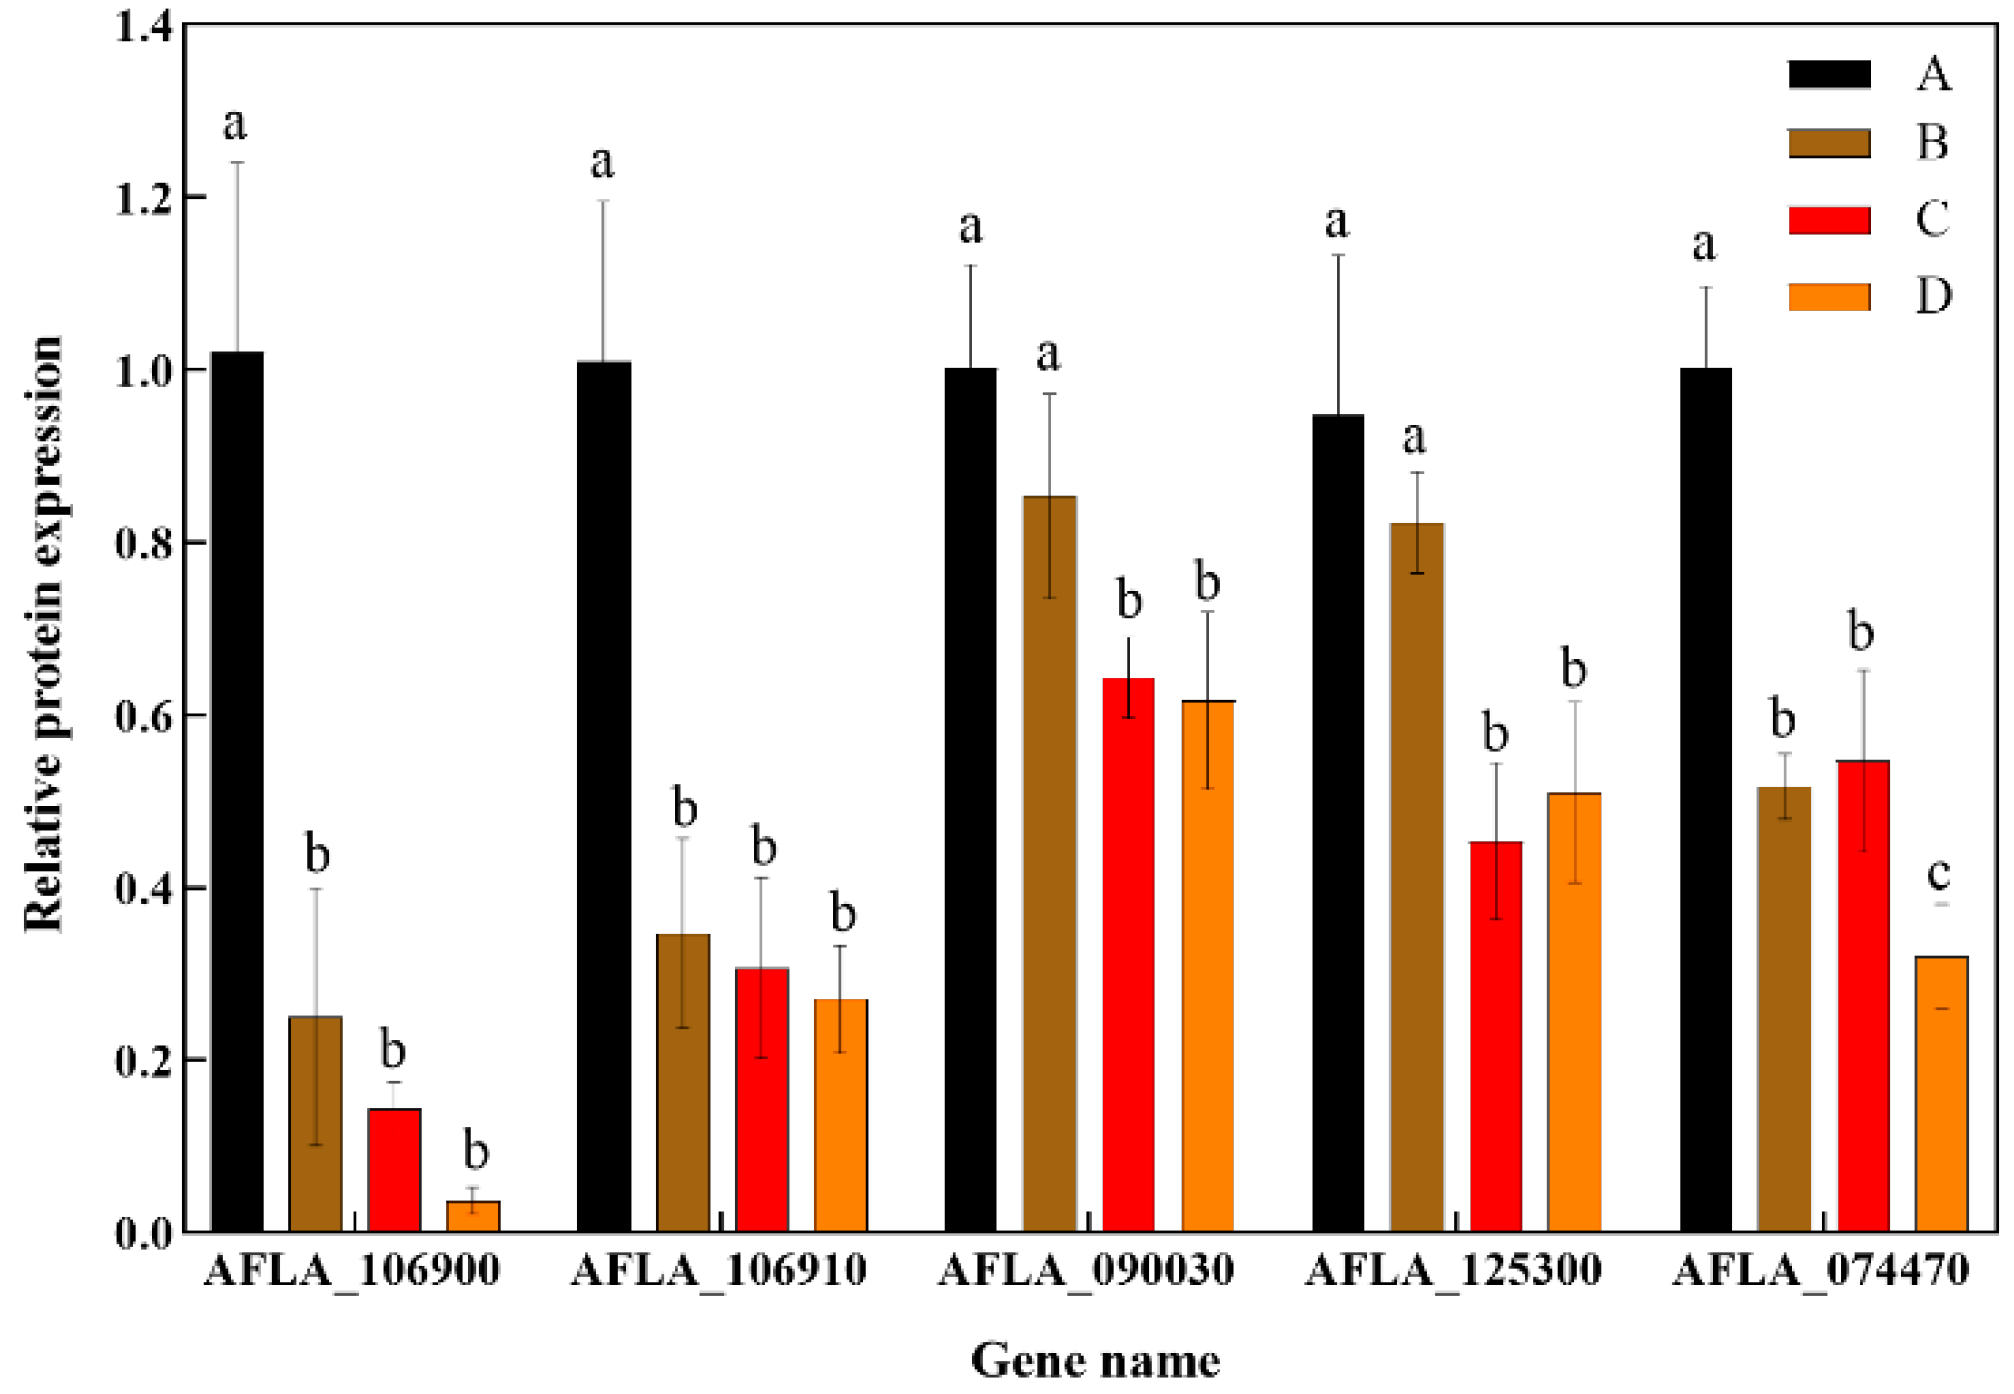
3.2.4. Verification of Transcriptome Sequencing Results via RT-qPCR
3.3. Impact of rPINB on the Transcriptional Expression of Genes Associated with Growth and Toxigenesis in A. flavus
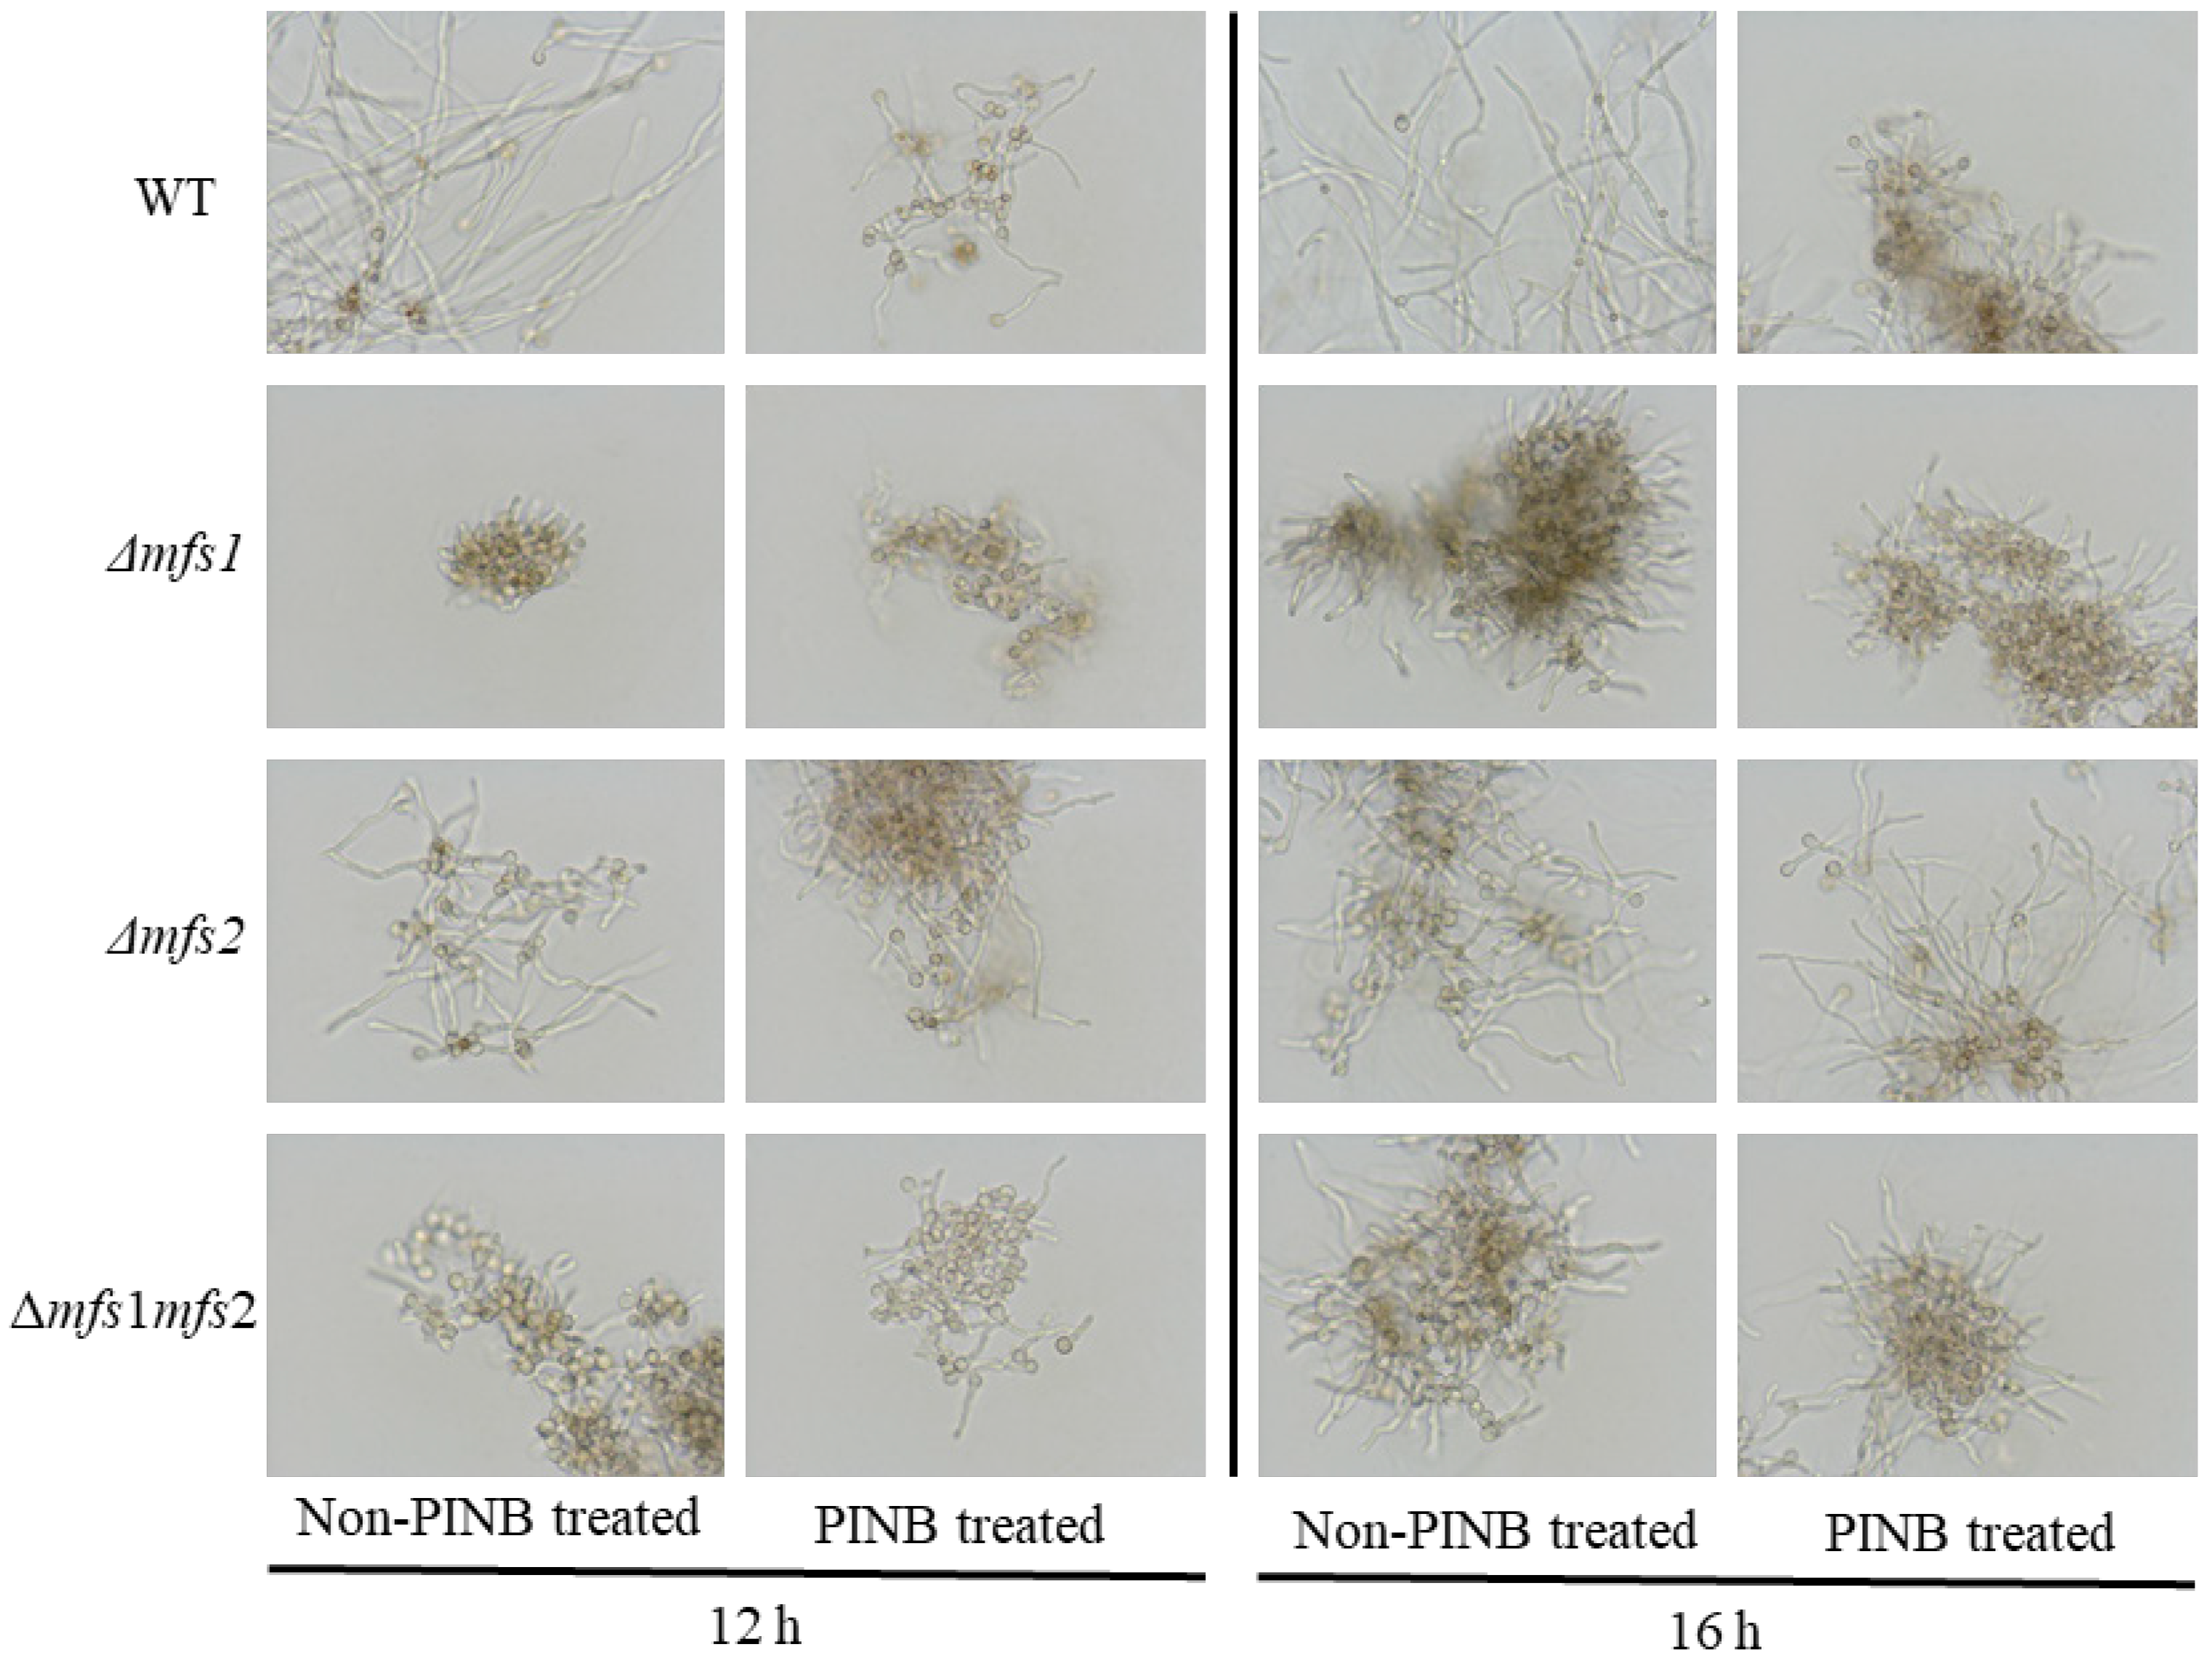
3.4. The Sensitivity of Δmfs1, Δmfs2 and Δmfs1Δmfs2 Mutants to rPINB
3.5. Effects of mfs1 and mfs2 on the Growth of A. flavus
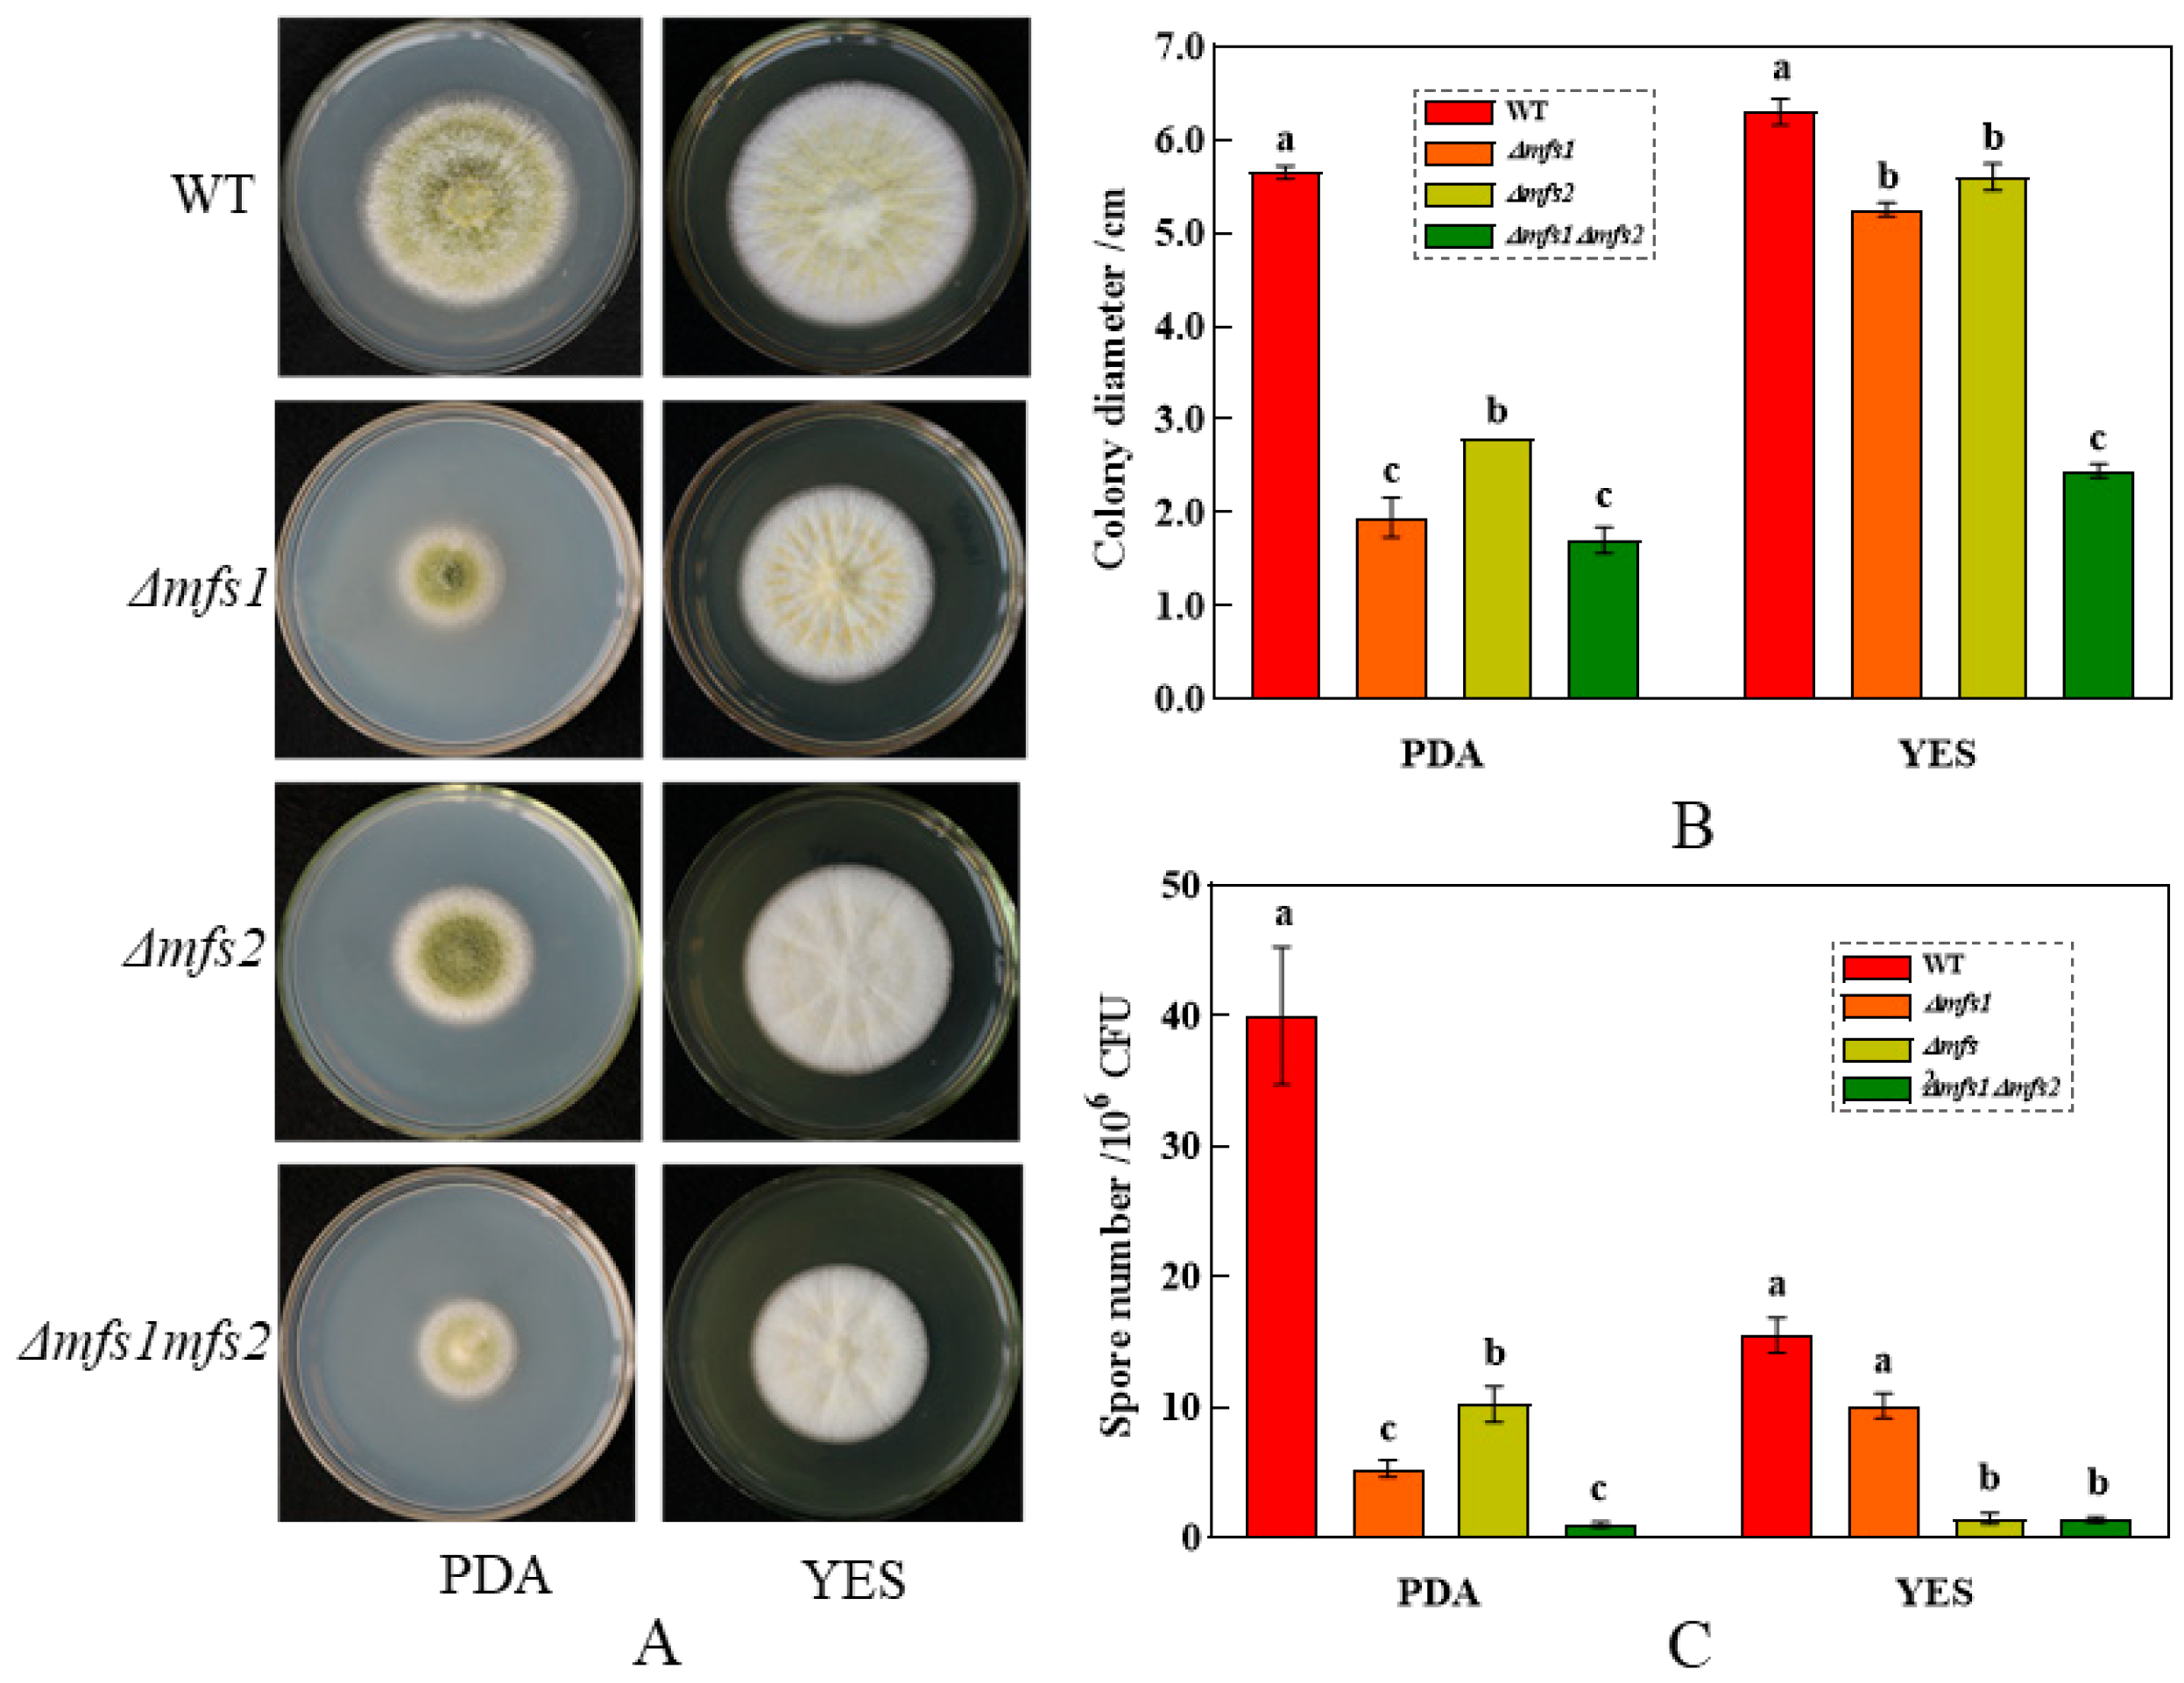
3.5.1. The Growth of Δmfs1, Δmfs2 and Δmfs1Δmfs2 Mutant Strains on the PDA and YES
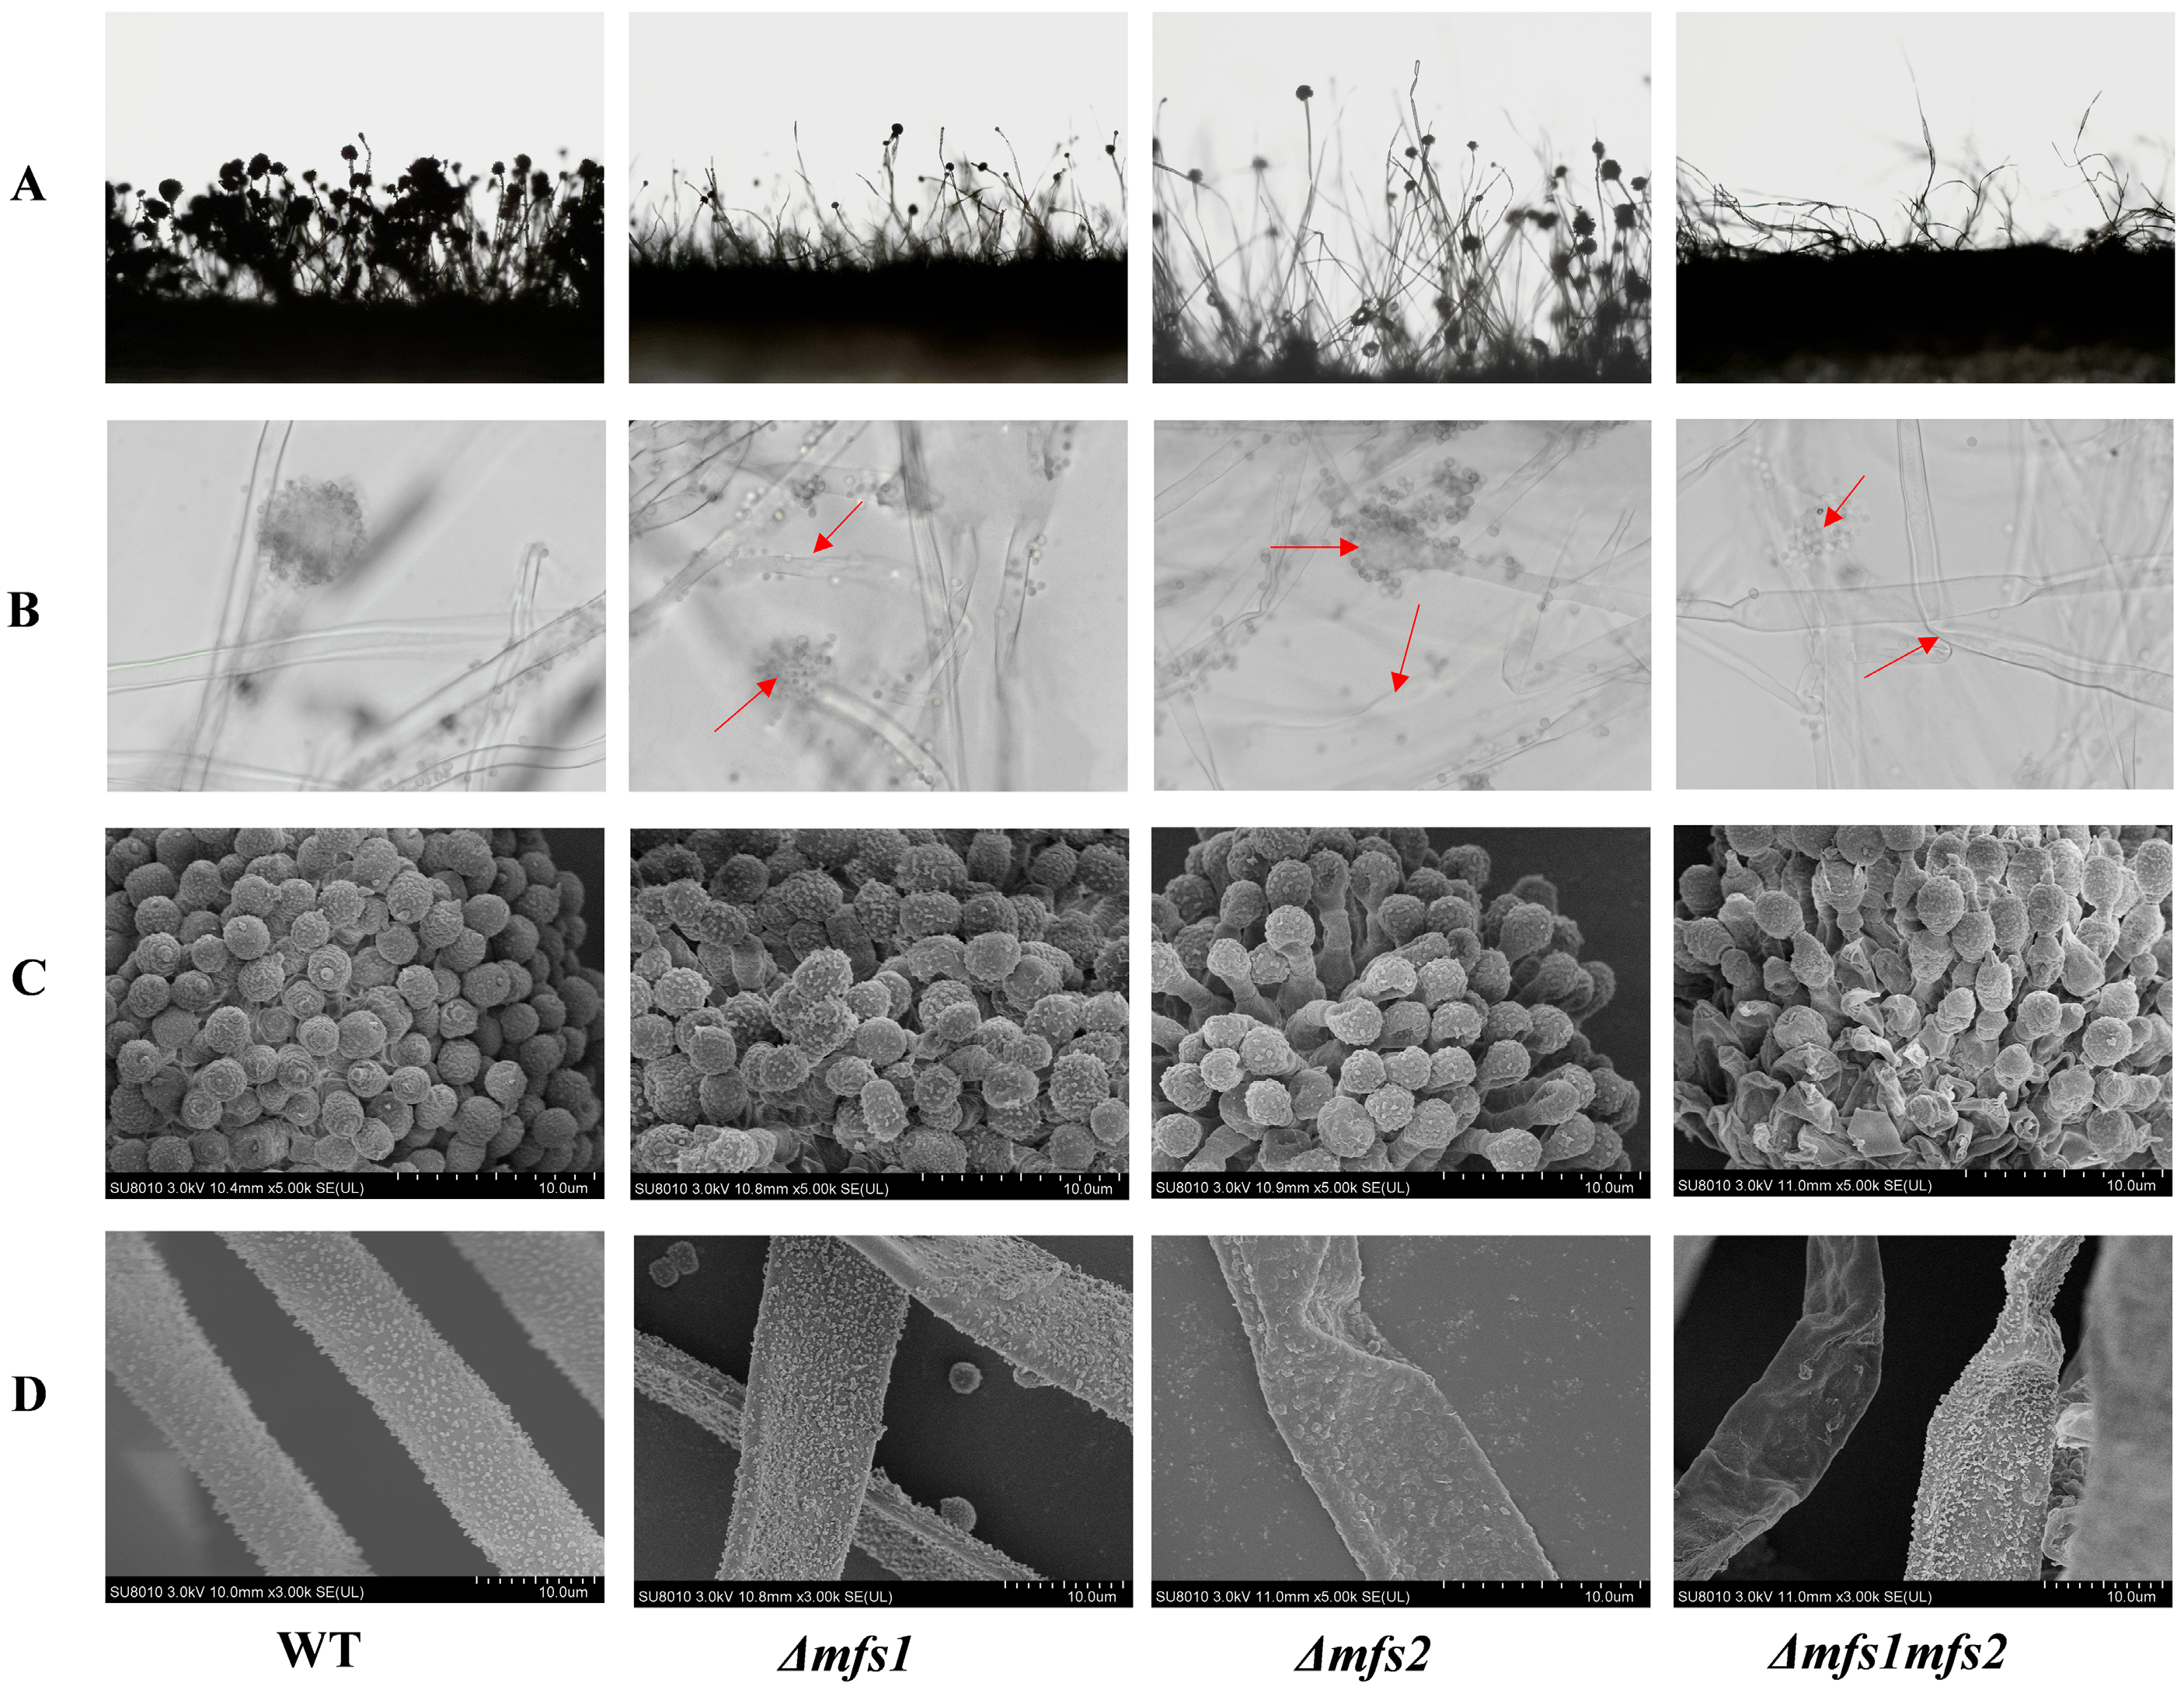
3.5.2. The Microstructure of Δmfs1, Δmfs2 and Δmfs1Δmfs2 Mutant Strains
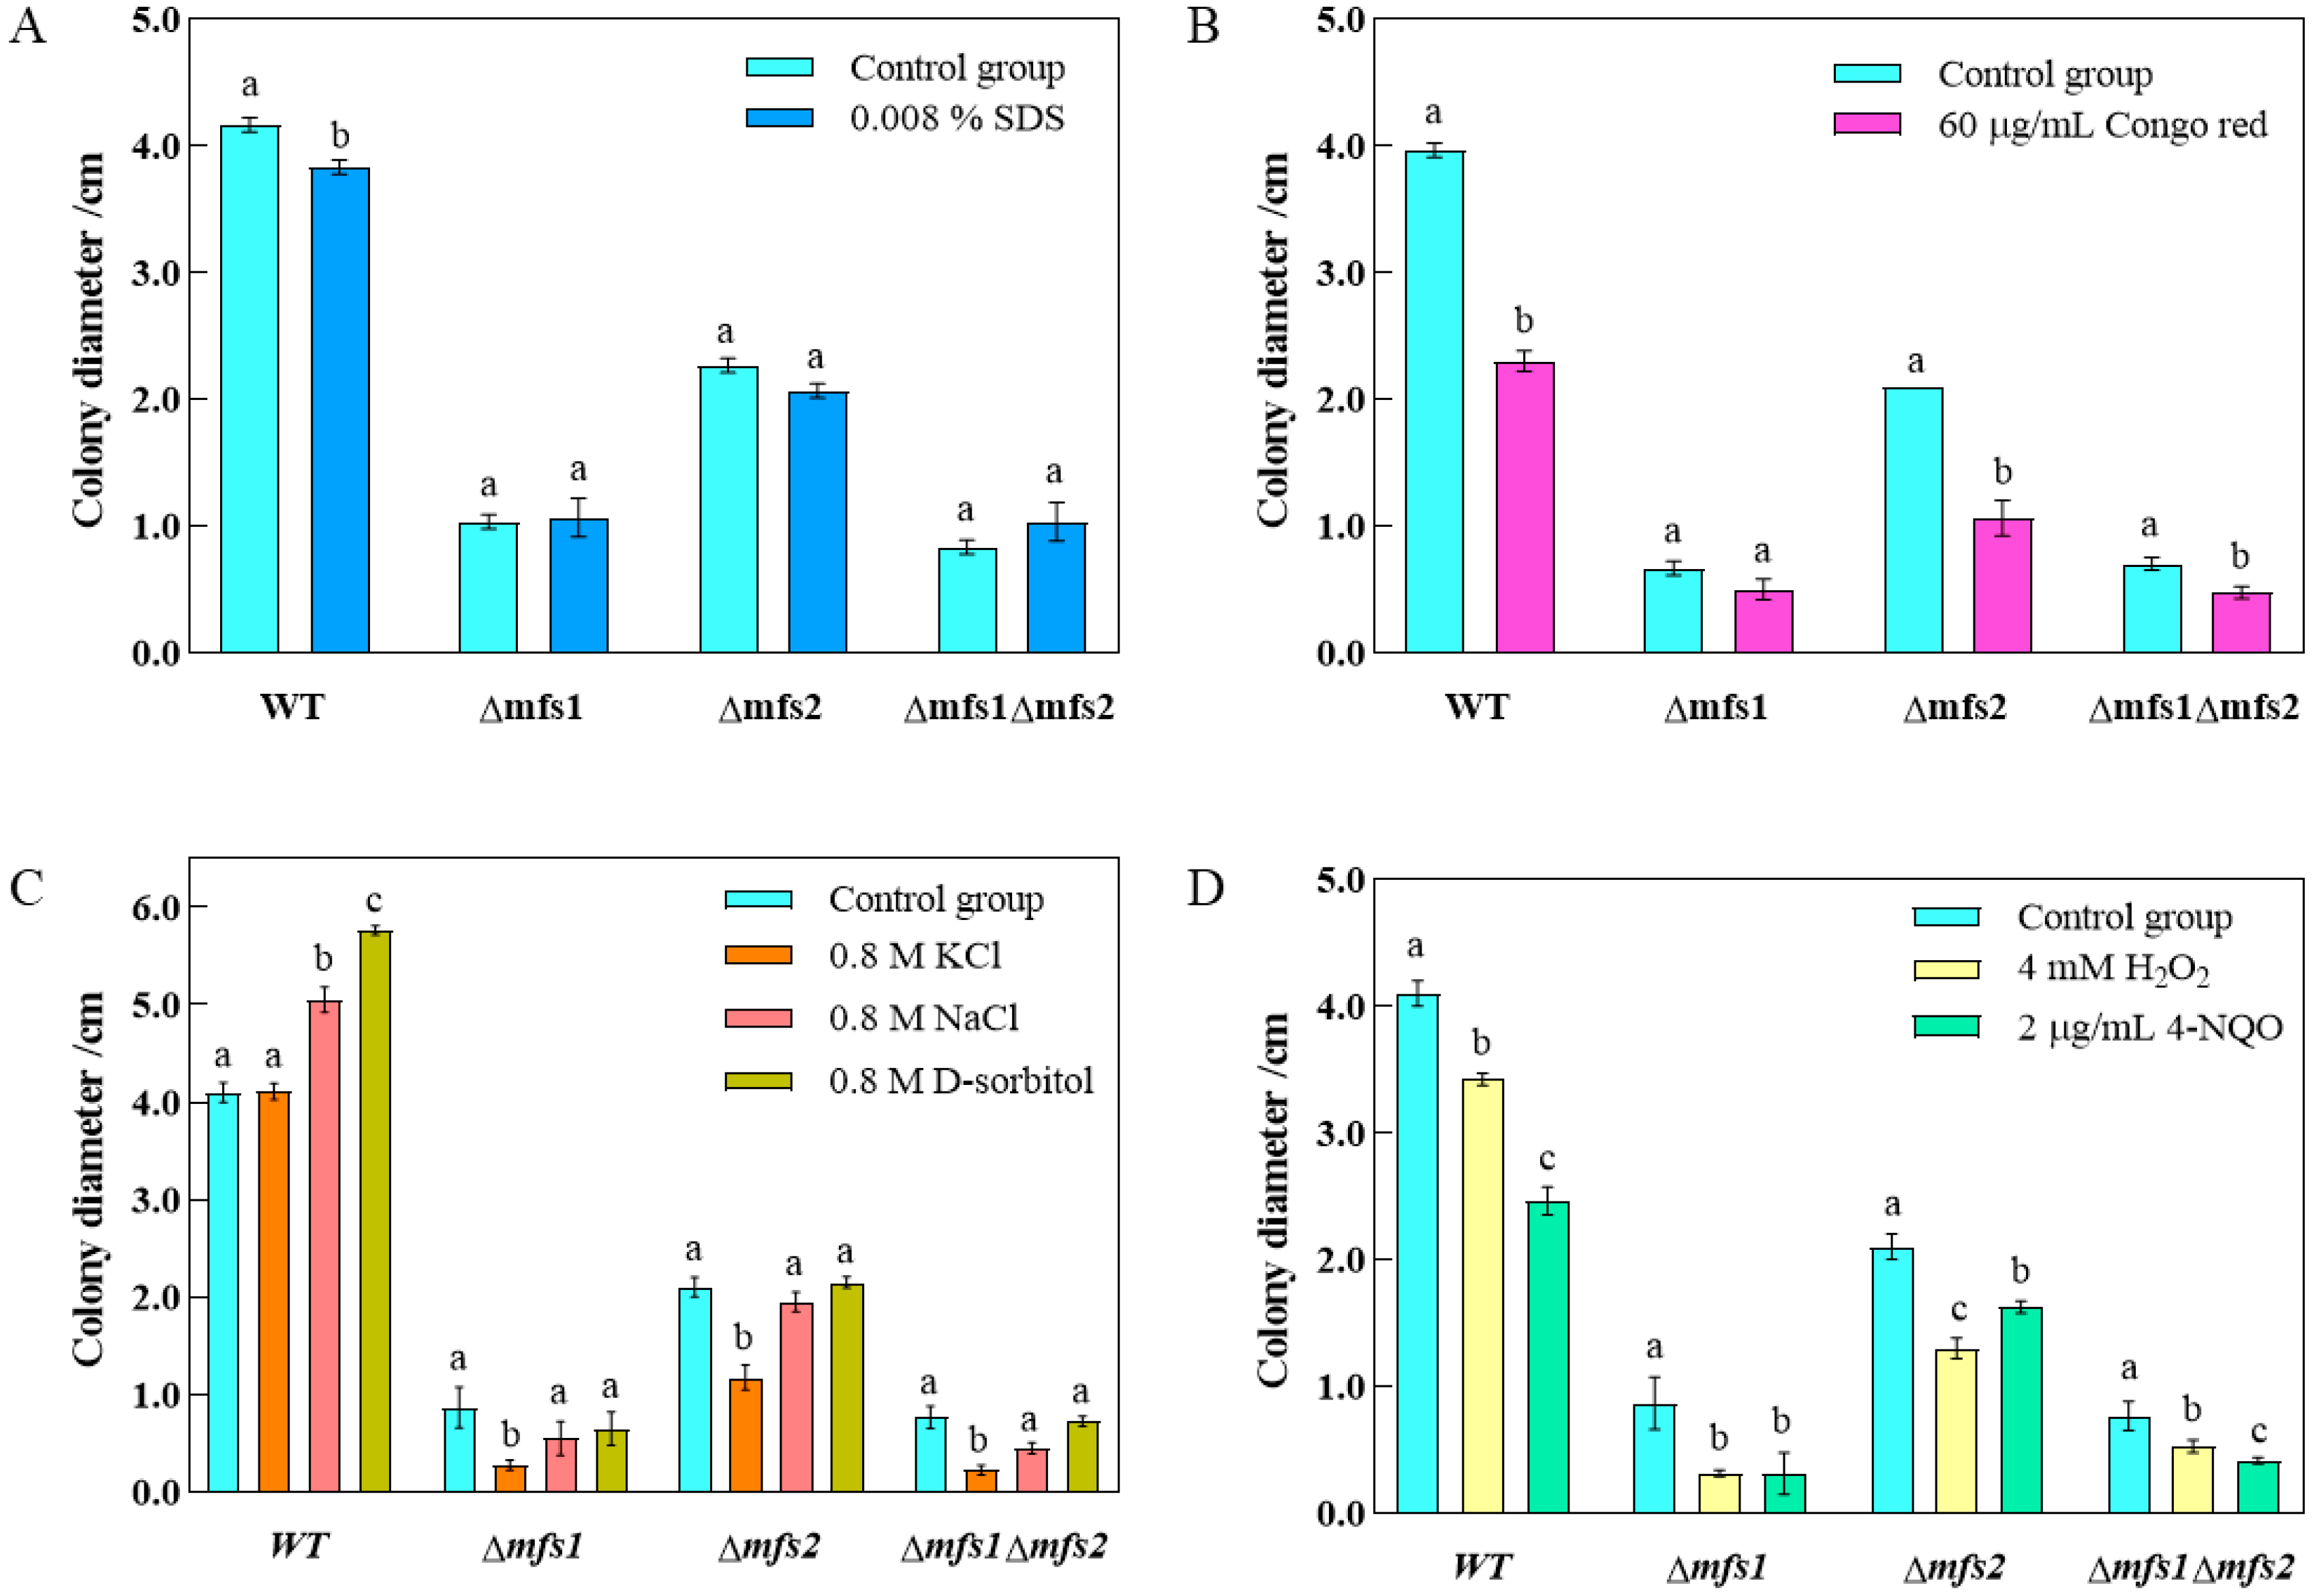
3.6. Stress Assay
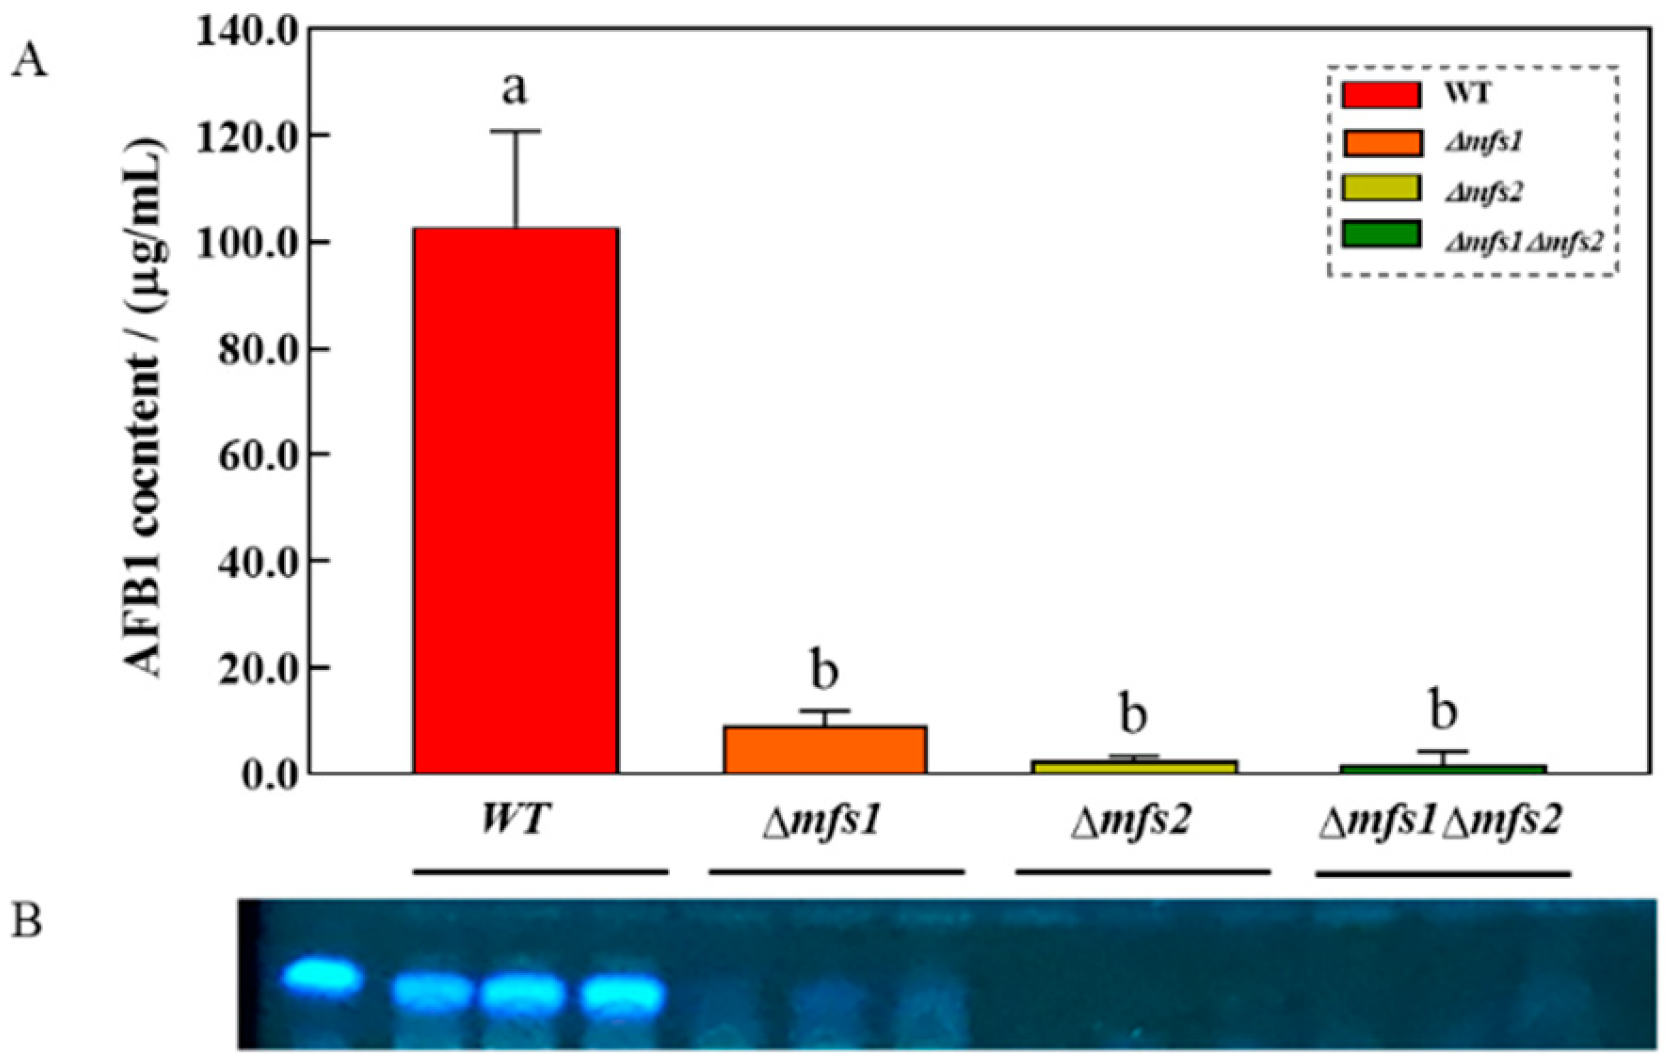
3.7. AFB1 Content
4. Discussion
5. Conclusions
Supplementary Materials
Author Contributions
Funding
Institutional Review Board Statement
Informed Consent Statement
Data Availability Statement
Conflicts of Interest
References
- Lavkor, I.; Var, I. The control of aflatoxin contamination at harvest, drying, pre-storage and storage periods in peanut: The new approach. In Aflatoxin-Control, Analysis, Detection and Health Risks; InTech: London, UK, 2017; pp. 45–64. [Google Scholar]
- Bhatnagar-Mathur, P.; Sunkara, S.; Bhatnagar-Panwar, M.; Waliyar, F.; Sharma, K.K. Biotechnological advances for combating Aspergillus flavus and aflatoxin contamination in crops. Plant Sci. 2015, 234, 119–132. [Google Scholar] [CrossRef] [PubMed]
- Gourama, H.; Bullerman, L.B. Aspergillus flavus and Aspergillus parasiticus: Aflatoxigenic fungi of concern in foods and feeds: A review. J. Food Prot. 1995, 58, 1395–1404. [Google Scholar] [CrossRef] [PubMed]
- Mehl, H.L.; Jaime, R.; Callicott, K.A.; Probst, C.; Garber, N.P.; Ortega-Beltran, A.; Grubisha, L.C.; Cotty, P.J. Aspergillus flavus diversity on crops and in the environment can be exploited to reduce aflatoxin exposure and improve health. Ann. N. Y. Acad. Sci. 2012, 1273, 7–17. [Google Scholar] [CrossRef] [PubMed]
- Uka, V.; Cary, J.W.; Lebar, M.D.; Puel, O.; De Saeger, S.; Diana Di Mavungu, J. Chemical repertoire and biosynthetic machinery of the Aspergillus flavus secondary metabolome: A review. Compr. Rev. Food Sci. Food Saf. 2020, 19, 2797–2842. [Google Scholar] [CrossRef]
- Awuchi, C.G.; Amagwula, I.O.; Priya, P.; Kumar, R.; Yezdani, U.; Khan, M.G. Aflatoxins in foods and feeds: A review on health implications, detection, and control. Bull. Environ. Pharmacol. Life Sci. 2020, 9, 149–155. [Google Scholar]
- Martin, N.L.; Bass, P.; Liss, S.N. Antibacterial properties and mechanism of activity of a novel silver-stabilized hydrogen peroxide. PLoS ONE 2015, 10, e0131345. [Google Scholar] [CrossRef]
- Dimkic, I.; Janakiev, T.; Petrovic, M.; Degrassi, G.; Fira, D. Plant-associated Bacillus and Pseudomonas antimicrobial activities in plant disease suppression via biological control mechanisms-A review. Physiol. Mol. Plant Pathol. 2022, 117, 101754. [Google Scholar] [CrossRef]
- Lahlali, R.; Ezrari, S.; Radouane, N.; Kenfaoui, J.; Esmaeel, Q.; El Hamss, H.; Belabess, Z.; Barka, E.A. Biological control of plant pathogens: A global perspective. Microorganisms 2022, 10, 596. [Google Scholar] [CrossRef]
- Zhang, N.; Wang, Z.; Shao, J.; Xu, Z.; Liu, Y.; Xun, W.; Miao, Y.; Shen, Q.; Zhang, R. Biocontrol mechanisms of Bacillus: Improving the efficiency of green agriculture. Microb. Biotechnol. 2023, 16, 2250–2263. [Google Scholar] [CrossRef]
- Aboulila, A.A. Efficiency of plant growth regulators as inducers for improve systemic acquired resistance against stripe rust disease caused by Puccinia striiformis f. sp. tritici in wheat through up-regulation of PR-1 and PR-4 genes expression. Physiol. Mol. Plant Pathol. 2022, 121, 101882. [Google Scholar] [CrossRef]
- Zhao, S.; Li, M.; Ren, X.; Wang, C.; Sun, X.; Sun, M.; Yu, X.; Wang, X. Enhancement of broad-spectrum disease resistance in wheat through key genes involved in systemic acquired resistance. Front. Plant Sci. 2024, 15, 1355178. [Google Scholar] [CrossRef] [PubMed]
- Ramalingam, A. Genetic Variability and Protein-Protein Interactions of Puroindolines in Relation to Wheat Grain Texture and Antimicrobial Properties. Ph.D. Thesis, Swinburne University of Technology, Melbourne, Australia, 2012. [Google Scholar]
- Iftikhar, A.; Ali, I. Kernel softness in wheat is determined by starch granule bound Puroindoline proteins. J. Plant Biochem. Biotechnol. 2017, 26, 247–262. [Google Scholar] [CrossRef]
- Morris, C.F. The antimicrobial properties of the puroindolines, a review. World J. Microbiol. Biotechnol. 2019, 35, 86. [Google Scholar] [CrossRef]
- Talukdar, P.K.; Turner, K.L.; Crockett, T.M.; Lu, X.; Morris, C.F.; Konkel, M.E. Inhibitory effect of puroindoline peptides on Campylobacter jejuni growth and biofilm formation. Front. Microbiol. 2021, 12, 702762. [Google Scholar] [CrossRef]
- Tian, P.; Lv, Y.; Wei, S.; Zhang, S.B.; Zheng, X.T.; Hu, Y.S. Antifungal activity of puroindoline protein from soft wheat against grain molds and its potential as a biocontrol agent. Lett. Appl. Microbiol. 2022, 75, 114–125. [Google Scholar] [CrossRef]
- Yuan, W.; Tian, P.; Lyu, A.; Lyu, Y.; Zhang, W.; Wei, S.; Hu, Y. Anti-fungal properties of puroindoline A against Aspergillus glaucus. Grain Oil Sci. Technol. 2020, 3, 1–8. [Google Scholar] [CrossRef]
- Tian, P.; Lv, Y.-Y.; Wei, S.; Zhang, S.-B.; Li, N.; Hu, Y.-S. Antifungal properties of recombinant Puroindoline B protein against aflatoxigenic Aspergillus flavus. LWT—Food Sci. Technol. 2021, 144, 111130. [Google Scholar] [CrossRef]
- Tian, P.; Lv, Y.-Y.; Lv, A.; Yuan, W.-J.; Zhan, S.-B.; Li, N.; Hu, Y.-S. Antifungal effects of fusion Puroindoline B on the surface and intracellular environment of Aspergillus flavus. Probiotics Antimicrob. Proteins 2021, 13, 249–260. [Google Scholar] [CrossRef]
- Livak, K.J.; Schmittgen, T.D. Analysis of relative gene expression data using real-time quantitative PCR and the 2−ΔΔCT method. Methods 2001, 25, 402–408. [Google Scholar] [CrossRef]
- Dichtl, K.; Helmschrott, C.; Dirr, F.; Wagener, J. Deciphering cell wall integrity signalling in Aspergillus fumigatus: Identification and functional characterization of cell wall stress sensors and relevant Rho GTPases. Mol. Microbiol. 2012, 83, 506–519. [Google Scholar] [CrossRef]
- Henry, C.; Latge, J.-P.; Beauvais, A. α-1,3 glucans are dispensable in Aspergillus fumigatus. Eukaryot. Cell 2012, 11, 26–29. [Google Scholar] [CrossRef] [PubMed]
- Henar Valdivieso, M.; Duran, A.; Roncero, C. Chitin synthases in yeast and fungi. Exs 1999, 87, 55–69. [Google Scholar] [PubMed]
- Kitagaki, H.; Wu, H.; Shimoi, H.; Ito, K. Two homologous genes, DCW1 (YKL046c) and DFG5, are essential for cell growth and encode glycosylphosphatidylinositol (GPI)-anchored membrane proteins required for cell wall biogenesis in Saccharomyces cerevisiae. Mol. Microbiol. 2002, 46, 1011–1022. [Google Scholar] [CrossRef]
- Beauvais, A.; Maubon, D.; Park, S.; Morelle, W.; Tanguy, M.; Huerre, M.; Perlin, D.S.; Latge, J.P. Two alpha(1-3) glucan synthases with different functions in Aspergillus fumigatus. Appl. Environ. Microbiol. 2005, 71, 1531–1538. [Google Scholar] [CrossRef]
- Maubon, D.; Park, S.; Tanguy, M.; Huerre, M.; Schmitt, C.; Prevost, M.C.; Perlin, D.S.; Latge, J.P.; Beauvais, A. AGS3, an α-(1-3)glucan synthase gene family member of Aspergillus fumigatus, modulates mycelium growth in the lung of experimentally infected mice. Fungal Genet. Biol. 2006, 43, 366–375. [Google Scholar] [CrossRef]
- Spreghini, E.; Davis, D.A.; Subaran, R.; Kim, M.; Mitchell, A.P. Roles of Candida albicans Dfg5p and Dcw1p cell surface proteins in growth and hypha formation. Eukaryot. Cell 2003, 2, 746–755. [Google Scholar] [CrossRef]
- Fukuda, K.; Yamada, K.; Deoka, K.; Yamashita, S.; Ohta, A.; Horiuchi, H. Class III chitin synthase ChsB of Aspergillus nidulans localizes at the sites of polarized cell wall synthesis and is required for Conidial Development. Eukaryot. Cell 2009, 8, 945–956. [Google Scholar] [CrossRef] [PubMed]
- Specht, C.A.; Liu, Y.; Robbins, P.W.; Bulawa, C.E.; Iartchouk, N.; Winter, K.R.; Riggle, P.J.; Rhodes, J.C.; Dodge, C.L.; Culp, D.W.; et al. The chsD and chsE genes of Aspergillus nidulans and their roles in chitin synthesis. Fungal Genet. Biol. 1996, 20, 153–167. [Google Scholar] [CrossRef]
- Son, Y.-E.; Cho, H.-J.; Chen, W.; Son, S.-H.; Lee, M.-K.; Yu, J.-H.; Park, H.-S. The role of the VosA-repressed dnjA gene in development and metabolism in Aspergillus species. Curr. Genet. 2020, 66, 621–633. [Google Scholar] [CrossRef]
- Kim, M.-J.; Lee, M.-K.; Pham, H.Q.; Gu, M.J.; Zhu, B.; Son, S.-H.; Hahn, D.; Shin, J.-H.; Yu, J.-H.; Park, H.-S.; et al. The velvet regulator VosA governs survival and secondary metabolism of sexual spores in Aspergillus nidulans. Genes 2020, 11, 103. [Google Scholar] [CrossRef]
- Ni, M.; Yu, J.-H. A novel regulator couples sporogenesis and trehalose biogenesis in Aspergillus nidulans. PLoS ONE 2007, 2, e970. [Google Scholar] [CrossRef] [PubMed]
- Valsecchi, I.; Dupres, V.; Stephen-Victor, E.; Guijarro, J.I.; Gibbons, J.; Beau, R.; Bayry, J.; Coppee, J.-Y.; Lafont, F.; Latge, J.-P.; et al. Role of hydrophobins in Aspergillus fumigatus. J. Fungi 2018, 4, 2. [Google Scholar] [CrossRef]
- Stringer, M.A.; Timberlake, W.E. dewA encodes a fungal hydrophobin component of the Aspergillus spore wall. Mol. Microbiol. 1995, 16, 33–44. [Google Scholar] [CrossRef] [PubMed]
- Halliwell, B. Free radicals, proteins and DNA: Oxidative damage versus redox regulation. Biochem. Soc. Trans. 1996, 24, 1023–1027. [Google Scholar] [CrossRef]
- Moradas-Ferreira, P.; Costa, V.; Piper, P.; Mager, W. The molecular defences against reactive oxygen species in yeast. Mol. Microbiol. 1996, 19, 651–658. [Google Scholar] [CrossRef]
- Wang, T.; Li, P.; Zhang, Q.; Zhang, W.; Zhang, Z.W.; Dong, X.L.; Wang, T. Production of monoclonal antibodies against AFLD (Nor-1),an early key protein involved in aflatoxin biosynthesis. Oil Crop Sci. 2018, 3, 50–56. [Google Scholar]
- Shima, Y.; Shiina, M.; Shinozawa, T.; Ito, Y.; Nakajima, H.; Adachi, Y.; Yabe, K. Participation in aflatoxin biosynthesis by a reductase enzyme encoded by vrdA gene outside the aflatoxin gene cluster. Fungal Genet. Biol. 2009, 46, 221–231. [Google Scholar] [CrossRef]
- Jamali, M.; Karimipour, M.; Shams-Ghahfarokhi, M.; Amani, A.; Razzaghi-Abyaneh, M. Expression of aflatoxin genes aflO (omtB) and aflQ (ordA) differentiates levels of aflatoxin production by Aspergillus flavus strains from soils of pistachio orchards. Res. Microbiol. 2013, 164, 293–299. [Google Scholar] [CrossRef]
- Kooijman, M.; Orsel, R.; Hessing, M.; Hamer, R.; Bekkers, A. Spectroscopic characterisation of the lipid-binding properties of wheat puroindolines. J. Cereal Sci. 1997, 26, 145–159. [Google Scholar] [CrossRef]
- Charnet, P.; Molle, G.; Marion, D.; Rousset, M.; Lullien-Pellerin, V. Puroindolines form ion channels in biological membranes. Biophys. J. 2003, 84, 2416–2426. [Google Scholar] [CrossRef]
- Bhave, M.; Morris, C.F. Molecular genetics of puroindolines and related genes: Regulation of expression, membrane binding properties and applications. Plant Mol. Biol. 2008, 66, 221–231. [Google Scholar] [CrossRef] [PubMed]
- Yan, N. Structural advances for the major facilitator superfamily (MFS) transporters. Trends Biochem. Sci. 2013, 38, 151–159. [Google Scholar] [CrossRef] [PubMed]
- Widiyanto, T.W.; Chen, X.; Iwatani, S.; Chibana, H.; Kajiwara, S. Role of major facilitator superfamily transporter Qdr2p in biofilm formation by Candida glabrata. Mycoses 2019, 62, 1154–1163. [Google Scholar] [CrossRef] [PubMed]
- Liu, L.; Yan, Y.; Huang, J.; Hsiang, T.; Wei, Y.; Li, Y.; Gao, J.; Zheng, L. A novel MFS transporter gene ChMfs1 is important for hyphal morphology, conidiation, and pathogenicity in Colletotrichum higginsianum. Front. Microbiol. 2017, 8, 1953. [Google Scholar] [CrossRef]
- Chen, Y.; Zhou, G.; Liu, J. A major facilitator superfamily transporter in Colletotrichum fructicola (CfMfs1) is required for sugar transport, appressorial turgor pressure, conidiation and pathogenicity. For. Pathol. 2019, 49, e12558. [Google Scholar] [CrossRef]
- Wu, Z.; Wang, S.; Yuan, Y.; Zhang, T.; Liu, J.; Liu, D. A novel major facilitator superfamily transporter in Penicillium digitatum (Pdmfs2) is required for prochloraz resistance, conidiation and full virulence. Biotechnol. Lett. 2016, 38, 1349–1357. [Google Scholar] [CrossRef]
- Park, Y.-S.; Lian, H.; Chang, M.; Kang, C.-M.; Yun, C.-W. Identification of high-affinity copper transporters in Aspergillus fumigatus. Fungal Genet. Biol. 2014, 73, 29–38. [Google Scholar] [CrossRef]
- Park, Y.-S.; Kim, J.-Y.; Yun, C.-W. Identification of ferrichrome- and ferrioxamine B-mediated iron uptake by Aspergillus fumigatus. Biochem. J. 2016, 473, 1203–1213. [Google Scholar] [CrossRef]
- Yang, J.; Xu, X.; Liu, G. Amplification of an MFS transporter encoding gene penT significantly stimulates Penicillin production and enhances the sensitivity of Penicillium chrysogenum to phenylacetic acid. J. Genet. Genom. 2012, 39, 593–602. [Google Scholar] [CrossRef]

| Gene ID | Gene Description/Homologous Gene | Log2FoldChange | Style | ||
|---|---|---|---|---|---|
| A vs. B | A vs. C | A vs. D | |||
| DEGs related to cell wall | |||||
| AFLA_116810 | Alpha-1,3-glucan synthase/Ags3 | −1.51 * | −2.35 * | −3.24 * | down |
| AFLA_134100 | Alpha-1,3-glucan synthase/Ags2 | −1.19 | −1.33 * | −1.06 * | down |
| AFLA_095960 | Chitin synthase D/chsD | −0.42 | −1.11 * | −1.30 * | down |
| AFLA_002940 | Endo-1,6-alpha-mannosidase/DCW1 | −2.03 * | −1.61 * | −1.42 * | down |
| DEGs related to sporulation | |||||
| AFLA_074470 | Spore development regulator/vosA | −0.98 | −2.01 * | −3.11 * | down |
| AFLA_044790 | Conidiation-specific family protein | 0.38 | −0.53 | −1.19 * | down |
| AFLA_060780 | Spore-wall fungal hydrophobin/dewA | 1.43 * | 1.33 * | 1.28 * | up |
| DEGs related to redox function | |||||
| AFLA_100250 | Catalase/CAT | −0.01 | −0.66 | −2.25 * | down |
| AFLA_056170 | Catalase A/catA | −0.16 | −0.91 * | −1.26 * | down |
| AFLA_075800 | FAD-linked oxidoreductase/patO | −1.29 * | −1.14 * | −1.15 * | down |
| AFLA_033420 | Superoxide dismutase/sodB | 0.87 * | 1.06 * | 1.13 * | up |
| DEGs related to aflatoxin synthesis | |||||
| AFLA_046360 | Acetyl-CoA carboxylase | −0.84 | −0.77 | −1.06 * | down |
| AFLA_125300 | Short chain type dehydrogenase/aflD | −0.73 | −2.92 * | −2.50 * | down |
| AFLA_090030 | Aryl-alcohol dehydrogenase/vrdA | −1.25 | −2.10 * | −1.87 * | down |
| AFLA_139200 | Cytochrome P450 monooxygenase/aflQ | -Inf | -Inf | -Inf | down |
| DEGs related to transport function | |||||
| AFLA_106900 | MFS antiporter/qdr2 | −7.11 * | -Inf * | -Inf * | down |
| AFLA_106910 | MFS membrane transporter | −6.77 * | −7.31 * | −7.61 * | down |
| AFLA_002590 | MFS transporter/mrr1 | −1.03 * | −2.57 * | −4.50 * | down |
| AFLA_116990 | MFS monosaccharide transporter/HXT3 | −1.28 * | −4.33 * | −4.43 * | down |
| AFLA_104430 | ABC transporter/tagD | −2.13 * | −3.56 * | −3.31 * | down |
| AFLA_060080 | ABC transporter/FUM19 | −1.40 * | −2.90 * | −3.11 * | down |
Disclaimer/Publisher’s Note: The statements, opinions and data contained in all publications are solely those of the individual author(s) and contributor(s) and not of MDPI and/or the editor(s). MDPI and/or the editor(s) disclaim responsibility for any injury to people or property resulting from any ideas, methods, instructions or products referred to in the content. |
© 2025 by the authors. Licensee MDPI, Basel, Switzerland. This article is an open access article distributed under the terms and conditions of the Creative Commons Attribution (CC BY) license (https://creativecommons.org/licenses/by/4.0/).
Share and Cite
Tian, P.; Li, C.; Lv, Y.; Gu, S.; Hu, Y. Transcriptome Sequencing Revealed an Inhibitory Mechanism of Recombinant Puroindoline B Protein on Aspergillus flavus. Foods 2025, 14, 1903. https://doi.org/10.3390/foods14111903
Tian P, Li C, Lv Y, Gu S, Hu Y. Transcriptome Sequencing Revealed an Inhibitory Mechanism of Recombinant Puroindoline B Protein on Aspergillus flavus. Foods. 2025; 14(11):1903. https://doi.org/10.3390/foods14111903
Chicago/Turabian StyleTian, Pingping, Cuixiang Li, Yangyong Lv, Shaobin Gu, and Yuansen Hu. 2025. "Transcriptome Sequencing Revealed an Inhibitory Mechanism of Recombinant Puroindoline B Protein on Aspergillus flavus" Foods 14, no. 11: 1903. https://doi.org/10.3390/foods14111903
APA StyleTian, P., Li, C., Lv, Y., Gu, S., & Hu, Y. (2025). Transcriptome Sequencing Revealed an Inhibitory Mechanism of Recombinant Puroindoline B Protein on Aspergillus flavus. Foods, 14(11), 1903. https://doi.org/10.3390/foods14111903