Comparative Evaluation of Spray-Drying Versus Freeze-Drying Techniques on the Encapsulation Efficiency and Biofunctional Performance of Chenpi Extract Microcapsules

Abstract

1. Introduction
2. Materials and Methods
2.1. Materials
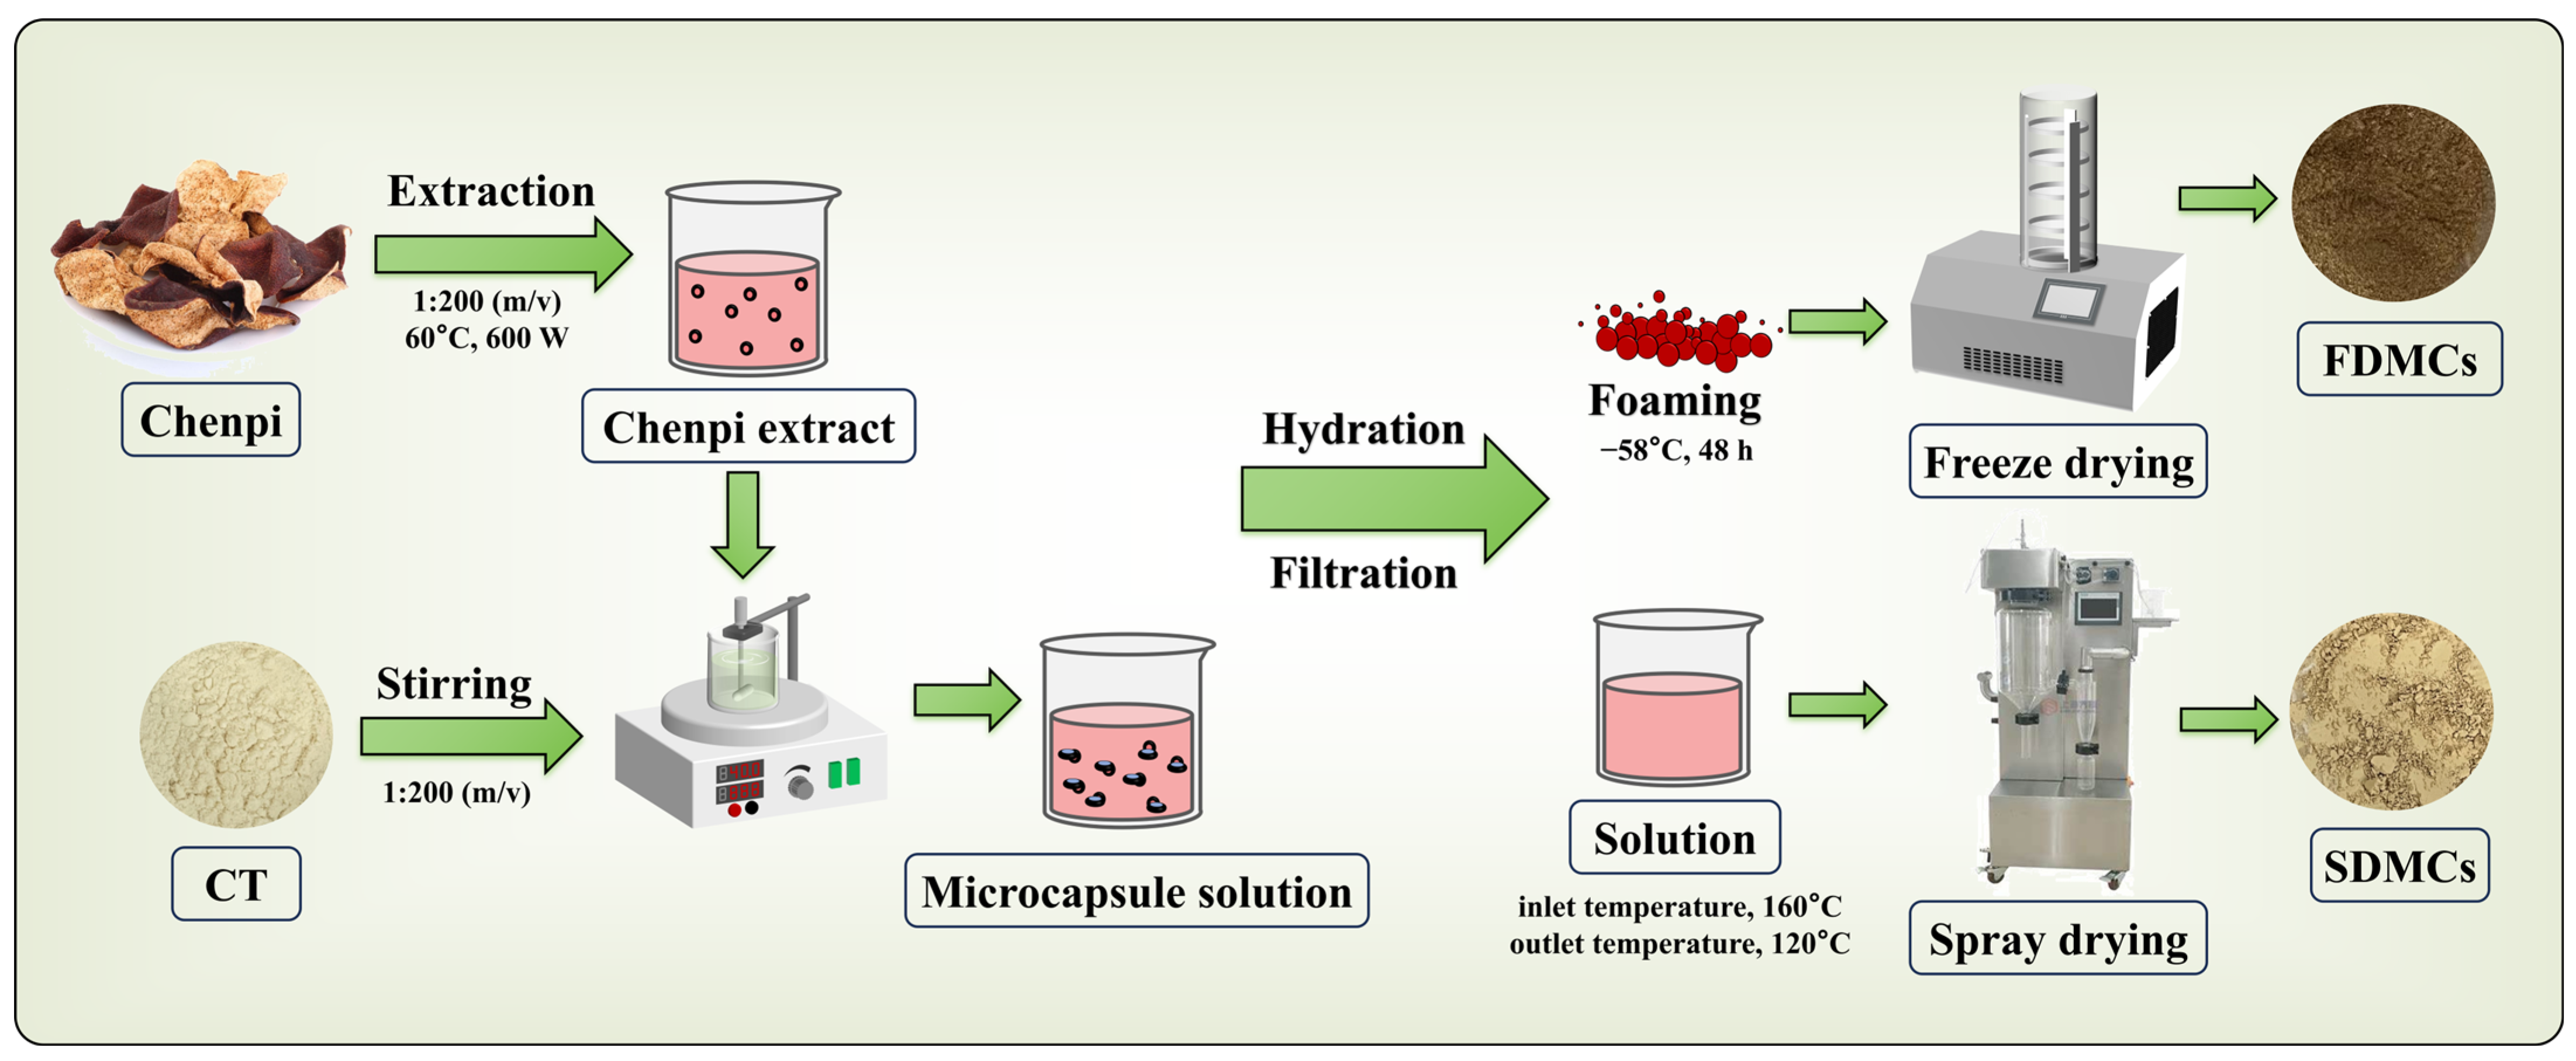
2.2. Preparation of CPE and Microcapsules
2.2.1. Preparation of CPE
2.2.2. Preparation of Microcapsule Solution
2.2.3. Preparation of Freeze-Dried Microcapsules (FDMCs) of CPE
2.2.4. Preparation of Spray-Dried Microcapsules (SDMC) of CPE
2.3. Physical Properties of Microcapsules
2.3.1. Moisture Content
2.3.2. Hygroscopicity
2.3.3. Bulk Density
2.3.4. Water Solubility
2.4. Characterization of Microcapsules
2.4.1. Ultraviolet Spectra
2.4.2. Particle Size and Polydispersity Index (PDI)
2.4.3. Fourier-Transform Infrared (FT-IR) Spectroscopy
2.4.4. X-Ray Diffraction (XRD)
2.4.5. Scanning Electron Microscopy (SEM)
2.5. Thermal Analysis
2.5.1. Differential Scanning Calorimetry (DSC)
2.5.2. Thermal Gravimetric Analyses (TGA), Derivative Thermogravimetric (DTG) Analyses
2.6. Encapsulation Efficiency (EE) of Active Compounds
2.6.1. Quantification of Total Contents of Flavonoids, Polyphenols, and Sugars
2.6.2. Quantification of Three Main Flavonoid Components
2.7. Volatile Organic Compounds Analysis
2.8. Storage Stability
2.9. Bioactivity Assessment
2.9.1. Analysis of Antioxidant Activity
2.9.2. Analysis of Hypoglycemic Activity
2.10. In Vitro Digestion Simulation
2.11. Data Statistics and Analysis
3. Results and Discussion
3.1. Effect of Drying Process on the Physical Properties and Active Compounds Content of Microcapsules
3.2. Structural Differences of Microcapsules Under Different Drying Process
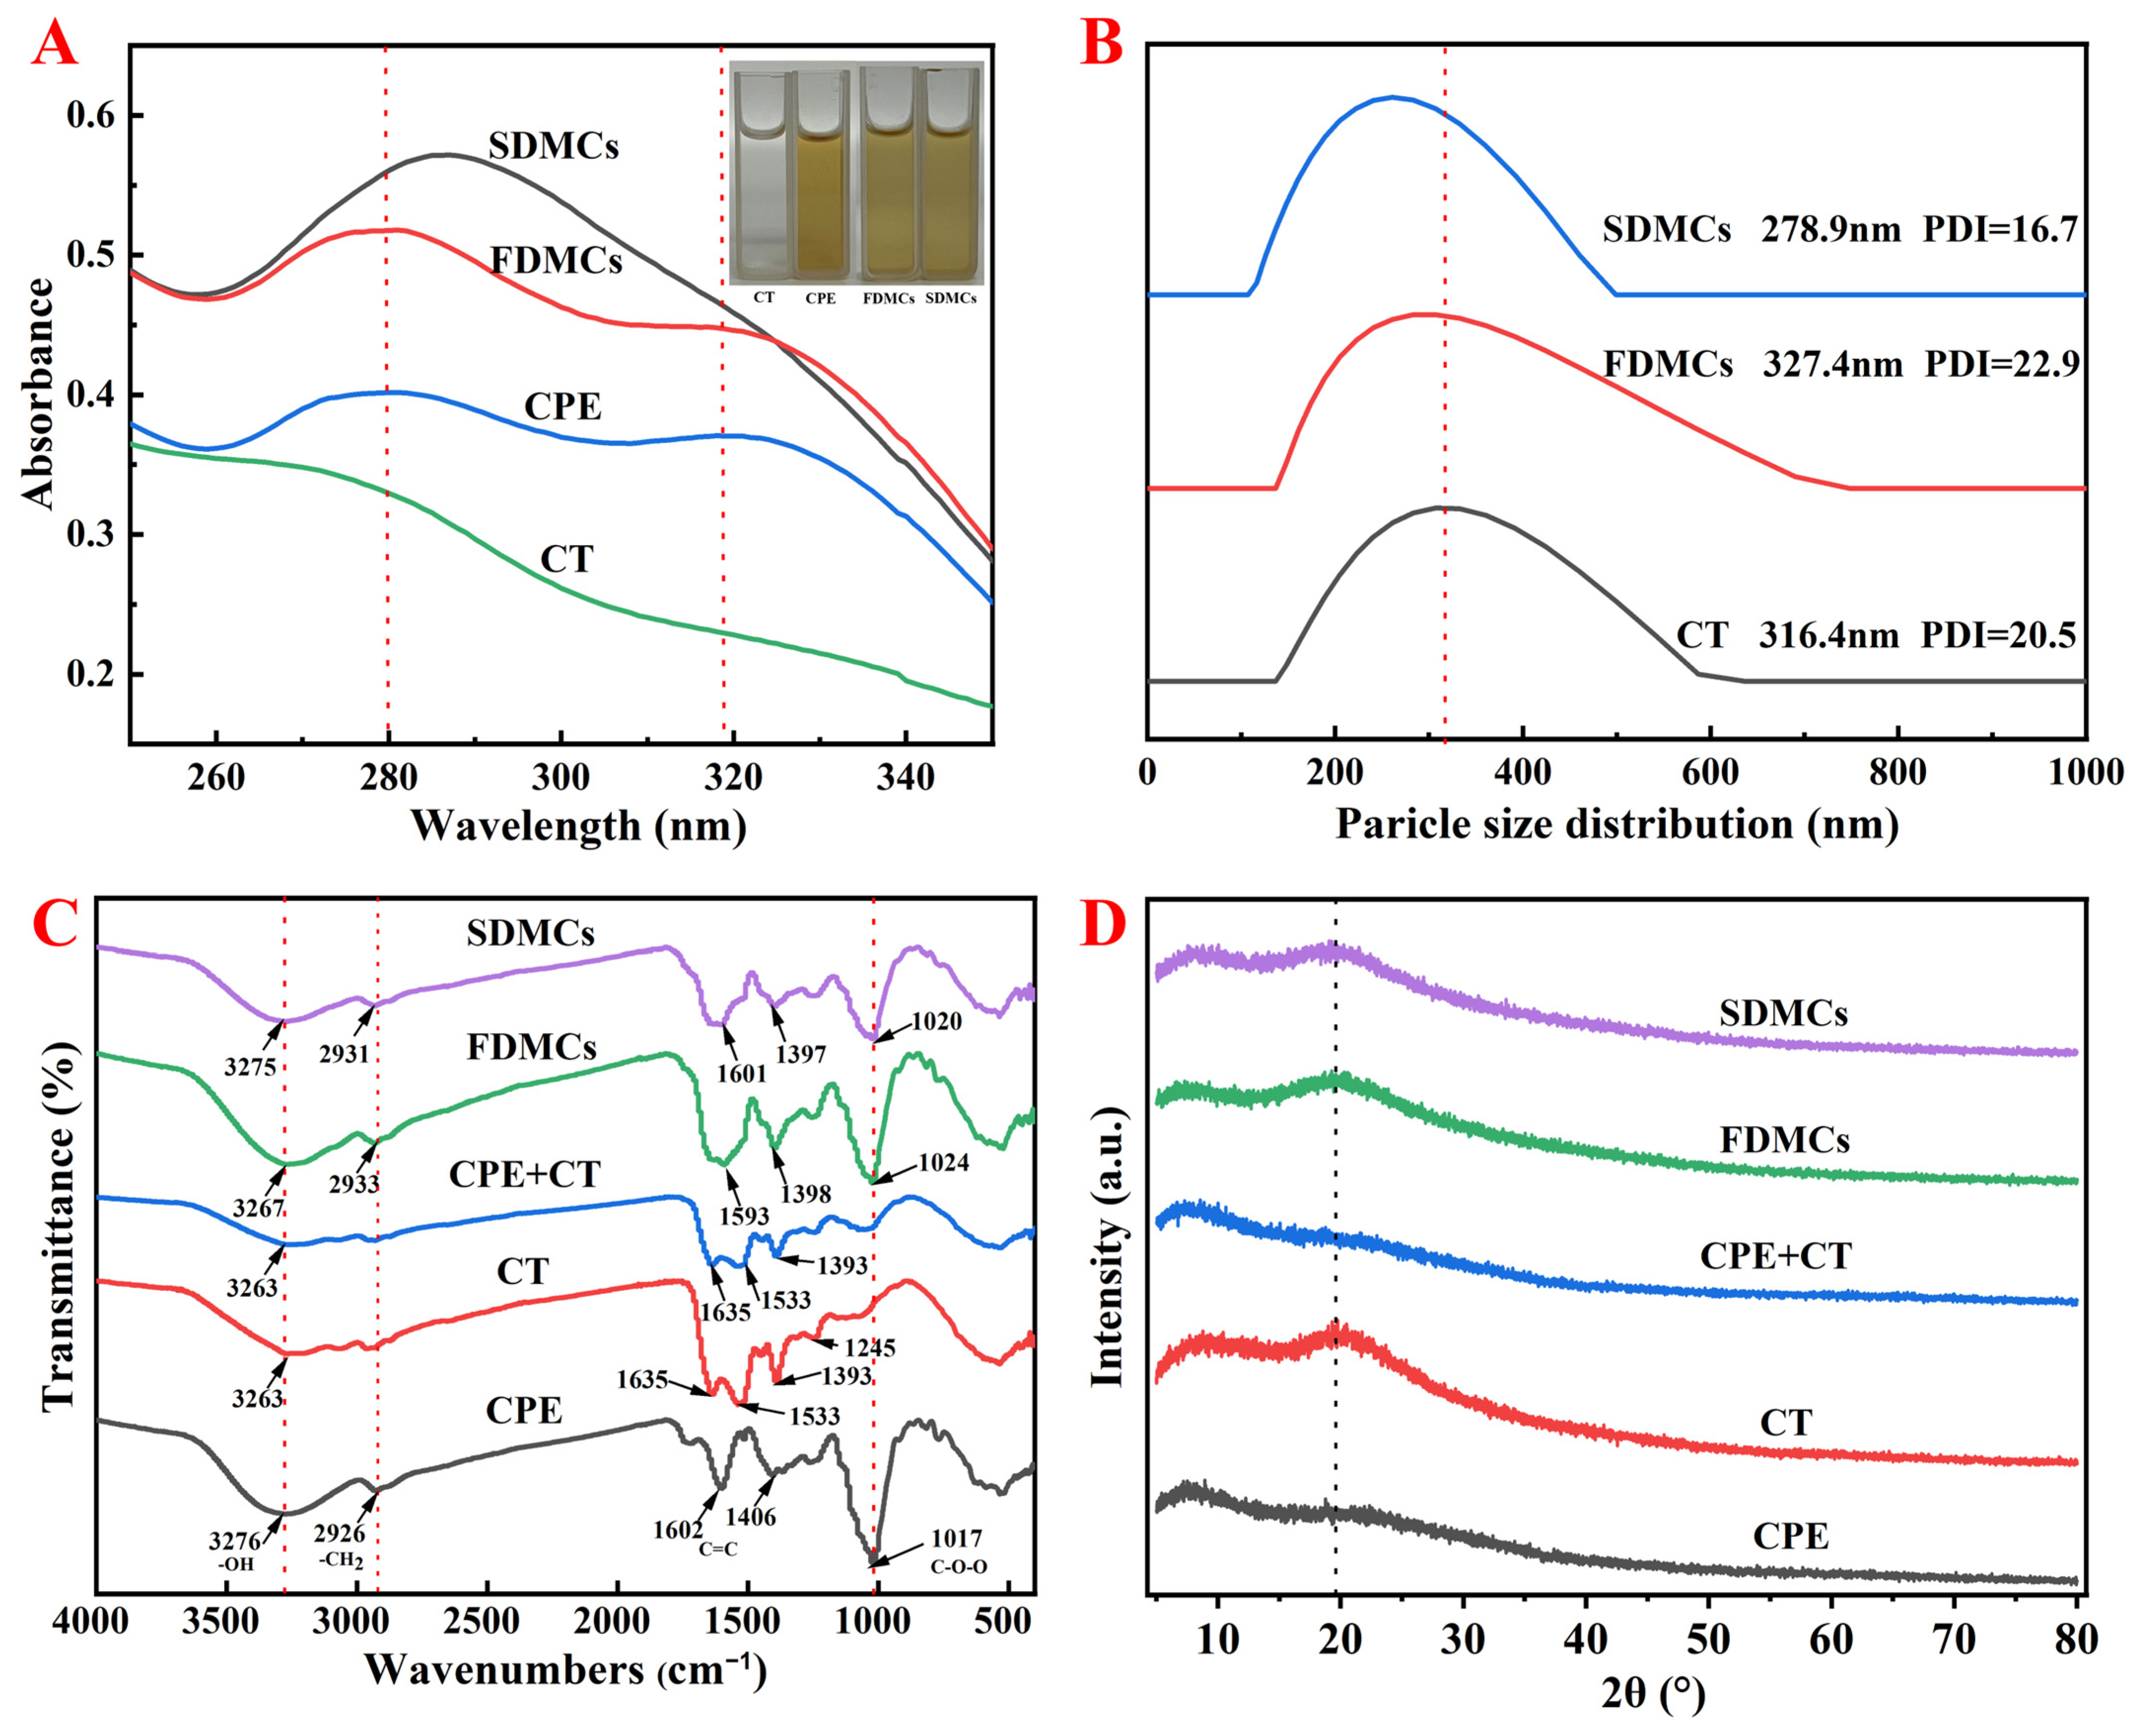
3.2.1. Differences in UV–Vis Spectral Peaks
3.2.2. Differences in Microcapsule Size Distribution and PDI
3.2.3. Differences of Intermolecular Interactions of Microcapsules
3.2.4. Analysis of XRD
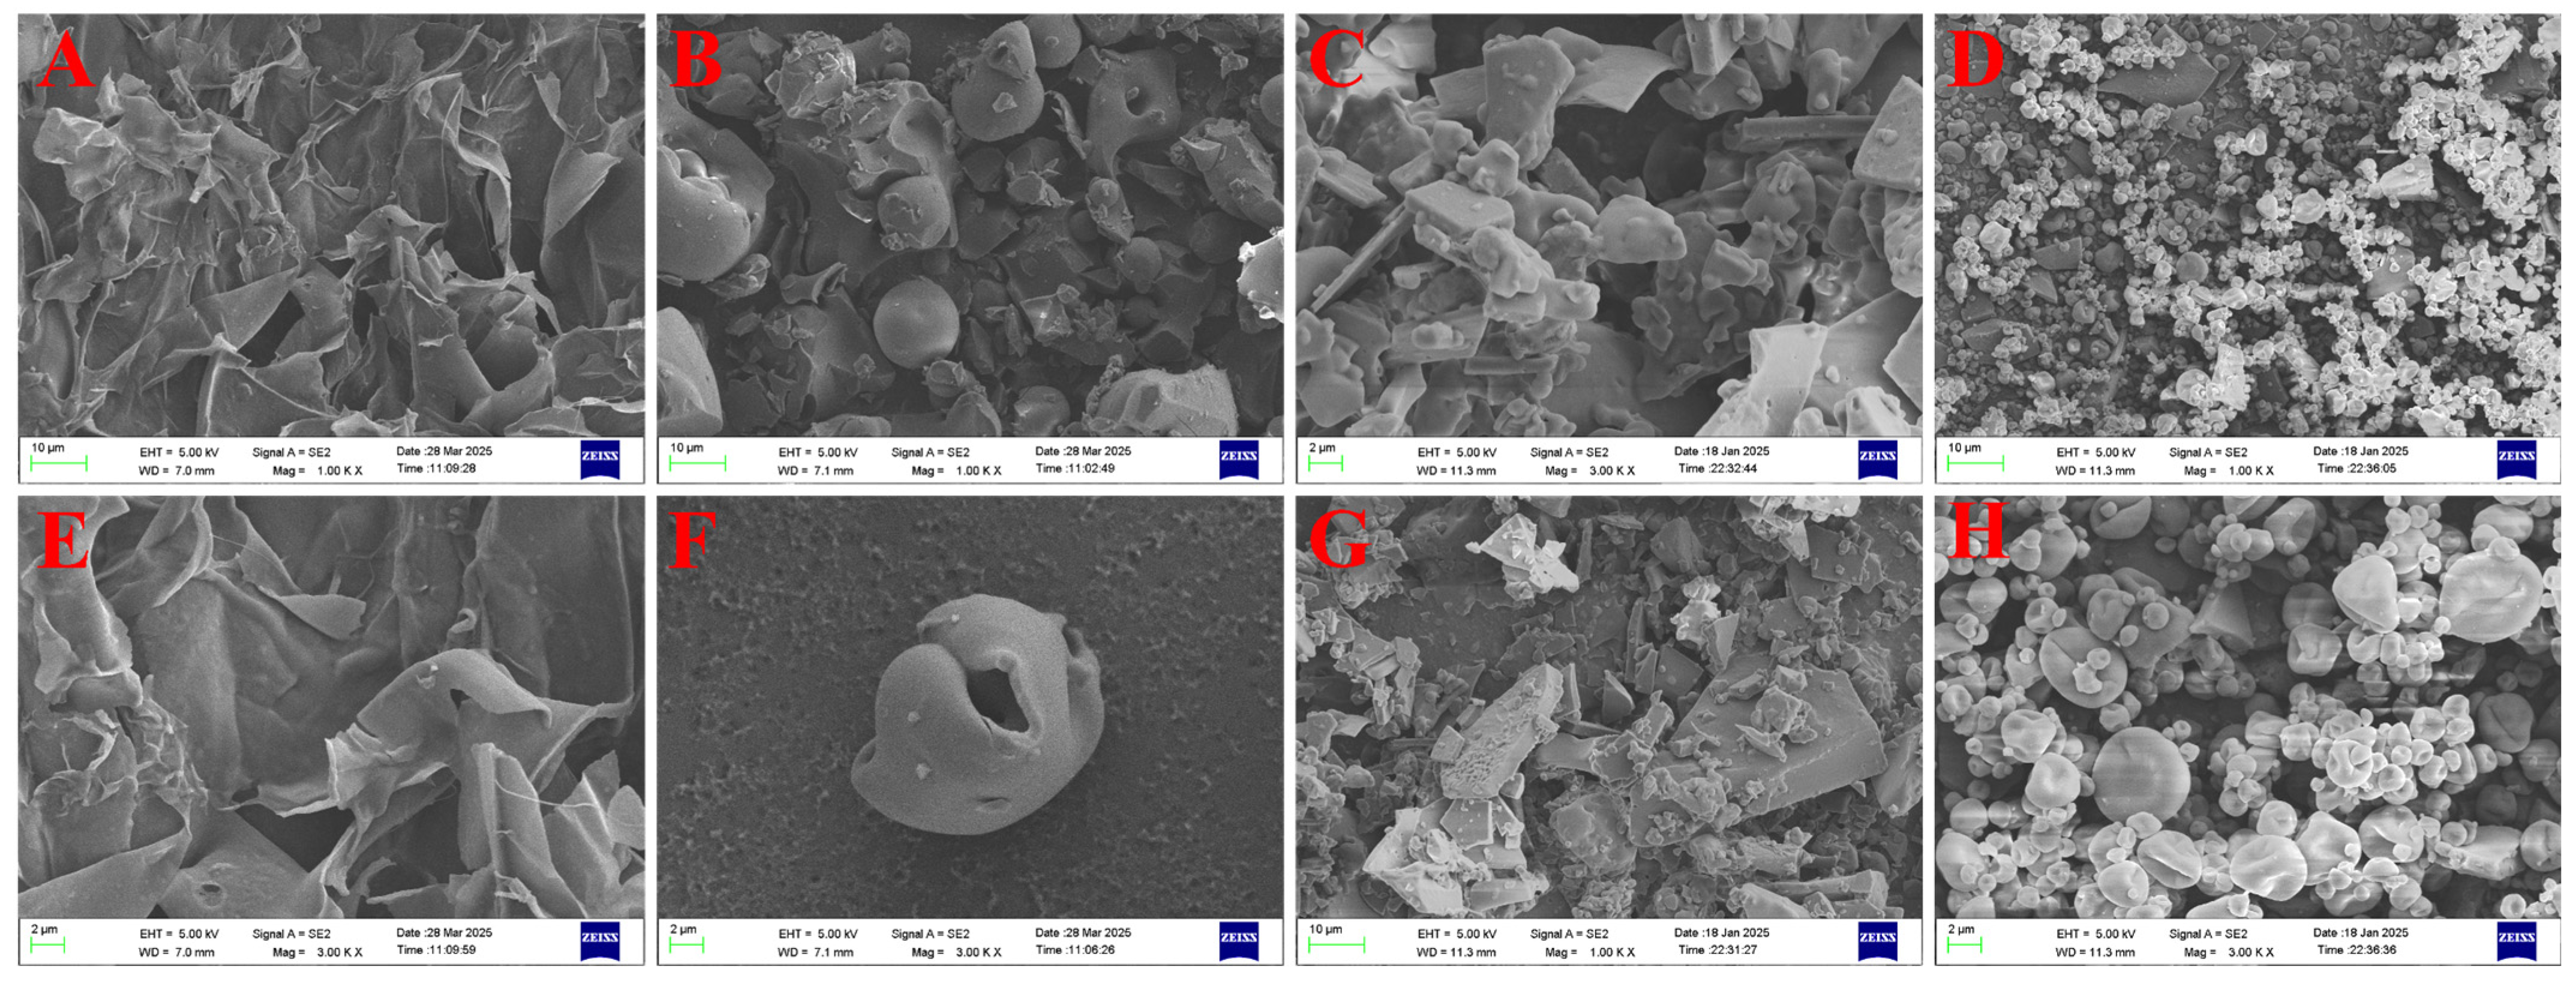
3.2.5. Morphological Differences of Microencapsulated Microcapsules
3.3. Effect of Drying Processes on the Thermal Analysis of Microcapsules
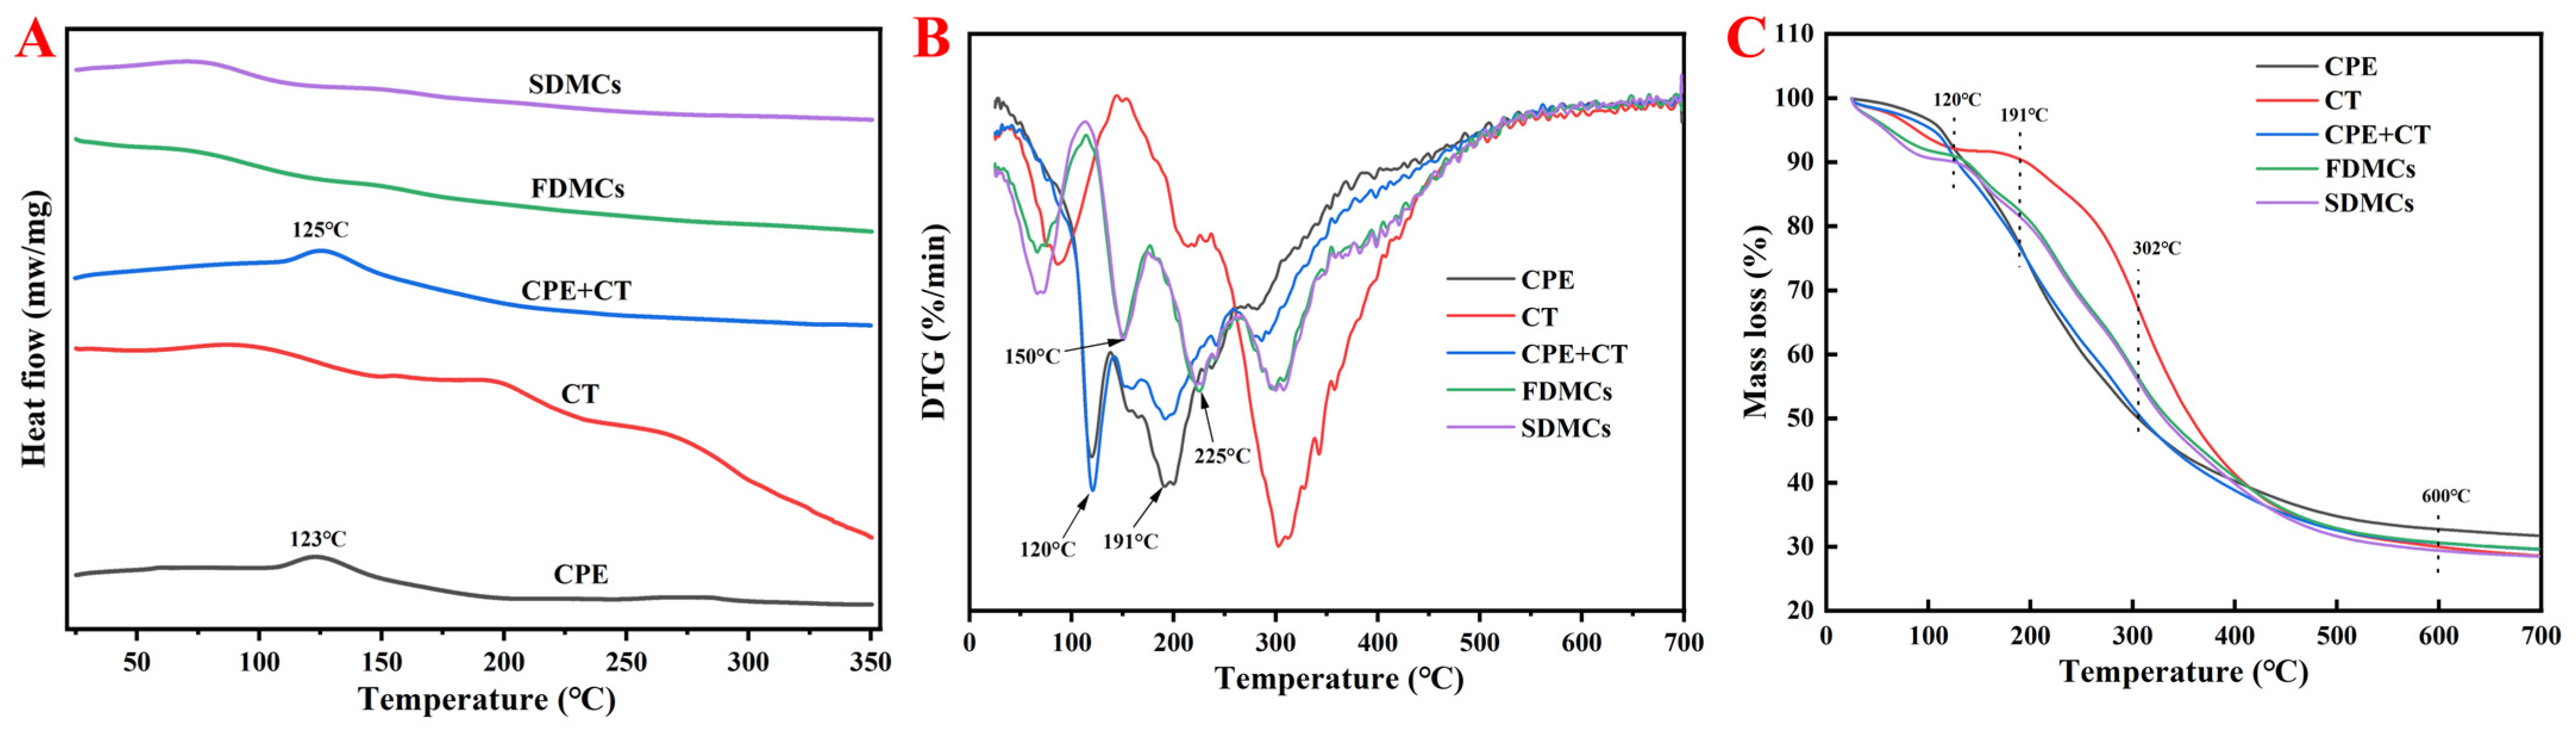
3.3.1. DSC Analyses
3.3.2. DTG and TGA Analyses
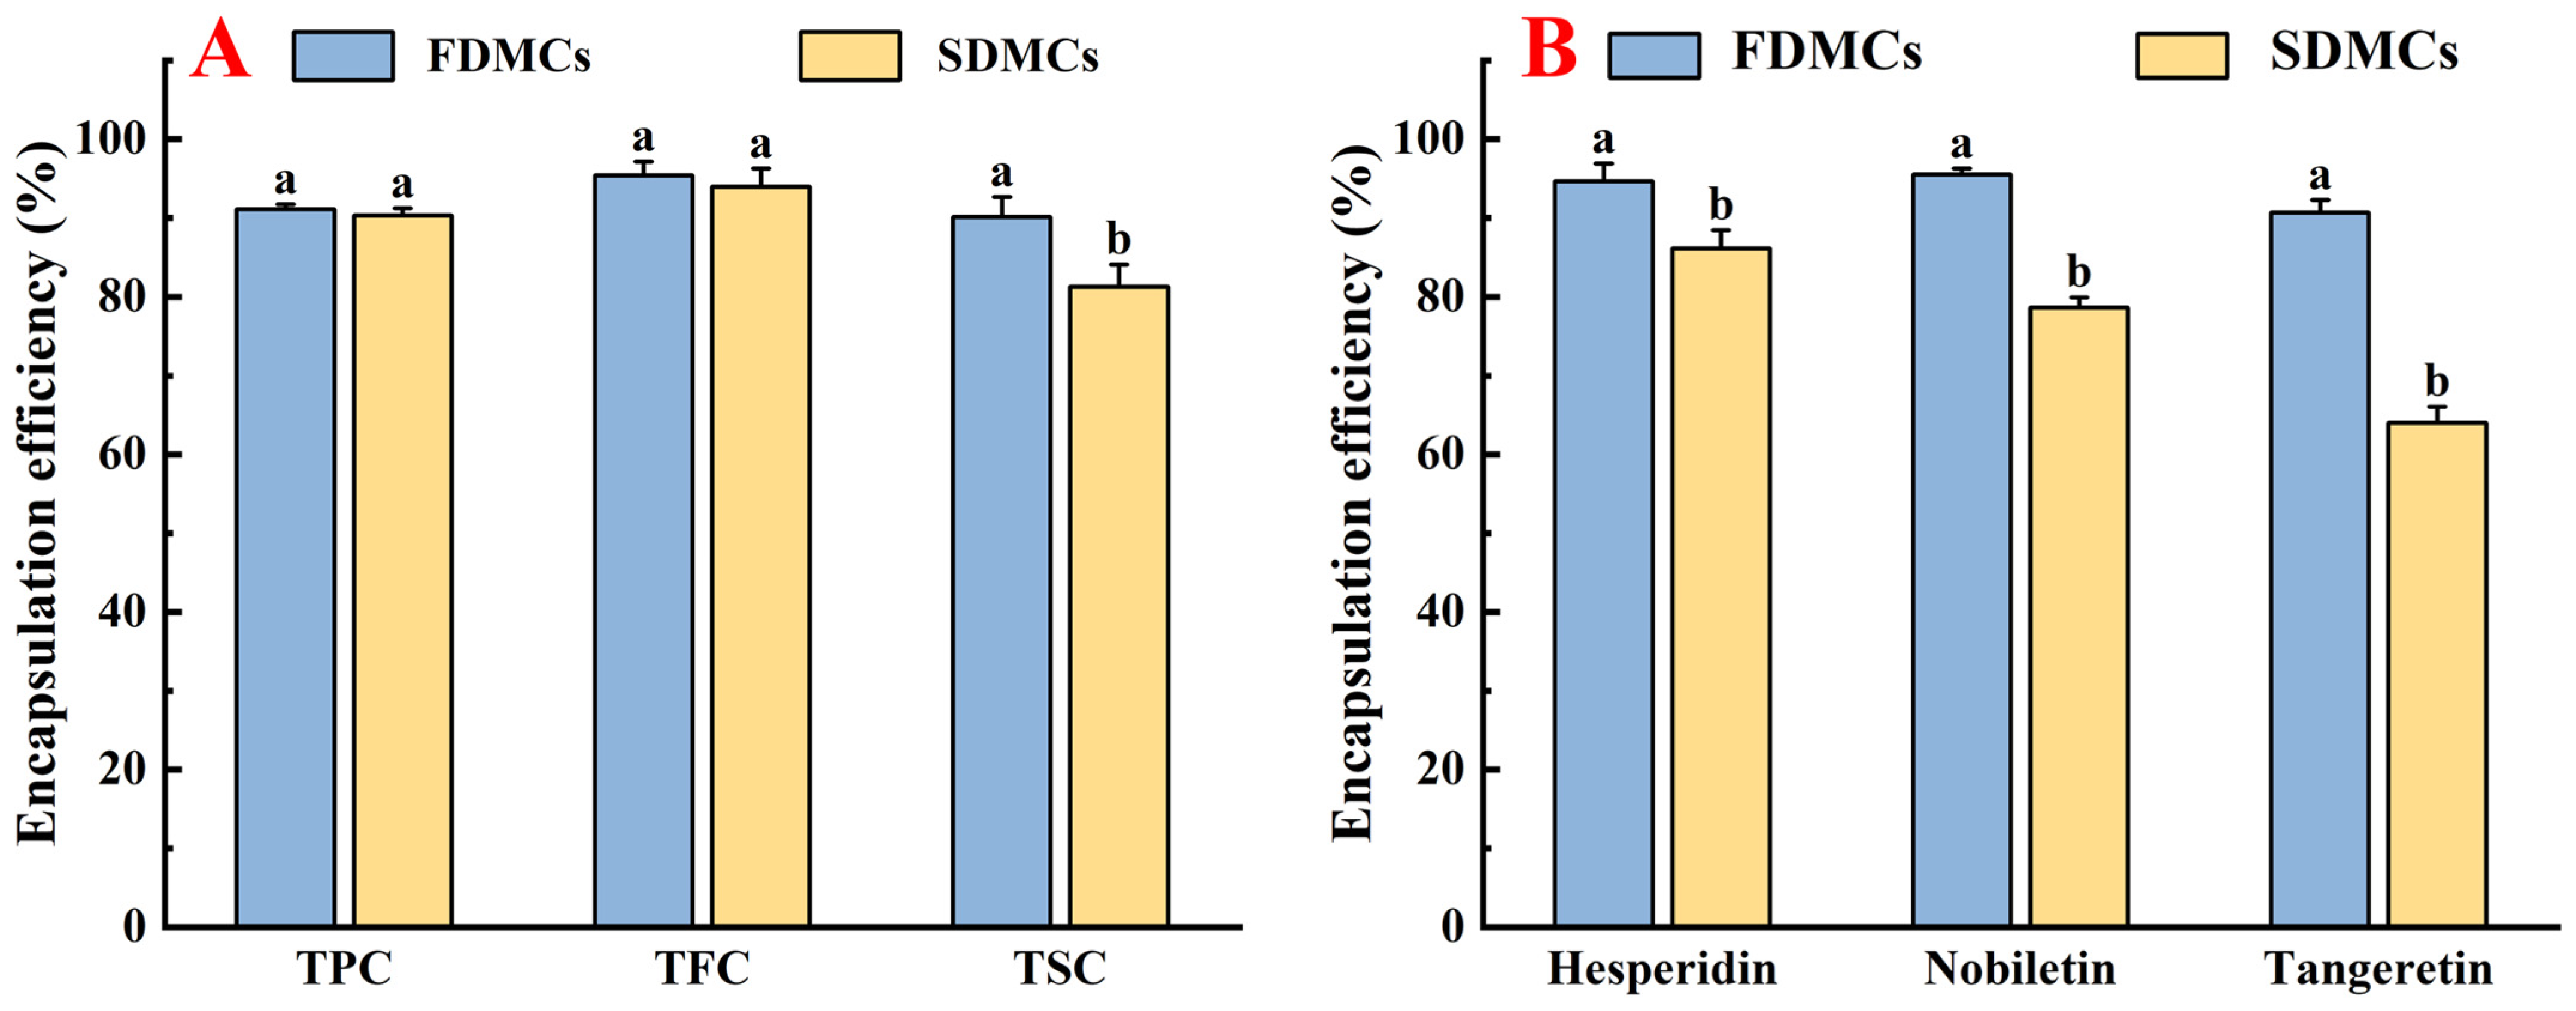
3.4. Effect of Drying Processes on the EE of Active Components of Microcapsules
3.5. Effect of Drying Processes on the Retention Rate of VOCs in Microcapsules
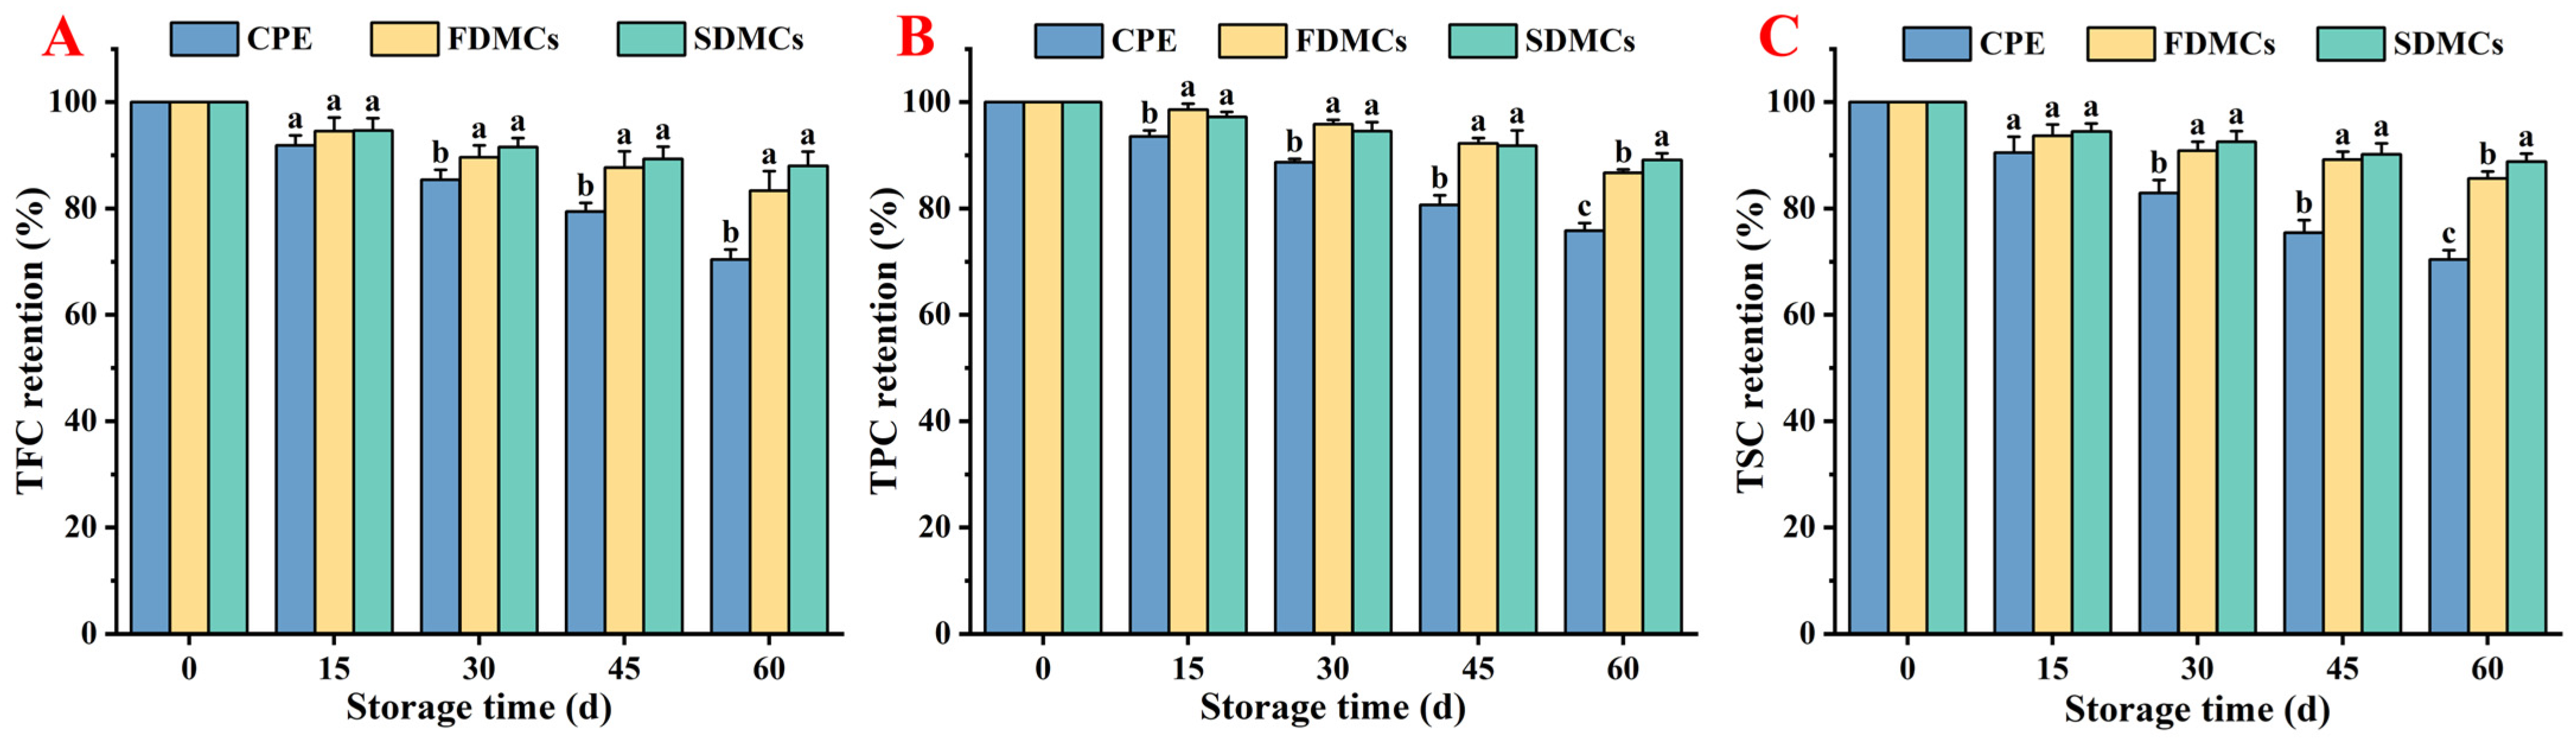
3.6. Effect of Drying Processes on the Storage Stability of Microcapsules
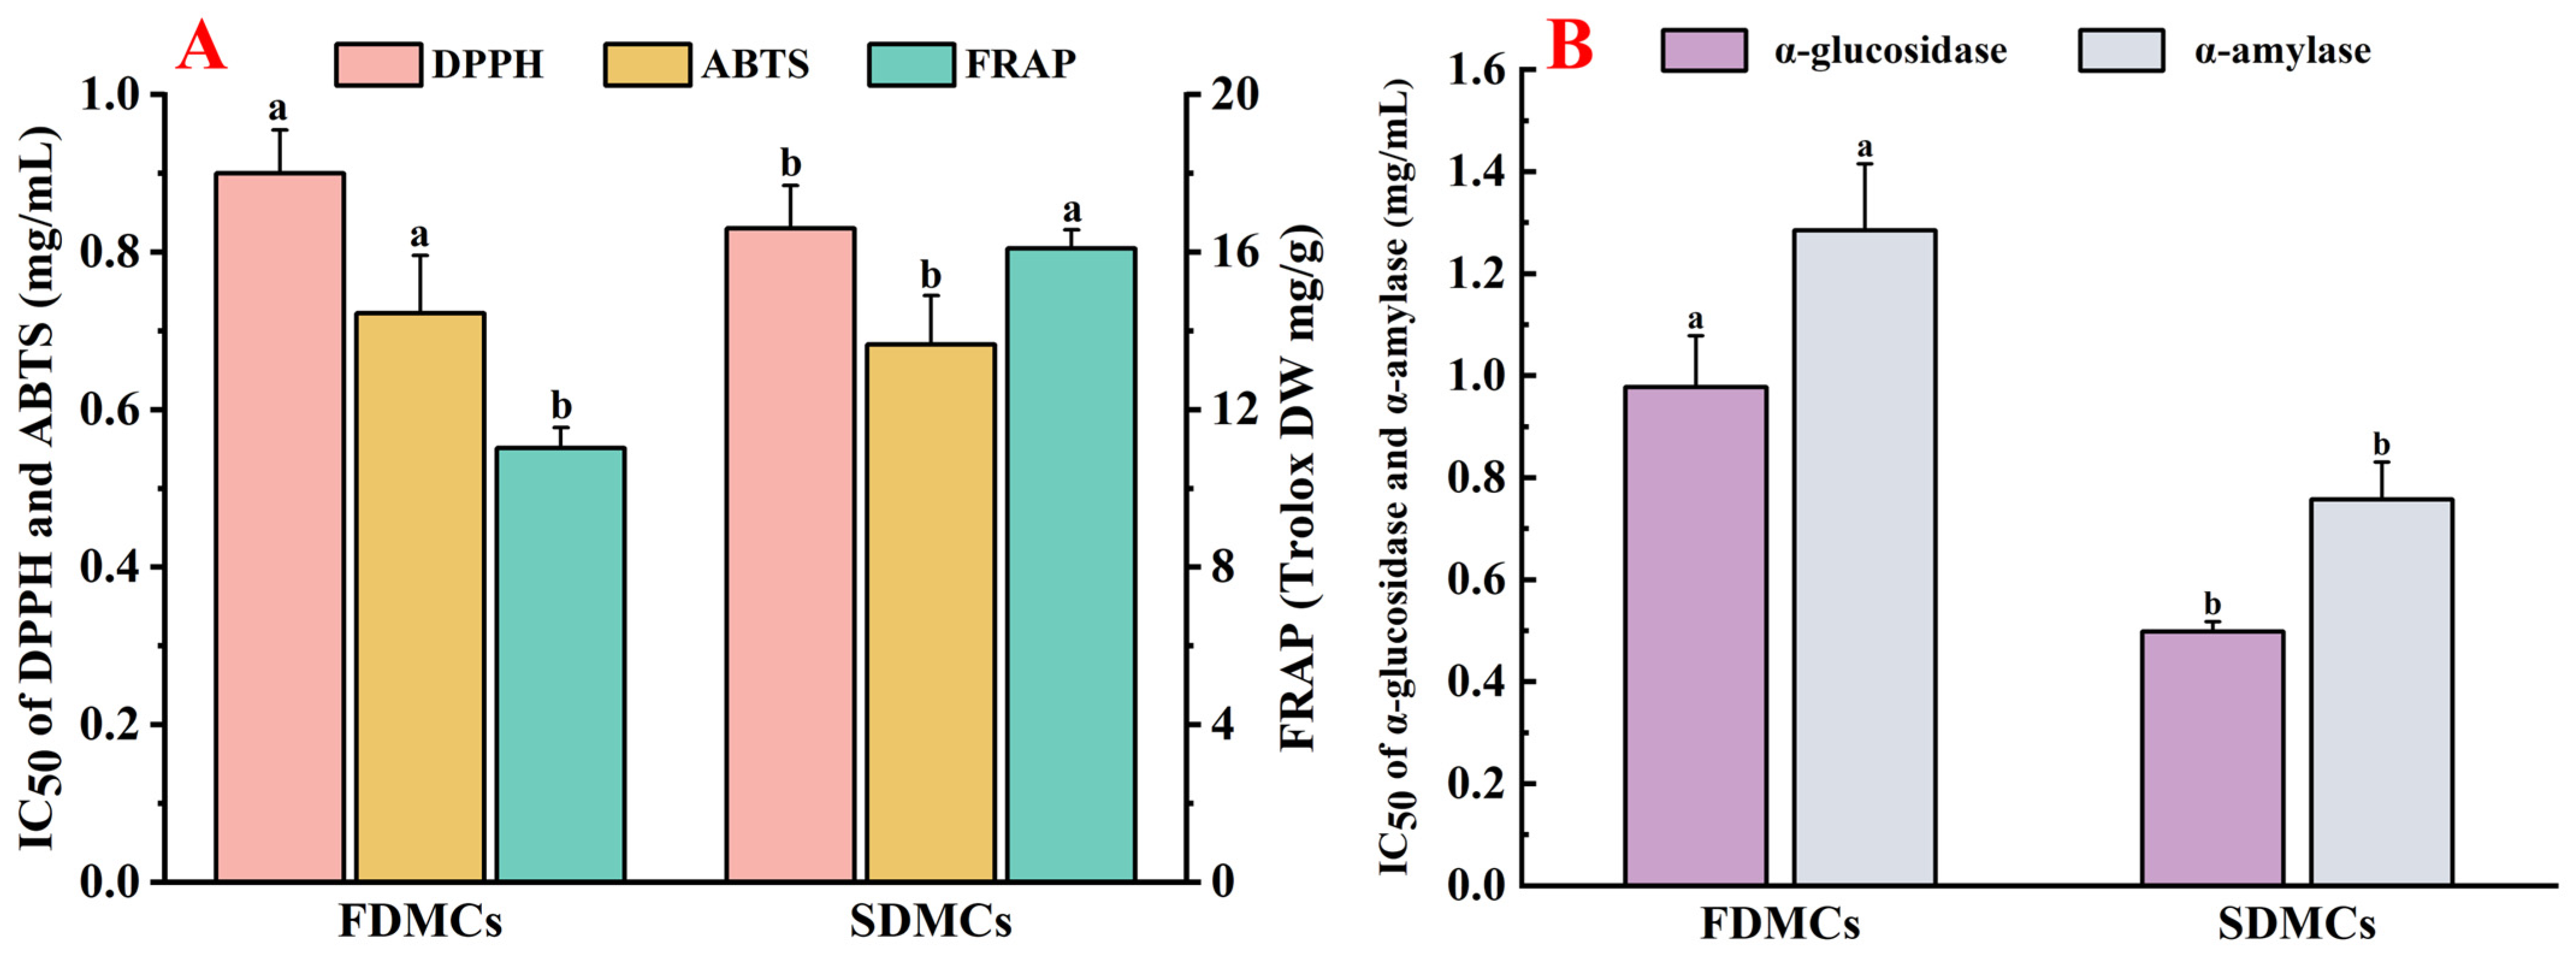
3.7. Effect of Drying Processes on the Bioactivity of Microcapsules
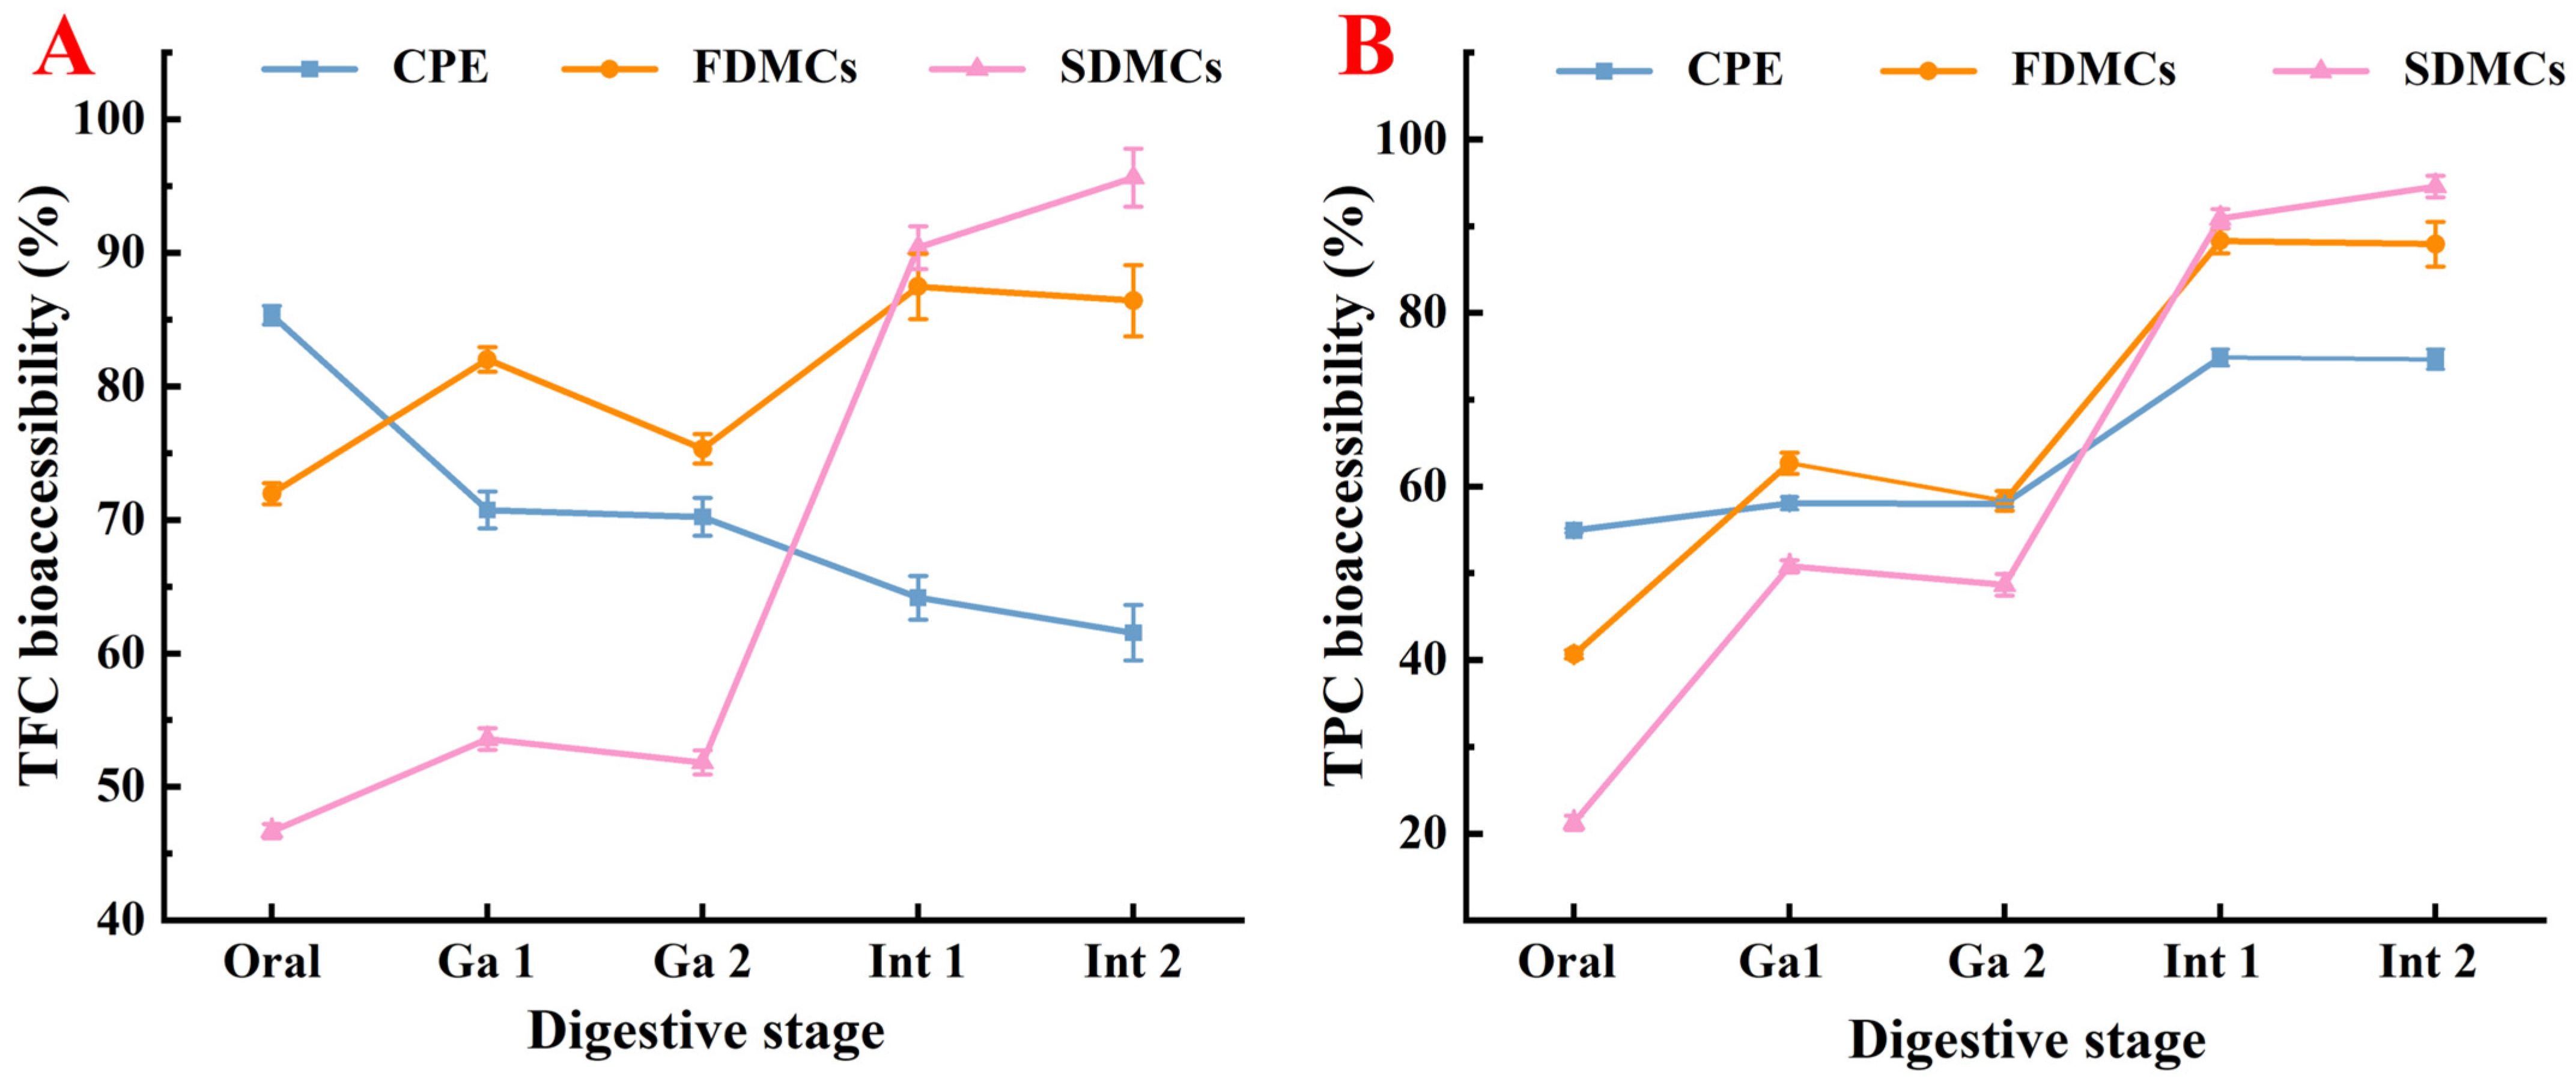
3.8. Effect of Drying Processes on the Bioaccessibility of Microcapsules
4. Conclusions
Author Contributions
Funding
Institutional Review Board Statement
Informed Consent Statement
Data Availability Statement
Conflicts of Interest
References
- Chen, X.M.; Tait, A.R.; Kitts, D.D. Flavonoid composition of orange peel and its association with antioxidant and anti-inflammatory activities. Food Chem. 2017, 218, 15–21. [Google Scholar] [CrossRef] [PubMed]
- Ning, F.; Wang, X.; Zheng, H.; Zhang, K.; Bai, C.; Peng, H.; Huang, Q.; Xiong, H. Improving the bioaccessibility and in vitro absorption of 5-demethylnobiletin from chenpi by se-enriched peanut protein nanoparticles-stabilized pickering emulsion. J. Funct. Foods 2019, 55, 76–85. [Google Scholar] [CrossRef]
- Li, A.; Wang, N.; Li, N.; Li, B.; Yan, F.; Song, Y.; Hou, J.; Huo, G. Modulation effect of chenpi extract on gut microbiota in high-fat diet-induced obese C57BL/6 mice. J. Food Biochem. 2021, 45, e13541. [Google Scholar] [CrossRef] [PubMed]
- Li, H.; Lin, L.; Feng, Y.; Zhao, M. Exploration of optimal preparation strategy of Chenpi (pericarps of Citrus reticulata Blanco) flavouring essence with great application potential in sugar and salt-reduced foods. Food Res. Int. 2024, 175, 113669. [Google Scholar] [CrossRef]
- Rocha, J.D.C.G.; de Barros, F.A.R.; Perrone, Í.T.; Viana, K.W.C.; Tavares, G.M.; Stephani, R.; Stringheta, P.C. Microencapsulation by atomization of the mixture of phenolic extracts. Powder Technol. 2019, 343, 317–325. [Google Scholar] [CrossRef]
- Huang, K.; Yuan, Y.; Baojun, X. A critical review on the microencapsulation of bioactive compounds and their application. Food Rev. Int. 2023, 39, 2594–2634. [Google Scholar] [CrossRef]
- Ye, Q.; Georges, N.; Selomulya, C. Microencapsulation of active ingredients in functional foods: From research stage to commercial food products. Trends Food Sci. Technol. 2018, 78, 167–179. [Google Scholar] [CrossRef]
- Sessa, M.; Balestrieri, M.L.; Ferrari, G.; Servillo, L.; Castaldo, D.; D’Onofrio, N.; Donsì, F.; Tsao, R. Bioavailability of encapsulated resveratrol into nanoemulsion-based delivery systems. Food Chem. 2014, 147, 42–50. [Google Scholar] [CrossRef]
- Altunbas, A.; Lee, S.J.; Rajasekaran, S.A.; Schneider, J.P.; Pochan, D.J. Encapsulation of curcumin in self-assembling peptide hydrogels as injectable drug delivery vehicles. Biomaterials 2011, 32, 5906–5914. [Google Scholar] [CrossRef]
- Gharsallaoui, A.; Roudaut, G.; Chambin, O.; Voilley, A.; Saurel, R. Applications of spray-drying in microencapsulation of food ingredients: An overview. Food Res. Int. 2007, 40, 1107–1121. [Google Scholar] [CrossRef]
- Zheng, L.; Xu, H.; Hu, H.; Ruan, J.; Shi, C.; Cao, J.; Zhang, X. Preparation, characterization and antioxidant activity of inclusion complex loaded with puerarin and corn peptide. Food Biosci. 2022, 49, 101886. [Google Scholar] [CrossRef]
- Galaz, P.; Valdenegro, M.; Ramirez, C.; Nunez, H.; Almonacid, S.; Simpson, R. Effect of drum drying temperature on drying kinetic and polyphenol contents in pomegranate peel. J. Food Eng. 2017, 208, 19–27. [Google Scholar] [CrossRef]
- Wu, J.; Wang, X.; Jiang, R.; Zhang, G.; Dang, Y. Effects of drying methods on the active ingredient content and biological activities of pomegranate peels: An investigation of the potential mechanism of polyphenols as antifungal agents. Food Biosci. 2025, 64, 105947. [Google Scholar] [CrossRef]
- Wang, M.; Mu, H.; Peng, L.; Tan, C.; Chen, Y.; Sheng, J.; Tian, Y.; Zhao, C. Effect and application of spray drying and freeze drying on characterization of walnut oil microcapsules. J. Food Eng. 2024, 376, 112083. [Google Scholar] [CrossRef]
- Yan, C.; Kim, S.R.; Ruiz, D.R.; Farmer, J.R. Microencapsulation for Food Applications: A Review. ACS Appl. Bio Mater. 2022, 5, 5497–5512. [Google Scholar] [CrossRef] [PubMed]
- Charles, A.L.; Abdillah, A.A.; Saraswati, Y.R.; Sridhar, K.; Balderamos, C.; Masithah, E.D.; Alamsjah, M.A. Characterization of freeze-dried microencapsulation tuna fish oil with arrowroot starch and maltodextrin. Food Hydrocoll. 2021, 112, 106281. [Google Scholar] [CrossRef]
- Baldelli, A.; Wells, S.; Pratap-Singh, A. Impact of Product Formulation on Spray-Dried Microencapsulated Zinc for Food Fortification. Food Bioprocess Technol. 2021, 14, 2286–2301. [Google Scholar] [CrossRef]
- Shen, F.; Wang, T.; Zhang, R.; Zhong, B.; Wu, Z. Metabolism and release of characteristic components and their enzymatic mechanisms in Pericarpium Citri Reticulatae co-fermentation. Food Chem. 2024, 432, 137227. [Google Scholar] [CrossRef]
- Hay, T.O.; Nastasi, J.R.; Prakash, S.; Fitzgerald, M.A. Comparison of Gidyea gum, gum Arabic, and maltodextrin in the microencapsulation and colour stabilisation of anthocyanin-rich powders using freeze-drying and spray-drying techniques. Food Hydrocoll. 2025, 163, 111023. [Google Scholar] [CrossRef]
- Do Dat, T.; Hai, N.D.; Nam, N.T.H.; Thanh, N.M.; Huyen, N.T.T.; Duong, L.T.T.; Nam, H.M.; Hieu, N.H. Flavonoid content and antifungal activity of Celastrus hindsii leaf extract obtained by supercritical carbon dioxide using ethanol as co-solvent. Biocatal. Agric. Biotechnol. 2023, 52, 102824. [Google Scholar] [CrossRef]
- Cai, Y.Z.; Corke, H. Production and properties of spray-dried Amaranthus betacyanin pigments. J. Food Sci. 2000, 65, 1248–1252. [Google Scholar] [CrossRef]
- Paini, M.; Aliakbarian, B.; Casazza, A.A.; Lagazzo, A.; Botter, R.; Perego, P. Microencapsulation of phenolic compounds from olive pomace using spray drying: A study of operative parameters. LWT 2015, 62, 177–186. [Google Scholar] [CrossRef]
- da Silva, E.S.; Xiong, J.; de Medeiros, F.G.M.; Grace, M.; Moncada, M.; Lila, M.A.; Hoskin, R.T. Spray dried insect protein-polyphenol particles deliver health-relevant value-added food ingredients. Future Foods 2024, 9, 100315. [Google Scholar] [CrossRef]
- Fu, M.; Wang, Y.; Zhu, X.; Li, M.; Yu, Y.; Wu, J.; Wen, J.; San Cheang, W.; Xu, Y. Metabolomics reveal changes of flavonoids during processing of “nine-processed” tangerine peel (Jiuzhi Chenpi). LWT 2024, 214, 117132. [Google Scholar] [CrossRef]
- Ruiz Canizales, J.; Basilio Heredia, J.; Dominguez Avila, J.A.; Madera Santana, T.J.; Villegas Ochoa, M.A.; Robles Sanchez, R.M.; Gonzalez Aguilar, G.A. Microencapsulation of blue maize (Zea mays L.) polyphenols in two matrices: Their stability during storage and in vitro digestion release. J. Food Meas. Charact. 2019, 13, 892–900. [Google Scholar] [CrossRef]
- Mondal, P.; Ramasamy, S.; Amalraj, R.; Anthoniraj, C.J.; Gokila, S.; Meeran, S.M. Physicochemical characteristics of dietary fiber polysaccharides extracted from Murraya koenigii leaves and their functional role on gut homeostasis. Int. J. Biol. Macromol. 2025, 293, 139198. [Google Scholar] [CrossRef] [PubMed]
- Jo, Y.J.; Cho, H.S.; Chun, J.Y. Antioxidant activity of β-cyclodextrin inclusion complexes containing trans-cinnamaldehyde by DPPH, ABTS and FRAP. Food Sci. Biotechnol. 2021, 30, 807–814. [Google Scholar] [CrossRef]
- Han, Z.; Pan, Z.; Liu, X.; Lin, N.; Qu, J.; Duan, X.; Liu, B. Structural changes of wheat starch and activity inhibition of α-glucosidase by persimmon (Diospyros kaki Thunb.) leaves extract retarding starch digestibility. Int. J. Biol. Macromol. 2024, 279, 135248. [Google Scholar] [CrossRef]
- Raju, L.; Saju, S.M.; Jenny, J.C.; Kumar, M.; Rajkumar, E. α-Amylase inhibition and antioxidative activities of Marasmius tax sp extract: A combined in vitro and in silico exploration. Pharmacol. Res.-Nat. Prod. 2024, 4, 100079. [Google Scholar] [CrossRef]
- Brodkorb, A.; Egger, L.; Alminger, M.; Alvito, P.; Assunção, R.; Ballance, S.; Bohn, T.; Bourlieu-Lacanal, C.; Boutrou, R.; Carrière, F. INFOGEST static in vitro simulation of gastrointestinal food digestion. Nat. Protoc. 2019, 14, 991–1014. [Google Scholar] [CrossRef]
- Tolun, A.; Altintas, Z.; Artik, N. Microencapsulation of grape polyphenols using maltodextrin and gum arabic as two alternative coating materials: Development and characterization. J. Biotechnol. 2016, 239, 23–33. [Google Scholar] [CrossRef]
- Ameri, M.; Maa, Y.F. Spray drying of biopharmaceuticals: Stability and process considerations. Dry. Technol. 2006, 24, 763–768. [Google Scholar] [CrossRef]
- Saifullah, M.; Yusof, Y.; Chin, N.; Aziz, M. Physicochemical and flow properties of fruit powder and their effect on the dissolution of fast dissolving fruit powder tablets. Powder Technol. 2016, 301, 396–404. [Google Scholar] [CrossRef]
- Sarabandi, K.; Gharehbeglou, P.; Jafari, S.M. Spray-drying encapsulation of protein hydrolysates and bioactive peptides: Opportunities and challenges. Dry. Technol. 2020, 38, 577–595. [Google Scholar] [CrossRef]
- Mousazadeh, M.; Ilia, E.B.; Hassanzadeh, H.; Mousavi, M.; Askari, G.; Kiani, H.; Gharsallaoui, A. Evaluation of the effect of spray and freeze drying techniques and different pH on the functional properties of protein isolate from chickpea (Cicer arietinum, var. Azad). J. Agric. Food Res. 2025, 19, 101710. [Google Scholar] [CrossRef]
- Mendes-Oliveira, G.; Gu, G.; Luo, Y.; Zografos, A.; Minas, I.; Nou, X. Edible and water-soluble corn zein coating impregnated with nisin for Listeria monocytogenes reduction on nectarines and apples. Postharvest Biol. Technol. 2022, 185, 111811. [Google Scholar] [CrossRef]
- Tagrida, M.; Nilsuwan, K.; Gulzar, S.; Prodpran, T.; Benjakul, S. Fish gelatin/chitosan blend films incorporated with betel (Piper betle L.) leaf ethanolic extracts: Characteristics, antioxidant and antimicrobial properties. Food Hydrocoll. 2023, 137, 108316. [Google Scholar] [CrossRef]
- Huang, Z.; Xie, H.; Hu, T.; Zeng, J.; Tian, X.; Wu, Z. Preparing bright Monascus yellow pigments by loading quercetin-Sn (II)-albumin–chitosan: Enhanced stability and bioactivity. Food Hydrocoll. 2023, 142, 108776. [Google Scholar] [CrossRef]
- de Barros Fernandes, R.V.; Borges, S.V.; Botrel, D.A. Gum arabic/starch/maltodextrin/inulin as wall materials on the microencapsulation of rosemary essential oil. Carbohydr. Polym. 2014, 101, 524–532. [Google Scholar] [CrossRef]
- Zhou, M.; Khen, K.; Wang, T.; Hu, Q.; Xue, J.; Luo, Y. Chemical crosslinking improves the gastrointestinal stability and enhances nutrient delivery potentials of egg yolk LDL/polysaccharide nanogels. Food Chem. 2018, 239, 840–847. [Google Scholar] [CrossRef]
- He, J.; Rodriguez-Saona, L.E.; Giusti, M.M. Midinfrared spectroscopy for juice authentication rapid differentiation of commercial juices. J. Agric. Food Chem. 2007, 55, 4443–4452. [Google Scholar] [CrossRef]
- Younesi, M.; Peighambardoust, S.H.; Sarabandi, K.; Akbarmehr, A.; Ahaninjan, M.; Soltanzadeh, M. Application of structurally modified WPC in combination with maltodextrin for microencapsulation of Roselle (Hibiscus sabdariffa) extract as a natural colorant source for gummy candy. Int. J. Biol. Macromol. 2023, 242, 124903. [Google Scholar] [CrossRef] [PubMed]
- Shi, J.; Cui, Y.-f.; Zhou, G.; Li, N.; Sun, X.; Wang, X.; Xu, N. Covalent interaction of soy protein isolate and chlorogenic acid: Effect on protein structure and functional properties. LWT 2022, 170, 114081. [Google Scholar] [CrossRef]
- Kanha, N.; Surawang, S.; Pitchakarn, P.; Laokuldilok, T. Microencapsulation of copigmented anthocyanins using double emulsion followed by complex coacervation: Preparation, characterization and stability. LWT 2020, 133, 110154. [Google Scholar] [CrossRef]
- Laureanti, E.J.G.; Paiva, T.S.; de Matos Jorge, L.M.; Jorge, R.M.M. Microencapsulation of bioactive compound extracts using maltodextrin and gum arabic by spray and freeze-drying techniques. Int. J. Biol. Macromol. 2023, 253, 126969. [Google Scholar] [CrossRef] [PubMed]
- Gandia-Herrero, F.; Jimenez-Atienzar, M.; Cabanes, J.; Garcia-Carmona, F.; Escribano, J. Stabilization of the bioactive pigment of Opuntia fruits through maltodextrin encapsulation. J. Agric. Food Chem. 2010, 58, 10646–10652. [Google Scholar] [CrossRef]
- Sarabandi, K.; Jafari, S.M.; Mahoonak, A.S.; Mohammadi, A. Application of gum Arabic and maltodextrin for encapsulation of eggplant peel extract as a natural antioxidant and color source. Int. J. Biol. Macromol. 2019, 140, 59–68. [Google Scholar] [CrossRef]
- Mishra, P.; Mishra, S.; Mahanta, C.L. Effect of maltodextrin concentration and inlet temperature during spray drying on physicochemical and antioxidant properties of amla (Emblica officinalis) juice powder. Food Bioprod. Process. 2014, 92, 252–258. [Google Scholar] [CrossRef]
- Schmidt, M.M.; Fontoura, A.M.D.; Vidal, A.R.; Dornelles, R.C.P.; Kubota, E.H.; Mello, R.D.O.; Cansian, R.L.; Demiate, I.M.; Oliveira, C.S.D. Characterization of hydrolysates of collagen from mechanically separated chicken meat residue. Food Sci. Technol. 2020, 40, 355–362. [Google Scholar] [CrossRef]
- Hu, Y.; Kou, G.; Chen, Q.; Li, Y.; Zhou, Z. Protection and delivery of mandarin (Citrus reticulata Blanco) peel extracts by encapsulation of whey protein concentrate nanoparticles. LWT 2019, 99, 24–33. [Google Scholar] [CrossRef]
- Zhang, C.H.; Huang, L.X.; Wang, C.P.; Mujumdar, A.S. Experimental and numerical investigation of spray-drying parameters on the dried powder properties of Ginkgo biloba seeds. Dry. Technol. 2010, 28, 380–388. [Google Scholar] [CrossRef]
- Bleiel, S.B.; Kent, R.M.; Brodkorb, A. Encapsulation efficiency and capacity of bioactive delivery systems. In Engineering Foods for Bioactives Stability and Delivery; Springer: Berlin/Heidelberg, Germany, 2016; pp. 171–197. [Google Scholar]
- Luo, F.; Nurguli, A.; Liu, Y.; Kan, H.; Zhao, P.; Li, Y.; Luo, X. Physicochemical properties and volatile compounds of Rosa roxburghii fruit using different drying methods. LWT 2024, 208, 116722. [Google Scholar] [CrossRef]
- Rezende, Y.R.R.S.; Nogueira, J.P.; Narain, N. Microencapsulation of extracts of bioactive compounds obtained from acerola (Malpighia emarginata DC) pulp and residue by spray and freeze drying: Chemical, morphological and chemometric characterization. Food Chem. 2018, 254, 281–291. [Google Scholar] [CrossRef]
- Tsali, A.; Goula, A.M. Valorization of grape pomace: Encapsulation and storage stability of its phenolic extract. Powder Technol. 2018, 340, 194–207. [Google Scholar] [CrossRef]
- Pelissari, J.R.; Souza, V.B.; Pigoso, A.A.; Tulini, F.L.; Thomazini, M.; Rodrigues, C.E.; Urbano, A.; Favaro-Trindade, C.S. Production of solid lipid microparticles loaded with lycopene by spray chilling: Structural characteristics of particles and lycopene stability. Food Bioprod. Process. 2016, 98, 86–94. [Google Scholar] [CrossRef]
- Dadi, D.W.; Emire, S.A.; Hagos, A.D.; Eun, J.B. Physical and Functional Properties, Digestibility, and Storage Stability of Spray- and Freeze-Dried Microencapsulated Bioactive Products from Moringa stenopetala Leaves Extract. Ind. Crops Prod. 2020, 156, 112891. [Google Scholar] [CrossRef]
- Martins, R.; Machado, M.; Pereira, S.; Nosari, A.; Tacon, L.; Freitas, L.A.P.D. Engineering active pharmaceutical ingredients by spray drying: Effects on physical properties and in vitro dissolution. Dry. Technol. 2012, 30, 905–913. [Google Scholar] [CrossRef]
- Lyu, Y.; Bi, J.; Chen, Q.; Wu, X.; Qiao, Y.; Hou, H.; Zhang, X. Bioaccessibility of carotenoids and antioxidant capacity of seed-used pumpkin byproducts powders as affected by particle size and corn oil during in vitro digestion process. Food Chem. 2021, 343, 128541. [Google Scholar] [CrossRef]
- Franco Ribeiro, E.; Carregari Polachini, T.; Dutra Alvim, I.; Quiles, A.; Hernando, I.; Nicoletti, V.R. Microencapsulation of roasted coffee oil Pickering emulsions using spray-and freeze-drying: Physical, structural and in vitro bioaccessibility studies. Int. J. Food Sci. Technol. 2022, 57, 145–153. [Google Scholar] [CrossRef]

| FDMCs | SDMCs | |
|---|---|---|
| Physical properties | ||
| Moisture content (%) | 3.765 ± 0.137 b | 2.742 ± 0.256 a |
| Hygroscopicity (g/100 g) | 20.107 ± 1.361 b | 15.118 ± 1.317 a |
| Bulk density (g/cm3) | 0.211 ± 0.001 b | 0.389 ± 0.002 a |
| Solubility (mg/mL) | 92.077 ± 0.460 b | 95.270 ± 0.390 a |
| Active compounds content | ||
| TFC (mg DW/g) | 2.374 ± 0.054 b | 2.632 ± 0.061 a |
| TPC (mg DW/g) | 17.469 ± 0.113 b | 19.604 ± 0.201 a |
| TSC (g DW/g) | 0.302 ± 0.009 | 0.301 ± 0.011 |
| No | Compound Name | CAS | Formula | Structural Type | Molecular Weight | Retention Time | Matching Rate (%) | Content (mg/kg) | Retention Rate (%) | |||||
|---|---|---|---|---|---|---|---|---|---|---|---|---|---|---|
| CPE | FDMCs | SDMCs | CPE | FDMCs | SDMCs | FDMCs | SDMCs | |||||||
| Terpenes | ||||||||||||||
| 1 | α-Phellandrene | 99-83-2 | C10H16 | 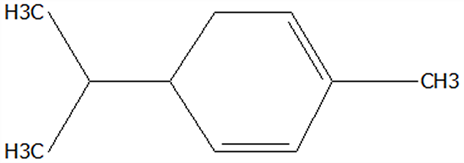 | 136.23 | 12.14 | 84.59 | 83.73 | 83.17 | 25.96 ± 0.31 | 2.99 ± 0.25 | 10.68 ± 0.84 | 11.53 ± 0.96 b | 41.13 ± 3.23 a |
| 2 | 3-Carene | 13466-78-9 | C10H16 |  | 136.23 | 12.48 | 88.7 | 89.07 | 89.09 | 114.29 ± 2.14 | 8.60 ± 0.28 | 31.41 ± 1.25 | 7.52 ± 0.24 b | 27.48 ± 1.09 a |
| 3 | β-Pinene | 18172-67-3 | C10H16 | 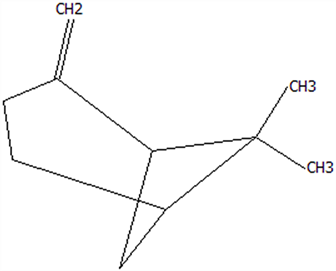 | 136.23 | 14.35 | 83.22 | 85.05 | 85.52 | 97.72 ± 0.94 | 7.07 ± 0.18 | 28.23 ± 1.40 | 7.23 ± 0.18 b | 28.89 ± 1.42 a |
| 4 | β-Myrcene | 123-35-3 | C10H16 | 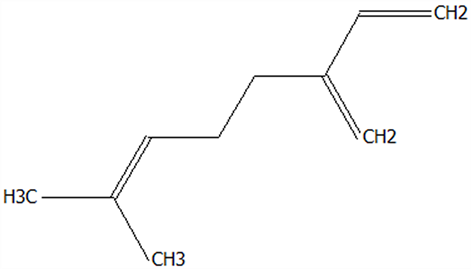 | 136.23 | 14.79 | 82.09 | 82.1 | 82.1 | 198.86 ± 3.08 | 14.29 ± 0.30 | 79.88 ± 1.16 | 7.19 ± 0.15 b | 40.17 ± 0.59 a |
| 5 | D-Limonene | 5989-27-5 | C10H16 |  | 136.23 | 17.00 | 81.05 | 82.32 | 82.3 | 4439.36 ± 26.36 | 533.10 ± 9.16 | 1981.14 ± 24.47 | 12.01 ± 0.21 b | 44.63 ± 0.55 a |
| 6 | γ-Terpinene | 99-85-4 | C10H16 | 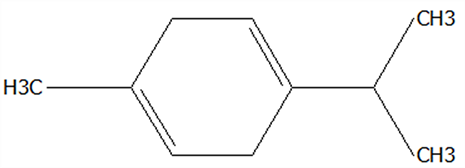 | 136.23 | 18.19 | 75.17 | 77.43 | 77.44 | 1446.37 ± 24.64 | 132.88 ± 4.06 | 653.52 ± 13.89 | 9.19 ± 0.28 b | 45.18 ± 0.96 a |
| 7 | Terpinolene | 586-62-9 | C10H16 | 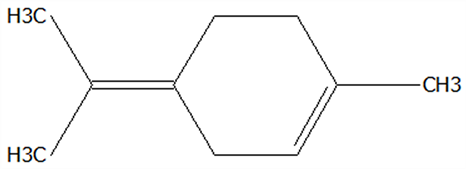 | 136.23 | 19.40 | 81.07 | 82.96 | 82.16 | 69.14 ± 2.13 | 13.34 ± 0.22 | 49.89 ± 2.48 | 19.29 ± 0.32 b | 72.15 ± 3.59 a |
| 8 | α-Cubebene | 17699-14-8 | C15H24 | 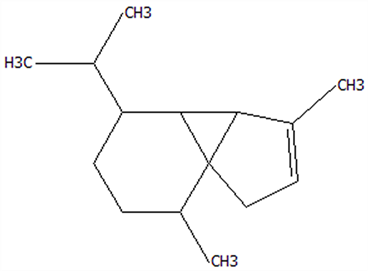 | 204.35 | 26.50 | 81.42 | 74.31 | 6.24 ± 0.28 | / | 3.81 ± 0.16 | / | 61.12 ± 2.57 | |
| 9 | Copaene | 3856-25-5 | C15H24 | 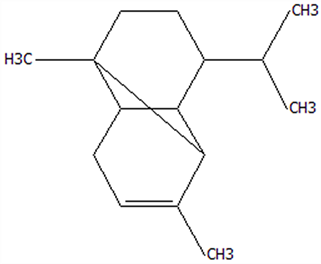 | 204.35 | 27.03 | 74.99 | 75.57 | 75.78 | 30.84 ± 1.42 | 1.71 ± 0.11 | 9.56 ± 0.62 | 5.56 ± 0.36 b | 31.00 ± 2.01 a |
| 10 | β-Gurjunene | 17334-55-3 | C15H24 |  | 204.35 | 27.25 | 82.59 | 83.03 | 83.09 | 19.94 ± 0.10 | 1.92 ± 0.04 | 6.91 ± 0.44 | 9.65 ± 0.20 b | 34.68 ± 2.19 a |
| 11 | Caryophyllene | 87-44-5 | C15H24 | 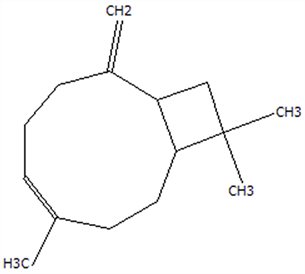 | 204.35 | 27.84 | 85.77 | 85.95 | 86 | 101.65 ± 1.62 | 3.54 ± 0.17 | 24.10 ± 1.71 | 3.48 ± 0.17 b | 24.59 ± 1.68 a |
| 12 | Farnesene | 502-61-4 | C15H24 |  | 204.35 | 28.87 | 81.92 | 82.08 | 82.16 | 150.45 ± 1.94 | 5.49 ± 0.30 | 34.70 ± 1.88 | 3.65 ± 0.20 b | 23.07 ± 1.25 a |
| 13 | Selinene | 473-13-2 | C15H24 | 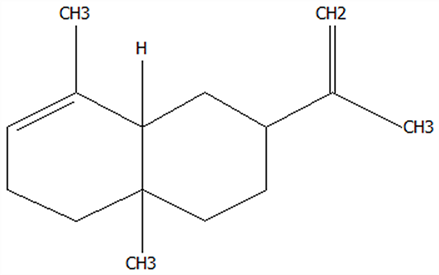 | 204.35 | 28.98 | 79.29 | 78.5 | 38.46 ± 1.61 | / | 7.89 ± 0.35 | / | 20.52 ± 0.91 | |
| 14 | δ-Cadinene | 483-76-1 | C15H24 | 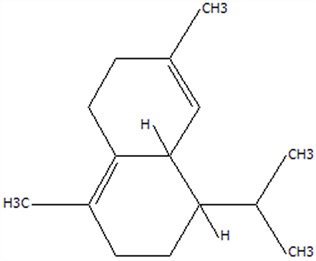 | 204.35 | 29.28 | 78.22 | 73.05 | 41.20 ± 2.23 | / | 10.30 ± 0.93 | / | 25.00 ± 2.25 | |
| Alcohols | ||||||||||||||
| 15 | Linalool | 78-70-6 | C10H18O | 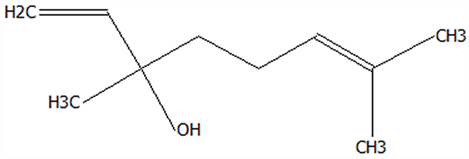 | 154.25 | 19.74 | 79.5 | 78.59 | 78.1 | 23.09 ± 1.84 | 13.56 ± 0.34 | 2.04 ± 0.15 | 58.72 ± 1.48 a | 8.84 ± 0.65 b |
| 16 | Terpinen-4-ol | 562-74-3 | C10H18O |  | 154.25 | 22.54 | 76.28 | 76.05 | 75.02 ± 2.68 | 27.65 ± 1.21 | / | 36.85 ± 1.61 | / | |
| 17 | α-Terpineol | 98-55-5 | C10H18O | 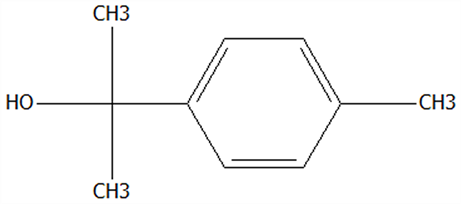 | 154.25 | 22.90 | 76.31 | 76.51 | 70.51 ± 1.71 | 52.31 ± 3.86 | / | 74.18 ± 5.48 | / | |
| Aldehydes | ||||||||||||||
| 18 | Decanal | 112-31-2 | C10H20O |  | 156.27 | 23.16 | 78.5 | 79.95 | 78.35 | 38.79 ± 2.96 | 18.16 ± 1.13 | 10.90 ± 1.07 | 46.82 ± 2.92 a | 28.11 ± 2.76 b |
| 19 | Perillal | 2111-75-3 | C10H14O |  | 150.22 | 25.00 | 83.08 | 83.49 | 9.62 ± 0.30 | 3.60 ± 0.24 | / | 37.42 ± 2.47 | / | |
| 20 | Undecanal | 112-44-7 | C11H22O |  | 170.29 | 25.50 | 75.99 | 11.30 ± 1.38 | / | / | / | / | ||
| 21 | Dodecanal | 112-54-9 | C12H24O |  | 184.32 | 27.35 | 79.12 | 79.93 | 33.60 ± 2.40 | 4.14 ± 0.22 | / | 12.30 ± 0.65 | / | |
| Phenol | ||||||||||||||
| 22 | Thymol | 89-83-8 | C10H14O |  | 150.22 | 25.05 | 71.58 | 71.82 | 19.13 ± 0.78 | 10.03 ± 0.32 | / | 52.43 ± 1.69 | / | |
| 23 | Carvacrol | 499-75-2 | C10H14O |  | 150.22 | 25.19 | 74.62 | 74.95 | 74.67 | 75.00 ± 2.74 | 42.43 ± 1.89 | 4.01 ± 0.20 | 56.58 ± 2.53 a | 5.34 ± 0.26 b |
Disclaimer/Publisher’s Note: The statements, opinions and data contained in all publications are solely those of the individual author(s) and contributor(s) and not of MDPI and/or the editor(s). MDPI and/or the editor(s) disclaim responsibility for any injury to people or property resulting from any ideas, methods, instructions or products referred to in the content. |
© 2025 by the authors. Licensee MDPI, Basel, Switzerland. This article is an open access article distributed under the terms and conditions of the Creative Commons Attribution (CC BY) license (https://creativecommons.org/licenses/by/4.0/).
Share and Cite
Zhao, J.; Qin, X.; Liu, Y.; He, Q.; Qin, J.; Shen, F.; Wu, Z. Comparative Evaluation of Spray-Drying Versus Freeze-Drying Techniques on the Encapsulation Efficiency and Biofunctional Performance of Chenpi Extract Microcapsules. Foods 2025, 14, 1825. https://doi.org/10.3390/foods14101825
Zhao J, Qin X, Liu Y, He Q, Qin J, Shen F, Wu Z. Comparative Evaluation of Spray-Drying Versus Freeze-Drying Techniques on the Encapsulation Efficiency and Biofunctional Performance of Chenpi Extract Microcapsules. Foods. 2025; 14(10):1825. https://doi.org/10.3390/foods14101825
Chicago/Turabian StyleZhao, Jiawei, Xueling Qin, Ying Liu, Qingyun He, Junwei Qin, Fei Shen, and Zhenqiang Wu. 2025. "Comparative Evaluation of Spray-Drying Versus Freeze-Drying Techniques on the Encapsulation Efficiency and Biofunctional Performance of Chenpi Extract Microcapsules" Foods 14, no. 10: 1825. https://doi.org/10.3390/foods14101825
APA StyleZhao, J., Qin, X., Liu, Y., He, Q., Qin, J., Shen, F., & Wu, Z. (2025). Comparative Evaluation of Spray-Drying Versus Freeze-Drying Techniques on the Encapsulation Efficiency and Biofunctional Performance of Chenpi Extract Microcapsules. Foods, 14(10), 1825. https://doi.org/10.3390/foods14101825