A Metabolomics Approach to Establish the Relationship between the Techno-Functional Properties and Metabolome of Indian Goat Yoghurt


Abstract
1. Introduction
2. Materials and Methods
2.1. Procurement of Goat Milk and Yoghurt Cultures
2.2. Processing and Preparation of Goat Milk Powder
2.3. Preparation of Goat Milk Yoghurt at Different Total Solids Contents Using Different Starter Culture
2.4. Analytical Methods
2.4.1. Physico-Chemical Characteristics
2.4.2. Texture Analysis
2.4.3. Dynamic Rheological Analysis
2.4.4. Fourier-Transform Infra Red Spectroscopy
2.4.5. Metabolite Profiling
2.4.6. Statistical Analysis
3. Results and Discussion
3.1. Influence of Varying Total Solids Level and Type of Culture on Techno-Functional Properties of Goat Milk
3.1.1. Influence of Varying Total Solids Level on Techno-Functional Properties of Goat Milk Inoculated with Commercial Culture
Physico-Chemical Characteristics
Textural Analysis
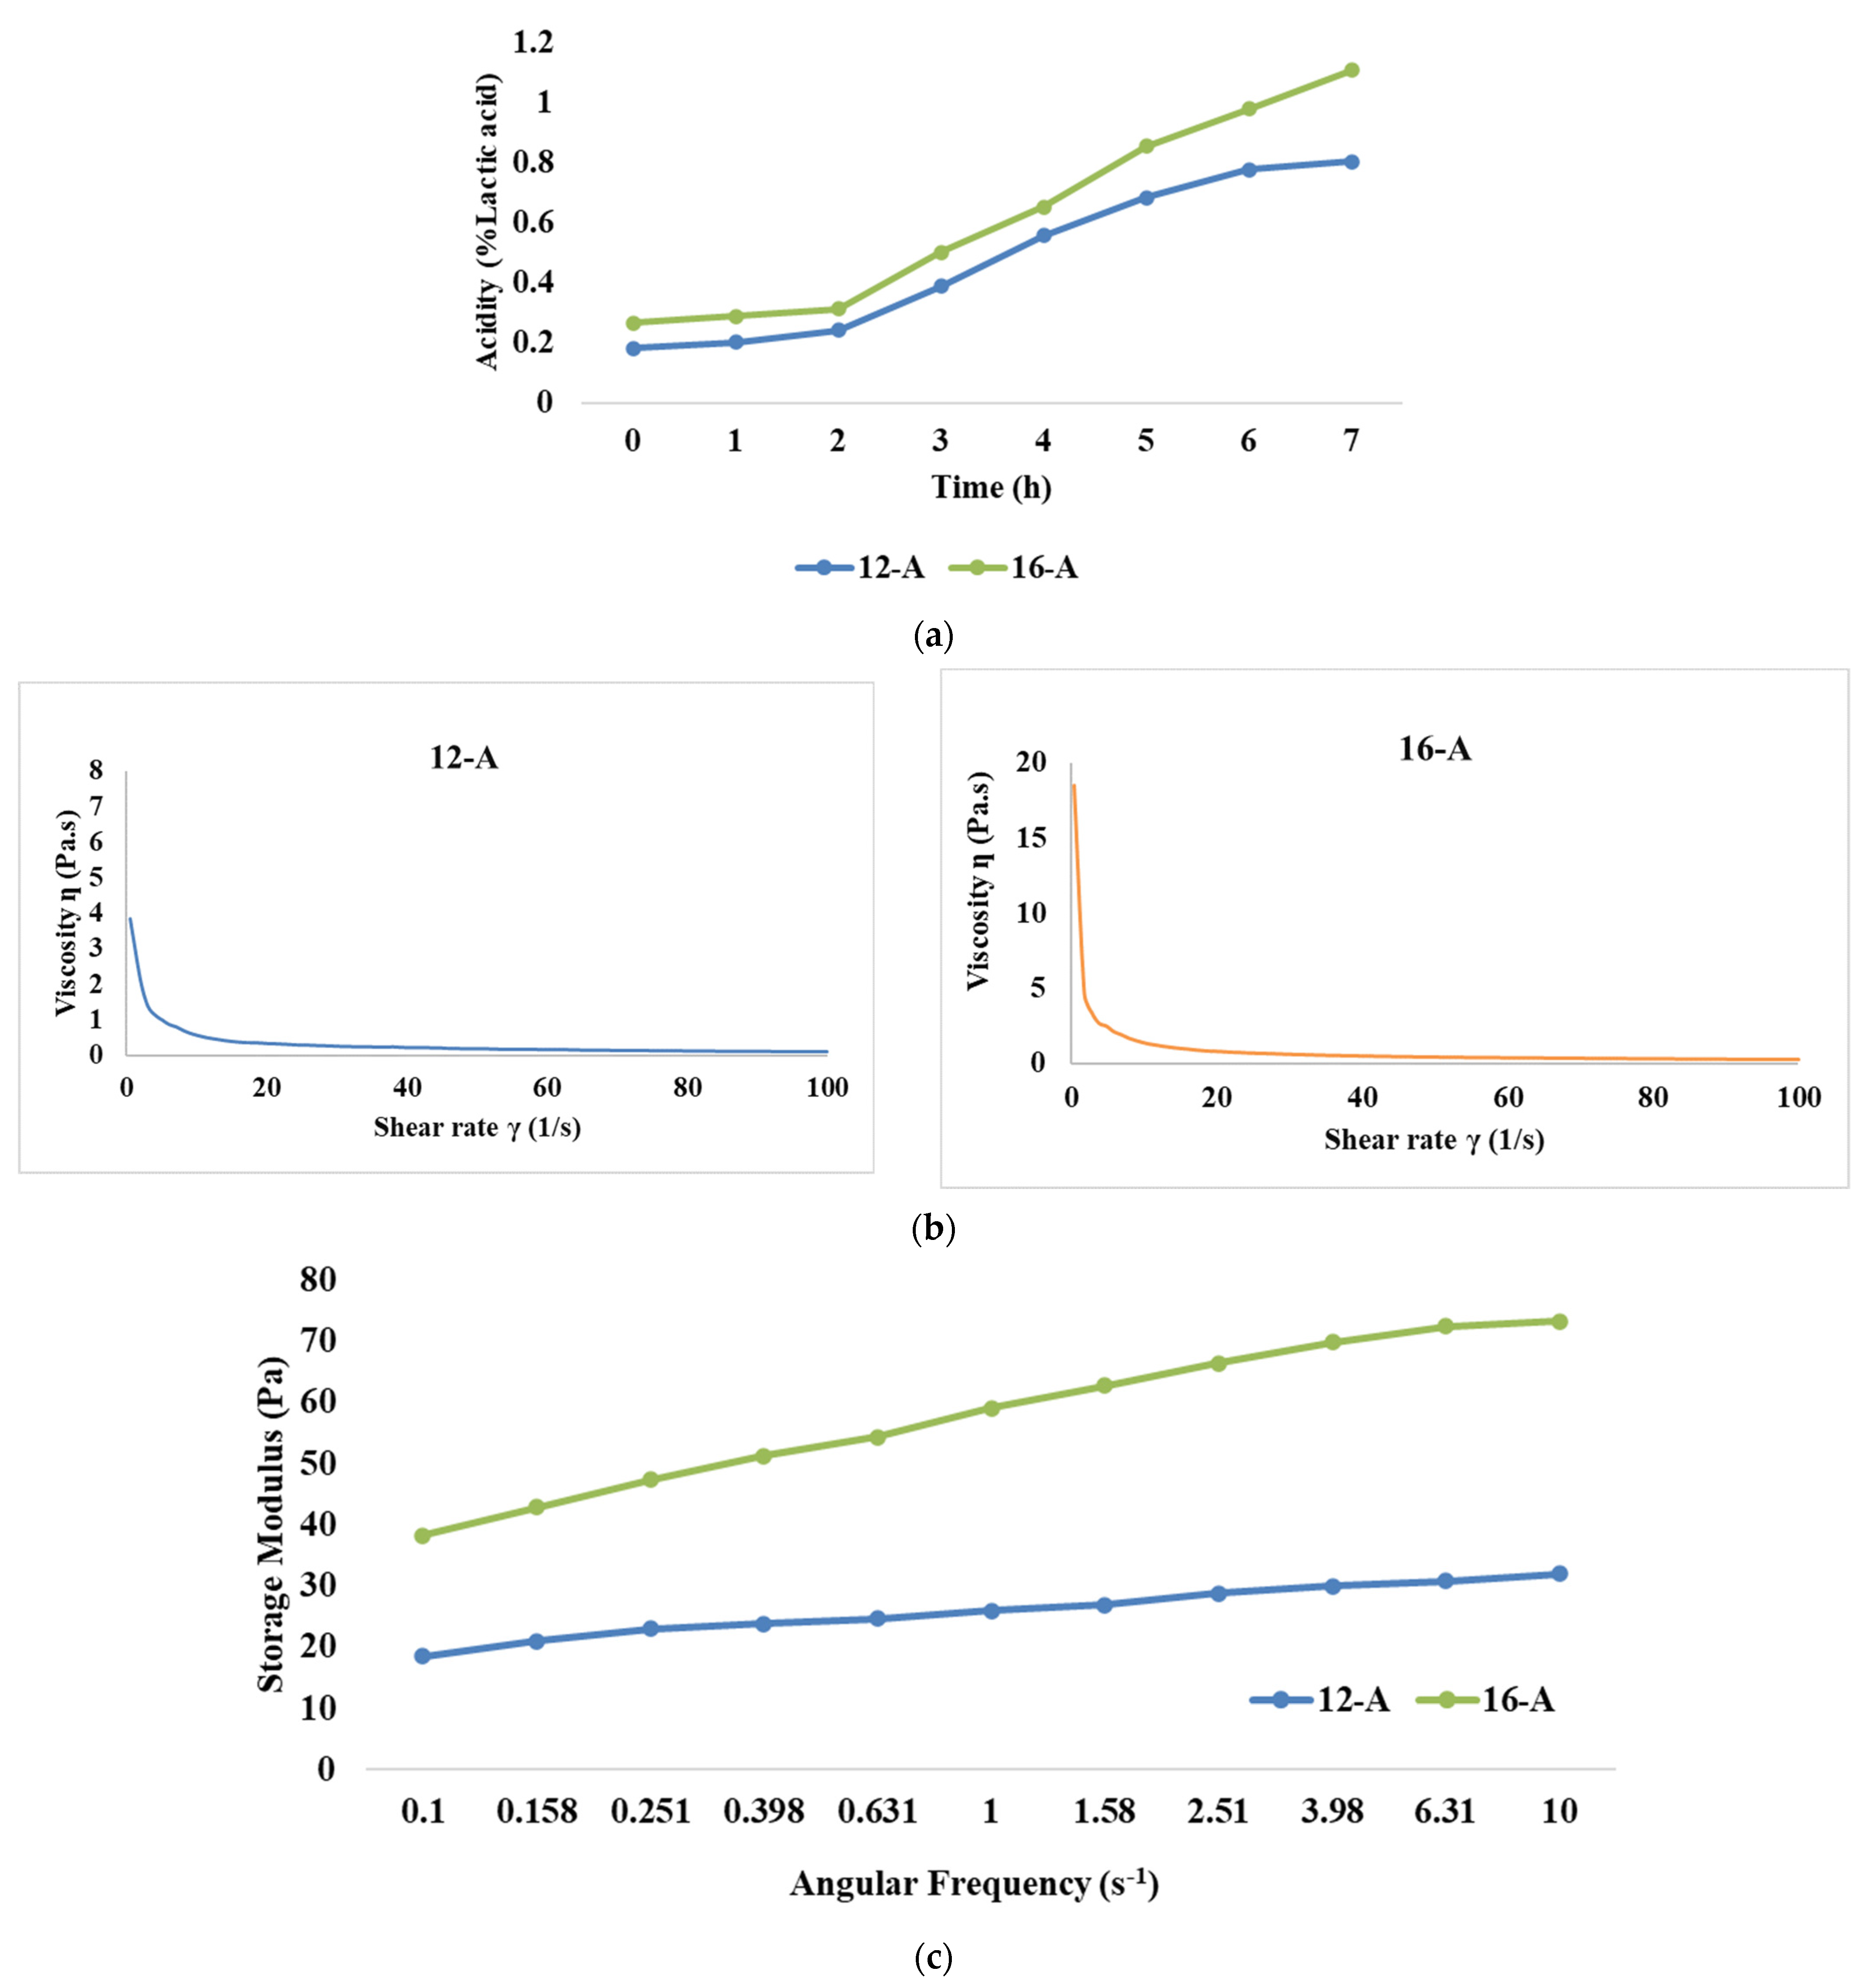
Rate of Acidity Development
Flow Behaviour
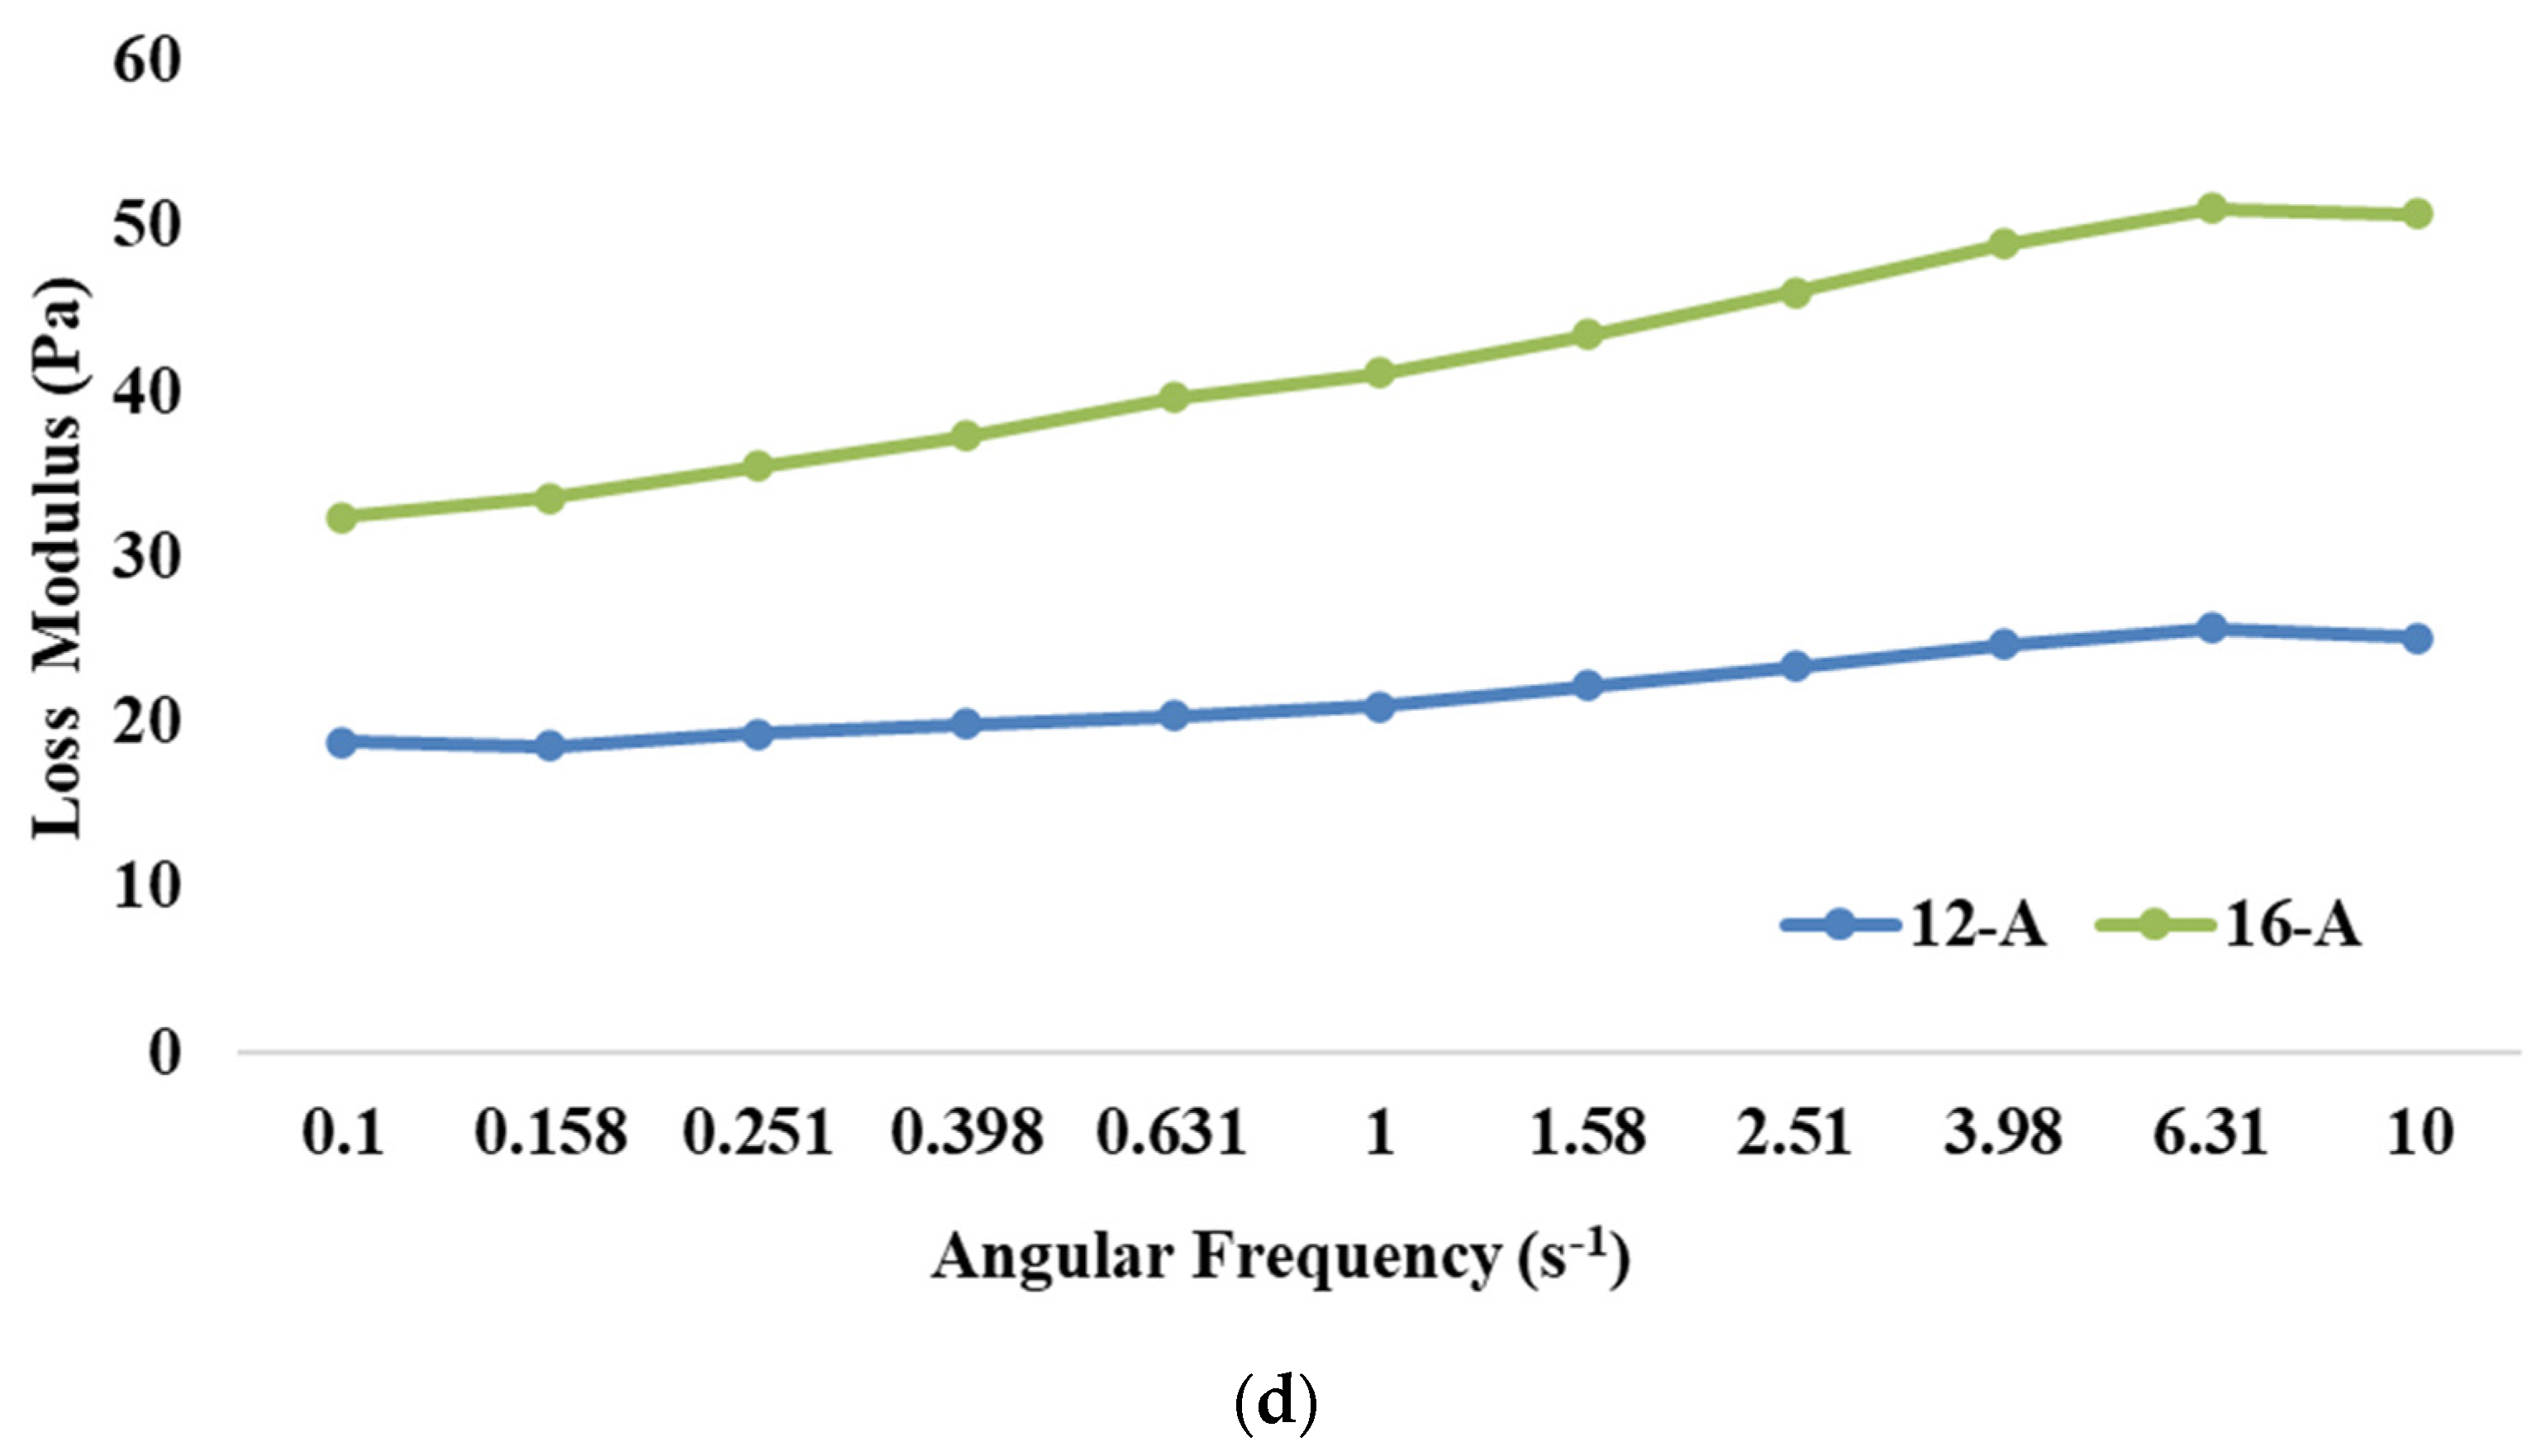
Frequency Sweep
3.1.2. Influence of Varying Levels of Total Solids and Culture on Techno-Functional Properties of Goat Milk Inoculated with NCDC 263 Culture
Physico-Chemical Characteristics
Textural Analysis
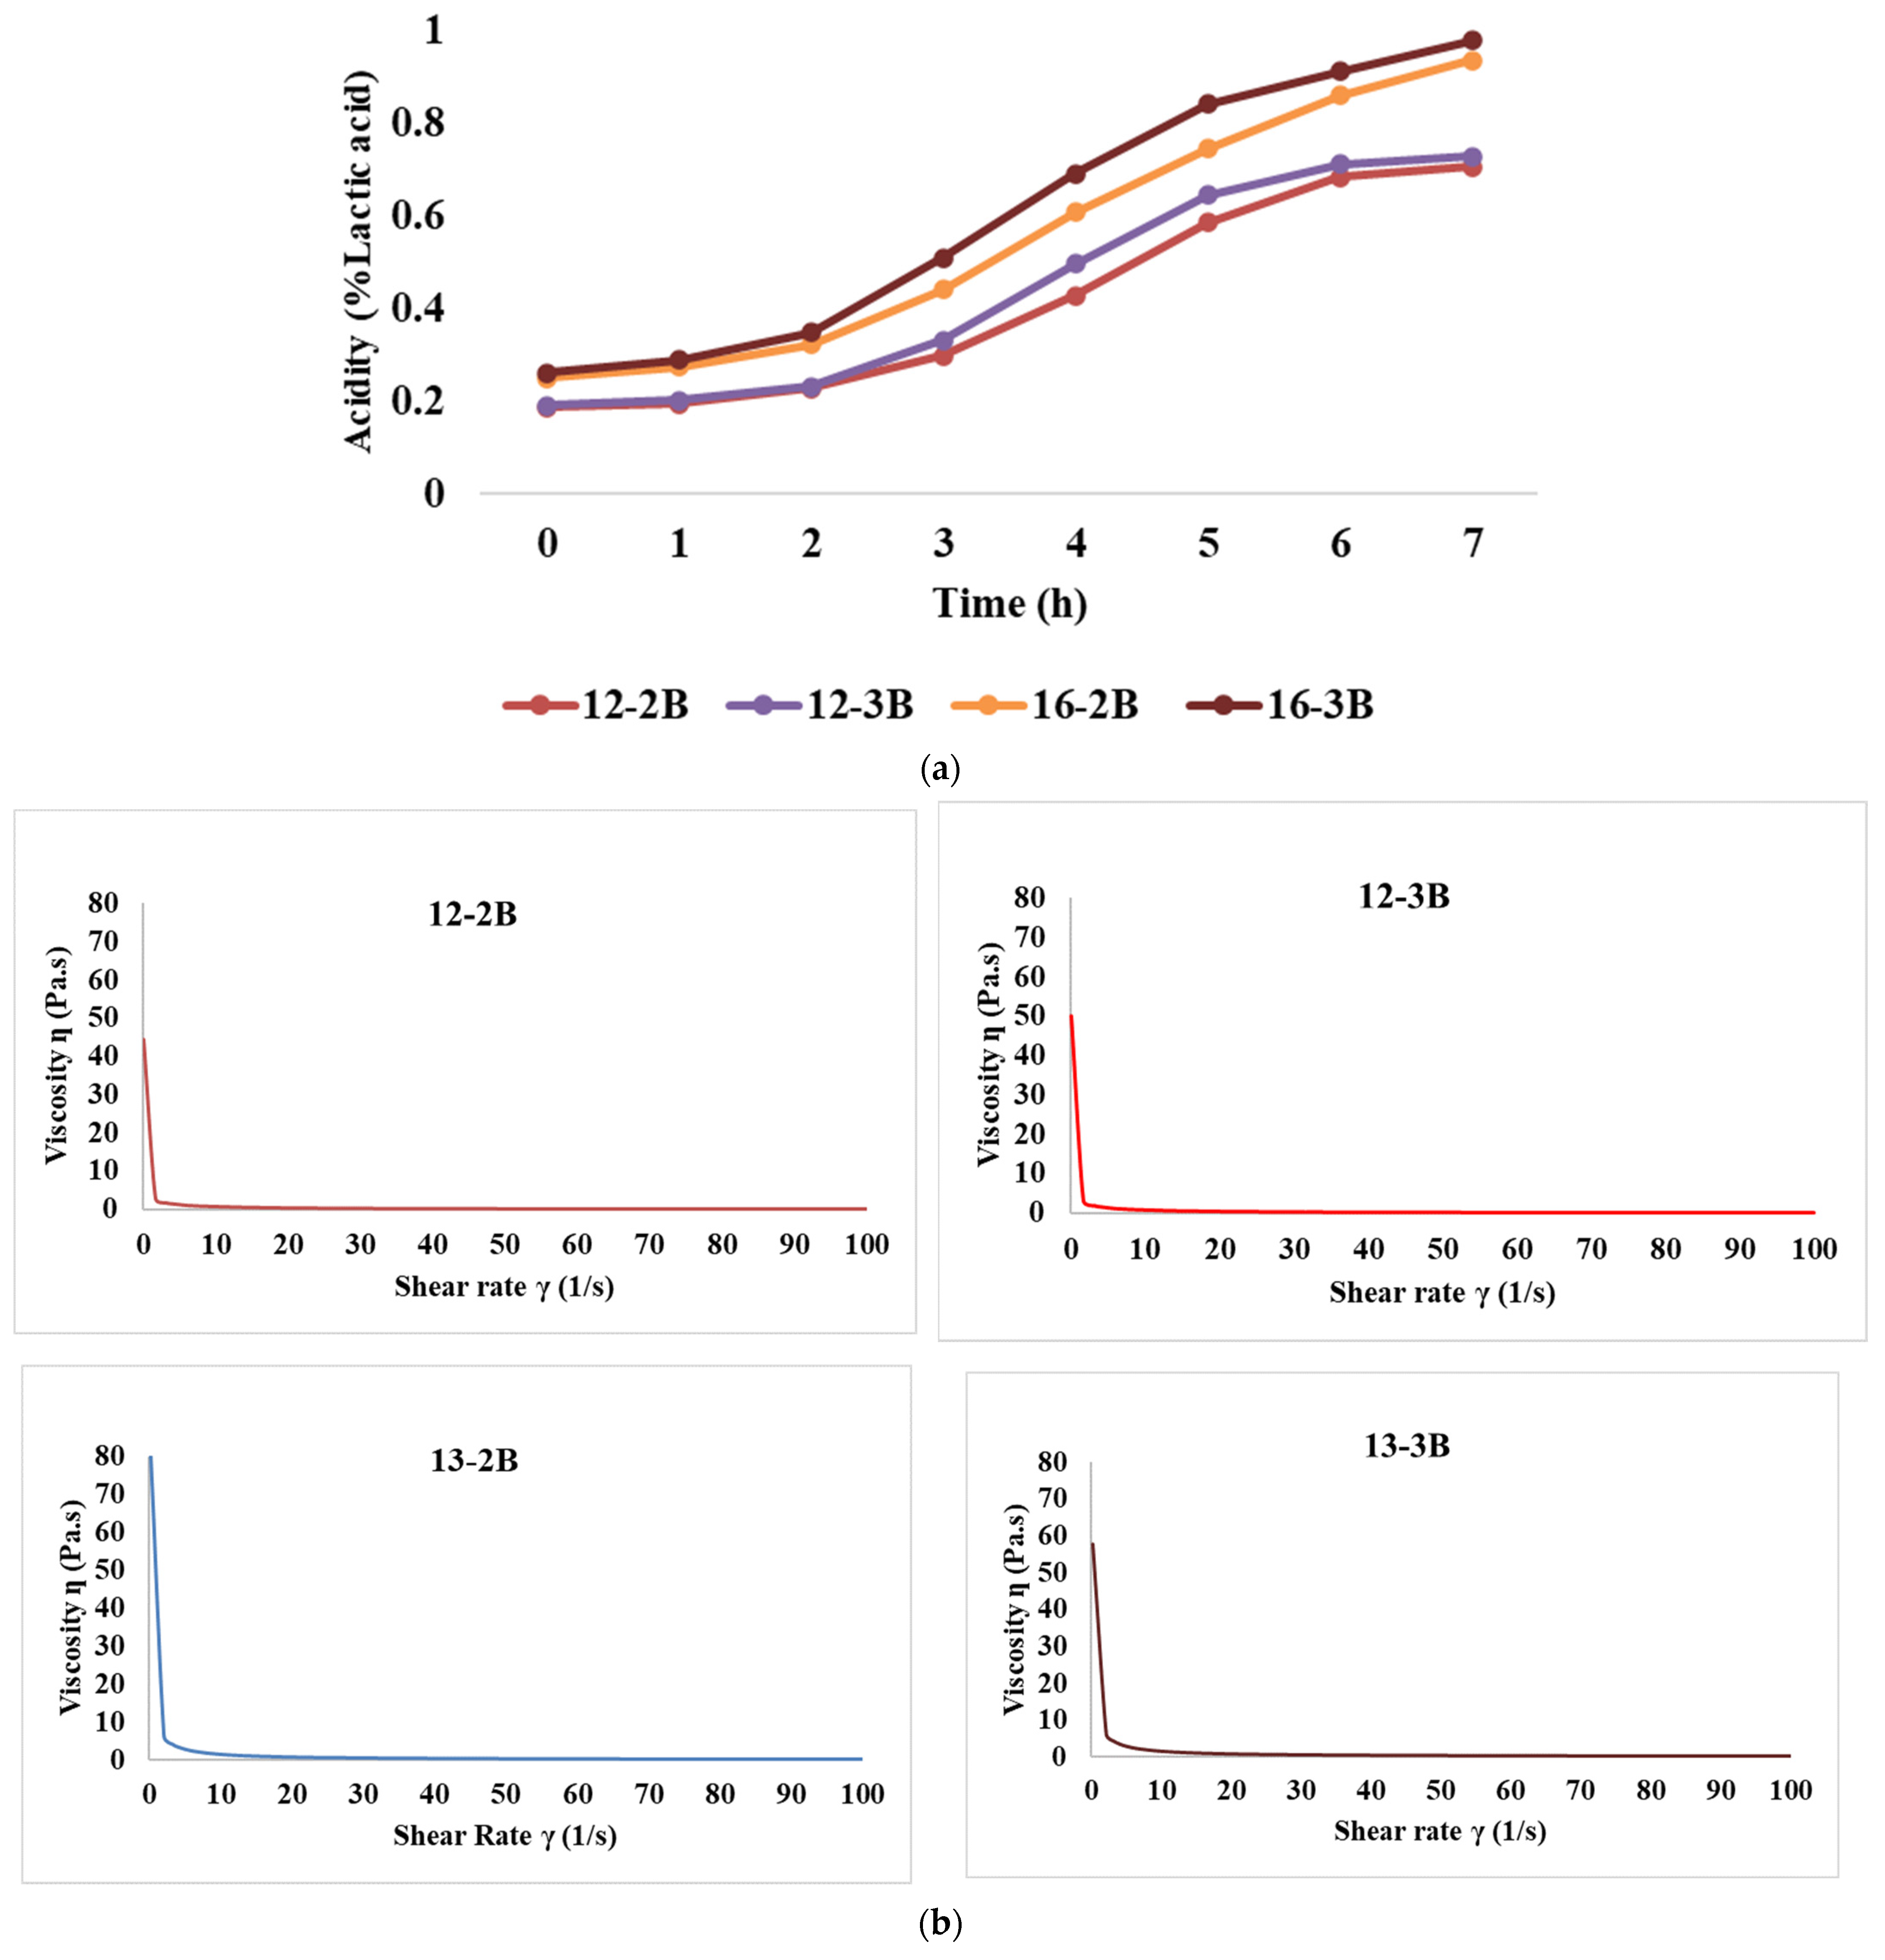
Rate of Acidity Development
Flow Curve
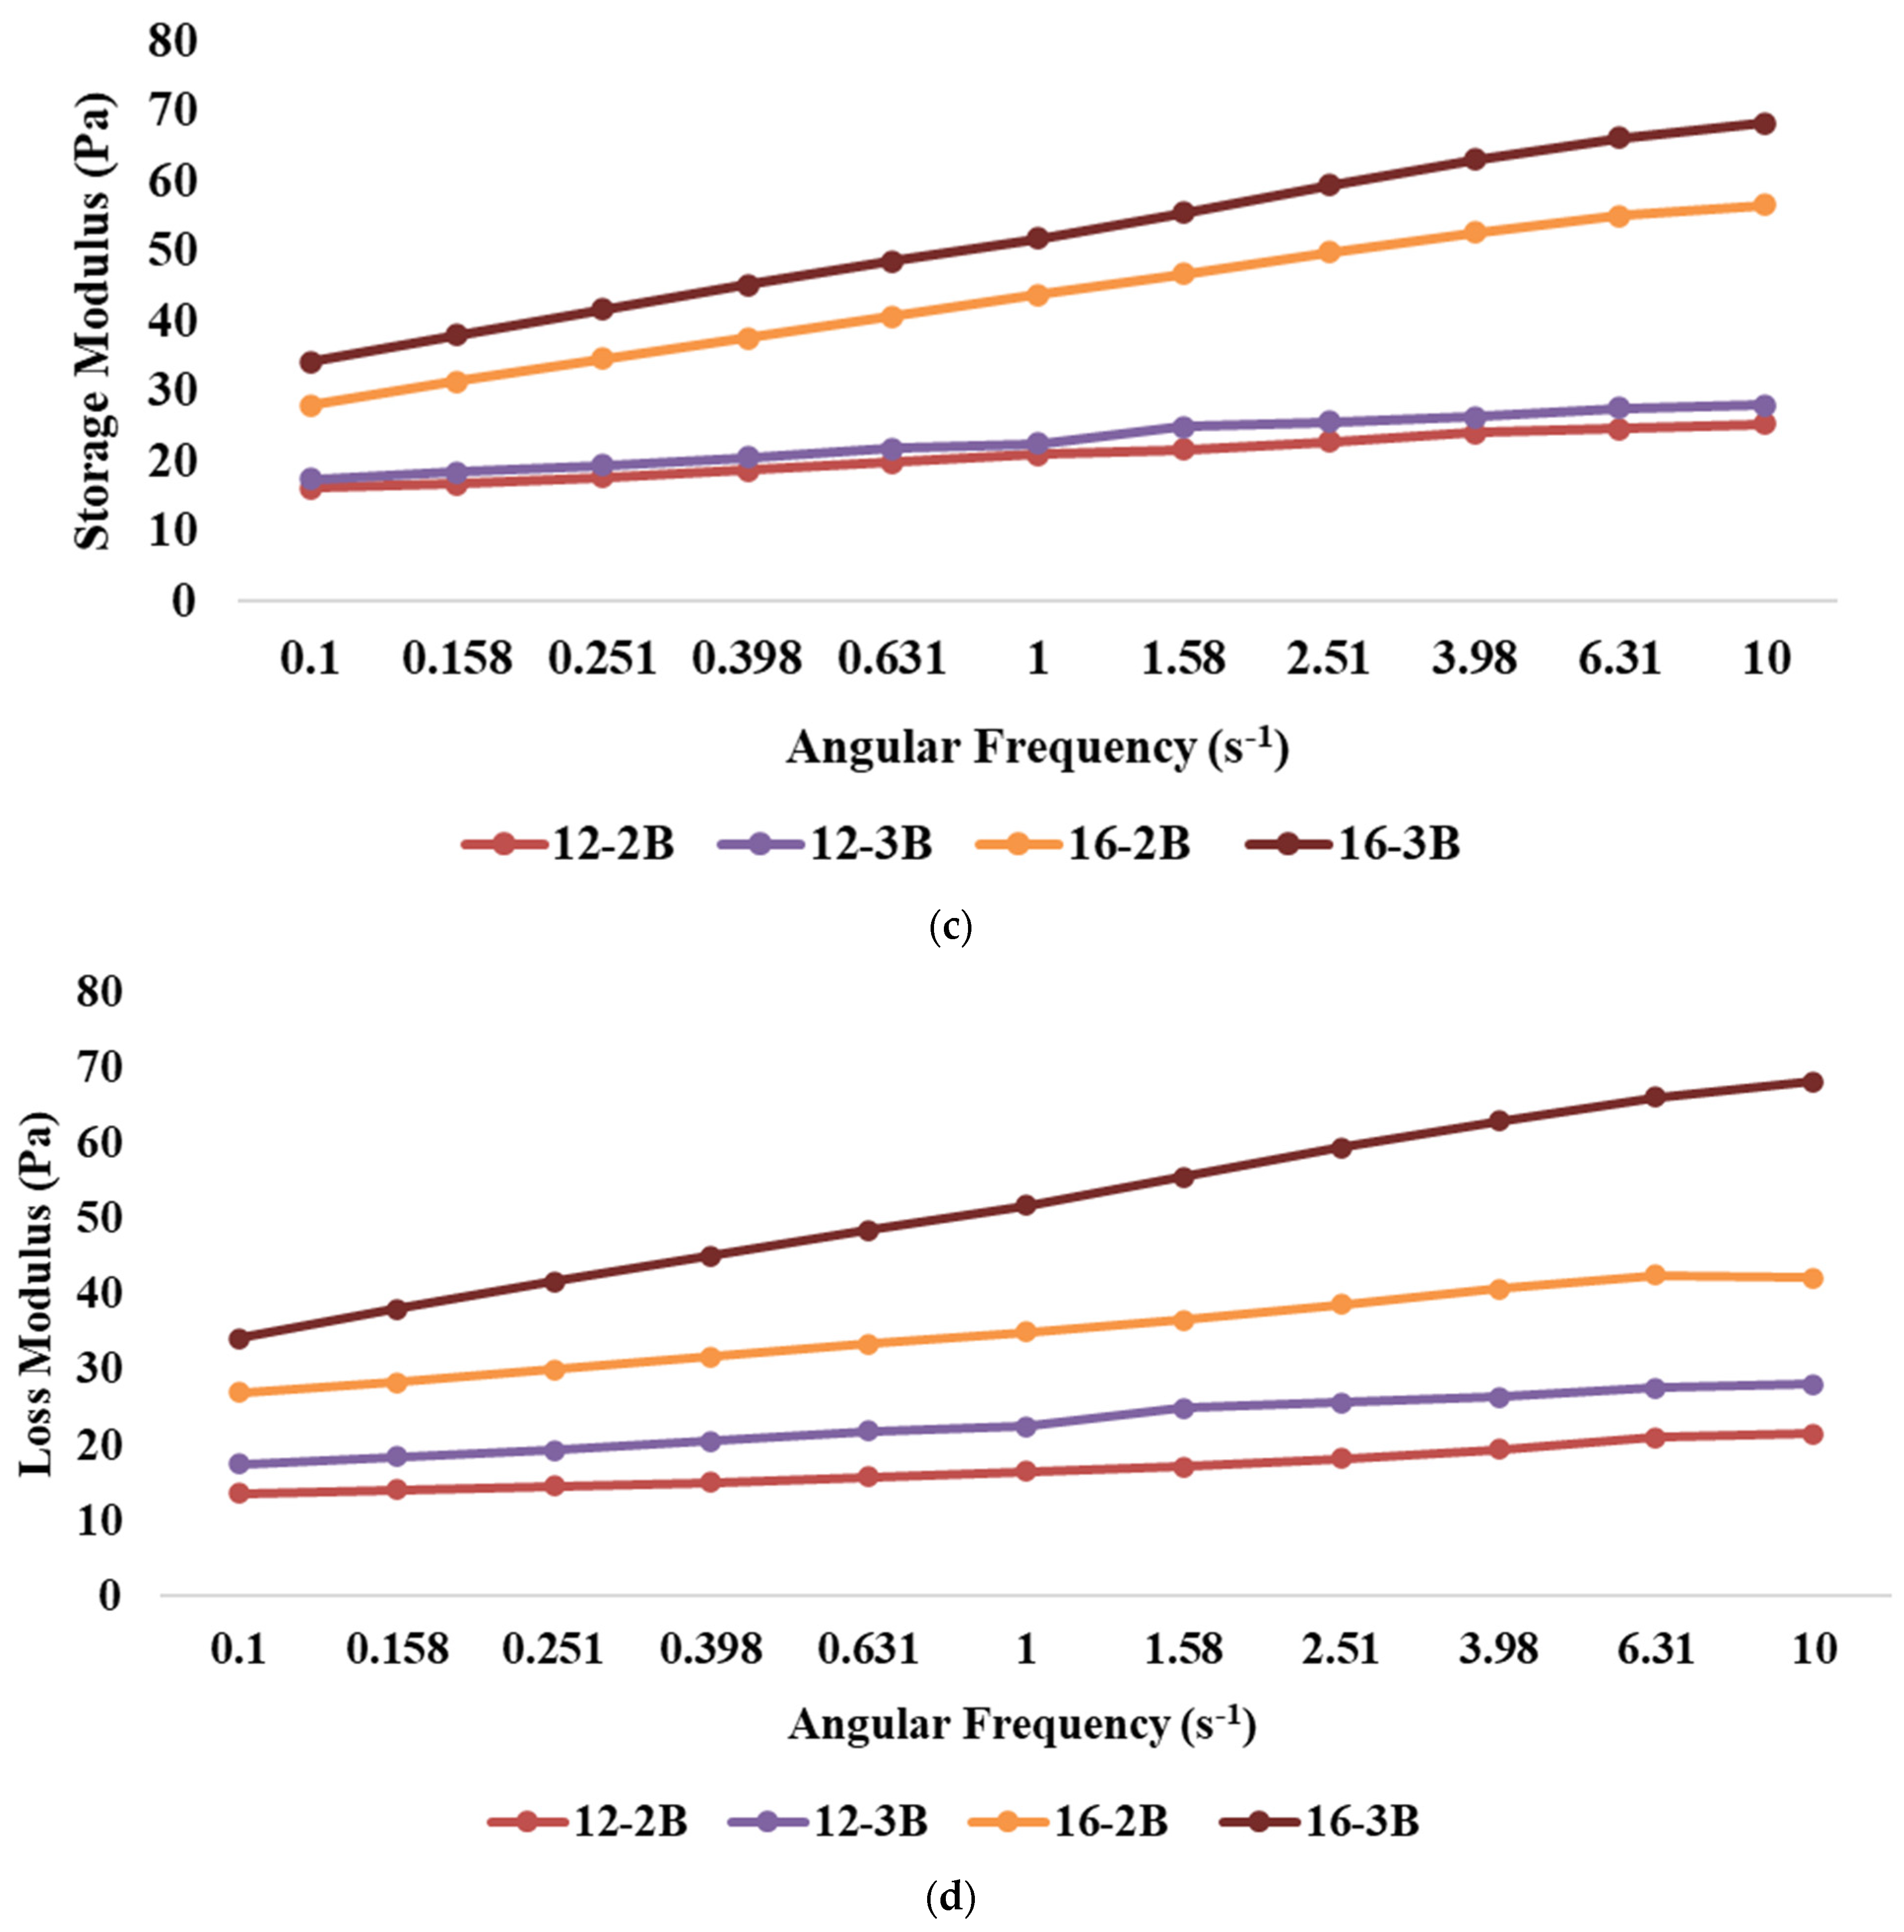
Frequency Sweep
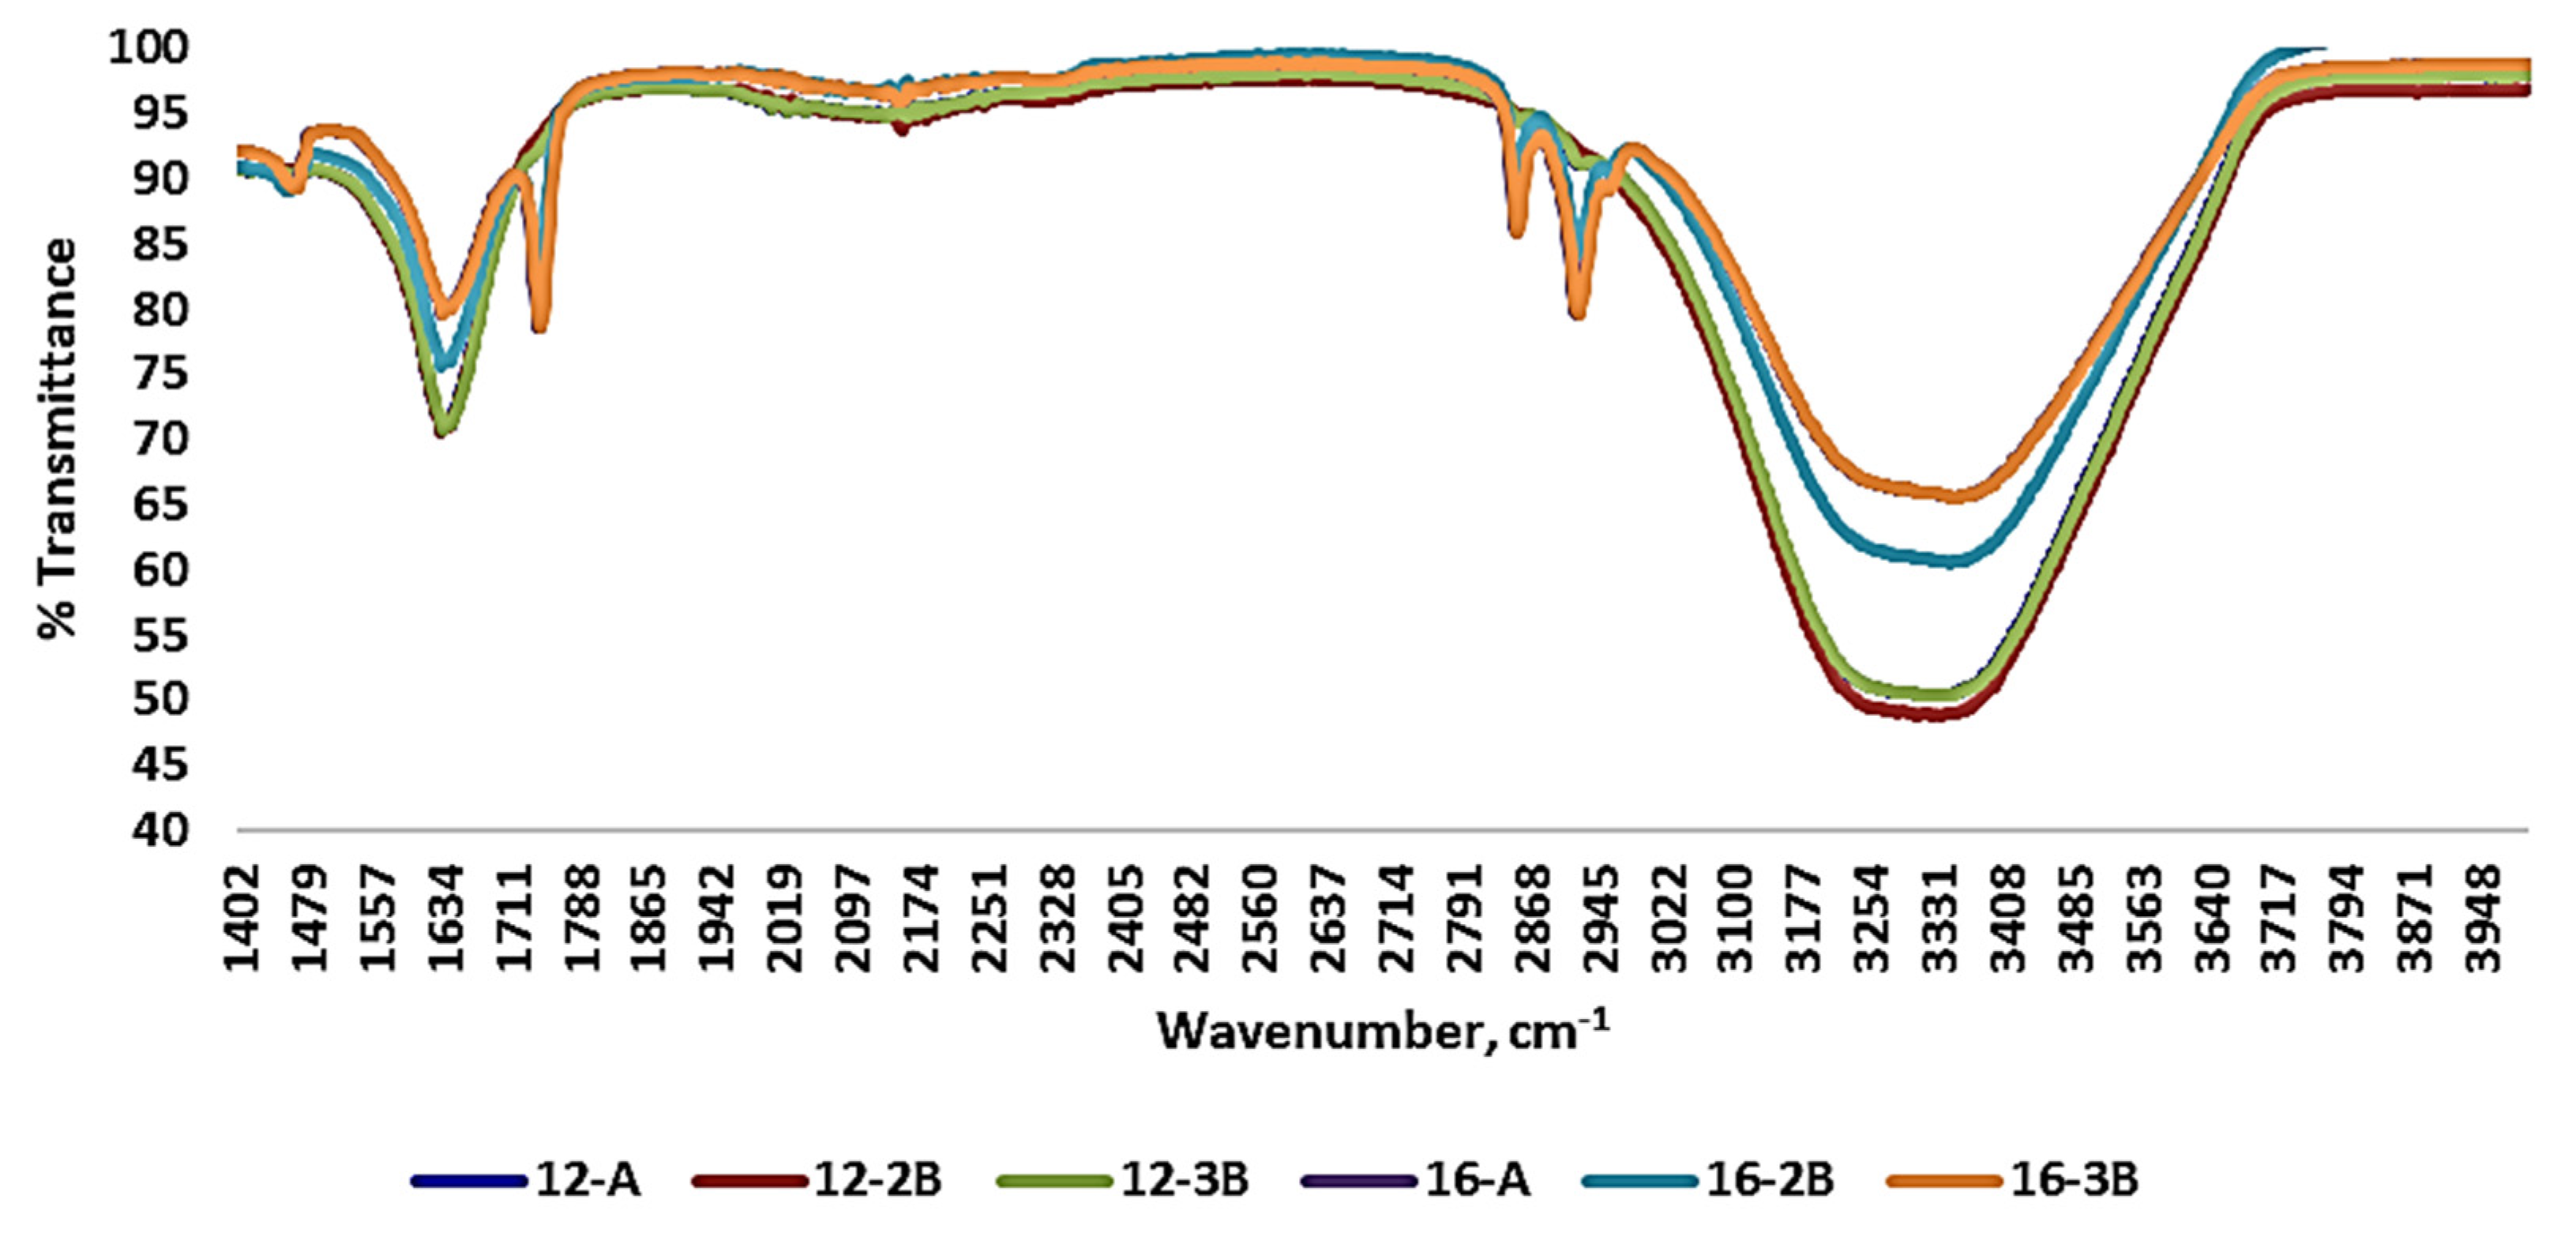
3.2. FT-IR Spectra of Yoghurt
3.3. Metabolite Profiling of Yoghurt and Establishing the Relationship between Metabolome and Techno-Functional Properties of Yoghurt
3.3.1. Metabolite Profiling of Yoghurt Prepared from Barbari Milk Containing Different Total Solids Levels and Types and Levels of Starter Culture
3.3.2. Multivariate Statistical Analysis of Differentially Expressed Metabolites in Barbari Yoghurt Samples
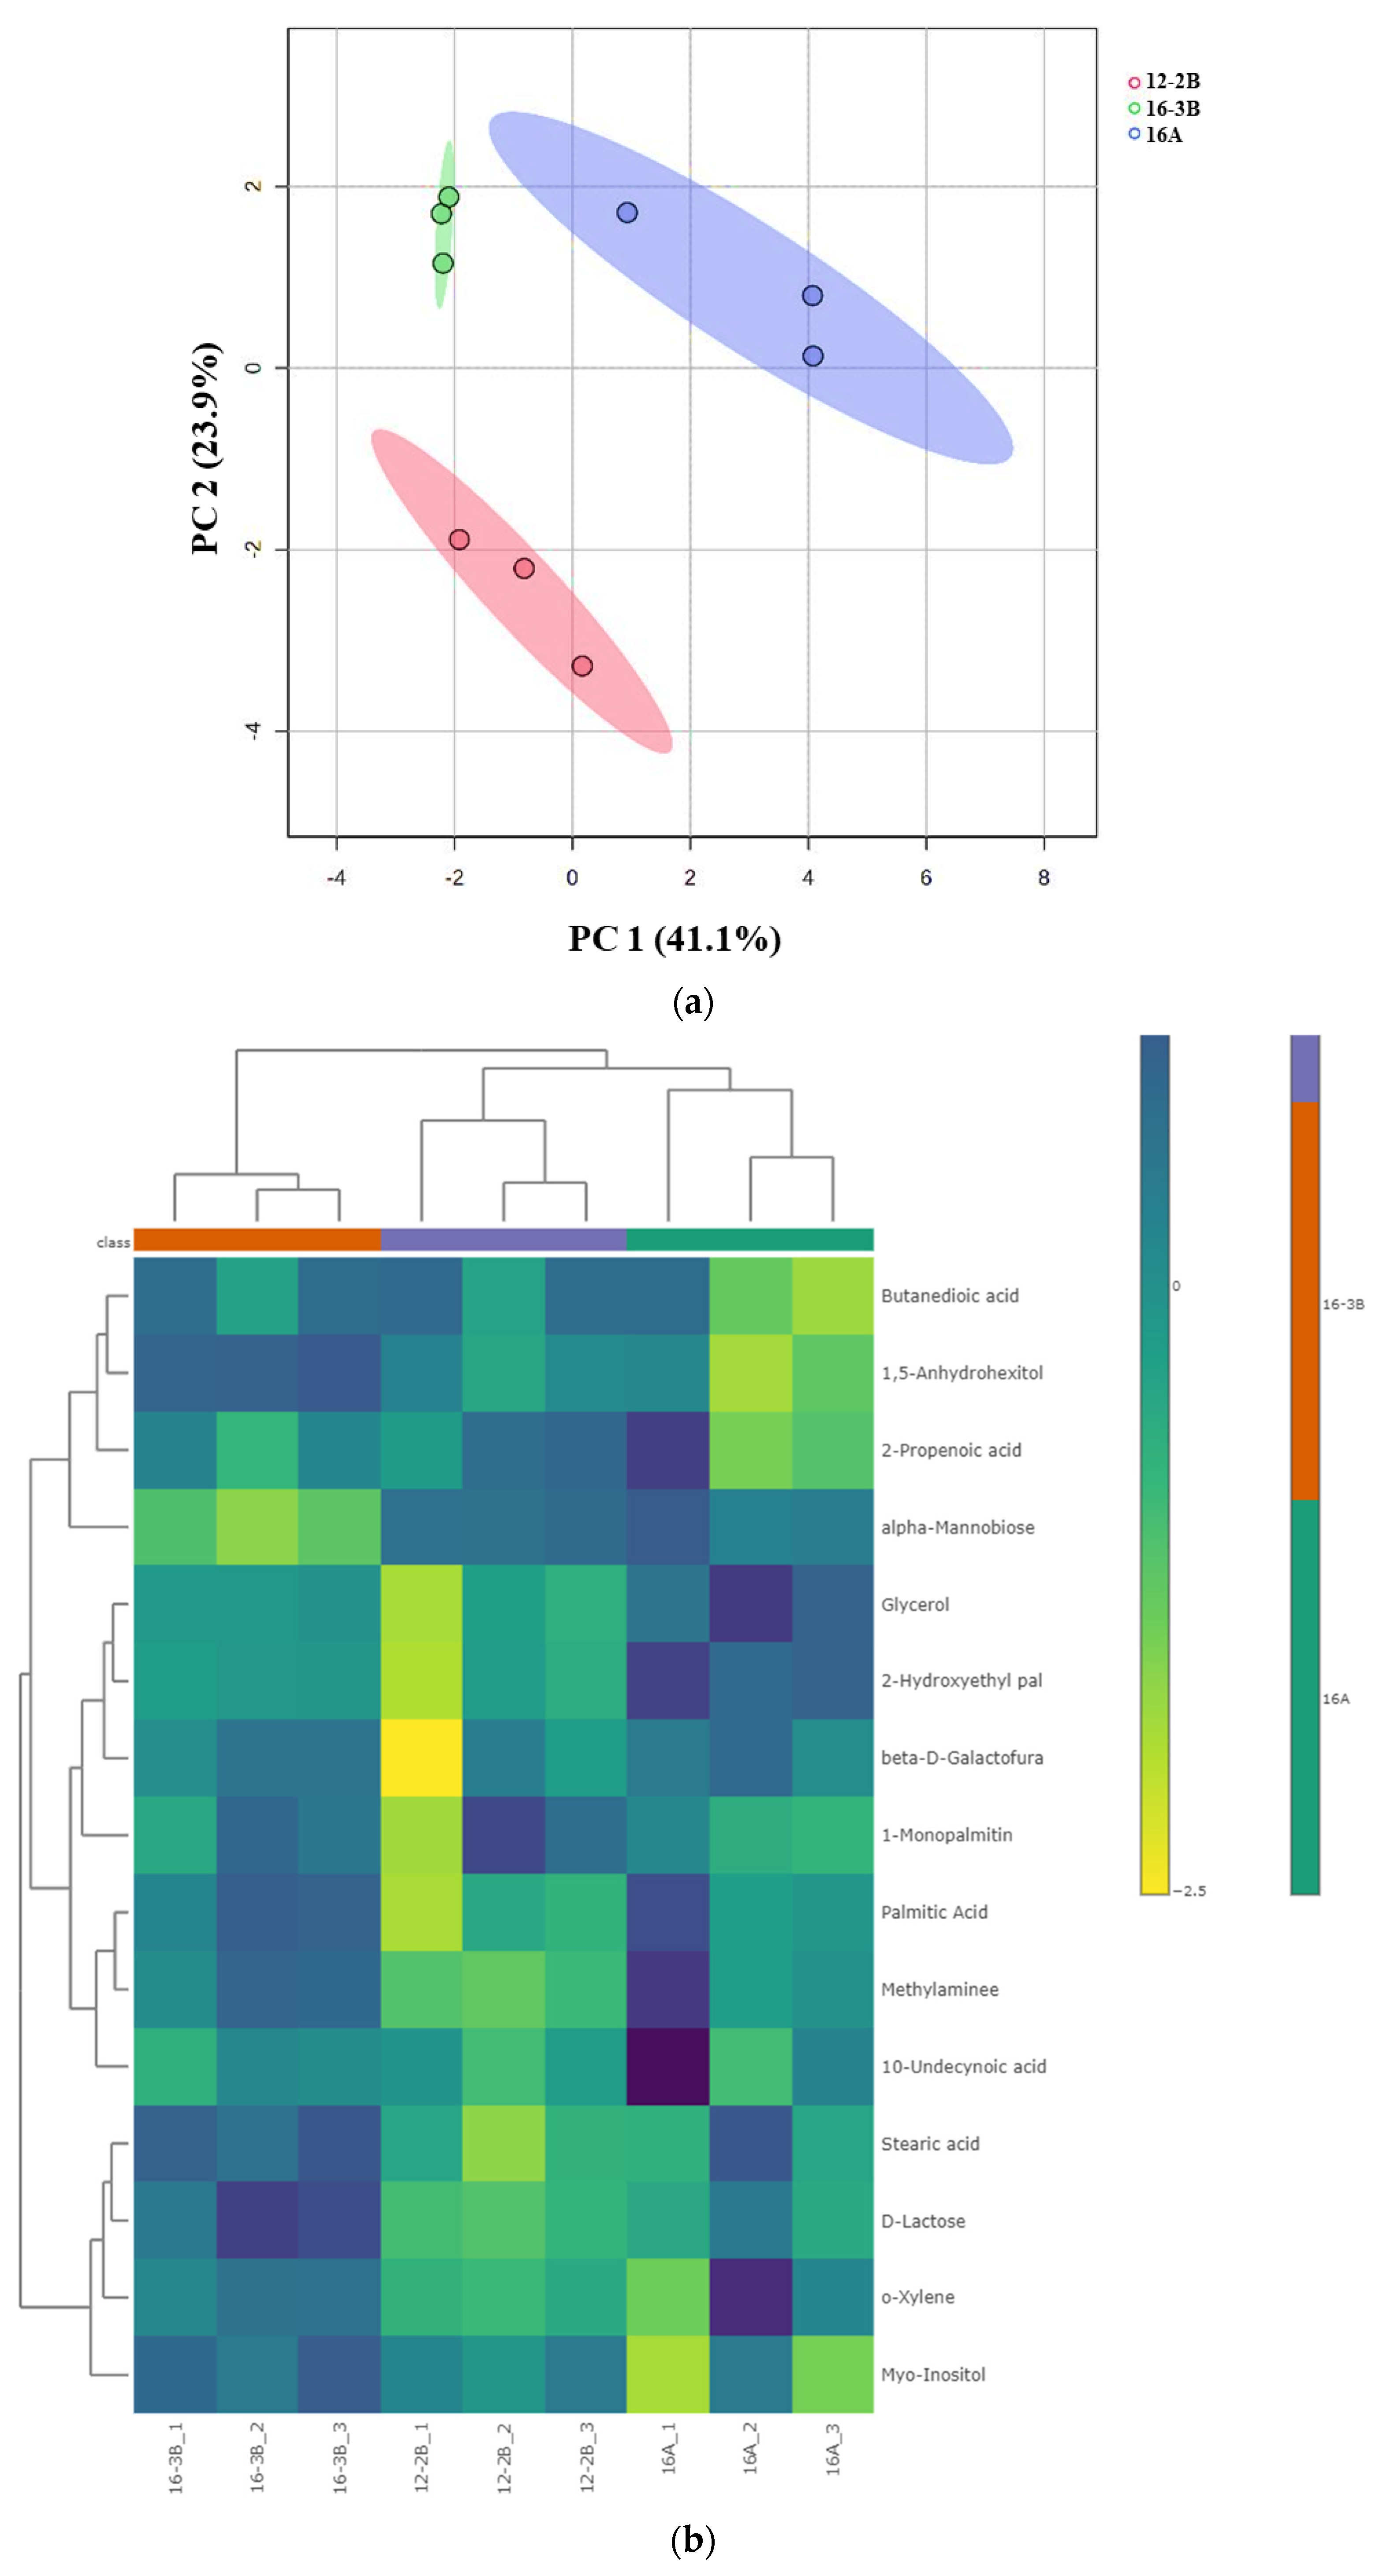
Principal Component Analysis and Heat Map
Correlation among Differentially Expressed Metabolites in Barbari Yoghurt Samples
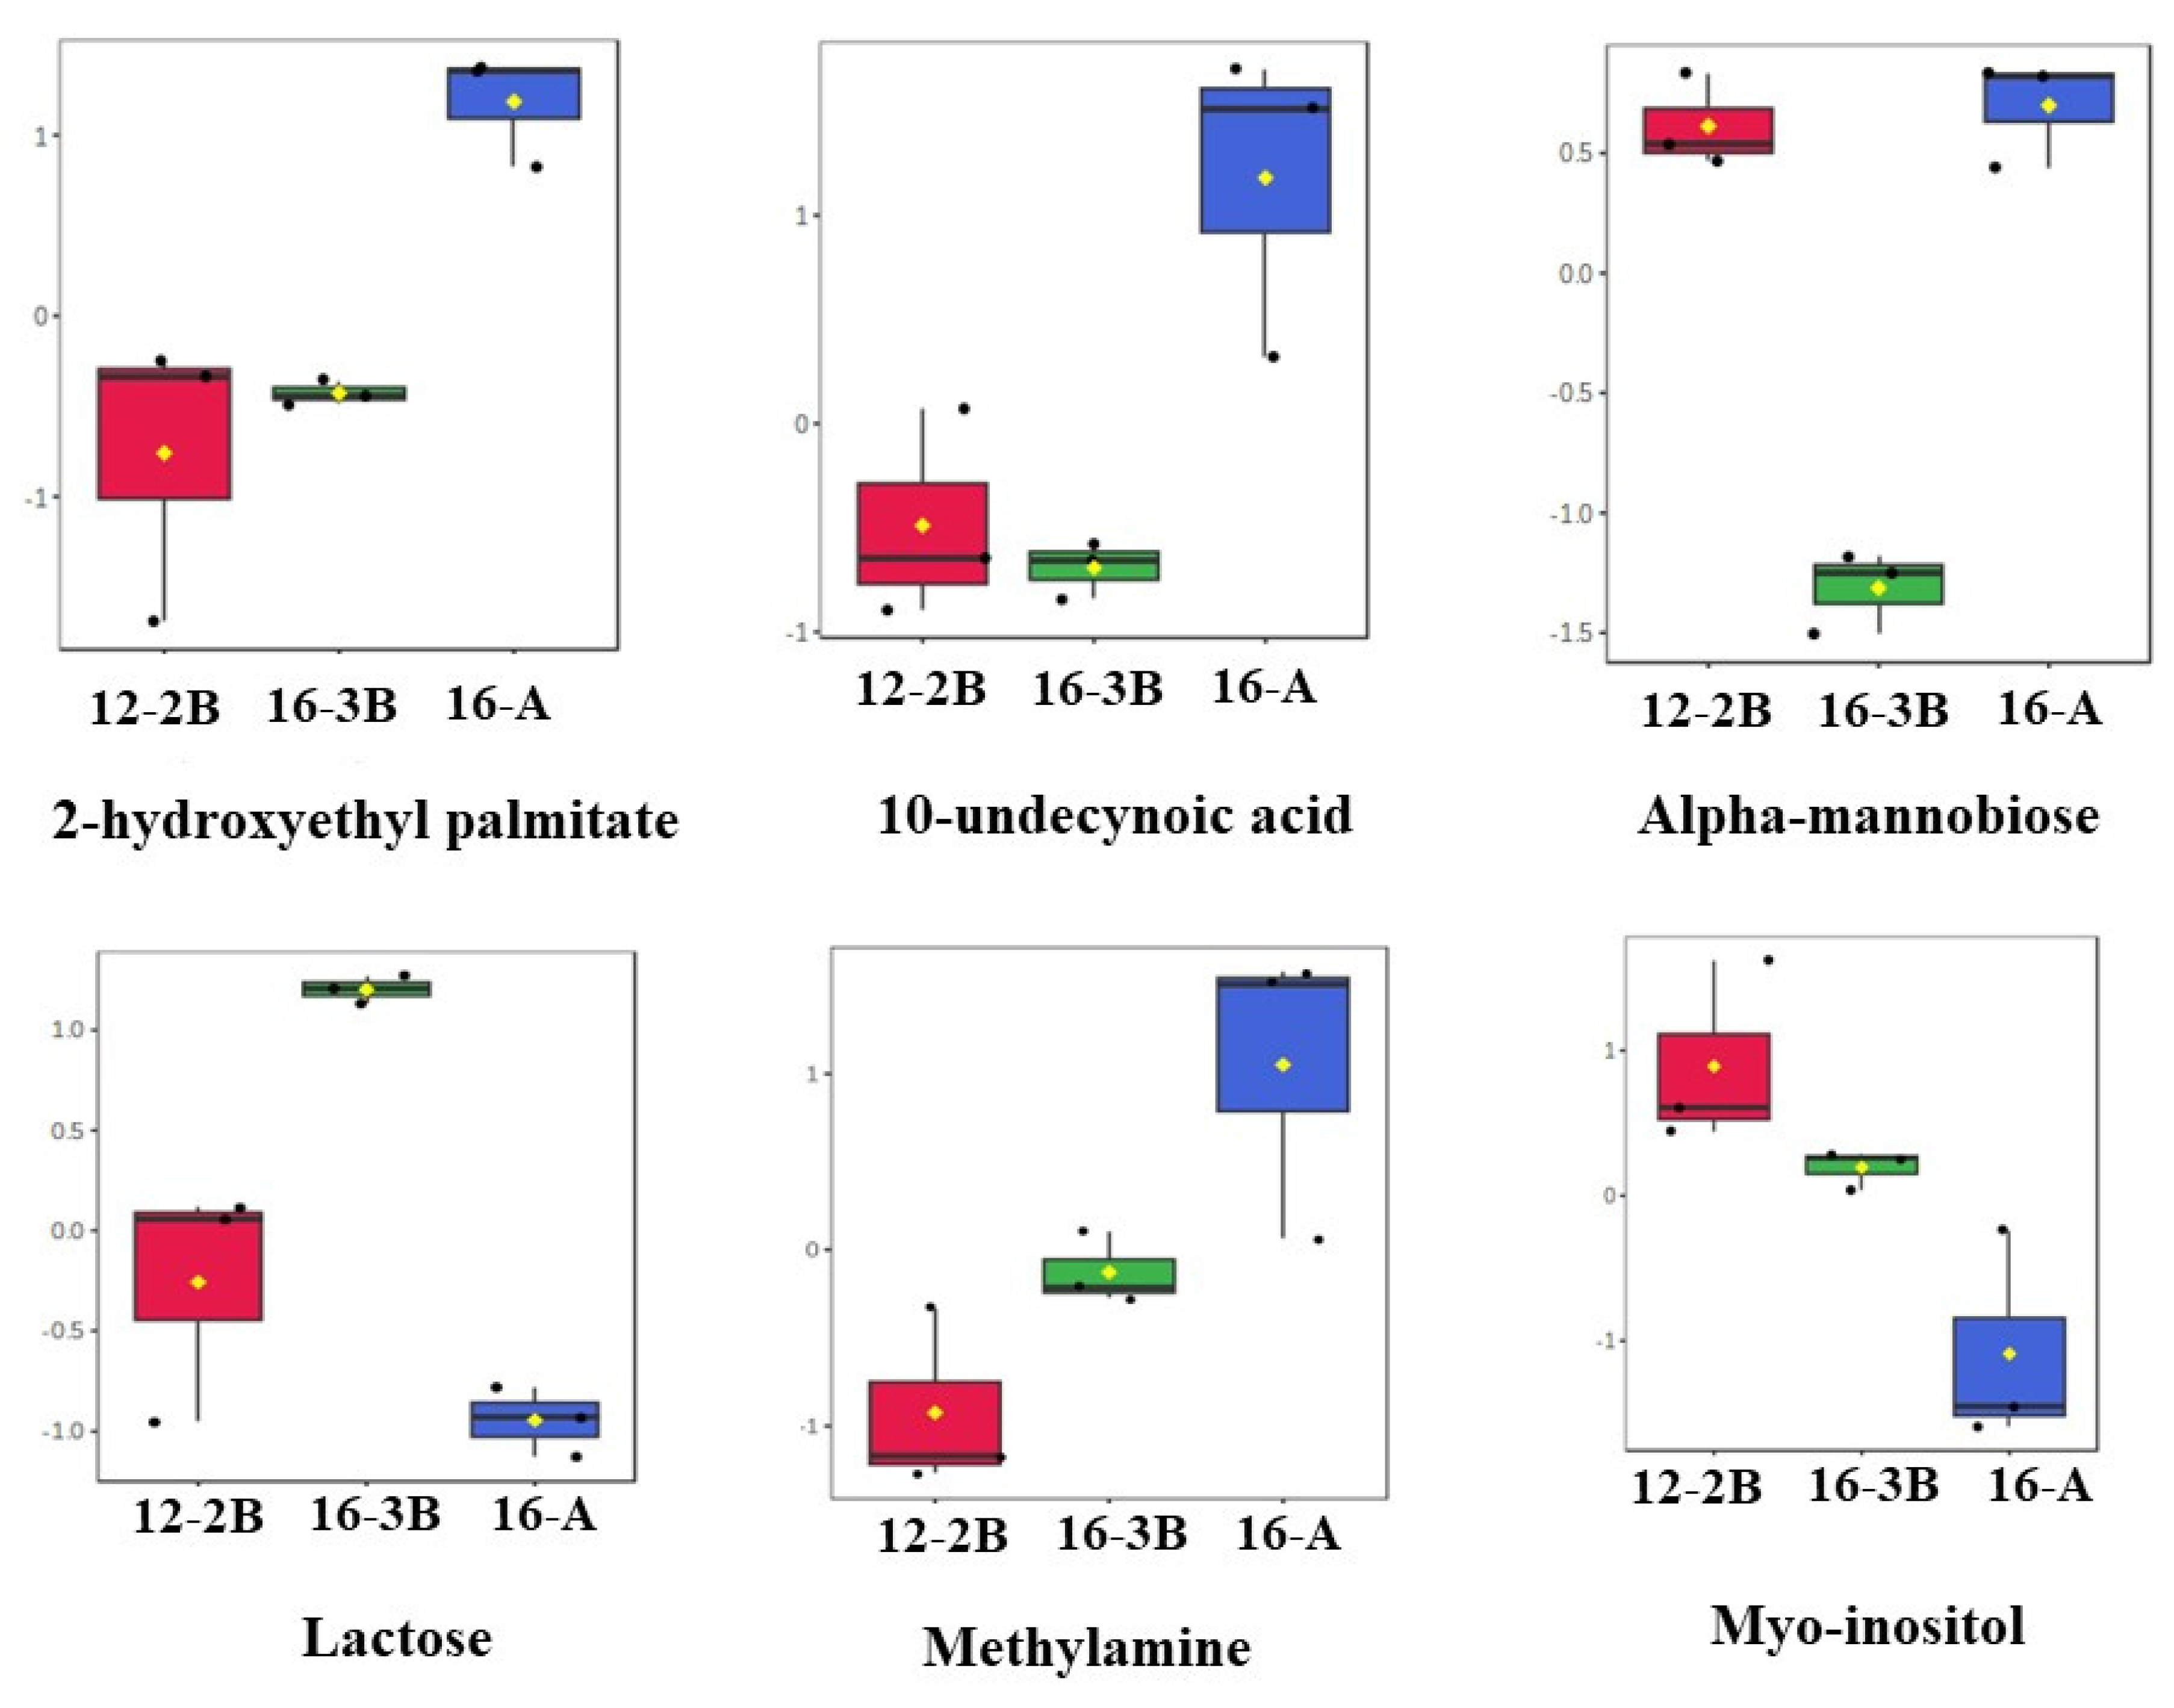
Box-and-Whisker Plots of Differentially Expressed Metabolites in Barbari Yoghurt Samples
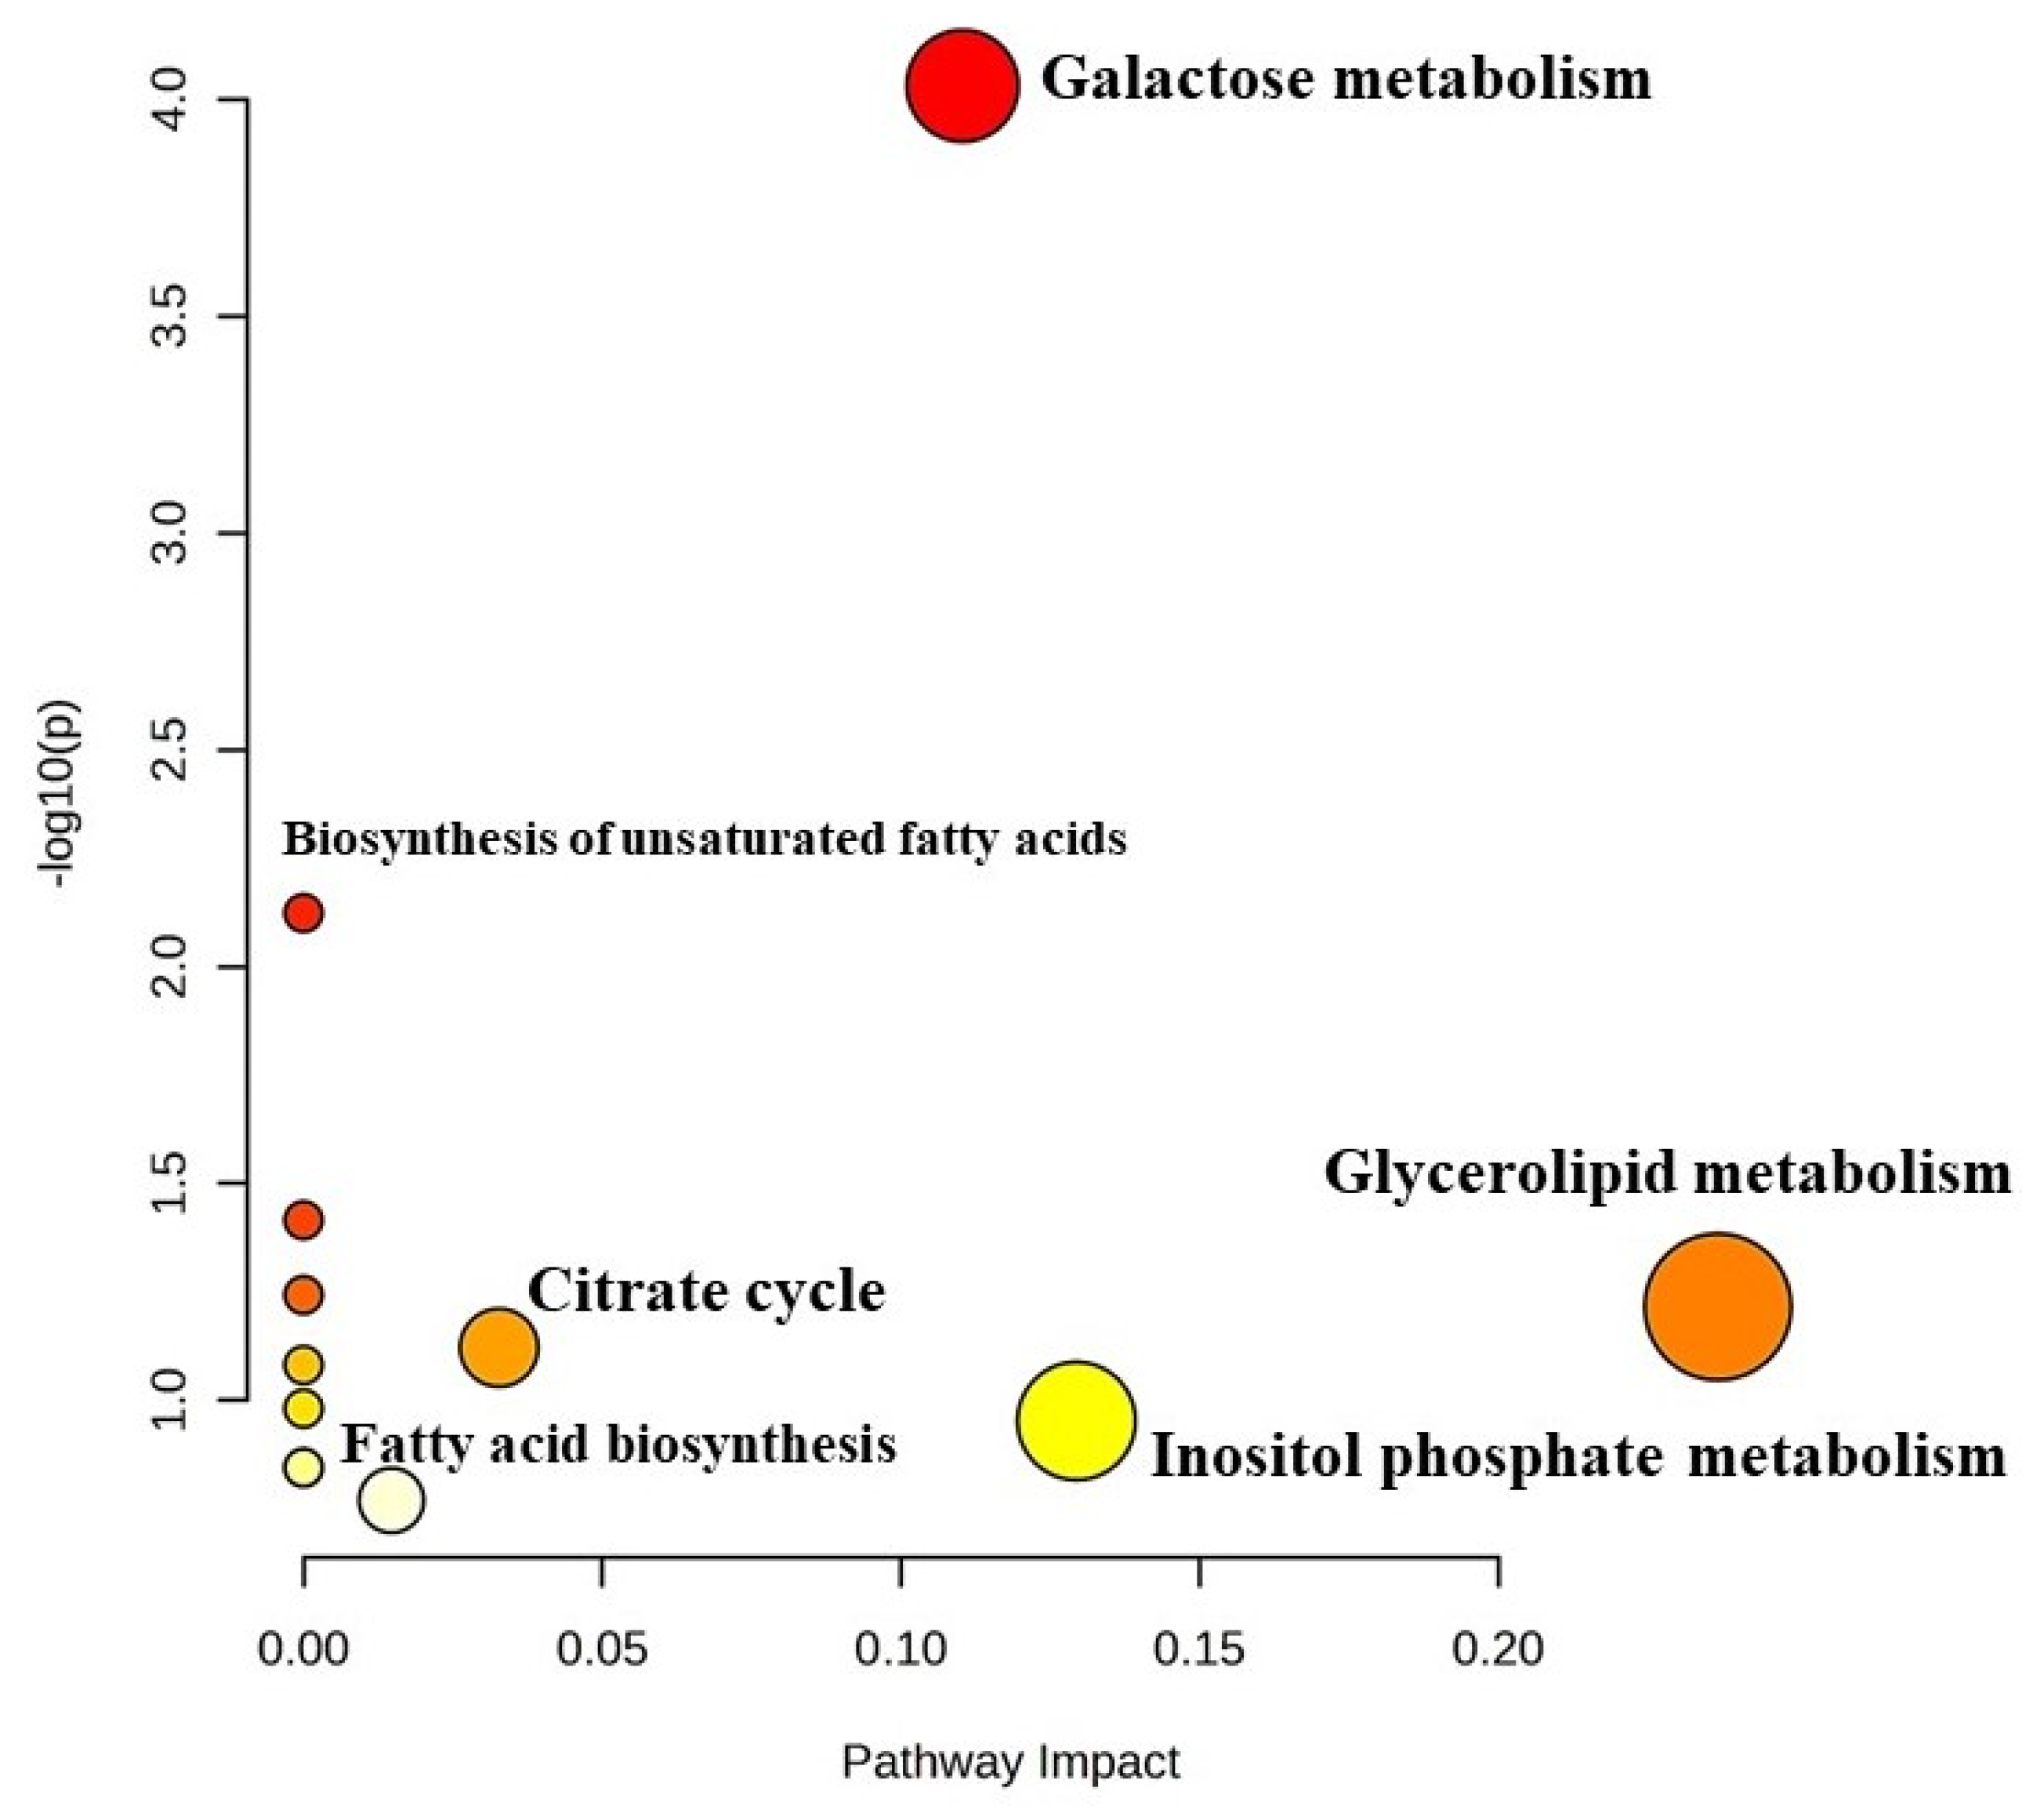
Pathway Impact Analysis of Differentially Expressed Metabolites in Barbari Yoghurt
3.3.3. Relationship between Firmness and Metabolites of Barbari Yoghurt
4. Conclusions
Author Contributions
Funding
Institutional Review Board Statement
Informed Consent Statement
Data Availability Statement
Acknowledgments
Conflicts of Interest
References
- Kamble, K.D.; Kokate, P.S. Production and Keeping Quality of Yogurt from Buffalo and Cow Milk-a Traditional Milk Product of High Health Value. Indian J. Tradit. Knowl. 2015, 14, 279–284. [Google Scholar]
- Zhang, T.; Geng, S.; Cheng, T.; Mao, K.; Chitrakar, B.; Gao, J.; Sang, Y. From the Past to the Future: Fermented Milks and Their Health Effects against Human Diseases. Food Front. 2023, 4, 1747–1777. [Google Scholar] [CrossRef]
- Aryana, K.J.; Olson, D.W. A 100-Year Review: Yogurt and Other Cultured Dairy Products. J. Dairy Sci. 2017, 100, 9987–10013. [Google Scholar] [CrossRef] [PubMed]
- Tian, H.; Shi, Y.; Zhang, Y.; Yu, H.; Mu, H.; Chen, C. Screening of Aroma-Producing Lactic Acid Bacteria and Their Application in Improving the Aromatic Profile of Yogurt. J. Food Biochem. 2019, 43, e12837. [Google Scholar] [CrossRef] [PubMed]
- Passerini, D.; Laroute, V.; Coddeville, M.; Le Bourgeois, P.; Loubière, P.; Ritzenthaler, P.; Cocaign-Bousquet, M.; Daveran-Mingot, M.-L. New Insights into Lactococcus Lactis Diacetyl- and Acetoin-Producing Strains Isolated from Diverse Origins. Int. J. Food Microbiol. 2013, 160, 329–336. [Google Scholar] [CrossRef] [PubMed]
- Sfakianakis, P.; Tzia, C. Conventional and Innovative Processing of Milk for Yogurt Manufacture; Development of Texture and Flavor: A Review. Foods 2014, 3, 176–193. [Google Scholar] [CrossRef]
- Akshit, F.; Deshwal, G.K.; Sharma, H.; Kumar, P.; Maddipatla, D.K.; Singh, M.P.; Goksen, G. Technological Challenges in Production of Goat Milk Products and Strategies to Overcome Them: A Review. Int. J. Food Sci. Technol. 2024, 59, 6–16. [Google Scholar] [CrossRef]
- dos Santos, W.M.; Gomes, A.C.G.; Nobre, M.S.d.C.; Pereira, M.d.S.; Pereira, E.V.d.S.; dos Santos, K.M.O.; Florentino, E.R.; Buriti, F.C.A. Goat Milk as a Natural Source of Bioactive Compounds and Strategies to Enhance the Amount of These Beneficial Components. Int. Dairy J. 2023, 137, 105515. [Google Scholar] [CrossRef]
- López-Aliaga, I.; Alférez, M.; Nestares, M.; Ros, P.; Barrionuevo, M.; Campos, M. Goat Milk Feeding Causes an Increase in Biliary Secretion of Cholesterol and a Decrease in Plasma Cholesterol Levels in Rats. J. Dairy Sci. 2005, 88, 1024–1030. [Google Scholar] [CrossRef] [PubMed]
- Nayik, G.A.; Jagdale, Y.D.; Gaikwad, S.A.; Devkatte, A.N.; Dar, A.H.; Dezmirean, D.S.; Bobis, O.; Ranjha, M.M.A.N.; Ansari, M.J.; Hemeg, H.A.; et al. Recent Insights into Processing Approaches and Potential Health Benefits of Goat Milk and Its Products: A Review. Front. Nutr. 2021, 8, 1–16. [Google Scholar] [CrossRef] [PubMed]
- Goswami, M.; Bharti, S.K.; Tewari, A.; Sharma, H.; Karunakara, K.N. Implication of Functional Ingredients of Goat Milk to Develop Functional Foods. J. Anim. Feed. Sci. Technol. 2017, 5, 65–72. [Google Scholar]
- Meena, P.K.; Gupta, V.K.; Meena, G.S.; Raju, P.N.; Parmar, P.T. Application of Ultrafiltration Technique for the Quality Improvement of Dahi. J. Food Sci. Technol. 2015, 52, 7974–7983. [Google Scholar] [CrossRef] [PubMed][Green Version]
- Sharma, H.; Ozogul, F.; Bartkiene, E.; Rocha, J.M. Impact of Lactic Acid Bacteria and Their Metabolites on the Techno-Functional Properties and Health Benefits of Fermented Dairy Products. Crit. Rev. Food Sci. Nutr. 2021, 63, 4819–4841. [Google Scholar] [CrossRef] [PubMed]
- Tamime, A.Y.; Robinson, R.K. 5—Traditional and Recent Developments in Yoghurt Production and Related Products BT—Tamime and Robinson’s Yoghurt, 3rd ed.; Series in Food Science, Technology and Nutrition; Woodhead Publishing: Sawston, UK, 2007; pp. 348–467. [Google Scholar]
- German, J.B.; Hammock, B.D.; Watkins, S.M. Metabolomics: Building on a Century of Biochemistry to Guide Human Health. Metabolomics 2005, 1, 3–9. [Google Scholar] [CrossRef] [PubMed]
- Farghal, H.H.; Mansour, S.T.; Khattab, S.; Zhao, C.; Farag, M.A. A Comprehensive Insight on Modern Green analyses for Quality Control Determination and Processing Monitoring in Coffee and Cocoa Seeds. Food Chem. 2022, 394, 133529. [Google Scholar] [CrossRef] [PubMed]
- Tanello, A.C.; Silveira, C.D.d.S.; Carasek, E.; Verruck, S.; Prudencio, E.S.; Amboni, R.D.M.C. Analysis of Volatile Compounds in Probiotic Yogurt during Storage through Solid-phase Microextraction Gas Chromatography. Asian J. Adv. Agric. Res. 2019, 9, 1–11. [Google Scholar] [CrossRef]
- Hagi, T.; Kobayashi, M.; Nomura, M. Metabolome Analysis of Milk Fermented by γ-Aminobutyric Acid–Producing Lactococcus Lactis. J. Dairy Sci. 2016, 99, 994–1001. [Google Scholar] [CrossRef] [PubMed]
- Caboni, P.; Murgia, A.; Porcu, A.; Manis, C.; Ibba, I.; Contu, M.; Scano, P. A Metabolomics Comparison between Sheep’s and Goat’s Milk. Food Res. Int. 2019, 119, 869–875. [Google Scholar] [CrossRef] [PubMed]
- Murgia, A.; Scano, P.; Cacciabue, R.; Dessì, D.; Caboni, P. GC-MS Metabolomics Comparison of Yoghurts from Sheep’s and Goats’ Milk. Int. Dairy J. 2019, 96, 44–49. [Google Scholar] [CrossRef]
- Allen, M.M.; Pike, O.A.; Kenealey, J.D.; Dunn, M.L. Metabolomics of Acid Whey Derived from Greek Yogurt. J. Dairy Sci. 2021, 104, 11401–11412. [Google Scholar] [CrossRef] [PubMed]
- Li, D.; Peng, J.; Kwok, L.-Y.; Zhang, W.; Sun, T. Metabolomic Analysis of Streptococcus Thermophilus S10-Fermented Milk. LWT 2022, 161, 113368. [Google Scholar] [CrossRef]
- Sun, M.; Yu, J.; Song, Y.; Li, X.; Mu, G.; Tuo, Y. Metabolomic Analysis of Fermented Milk with Lactobacillus delbrueckii Subsp. Bulgaricus, Lacticaseibacillus paracasei Cocultured with Kluyveromyces marxianus during Storage. Food Biosci. 2023, 54, 102901. [Google Scholar] [CrossRef]
- Sharma, H.; El Rassi, G.D.; Lathrop, A.; Dobreva, V.B.; Belem, T.S.; Ramanathan, R. Comparative Analysis of Metabolites in Cow and Goat Milk Yoghurt Using GC–MS Based Untargeted Metabolomics. Int. Dairy J. 2021, 117, 105016. [Google Scholar] [CrossRef]
- Mozzi, F.; Ortiz, M.E.; Bleckwedel, J.; De Vuyst, L.; Pescuma, M. Metabolomics as a Tool for the Comprehensive Understanding of Fermented and Functional Foods with Lactic Acid Bacteria. Food Res. Int. 2013, 54, 1152–1161. [Google Scholar] [CrossRef]
- IS 12333; Milk, Cream and Evaporated Milk—Determination of Total Solids Content (Reference Method): Bureau of Indian Standards: Free Download, Borrow, and Streaming: Internet Archive. BIS: New Delhi, India. Available online: https://archive.org/details/gov.in.is.12333.1997 (accessed on 1 February 2024).
- AOAC. Official Methods of Analysis, 14th ed.; Association of Official Analytical Chemists—AOAC: Arlington, TX, USA, 1984; Available online: https://www.scirp.org/reference/ReferencesPapers?ReferenceID=1300500 (accessed on 1 February 2024).
- IS 1224-2; Determination of Fat by the Gerber Method, Part 2: Milk Products. BIS: New Delhi, India, 1977.
- AOAC Official Methods of Analysis of the Association of Official Agriculture Chemists; Association of Analytical Chemists: Washington, DC, USA, 2000; pp. 125–139.
- AOAC. Official Methods of Analysis, 16th ed.; Association of Official Analytical Chemists: Washington DC, USA, 1995; Available online: https://www.sciepub.com/reference/141205 (accessed on 1 February 2024).
- IS:1497; Methods of Test for Dairy Industry (Part II) Chemical Analysis of Milk. Indian Standards Institution: Manak Bhavan. BIS: New Delhi, India, 1961.
- Saipriya, K.; Deshwal, G.K.; Singh, A.K.; Kapila, S.; Sharma, H. Effect of Dairy Unit Operations on Immunoglobulins, Colour, Rheology and Microbiological Characteristics of Goat Milk. Int. Dairy J. 2021, 121, 105118. [Google Scholar] [CrossRef]
- Amatayakul, T.; Sherkat, F.; Shah, N.P. Syneresis in Set Yogurt as Affected by EPS Starter Cultures and Levels of Solids. Int. J. Dairy Technol. 2006, 59, 216–221. [Google Scholar] [CrossRef]
- Deshwal, G.K.; Ameta, R.; Sharma, H.; Singh, A.K.; Panjagari, N.R.; Baria, B. Effect of Ultrafiltration and Fat Content on Chemical, Functional, Textural and Sensory Characteristics of Goat Milk-Based Halloumi Type Cheese. LWT 2020, 126, 109341. [Google Scholar] [CrossRef]
- Chand, P.; Kumar, M.D.; Singh, A.K.; Deshwal, G.K.; Rao, P.S.; Tomar, S.K.; Sharma, H. Low-calorie Synbiotic Yoghurt from Indigenous Probiotic Culture and Combination of Inulin and Oligofructose: Improved Sensory, Rheological, and Textural Attributes. J. Food Process. Preserv. 2021, 45, e15322. [Google Scholar] [CrossRef]
- Sharma, H.; Singh, A.K.; Rao, P.S.; Deshwal, G.K.; Singh, R.; Kumar, M.D. A Study on Incorporation of Giloy (Tinospora cordifolia) for the Development of Shelf-Stable Goat Milk Based Functional Beverage. J. Food Sci. Technol. 2023, 61, 503–515. [Google Scholar] [CrossRef] [PubMed]
- MetaboAnalyst 5.0. Available online: https://www.metaboanalyst.ca (accessed on 31 January 2024).
- Mahdian, E.; Tehrani, M.M. Evaluation the Effect of Milk Total Solids on the Relationship between Growth and Activity of Starter Cultures and Quality of Concentrated Yoghurt. J. Agric. Environ. Sci 2007, 2, 587–592. [Google Scholar]
- Hayes, E.; Wallace, D.; O’Donnell, C.; Greene, D.; Hennessy, D.; O’Shea, N.; Tobin, J.; Fenelon, M. Trend Analysis and Prediction of Seasonal Changes in Milk Composition from a Pasture-Based Dairy Research Herd. J. Dairy Sci. 2023, 106, 2326–2337. [Google Scholar] [CrossRef] [PubMed]
- Moitzi, C.; Vavrin, R.; Bhat, S.K.; Stradner, A.; Schurtenberger, P. A New Instrument for Time-Resolved Static and Dynamic Light-Scattering Experiments in Turbid Media. J. Colloid Interface Sci. 2009, 336, 565–574. [Google Scholar] [CrossRef]
- Flores-Mancha, M.A.; Ruíz-Gutiérrez, M.G.; Sánchez-Vega, R.; Santellano-Estrada, E.; Chávez-Martínez, A. Effect of Encapsulated Beet Extracts (Beta vulgaris) Added to Yogurt on the Physicochemical Characteristics and Antioxidant Activity. Molecules 2021, 26, 4768. [Google Scholar] [CrossRef]
- Riar, H.; Goel, N.; Singh, P.K.; Kumar, S.S.; Mishra, S.K.; Chawla, R. Changes in Instrumental Color and Proximate Parameters in Yoghurt Fortified with Vitamin a and d Nanoemulsion during Storage. Pharma Innov. J. 2021, 8, 378–381. [Google Scholar]
- Vareltzis, P.; Adamopoulos, K.; Stavrakakis, E.; Stefanakis, A.; Goula, A.M. Approaches to Minimise Yoghurt Syneresis in Simulated Tzatziki Sauce Preparation. Int. J. Dairy Technol. 2016, 69, 191–199. [Google Scholar] [CrossRef]
- Zhou, H.-X.; Pang, X. Electrostatic Interactions in Protein Structure, Folding, Binding, and Condensation. Chem. Rev. 2018, 118, 1691. [Google Scholar] [CrossRef] [PubMed]
- Kose, Y.E.; Altun, I.; Kose, S. Determination of Texture Profile Analysis of Yogurt Produced by Industrial and Traditional Method. Int. J. Sci. Technol. Res. 2018, 4, 66–70. [Google Scholar]
- Wen, Y.; Kong, B.-H.; Zhao, X.-H. Quality Indices of the Set-Yoghurt Prepared from Bovine Milk Treated with Horseradish Peroxidase. J. Food Sci. Technol. 2014, 51, 1525–1532. [Google Scholar] [CrossRef]
- Magenis, R.B.; Prudêncio, E.S.; Amboni, R.D.M.C.; Júnior, N.G.C.; Oliveira, R.V.B.; Soldi, V.; Benedet, H.D. Compositional and Physical Properties of Yogurts Manufactured from Milk and Whey Cheese Concentrated by Ultrafiltration. Int. J. Food Sci. Technol. 2006, 41, 560–568. [Google Scholar] [CrossRef]
- Greis, M.; Sainio, T.; Katina, K.; Nolden, A.A.; Kinchla, A.J.; Seppä, L.; Partanen, R. Physicochemical Properties and Mouthfeel in Commercial Plant-Based Yogurts. Foods 2022, 11, 941. [Google Scholar] [CrossRef] [PubMed]
- Ragab, E.S.; Zhang, S.; Korma, S.A.; Buniowska-Olejnik, M.; Nasser, S.A.A.; Esatbeyoglu, T.; Lv, J.; Nassar, K.S. Physicochemical and Rheological Properties of Stirred Yoghurt during Storage Induced from High-Intensity Thermosonicated Goat and Cow Milk. Fermentation 2023, 9, 42. [Google Scholar] [CrossRef]
- Flemming, H.-C. EPS—Then and Now. Microorganisms 2016, 4, 41. [Google Scholar] [CrossRef] [PubMed]
- Karimi, A.; Karig, D.; Kumar, A.; Ardekani, A.M. Interplay of Physical Mechanisms and Biofilm Processes: Review of Microfluidic Methods. Lab a Chip 2015, 15, 23–42. [Google Scholar] [CrossRef] [PubMed]
- Li, L.; Zhao, X.; Xu, X. Trace the Difference Driven by Unfolding-Refolding Pathway of Myofibrillar Protein: Emphasizing the Changes on Structural and Emulsion Properties. Food Chem. 2022, 367, 130688. [Google Scholar] [CrossRef] [PubMed]
- Zhao, C.J.; Gänzle, M.G. Synthesis of Taste-Active γ-Glutamyl Dipeptides during Sourdough Fermentation by Lactobacillus reuteri. J. Agric. Food Chem. 2016, 64, 7561–7568. [Google Scholar] [CrossRef] [PubMed]
- Froiio, F.; Cristiano, M.C.; Mancuso, A.; Iannone, M.; Paolino, D. Vegetable-Milk-Based Yogurt-Like Structure: Rheological Properties Influenced by Gluten-Free Carob Seed Flour. Appl. Sci. 2020, 10, 6963. [Google Scholar] [CrossRef]
- Wu, H.; Xue, R.; Dong, L.; Liu, T.; Deng, C.; Zeng, H.; Shen, X. Metabolomic Profiling of Human Urine in Hepatocellular Carcinoma Patients Using Gas Chromatography/Mass Spectrometry. Anal. Chim. Acta 2009, 648, 98–104. [Google Scholar] [CrossRef] [PubMed]
- Zhu, Z.; Bassey, A.P.; Cao, Y.; Ma, Y.; Huang, M.; Yang, H. Food Protein Aggregation and Its Application. Food Res. Int. 2022, 160, 111725. [Google Scholar] [CrossRef] [PubMed]
- Mudgil, D.; Barak, S.; Khatkar, B.S. Texture Profile Analysis of Yogurt as Influenced by Partially Hydrolyzed Guar Gum and Process Variables. J. Food Sci. Technol. 2017, 54, 3810–3817. [Google Scholar] [CrossRef] [PubMed]
- McKerchar, H.J.; Clerens, S.; Dobson, R.C.; Dyer, J.M.; Maes, E.; Gerrard, J.A. Protein-Protein Crosslinking in Food: Proteomic Characterisation Methods, Consequences and Applications. Trends Food Sci. Technol. 2019, 86, 217–229. [Google Scholar] [CrossRef]
- Chandra, M.V.; Shamasundar, B.A. Texture Profile Analysis and Functional Properties of Gelatin from the Skin of Three Species of Fresh Water Fish. Int. J. Food Prop. 2015, 18, 572–584. [Google Scholar] [CrossRef]
- Yadav, V.; Gupta, V.K.; Meena, G.S. Effect of Culture Levels, Ultrafiltered Retentate Addition, Total Solid Levels and Heat Treatments on Quality Improvement of Buffalo Milk Plain Set Yoghurt. J. Food Sci. Technol. 2018, 55, 1648–1655. [Google Scholar] [CrossRef] [PubMed]
- Guimarães, J.T.; Silva, E.K.; Alvarenga, V.O.; Costa, A.L.R.; Cunha, R.L.; Sant’Anna, A.S.; Freitas, M.Q.; Meireles, M.A.A.; Cruz, A.G. Physicochemical Changes and Microbial Inactivation after High-Intensity Ultrasound Processing of Prebiotic Whey Beverage Applying Different Ultrasonic Power Levels. Ultrason. Sonochemistry 2018, 44, 251–260. [Google Scholar] [CrossRef] [PubMed]
- Codină, G.G.; Franciuc, S.G.; Mironeasa, S. Rheological Characteristics and Microstructure of Milk Yogurt as Influenced by Quinoa Flour Addition. J. Food Qual. 2016, 39, 559–566. [Google Scholar] [CrossRef]
- Xiao, R.; Liu, M.; Tian, Q.; Hui, M.; Shi, X.; Hou, X. Physical and Chemical Properties, Structural Characterization and Nutritional Analysis of Kefir Yoghurt. Front. Microbiol. 2023, 13, 1107092. [Google Scholar] [CrossRef] [PubMed]
- Deshwal, G.K.; Singh, R.; Singh, A.K.; Kumar, D.; Sharma, H. Comparative Characterisation of Ghee from Indian Camel Breeds Using GC-MS and FTIR Techniques. Int. J. Dairy Technol. 2022, 75, 182–193. [Google Scholar] [CrossRef]
- Papadopoulou, O.S.; Argyri, A.A.; Kounani, V.; Tassou, C.C.; Chorianopoulos, N. Use of Fourier Transform Infrared Spectroscopy for Monitoring the Shelf Life and Safety of Yogurts Supplemented with a Lactobacillus plantarum Strain with Probiotic Potential. Front. Microbiol. 2021, 12, 678356. [Google Scholar] [CrossRef] [PubMed]
- Leal, M.A.; Dias, A.T.; Porto, M.L.; Brun, B.F.; Gava, A.L.; Meyrelles, S.S.; Gil-Longo, J.; Campos-Toimil, M.; Pereira, T.M.; Vasquez, E.C. Sildenafil (Viagra®) Prevents Cox-1/ TXA2 Pathway-Mediated Vascular Hypercontractility in ApoE-/- Mice. Cell. Physiol. Biochem. 2018, 44, 1796–1809. [Google Scholar] [CrossRef]
- Sharma, H.; Ramanathan, R. Gas Chromatography-Mass Spectrometry Based Metabolomic Approach to Investigate the Changes in Goat Milk Yoghurt during Storage. Food Res. Int. 2021, 140, 110072. [Google Scholar] [CrossRef]
- Sørensen, K.I.; Curic-Bawden, M.; Junge, M.P.; Janzen, T.; Johansen, E. Enhancing the Sweetness of Yoghurt through Metabolic Remodeling of Carbohydrate Metabolism in Streptococcus thermophilus and Lactobacillus delbrueckii subsp. bulgaricus. Appl. Environ. Microbiol. 2016, 82, 3683–3692. [Google Scholar] [CrossRef]
- Trimigno, A.; Lyndgaard, C.B.; Atladóttir, G.A.; Aru, V.; Engelsen, S.B.; Clemmensen, L.K.H. An NMR Metabolomics Approach to Investigate Factors Affecting the Yoghurt Fermentation Process and Quality. Metabolites 2020, 10, 293. [Google Scholar] [CrossRef] [PubMed]
- Sharma, H.; Ramanathan, R. GC–MS-Based Metabolomics Approach Reveals Metabolic Variations between Probiotics Incorporated Cow and Goat Milk Yoghurt. Int. J. Dairy Technol. 2023, 76, 521–532. [Google Scholar] [CrossRef]


| Type of Culture | Culture Level (%) | Total Solids (%) | Sample Code |
|---|---|---|---|
| Commercial | 0.1 | 12 | 12-A |
| 16 | 16-A | ||
| NCDC-263 | 2 | 12 | 12-2B |
| 16 | 16-2B | ||
| 3 | 12 | 12-3B | |
| 16 | 16-3B |
| S.No | Parameters | 12-A # | 16-A # | |
|---|---|---|---|---|
| 1. | Total solids (%) | 12.31 ± 0.35 b | 16.65 ± 0.4 a | |
| 2. | Fat (%) | 3.96 ± 0.01 b | 5.35 ± 0.03 a | |
| 3. | Protein (%) | 2.72 ± 0.03 b | 3.67 ± 0.03 a | |
| 4. | Ash (%) | 0.72 ± 0.02 b | 0.91 ± 0.01 a | |
| 5. | pH | 4.68 ± 0.01 b | 4.61 ± 0.01 a | |
| 6. | Acidity (% Lactic acid) | 0.74 ± 0.003 b | 0.78 ± 0.004 a | |
| 7. | Colour value | L* | 87.72 ± 0.159 b | 89.25 ± 0.258 a |
| 8. | a* | −2.26 ± 0.238 b | −1.62 ± 0.204 a | |
| 9. | b* | 9.13 ± 0.47 b | 11.63 ± 0.891 a | |
| 10. | Whey syneresis (%) | 38.21 ± 1.16 a | 21.33 ± 1.81 b | |
| 11. | Back extrusion test | Firmness (g) | 55.32 ± 4.29 b | 83.29 ± 8.48 a |
| 12. | Consistency (g·s) | 338.17± 15.67 b | 551.51 ± 19.71 a | |
| 13. | Cohesiveness (g) | −10.60 ± 1.71 a | −23.80 ± 1.90 b | |
| 14. | Work of cohesion (g·s) | −51.31 ± 6.73 a | −94.23 ± 10.67 b | |
| S.No | Parameters | 12-2B # | 16-2B # | 12-3B # | 16-3B # | |
|---|---|---|---|---|---|---|
| 1. | Total solids (%) | 12.26 ± 0.11 b | 16.81 ± 0.17 a | 12.63 ± 0.64 b | 16.82 ± 0.16 a | |
| 2. | Fat (%) | 4.00 ± 0.01 b | 5.33 ± 0.01 a | 3.99 ± 0.04 b | 5.31 ± 0.01 a | |
| 3. | Protein (%) | 2.71 ± 0.01 c | 3.69 ± 0.01 a | 2.75 ± 0.03 b | 3.72 ± 0.04 a | |
| 4. | Ash (%) | 0.71 ± 0.02 c | 0.92 ± 0.01 a | 0.72 ± 0.03 b | 0.93 ± 0.01 a | |
| 5. | pH | 4.66 ± 0.03 a | 4.62 ± 0.03 a | 4.62 ± 0.03 a | 4.61 ± 0.04 a | |
| 6. | Acidity (% Lactic acid) | 0.707 ± 0.001 c | 0.766 ± 0.005 a | 0.752 ± 0.002 b | 0.758 ± 0.001 a | |
| 7. | Colour value | L* | 87.01 ± 0.45 b | 88.57 ± 0.42 a | 87.31 ± 0.41 b | 88.99 ± 0.60 a |
| 8. | a* | −2.53 ± 0.10 b | −1.72 ± 0.13 a | −2.42 ± 0.19 b | −1.71 ± 0.20 a | |
| 9. | b* | 9.11 ± 0.08 b | 11.52 ± 0.59 a | 9.08 ± 0.77 b | 11.48 ± 0.66 a | |
| 10. | Whey syneresis (%) | 45.11 ± 1.09 a | 41.83 ± 2.42 b | 27.85 ± 1.94 c | 23.34 ± 1.20 d | |
| 11. | Back extrusion test | Firmness (g) | 42.97 ± 3.49 d | 51.03 ± 4.27 c | 66.71 ± 9.24 b | 78.32 ± 7.20 a |
| 12. | Consistency (g·s) | 320.13 ± 11.99 b | 330.85 ±11.28 b | 414.04 ± 32.92 a | 443.42 ± 31.66 a | |
| 13. | Cohesiveness (g) | −8.27 ± 1.74 a | −9.34 ± 1.03 a | −16.05 ± 2.83 b | −19.97 ± 3.58 b | |
| 14. | Work of cohesion (g·s) | −37.16 ± 5.52 a | −45.42 ± 10.74 a | −81.01 ± 4.22 b | −89.34 ± 3.99 b | |
| S.No | Metabolites | Formula | Mol. Wt (g/mol) | Fold Change | VIP Score | Sub-Class | Functional Role | ||
|---|---|---|---|---|---|---|---|---|---|
| 16A/16-3B | 16A/12-2B | 16-3B/12-2B | |||||||
| 1. | 1,5-Anhydrohexitol | C6H12O5 | 452.9 | 0.59258 | 0.69353 | 1.1704 | 0.91051 | Carbohydrates and carbohydrate conjugates | Anhydro sugar |
| 2. | Butanedioic acid | C4H6O4 | 118.09 | 1.096 | 0.84147 | 0.7678 | 0.87377 | Dicarboxylic acid and derivatives | Component of citric acid or TCA cycle |
| 3. | D-Lactose | C12H22O11 | 342.297 | 1.353 | 0.60546 | 3.1601 | 1.2004 | Carbohydrates and carbohydrate conjugates | Milk sugar |
| 4. | Methylamine | CH3NH2 | 31.1 | 1.2637 | 1.5831 | 1.2528 | 1.3284 | Amines | Endogenous product of amine catabolism |
| 5. | Myo-Inositol | C6H12O6 | 180.16 | 0.9054 | 0.79029 | 0.87287 | 1.2055 | Alcohols and polyols | Sugar alcohol |
| 6. | o-Xylene | C8H10 | 106.16 | 1.2936 | 1.481 | 1.1449 | 0.76457 | Xylenes | - |
| 7. | Palmitic Acid | C₁₆H3₂O₂ | 256.43 | 1.147 | 1.553 | 1.354 | 1.241 | Fatty acids and conjugates | First acid to be produced during fatty acid synthesis |
| 8. | Stearic acid | C18H36O2 | 284.48 | 1.038 | 1.2597 | 1.2136 | 0.99075 | Fatty acids and conjugates | Hydrophobic molecule |
| 9. | 10-Undecynoic acid | C11H18O2 | 184.27 | 1.7359 | 1.4583 | 0.84004 | 0.6498 | Fatty acid | Derivative of fatty acids |
| 10. | 2-Propenoic acid | C3H4O2 | 72.06 | 1.2727 | 0.88683 | 0.69682 | 0.52002 | Carboxylic acid and derivatives | Derivative of fatty acids |
| 11. | alpha-Mannobiose | C14H26O11 | 370.351 | 4.8394 | 0.94472 | 0.19521 | 0.077973 | Carbohydrates and carbohydrate conjugates | Oligosaccharide |
| 12. | 2-Hydroxyethyl palmitate | C18H36O3 | 300.5 | 3.7207 | 4.506 | 1.2111 | 1.5007 | Fatty acid derivative | Product of fat synthesis |
| 13. | 1-Monopalmitin | C19H38O4 | 330.5 | 0.95744 | 0.71993 | 0.75193 | 0.45036 | Monoradylglycerols | Product from diacylglycerol |
| 14. | β-D-Galactofuranos e | C6H12O6 | 180.16 | 1.3007 | 1.4337 | 1.1022 | 1.034 | Carbohydrates and carbohydrate conjugates | Sugar derivative |
| 15. | Glycerol | C3H8O3 | 92.09 | 2.8331 | 3.3826 | 1.194 | 1.5024 | Carbohydrates and carbohydrate conjugates | Backbone of fatty acids |
| D- Lactose | Stearic Acid | 1,5 Anhydro | Lactose | Myo-Inositol | o-Xylene | 10- Undecy noic Acid | Methyl Aminee | Palmitic Acid | Beta-D-Galact Ofura | 2- Hydroxy ethyl Pal | Glycerol | 1-Mono Palmitin | Butane Dioic Acid | 2- Propenoic Acid | Alpha-Mannobiose | |
|---|---|---|---|---|---|---|---|---|---|---|---|---|---|---|---|---|
| D-Lactose | 1 | 0.75168 | 0.07639 | −0.031 | −0.1213 | 0.48169 | 0.19521 | 0.42566 | 0.39513 | −0.1085 | 0.09118 | 0.0538 | −0.6588 | −0.2321 | −0.3408 | −0.31037 |
| Stearic acid | 0.75168 | 1 | 0.37392 | 0.21962 | 0.22189 | 0.76188 | −0.1022 | 0.13593 | 0.08024 | −0.4366 | −0.27 | −0.1596 | −0.8761 | −0.2609 | −0.5908 | −0.52537 |
| 1,5- Anhydrohexitol | 0.07639 | 0.37392 | 1 | 0.59022 | 0.27807 | 0.04084 | −0.2248 | 0.02865 | 0.07439 | −0.4661 | −0.5267 | −0.7046 | −0.2768 | 0.06758 | −0.3248 | −0.5471 |
| Lactose | −0.031 | 0.21962 | 0.59022 | 1 | 0.26084 | 0.27779 | −0.7222 | −0.3825 | −0.265 | 0.06454 | −0.4055 | −0.2817 | 0.19369 | −0.6976 | −0.7986 | −0.92124 |
| Myo-Inositol | −0.1213 | 0.22189 | 0.27807 | 0.26084 | 1 | 0.55939 | −0.7575 | −0.8291 | −0.8372 | −0.7708 | −0.9547 | −0.7632 | −0.0554 | 0.07823 | −0.2629 | −0.18168 |
| o-Xylene | 0.48169 | 0.76188 | 0.04084 | 0.27779 | 0.55939 | 1 | −0.5196 | −0.3995 | −0.4088 | −0.4446 | −0.489 | −0.1469 | −0.5208 | −0.4485 | −0.6627 | −0.50164 |
| 10-Undecynoic acid | 0.19521 | −0.1022 | −0.2248 | −0.7222 | −0.7575 | −0.5196 | 1 | 0.89438 | 0.81677 | 0.24255 | 0.73453 | 0.4455 | −0.2896 | 0.51012 | 0.63099 | 0.59806 |
| Methylaminee | 0.42566 | 0.13593 | 0.02865 | −0.3825 | −0.8291 | −0.3995 | 0.89438 | 1 | 0.96509 | 0.30407 | 0.71381 | 0.41499 | −0.3892 | 0.22563 | 0.30752 | 0.18991 |
| Palmitic Acid | 0.39513 | 0.08024 | 0.07439 | −0.265 | −0.8372 | −0.4088 | 0.81677 | 0.96509 | 1 | 0.36331 | 0.70406 | 0.39704 | −0.3048 | 0.14912 | 0.29835 | 0.097855 |
| beta-D- Galactofura | −0.1085 | −0.4366 | −0.4661 | 0.06454 | −0.7708 | −0.4446 | 0.24255 | 0.30407 | 0.36331 | 1 | 0.81536 | 0.8149 | 0.50043 | −0.49 | −0.0051 | −0.012963 |
| 2-Hydroxyethyl pal | 0.09118 | −0.27 | −0.5267 | −0.4055 | −0.9547 | −0.489 | 0.73453 | 0.71381 | 0.70406 | 0.81536 | 1 | 0.8872 | 0.08705 | −0.0894 | 0.32192 | 0.32654 |
| Glycerol | 0.0538 | −0.1596 | −0.7046 | −0.2817 | −0.7632 | −0.1469 | 0.4455 | 0.41499 | 0.39704 | 0.8149 | 0.8872 | 1 | 0.09913 | −0.3762 | 0.04984 | 0.17656 |
| 1- Monopalmitin | −0.6588 | −0.8761 | 0.2768 | 0.19369 | −0.0554 | −0.5208 | −0.2896 | −0.3892 | −0.3048 | 0.50043 | 0.08705 | 0.09913 | 1 | −0.1595 | 0.15038 | 0.11225 |
| Butanedioic acid | −0.2321 | −0.2609 | 0.06758 | −0.6976 | 0.07823 | −0.4485 | 0.51012 | 0.22563 | 0.14912 | −0.49 | −0.0894 | −0.3762 | −0.1595 | 1 | 0.83644 | 0.77134 |
| 2-Propenoic acid | −0.3408 | −0.5908 | −0.3248 | −0.7986 | −0.269 | −0.6627 | 0.63099 | 0.30752 | 0.29835 | −0.0051 | 0.32192 | 0.04984 | 0.15038 | 0.83644 | 1 | 0.91011 |
| alpha- Mannobiose | −0.3104 | −0.5254 | −0.5471 | −0.9212 | −0.1817 | −0.5016 | 0.59806 | 0.18991 | 0.09786 | −0.013 | 0.32654 | 0.17656 | 0.11225 | 0.77134 | 0.91011 | 1 |
| Metabolites | Area | Firmness (g) | R2 |
|---|---|---|---|
| Myo-Inositol | 34,86,324 | 69.19 | 0.947 |
| Methylamine | 22,42,236 | 69.19 | 0.669 |
| alpha-Mannobiose | 15,81,955 | 69.19 | 0.546 |
| 10-Undecynoic acid | 62,231 | 69.19 | 0.264 |
| 2-Hydroxyethyl palmitate | 4,84,350 | 69.19 | 0.166 |
| Lactose | 19,98,913 | 69.19 | 0.015 |
Disclaimer/Publisher’s Note: The statements, opinions and data contained in all publications are solely those of the individual author(s) and contributor(s) and not of MDPI and/or the editor(s). MDPI and/or the editor(s) disclaim responsibility for any injury to people or property resulting from any ideas, methods, instructions or products referred to in the content. |
© 2024 by the authors. Licensee MDPI, Basel, Switzerland. This article is an open access article distributed under the terms and conditions of the Creative Commons Attribution (CC BY) license (https://creativecommons.org/licenses/by/4.0/).
Share and Cite
Rehman, H.; Saipriya, K.; Singh, A.K.; Singh, R.; Meena, G.S.; Khetra, Y.; Sharma, H. A Metabolomics Approach to Establish the Relationship between the Techno-Functional Properties and Metabolome of Indian Goat Yoghurt. Foods 2024, 13, 913. https://doi.org/10.3390/foods13060913
Rehman H, Saipriya K, Singh AK, Singh R, Meena GS, Khetra Y, Sharma H. A Metabolomics Approach to Establish the Relationship between the Techno-Functional Properties and Metabolome of Indian Goat Yoghurt. Foods. 2024; 13(6):913. https://doi.org/10.3390/foods13060913
Chicago/Turabian StyleRehman, Hameedur, Kanchanpally Saipriya, Ashish Kumar Singh, Richa Singh, Ganga Sahay Meena, Yogesh Khetra, and Heena Sharma. 2024. "A Metabolomics Approach to Establish the Relationship between the Techno-Functional Properties and Metabolome of Indian Goat Yoghurt" Foods 13, no. 6: 913. https://doi.org/10.3390/foods13060913
APA StyleRehman, H., Saipriya, K., Singh, A. K., Singh, R., Meena, G. S., Khetra, Y., & Sharma, H. (2024). A Metabolomics Approach to Establish the Relationship between the Techno-Functional Properties and Metabolome of Indian Goat Yoghurt. Foods, 13(6), 913. https://doi.org/10.3390/foods13060913