
Production Choices and Food Security: A Review of Studies Based on a Micro-Diversity Perspective


Abstract
1. Introduction
2. Methodology
3. Results and Discussion
3.1. Publication Trends
3.2. Most Influential Institutions
3.3. Most Influential Countries
3.4. Most Influential Journals
3.5. Most Influential Authors
3.6. Research Themes
3.6.1. Research Findings
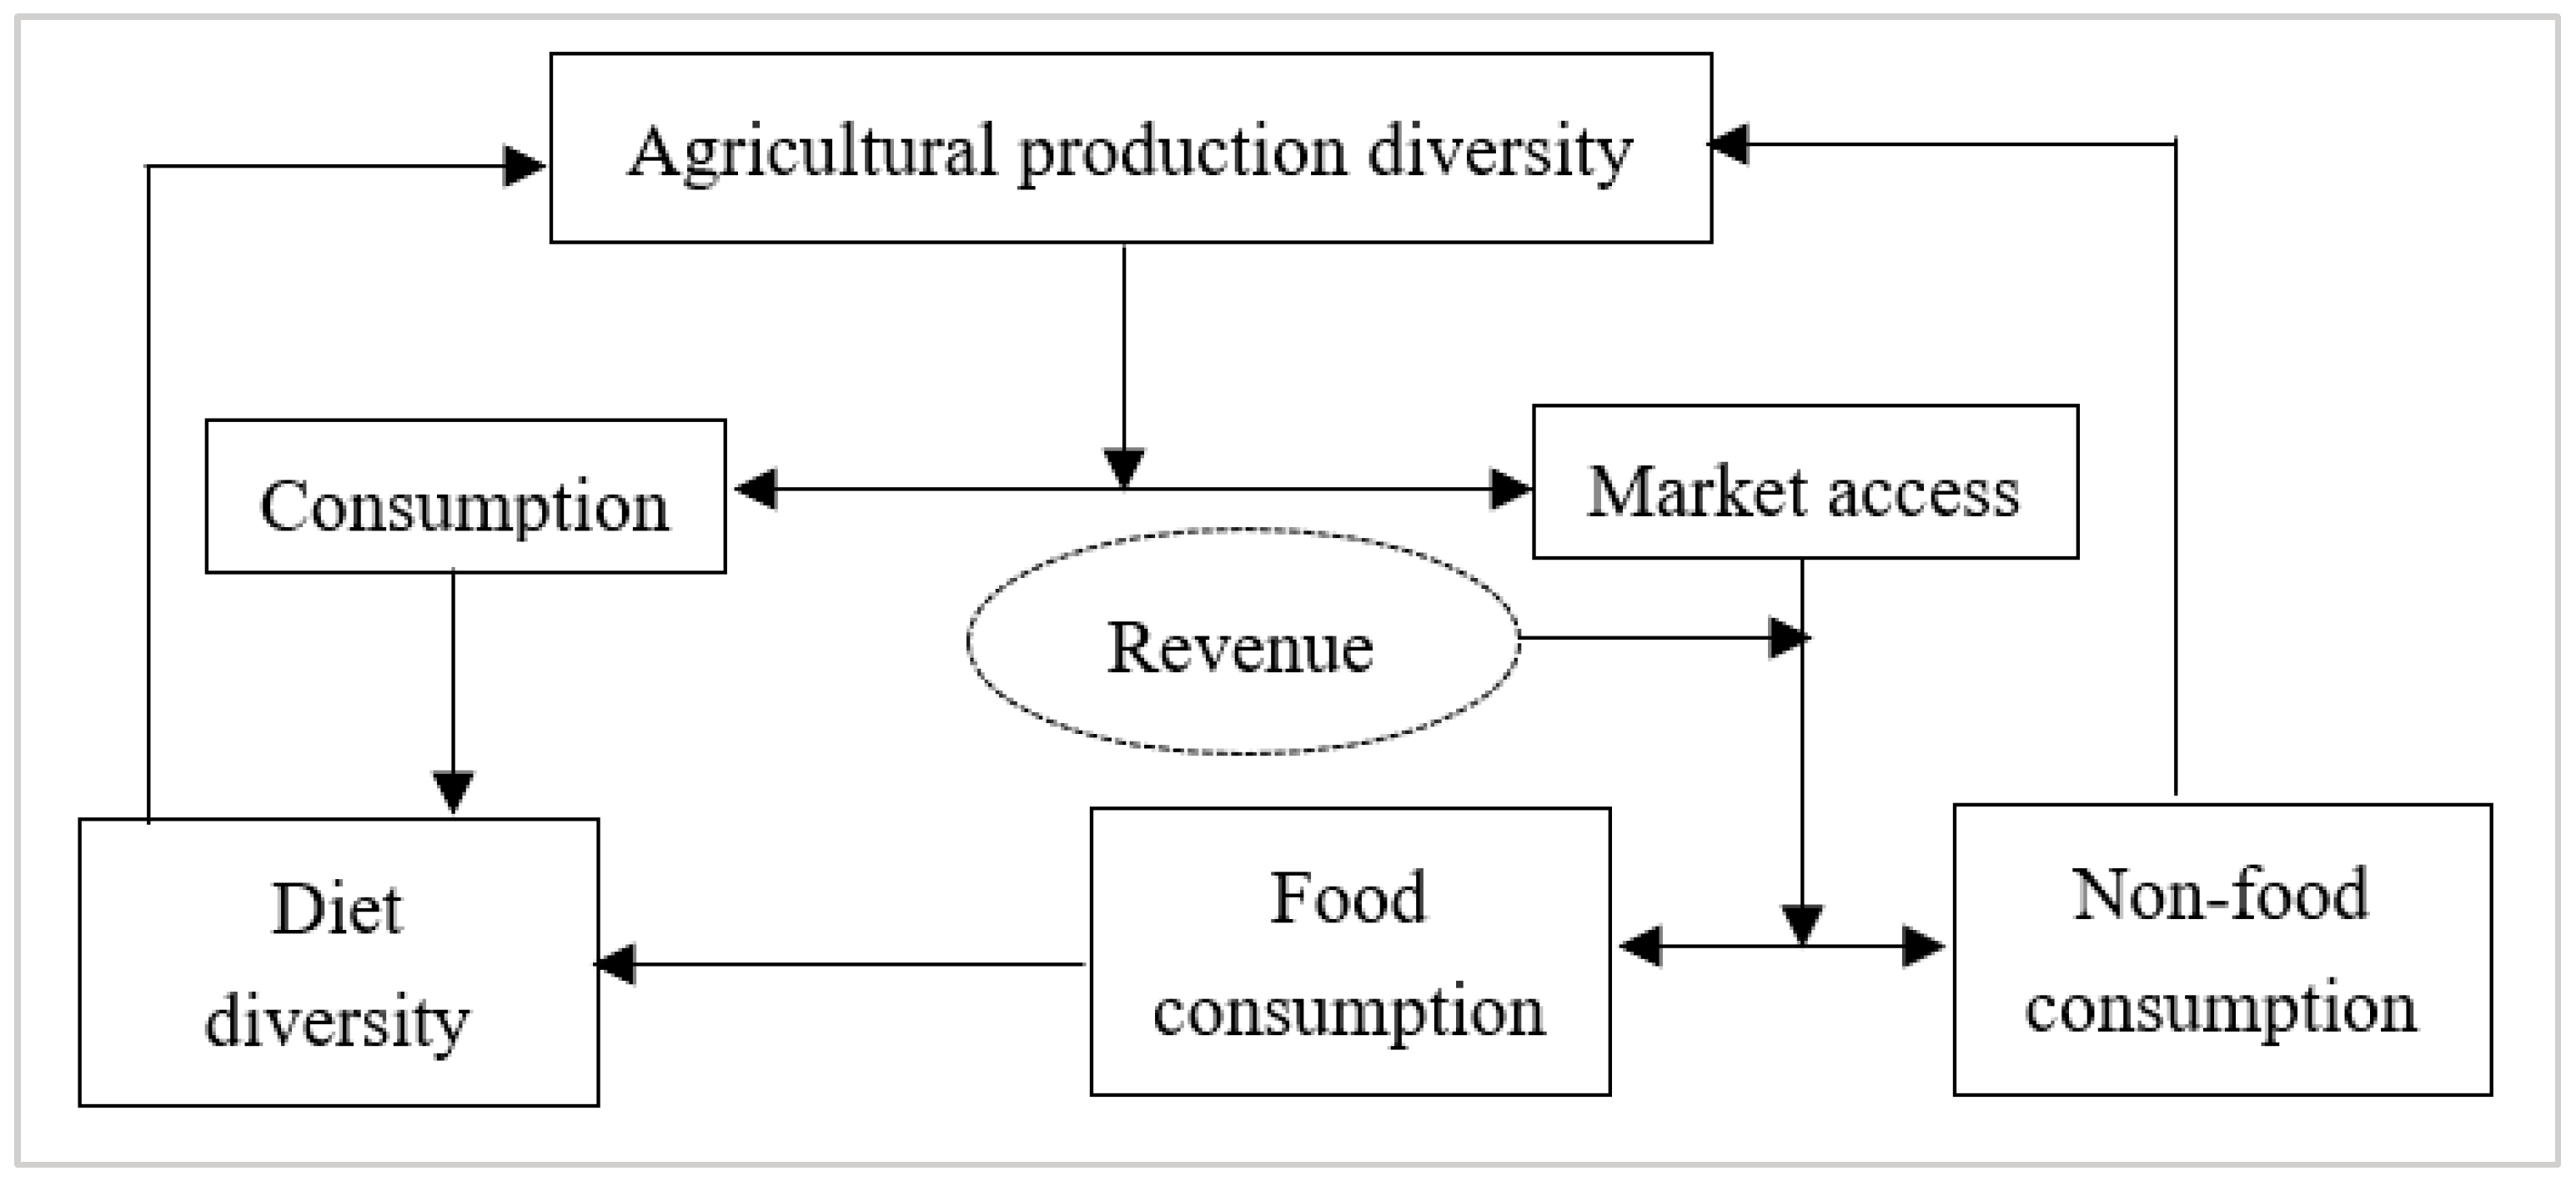
3.6.2. Impact Pathways
3.6.3. Approach to Measurement
- Food Group Production Diversity Score (FGPD). Crops grown and livestock raised by farmers were specifically categorized into nine major food groups: cereals, pulses, stems and tubers, vegetables, fruits, meat, fish, eggs, and milk, measured over one year, with the production diversity score increasing by one point for each added food group [12,14,15,17,23,28,34,37,42].
- Simpson Index (SI). The SI was initially applied in ecological studies to assess biodiversity levels and later in agricultural production studies to measure the enrichment and evenness of crop species [61]. The calculation method is as follows:
- Shannon–Wiener Diversity Index (SWDI). The SWDI is primarily used to measure the richness and evenness of crop species. The formula is as follows:
- Household Dietary Diversity Score (HDDS). The indicator is based on 24 h [14,23,27,29,30,37,39,40,47,50,51,52] or seven-day recall data [10,12,15,17,19,25,29,55] by weighting the consumption of the 12 major food groups (cereals, stems and tubers, vegetables, fruits, meat, eggs, fish and other aquatic products, milk, legumes and nuts, fats and oils, sugars, and condiments). The calculation formula is as follows:
- Individual Dietary Diversity Score (IDDS). The IDDS is calculated similarly to the HDDS [49,51], with the difference of re-categorizing the food groups according to populations such as women and children. Specifically, the Women’s Dietary Diversity Score (WDDS), a specialized indicator for evaluating women’s dietary diversity, classifies food groups into cereals, legumes, nuts, dairy, meat, eggs, vitamin A-rich green leafy vegetables, other vitamin A-rich vegetables and fruits, other vegetables, and other fruits. Higher scores on the WDDS indicate a higher quality diet for women [13,19,32,42,47]. The CDDS is an indicator specifically designed to measure children’s dietary quality, only considering the seven major food groups, i.e., grains, stems, and tubers; legumes and nuts; dairy; meat; eggs; vitamin A-rich vegetables and fruits; and other vegetables and fruits. Thus, children’s dietary diversity scores range from 0 to 7 [13,18,19,32,43,44,53].
4. Conclusions
Author Contributions
Funding
Institutional Review Board Statement
Informed Consent Statement
Data Availability Statement
Conflicts of Interest
References
- Khoury, C.K.; Bjorkman, A.D.; Dempewolf, H.; Ramirez-Villegas, J.; Guarino, L.; Jarvis, A.; Rieseberg, L.H.; Struik, P.C. Increasing Homogeneity in Global Food Supplies and the Implications for Food Security. Proc. Natl. Acad. Sci. USA 2014, 111, 4001–4006. [Google Scholar] [CrossRef]
- FAO, I. The State of Food Security and Nutrition in the World 2021; FAO: Rome, Italy, 2021. [Google Scholar]
- IFPRI. Global Nutrition Report; IFPRI: Washington, DC, USA, 2017. [Google Scholar]
- Headey, D.; Ecker, O. Rethinking the Measurement of Food Security: From First Principles to Best Practice. Food Secur. 2013, 5, 327–343. [Google Scholar] [CrossRef]
- FAO. The State of Food and Agriculture: Innovation in Family Farming; FAO: Rome, Italy, 2014. [Google Scholar]
- Frelat, R.; Lopez-Ridaura, S.; Giller, K.E.; Herrero, M.; Douxchamps, S.; Djurfeldt, A.A.; Erenstein, O.; Henderson, B.; Kassie, M.; Paul, B.K.; et al. Drivers of Household Food Availability in Sub-Saharan Africa Based on Big Data from Small Farms. Proc. Natl. Acad. Sci. USA 2016, 113, 458–463. [Google Scholar] [CrossRef]
- Qaim, M. Globalisation of Agrifood Systems and Sustainable Nutrition. Proc. Nutr. Soc. 2017, 76, 12–21. [Google Scholar] [CrossRef]
- Fanzo, J.; Hunter, D.; Borelli, T.; Mattei, F. Diversifying Food and Diets: Using Agricultural Biodiversity to Improve Nutrition and Health; Routledge: London, UK, 2013; ISBN 1-136-46146-9. [Google Scholar]
- Jones, A.D. On-Farm Crop Species Richness Is Associated with Household Diet Diversity and Quality in Subsistence-and Market-Oriented Farming Households in Malawi. J. Nutr. 2017, 147, 86–96. [Google Scholar] [CrossRef]
- Argaw, T.L.; Phimister, E.; Roberts, D. From Farm to Kitchen: How Gender Affects Production Diversity and the Dietary Intake of Farm Households in Ethiopia. J. Agric. Econ. 2021, 72, 268–292. [Google Scholar] [CrossRef]
- Ahmadzai, H.; Morrissey, O. Crop Diversification Increased Household Welfare in Afghanistan (2011–2017); Centre for Research in Economic Development and International Trade: Nottingham, UK, 2023. [Google Scholar]
- Mastura, T.; Begum, I.A.; Kishore, A.; Jackson, T.; Woodhill, J.; Chatterjee, K.; Alam, M.J. Diversified Agriculture Leads to Diversified Diets: Panel Data Evidence from Bangladesh. Front. Sustain. Food Syst. 2023, 7, 1044105. [Google Scholar] [CrossRef]
- Alam, M.J.; Begum, I.A.; Mastura, T.; Kishore, A.; Woodhill, J.; Chatterjee, K.; Jackson, T. Agricultural Diversification and Intra-Household Dietary Diversity: Panel Data Analysis of Farm Households in Bangladesh. PLoS ONE 2023, 18, e0287321. [Google Scholar] [CrossRef]
- Khandoker, S.; Singh, A.; Srivastava, S.K. Leveraging Farm Production Diversity for Dietary Diversity: Evidence from National Level Panel Data. Agric. Food Econ. 2022, 10, 15. [Google Scholar] [CrossRef]
- Azzarri, C.; Haile, B.; Letta, M. Plant Different, Eat Different? Insights from Participatory Agricultural Research. PLoS ONE 2022, 17, e0265947. [Google Scholar] [CrossRef]
- Obisesan, A.; Awolala, D. Crop Diversification, Productivity and Dietary Diversity: A Gender Perspective. Rev. Agric. Appl. Econ. (RAAE) 2021, 24, 98–108. [Google Scholar] [CrossRef]
- Mehraban, N.; Ickowitz, A. Dietary Diversity of Rural Indonesian Households Declines over Time with Agricultural Production Diversity Even as Incomes Rise. Glob. Food Secur. 2021, 28, 100502. [Google Scholar] [CrossRef]
- Gupta, S.; Sunder, N.; Pingali, P.L. Market Access, Production Diversity, and Diet Diversity: Evidence from India. Food Nutr. Bull. 2020, 41, 167–185. [Google Scholar] [CrossRef]
- Muthini, D.; Nzuma, J.; Nyikal, R. Farm Production Diversity and Its Association with Dietary Diversity in Kenya. Food Secur. 2020, 12, 1107–1120. [Google Scholar] [CrossRef]
- Chalmers, K. Mulwa, Martine Visser. Farm diversification as an adaptation strategy to climatic shocks and implications for food security in northern Namibia. World Dev. 2020, 129, 104906. [Google Scholar] [CrossRef]
- Baye, K.; Hirvonen, K.; Dereje, M.; Remans, R. Energy and Nutrient Production in Ethiopia, 2011-2015: Implications to Supporting Healthy Diets and Food Systems. PLoS ONE 2019, 14, e0213182. [Google Scholar] [CrossRef]
- Gondwe, T.M.; Alamu, E.O.; Musonda, M.; Geresomo, N.; Maziya-Dixon, B. The Relationship between Training Farmers in Agronomic Practices and Diet Diversification: A Case Study from an Intervention under the Scaling Up Nutrition Programme in Zambia. Agric. Food Secur. 2017, 6, 72. [Google Scholar] [CrossRef]
- Dillon, A.; McGee, K.; Oseni, G. Agricultural Production, Dietary Diversity and Climate Variability. J. Dev. Stud. 2015, 51, 976–995. [Google Scholar] [CrossRef]
- Romeo, A.; Meerman, J.; Demeke, M.; Scognamillo, A.; Asfaw, S. Linking Farm Diversification to Household Diet Diversification: Evidence from a Sample of Kenyan Ultra-Poor Farmers. Food Secur. 2016, 8, 1069–1085. [Google Scholar] [CrossRef]
- Snapp, S.S.; Fisher, M. “Filling the Maize Basket” Supports Crop Diversity and Quality of Household Diet in Malawi. Food Secur. 2015, 7, 83–96. [Google Scholar] [CrossRef]
- Pellegrini, L.; Tasciotti, L. Crop Diversification, Dietary Diversity and Agricultural Income: Empirical Evidence from Eight Developing Countries. Can. J. Dev. Stud./Rev. Can. D’études Du Développement 2014, 35, 211–227. [Google Scholar] [CrossRef]
- Cleghorn, C.L. Relationships between Agrobiodiversity, Dietary Diversity and Nutritional Status in Tanzania. Ph.D. Thesis, University of Leeds, Leeds, UK, 2014. [Google Scholar]
- Sibhatu, K.T.; Qaim, M. Farm Production Diversity and Dietary Quality: Linkages and Measurement Issues. Food Secur. 2018, 10, 47–59. [Google Scholar] [CrossRef]
- Kuntashula, E.; Mwelwa-Zgambo, L. Impact of the Farmer Input Support Policy on Agricultural Production Diversity and Dietary Diversity in Zambia. Food Policy 2022, 113, 102329. [Google Scholar] [CrossRef]
- Uddin, M.R. Crop Diversification, Dietary Diversity and Nutrition: Evidence from Rural Bangladesh. Bangladesh Dev. Stud. 2019, 42, 111–133. [Google Scholar] [CrossRef]
- Luna-González, D.V.; Sørensen, M. Higher Agrobiodiversity Is Associated with Improved Dietary Diversity, but Not Child Anthropometric Status, of Mayan Achí People of Guatemala. Public Health Nutr. 2018, 21, 2128–2141. [Google Scholar] [CrossRef] [PubMed]
- Somé, J.W.; Jones, A.D. The Influence of Crop Production and Socioeconomic Factors on Seasonal Household Dietary Diversity in Burkina Faso. PLoS ONE 2018, 13, e0195685. [Google Scholar] [CrossRef] [PubMed]
- Rajendran, S.; Afari-Sefa, V.; Shee, A.; Bocher, T.; Bekunda, M.; Dominick, I.; Lukumay, P.J. Does Crop Diversity Contribute to Dietary Diversity? Evidence from Integration of Vegetables into Maize-Based Farming Systems. Agric. Food Secur. 2017, 6, 50. [Google Scholar] [CrossRef]
- Sibhatu, K.T.; Krishna, V.V.; Qaim, M. Production Diversity and Dietary Diversity in Smallholder Farm Households. Proc. Natl. Acad. Sci. USA 2015, 112, 10657–10662. [Google Scholar] [CrossRef]
- Palomo, J.; Figueroa-Domecq, C.; Laguna, P. Women, Peace and Security State-of-Art: A Bibliometric Analysis in Social Sciences Based on SCOPUS Database. Scientometrics 2017, 113, 123–148. [Google Scholar] [CrossRef]
- Fetscherin, M.; Heinrich, D. Consumer Brand Relationships Research: A Bibliometric Citation Meta-Analysis. J. Bus. Res. 2015, 68, 380–390. [Google Scholar] [CrossRef]
- Tacconi, F.; Waha, K.; Ojeda, J.J.; Leith, P.; Mohammed, C.; Venables, W.N.; Rana, J.C.; Bhardwaj, R.; Yadav, R.; Ahlawat, S.P.; et al. Farm Diversification Strategies, Dietary Diversity and Farm Size: Results from a Cross-Country Sample in South and Southeast Asia. Glob. Food Secur. 2023, 38, 100706. [Google Scholar] [CrossRef]
- Yun, C.; Kim, T. The Effect of Agricultural Production Diversification on Dietary Diversity: A Case Study of Cambodia. J. Rural Dev. 2023, 46, 45–70. [Google Scholar]
- Fatch, P.; Masangano, C.; Jordan, I.; Hilger, T.; Kalimbira, A.; Glas, M.G.; Roehlig, A.; Chiutsi-Phiri, G.; Kamoto, J.F.M.; Mambo, I.; et al. Agricultural Diversity Linkage to Income, Wealth, Diets and Nutrition: Case of Lilongwe District in Malawi. Sci. Afr. 2023, 19, e01569. [Google Scholar] [CrossRef]
- Hlatshwayo, S.I.; Ngidi, M.S.C.; Ojo, T.O.; Modi, A.T.; Mabhaudhi, T.; Slotow, R. The Determinants of Crop Productivity and Its Effect on Food and Nutrition Security in Rural Communities of South Africa. Front. Sustain. Food Syst. 2023, 7, 1091333. [Google Scholar] [CrossRef] [PubMed]
- Bernzen, A.; Mangnus, E.; Sohns, F. Diversify, Produce or Buy? An Analysis of Factors Contributing to Household Dietary Diversity among Shrimp and Non-Shrimp Farmers in Coastal Bangladesh. Food Secur. 2022, 14, 741–761. [Google Scholar] [CrossRef] [PubMed]
- Lourme-Ruiz, A.; Dury, S.; Martin-Prével, Y. Linkages between Dietary Diversity and Indicators of Agricultural Biodiversity in Burkina Faso. Food Secur. 2021, 13, 329–349. [Google Scholar] [CrossRef]
- Esaryk, E.E.; Reynolds, S.A.; Fernald, L.C.; Jones, A.D. Crop Diversity Is Associated with Higher Child Diet Diversity in Ethiopia, Particularly among Low-Income Households, but Not in Vietnam. Public Health Nutr. 2021, 24, 5857–5868. [Google Scholar] [CrossRef] [PubMed]
- Singh, S.; Jones, A.D.; DeFries, R.S.; Jain, M. The Association between Crop and Income Diversity and Farmer Intra-Household Dietary Diversity in India. Food Secur. 2020, 12, 369–390. [Google Scholar] [CrossRef]
- De Pinto, A.; Seymour, G.; Bryan, E.; Bhandary, P. Women’s Empowerment and Crop Diversification in Bangladesh: A Possible Pathway to Climate Change Adaptation and Better Nutrition; The International Food Policy Research Institute: Washington, DC, USA, 2019; Volume 1849. [Google Scholar]
- Mango, N.; Makate, C.; Mapemba, L.; Sopo, M. The Role of Crop Diversification in Improving Household Food Security in Central Malawi. Agric. Food Secur. 2018, 7, 7. [Google Scholar] [CrossRef]
- Islam, A.H.M.d.S.; von Braun, J.; Thorne-Lyman, A.L.; Ahmed, A.U. Farm Diversification and Food and Nutrition Security in Bangladesh: Empirical Evidence from Nationally Representative Household Panel Data. Food Secur. 2018, 10, 701–720. [Google Scholar] [CrossRef]
- Sibhatu, K.T.; Qaim, M. Rural Food Security, Subsistence Agriculture, and Seasonality. PLoS ONE 2017, 12, e0186406. [Google Scholar] [CrossRef]
- Rosenberg, A.M.; Maluccio, J.A.; Harris, J.; Mwanamwenge, M.; Nguyen, P.H.; Tembo, G.; Rawat, R. Nutrition-Sensitive Agricultural Interventions, Agricultural Diversity, Food Access and Child Dietary Diversity: Evidence from Rural Zambia. Food Policy 2018, 80, 10–23. [Google Scholar] [CrossRef]
- Kennedy, G.; Stoian, D.; Hunter, D.; Kikulwe, E.M.; Termote, C.; Alders, R.G.; Burlingame, B.; Jamnadass, R.H.; McMullin, S.; Thilsted, S.H. Food Biodiversity for Healthy, Diverse Diets; Bioversity International: Rome, Italy, 2017; pp. 23–52. [Google Scholar]
- Chinnadurai, M.; Karunakaran, K.R.; Chandrasekaran, M.; Balasubramanian, R.; Umanath, M. Examining Linkage between Dietary Pattern and Crop Diversification: An Evidence from Tamil Nadu. Agric. Econ. Res. Rev. 2016, 29, 149–160. [Google Scholar] [CrossRef]
- Kavitha, K.; Soumitra, P.; Padmaja, R. Understanding the Linkages between Crop Diversity and Household Dietary Diversity in the Semi-Arid Regions of India. Agric. Econ. Res. Rev. 2016, 29, 129–137. [Google Scholar] [CrossRef]
- Argyropoulou, S.E. The Association between the Diversity of Crop Production and Nutritional Indicators of Rural Households in Northern Ghana. Ph.D. Thesis, Wageningen University, Wageningen, The Netherlands, 2016. [Google Scholar]
- Goshu, D.; Kassa, B.; Ketema, M. Does crop diversification enhance household food security Evidence from rural Ethiopia. Advances in Agriculture. Sciences and Engineering Research 2012, 2, 503–515. [Google Scholar]
- Ekesa, B.N.; Walingo, M.K.; Onyango, M.O. Accesibility to and Consumption of Indigenous Vegetables and Fruits by Rural Households in Matungu Division, Western Kenya. Afr. J. Food Agric. Nutr. Dev. 2009, 9, 1–14. [Google Scholar] [CrossRef]
- Verma, M.R.; Datta, K.K.; Mandal, S.; Tripathi, A.K. Diversification of Food Production and Consumption Patterns in India. J. Agric. Food Inf. 2007, 8, 87–100. [Google Scholar] [CrossRef]
- Kim, S.S.; Nguyen, P.H.; Tran, L.M.; Sanghvi, T.; Mahmud, Z.; Haque, M.R.; Afsana, K.; Frongillo, E.A.; Ruel, M.T.; Menon, P. Large-Scale Social and Behavior Change Communication Interventions Have Sustained Impacts on Infant and Young Child Feeding Knowledge and Practices: Results of a 2-Year Follow-up Study in Bangladesh. J. Nutr. 2018, 148, 1605–1614. [Google Scholar] [CrossRef]
- Jones, A.D.; Shrinivas, A.; Bezner-Kerr, R. Farm Production Diversity Is Associated with Greater Household Dietary Diversity in Malawi: Findings from Nationally Representative Data. Food Policy 2014, 46, 1–12. [Google Scholar] [CrossRef]
- Sekabira, H.; Nalunga, S.; Umwungerimwiza, Y.D.; Nazziwa, L.; Ddungu, S.P. Household Farm Production Diversity and Micronutrient Intake: Where Are the Linkages? Panel Data Evidence from Uganda. Sustainability 2021, 13, 4041. [Google Scholar] [CrossRef]
- Kim, S.S.; Roopnaraine, T.; Nguyen, P.H.; Saha, K.K.; Bhuiyan, M.I.; Menon, P. Factors Influencing the Uptake of a Mass Media Intervention to Improve Child Feeding in Bangladesh. Matern. Child Nutr. 2018, 14, e12603. [Google Scholar] [CrossRef] [PubMed]
- Simpson, E.H. Measurement of Diversity. Nature 1949, 163, 688. [Google Scholar] [CrossRef]


| Institutions | PAPD&DD | TC | TC/P |
|---|---|---|---|
| CGIAR | 9 | 217 | 24.11 |
| IFPRI | 6 | 106 | 17.67 |
| UG | 4 | 694 | 173.5 |
| BAUB | 3 | 46 | 15.33 |
| UM | 3 | 47 | 15.67 |
| Rank | Journal | Label | PAPD&DD | TC | TC/P | H-Index | TC/t |
|---|---|---|---|---|---|---|---|
| 1 | Food Security | FS | 8 | 328 | 41 | 7 | 17.26 |
| 2 | PloS One | PO | 4 | 51 | 12.75 | 3 | 2.68 |
| 3 | Agriculture and Food Security | AFS | 3 | 102 | 34 | 3 | 5.37 |
| 4 | Food Policy | FP | 3 | 230 | 76.67 | 2 | 12.11 |
| 5 | Agricultural Economics Research Review | AERR | 2 | 34 | 17 | 2 | 1.79 |
| Rank | Author | PAPD&DD | TC | TC/P | Rank | Author | PAPD&DD | TC | TC/P |
|---|---|---|---|---|---|---|---|---|---|
| 1 | Jones A D | 3 | 47 | 15.67 | 1 | Sibhatu K T | 3 | 682 | 227.33 |
| 2 | Qaim M | 3 | 620 | 206.67 | 2 | Qaim M | 3 | 620 | 206.67 |
| 3 | Sibhatu K T | 3 | 682 | 227.33 | 3 | Krishna V V | 1 | 367 | 367 |
| 4 | Alam M J | 2 | 0 | / | 4 | Pellegrini L | 1 | 127 | 127 |
| 5 | Begum I A | 2 | 0 | / | 5 | Tasciotti L | 1 | 127 | 127 |
| Rank | Keyword | Occurrences | Total Link Strength |
|---|---|---|---|
| 1 | Dietary diversity | 39 | 46 |
| 2 | Household | 35 | 46 |
| 3 | Effect | 29 | 46 |
| 4 | Diet | 26 | 46 |
| 5 | Crop | 25 | 46 |
| 6 | Study | 24 | 46 |
| 7 | Production | 22 | 46 |
| 8 | Data | 22 | 46 |
| 9 | Diversity | 22 | 46 |
| 10 | Food | 21 | 46 |
| Original Study Reference | County | Sample Size | Data Type | Measures of Dietary Diversity | Measures of Agricultural Production Diversity | Summary Findings |
|---|---|---|---|---|---|---|
| Tacconi et al. (2023) [37] | South and Southeast Asia | 4772 HH | HS | HDDS (24 h recall) | FGPD | Environmental and climate variables significantly influence farm diversification. Positive association between farm diversification, market orientation, off-farm income generation, HDDS, and WDDS. The impact of farm diversification on HDDS was found to be more pronounced among smaller farms, while diminishing on larger farms. |
| Chanmi et al. (2023) [38] | Cambodia | 6736 HH | HS | FCS | SI | Farm production diversification can positively affect the diversity of household diets. Market access moderating the effect of agricultural production diversification on household dietary diversity. |
| Fatch et al. (2023) [39] | Malawi | 424 HH | HS | HDDS (24 h recall) | PCA | Positive association between agricultural diversity and dietary diversity (WDDS, CDDS, and MDDS); No significant association between agricultural diversity and the nutritional status of children, women, and men. |
| Hlatshwayo et al. (2023) [40] | South Africa | 1520 HH | NR | HDDS (24 h recall) HFIAS | CC | Ownership of livestock, harvest, and disability within the family had a negative impact on the food security status of smallholder farmers. Household size has a positive effect on food security and nutrition status. Social grants, agricultural assistance, and harvest have a detrimental impact on nutritional status. |
| Ahmadzai et al. (2023) [11] | Afghanistan | 28,071 HH | NR | HFCS | CC | There is a positive relationship between crop diversification and household consumption as well as dietary diversity. |
| Mastura et al. (2023) [12] | Bangladesh | 6503 HH | HS | HDDS (day recall) HFVS | FGPD; PDS | Positive association between agricultural production diversification and household dietary diversity. Negative association between market access and household dietary diversity. Positive association between participation in non-farming activities and dietary diversity. |
| Alam et al. (2023) [13] | Bangladesh | 6503 HH | HS | MDDS, WDDS, CDDS (24 h recall) | CC | The diversification of agricultural production can promote dietary variety across all life stages of farm household members. Agricultural production diversification significantly and positively influences Minimum Dietary Diversity Score (MDDS), Women’s Dietary Diversity Score (WDDS), and Child Dietary Diversity Score (CDDS). |
| Khandoker et al. (2022) [14] | Bangladesh | 11,720 HH | HS | HDDS (24 h recall) FVS | SWDI; FGPD | Positive associations between farm production diversity, production diversity, income, and dietary diversity. |
| Kuntashula et al. (2022) [29] | Zambia | 7934 HH | NR | HDDS (24 h recall) | SI; CC; AID; HID | Positive association between Farmer Input Support Policy (FISP) and production diversity. Positive association between FISP and household dietary diversity. Mixed results between FISP and monthly food inadequacy. No significant association between production diversity and household dietary diversity. |
| Bernzen et al. (2022) [41] | Bangladesh | 1188 HH | HS | FCS | CC | Households cultivating shrimp have a significantly higher dietary diversity than households that do not. Positive association between crop diversification and shrimp farmers’ dietary diversity. |
| Lourme-Ruiz et al. (2021) [42] | Burkina Faso | 579 HH | HS | WDDS (24 h recall) | CC; SI; FGPD; NFD | WDDS is positively associated with PDS and the number of agroforestry tree species. WDDS is negatively associated with cotton production when managed by male farm heads but positively when managed by women. |
| Esaryk et al. (2021) [43] | Vietnam Ethiopia | 1012 HH (Ethiopia) 1083 HH (Vietnam) | HS | CDDS (24 h recall) | CSR; CNFR | There is a small, positive association between household CNFR and CDDS in Ethiopia but not in Vietnam. The correlation between crop diversity and Child Dietary Diversity Score (CDDS) is most pronounced in impoverished households in Ethiopia and subsistence-oriented households in Vietnam. Agricultural earnings positively mediated the association between crop diversity and diet diversity in Ethiopia. |
| Azzarri et al. (2021) [15] | Malawi | 935 HH | HS | HDDS (7-day recall) | SWDI; FGPD | Production diversity has a significant positive treatment effect on dietary diversity. There is a positive correlation between agricultural income and dietary diversity. |
| Obisesan et al. (2021) [16] | Nigeria | 1226 HH | HS | HDDS (7-day recall) | CC | Crop diversification positively (p < 0.01) affects households’ dietary diversity. |
| Mehraban et al. (2021) [17] | Indonesian | 2785 HH | HS | HDDS (7-day recall) | FGPD (PD9, PD10, and PD12) | Positive relationships between production diversity and household dietary diversity, as well as between market access and household dietary diversity. Negative relationship between specialization and dietary quality during 2000–2015. |
| Gupta et al. (2020) [18] | India | 3600 HH | HS | HDDS, CDDS (7-day recall; 24 h recall) | CC | Positive relationship between food groups grown and diet diversity. On-farm production is significantly associated with improved dietary diversity scores. |
| Muthini et al. (2020) [19] | Kenya | 779 HH | HS | HDDS (7-day recall) CDDS, MDDS (24 h recall) | SI; CC | Farm production diversity is significantly associated with the dietary diversity of women and households. No association between farm production diversity and the dietary diversity of children. |
| Argaw et al. (2020) [10] | Ethiopia | 1236 FHH 5185 MHH | RS | FVS, HDDS (7-day recall) | SI | Positive relationships between gender, production diversity, and dietary diversity. Production diversity is the primary driver of dietary diversity. In terms of gender-based disparities in dietary diversity, the source of food—whether it originates from within the household’s production system or is acquired from the market—plays a crucial role. |
| Mulwa et al. (2020) [20] | Namibia | 650 HH | HS | DDS (24 h recall) | HI | Positive relationships between crop production diversification, livestock production diversification, and food security outcomes. |
| Singh et al. (2020) [44] | India | 1106 HH | HS | HDDS, WDDS, CDDS (24 h recall) | SI | Crop diversity has a positive association with dietary diversity among adults (both men and women); Positive relationship between crop diversity and dietary diversity among adolescents and children in Haryana. |
| Baye et al. (2019) [21] | Ethiopia | 40,000 HH | NR | NI | SWDI | Positive relationship between diets and diversifying production. |
| Uddin (2019) [30] | Bangladesh | 6503 HH | NR | HDDS, DDI (24 h recall) | RI; SI; EI | There is no notable correlation between crop diversification and dietary diversity. |
| Pinto et al. (2019) [45] | Bangladesh | 6500 HH | HS | HAZ, WHZ, WAZ | GSI | Positive association between women’s empowerment and crop diversity. Positive association between diversification and reducing climate risk and children’s nutritional status. |
| Mango et al. (2018) [46] | Malawi | 271 HH | HS | FCS, HFIAS | CDI | Positive association between crop diversification and household FCS. Negative association between crop diversification and HFIAS. |
| Islam et al. (2018) [47] | Bangladesh | 6715 HH 6071 WO | HS | HDDS, MDDS, FVS | CC; MSRI | Positive association between farm diversification and diet diversity. |
| Luna-González et al. (2018) [31] | Guatemala | 154 CH 127 MH | HS | CDDS (24 h recall) | CC; AC | Positive relationships between food self-sufficiency; nutritional, functional diversity, dietary diversity scores; and crop and animal species richness. The local market was negatively correlated with dietary diversity scores. No relationship between dietary diversity and child anthropometric status. Positive relationships between child anthropometric status, sanitary conditions, and maternal education. Negative relationship between household size and frequent child morbidity. |
| Sibhatu et al. (2018) [28] | 26 countries | 45 RA | LR | HDDS (different recall periods) | Different diversity methods | Positive correlations exist among food self-sufficiency, nutritional diversity, functional diversity, dietary diversity scores, as well as crop and animal species richness. No significant association between farm production diversity and smallholder diets and nutrition in around 40% of studies. |
| Sibhatu et al. (2018) [48] | Indonesia, Kenya, and Uganda | 672 HH (Indonesia) 393 HH (Kenya) 419 HH (Uganda) | HS | HDDS (7-day recall) | CC; FGPD | Production diversity measured by simple species count is positively associated with most dietary indicators. Production diversity measured by the number of food groups produced is insignificant and associated with dietary diversity. Diverse subsistence production often contributes less to dietary diversity than cash income from market sales. |
| Somé et al. (2018) [32] | Burkina Faso | 10,790 HH | RS | WDDS (7-day recall) | CC | Crop diversity cannot modify the seasonal differences in the diversity of household diets. |
| Rosenberg et al. (2018) [49] | Zambia | 131 SEAs | HS | IDDS (24 h recall) HHS, HFIAS | CC | No significant association between agricultural diversity and dietary diversity (children or their mothers). |
| Kennedy et al. (2017) [50] | Low-income countries | Multiple | RS | HDDS (24 h recall) | SDI | Production diversity is associated with improved diet diversity in most cases. Women play a pivotal role in two key pathways: (1) through the consumption of products derived from their own production or gathered from the wild; (2) through the purchase of biodiversity, whether wild or cultivated. |
| Gondwe et al. (2017) [22] | Zambia | 542 HH | HS | DDS (24 h recall) | CC | Positive relationship between crop production and household diets. |
| Rajendran et al. (2017) [33] | Tanzania | 300 HH | HS | DDS (24 h recall) FVS | SI | NO association between Simpson’s index and dietary diversity. Revenue generated from diversified crops is much more critical and significant to dietary diversity. |
| Chinnadurai et al. (2016) [51] | Tamil Nadu | 45 CR | RS | HDDS, IDDS (24 h recall) | HI | Positive association between crop diversification and dietary diversification. Negative association between vegetable diversification and diet diversification. |
| Kavitha et al. (2016) [52] | Telangana, Maharashtra | 289 HH | HS | HDDS (24 h recall) | CC; SI | Positive association between crop diversity and household dietary diversity at the bivariate level. No significant association between crop diversity and dietary diversity in the multiple linear regression model. |
| Argyropoulou et al. (2016) [53] | Ghana | 329 HH | CS | CDDS (24 h recall) | CC; SI | No significant association between crop diversity and CDDS. No significant association between crop diversity and the nutritional status of children. SI is negatively associated with CDDS. |
| Sibhatu et al. (2015) [34] | Indonesia, Kenya, Ethiopia, and Malawi | 8230 HH | NR | DDS (24 h recall) FVS | CC; FGPD | In certain scenarios, production diversity shows a positive association with dietary diversity, though this relationship is not universal. Positive association between production diversity and dietary diversity turns to not significant or even negative because of foregone income benefits from specialization. The positive impact of market access on dietary diversity surpasses that of increased production diversity. |
| Dillon et al. (2015) [23] | Nigeria | 5000 HH | GHS-Panel | HDDS (24 h recall) | FGPD | Positive associations between crop diversity, agricultural revenue, and dietary diversity (CDDS). |
| Romeo et al. (2015) [24] | Kenya | 1353 HH | HS | HDDS (7-day recall) | SI; SWDI | Positive association between agricultural production practices and household food diversification. |
| Snapp et al. (2015) [25] | Malawi | 9189 HH | HS | HDDS, FCS (7-day recall) | CC | Positive association between crop diversity and dietary diversity. Positive association between education, income, market access, and dietary diversity. |
| Cleghorn (2014) [27] | Tanzania | 122 HH | HS | HDDS (24 h recall) | SWDI | No significant association between dietary diversity and nutritional status. Negative association between dietary diversity and height for age z-scores. No significant association between agrobiodiversity and dietary diversity. |
| Pellegrini et al. (2014) [26] | Eight developing Countries a | 800 HH | NR | Food (group) count | CC | Positive correlation between the number of crops cultivated, household income from crops, and dietary diversity. |
| Fanzo et al. (2013) [8] | Nepal Bangladesh | 741 MC | CS | Food count | CC | Positive correlation between agricultural production diversity and food security, dietary intake, and nutritional status. |
| Goshu et al. (2012) [54] | Ethiopia | 260 HH | HS | Food (group) count | CDI | No significant associations between crop diversification, food security, and dietary diversity status. |
| Ekesa et al. (2009) [55] | Kenya | 144 HH | HS | HDDS (7-day recall) | CC; AC | Positive association between agricultural biodiversity and dietary diversity (CDDS). |
| Verma et al. (2007) [56] | India | Urban and rural people | RS | CP | CC | Positive association between non-cereal commodities and diversified production. Positive association between diversification and producers’ income. Positive association between diversified food basket and food security. |
Disclaimer/Publisher’s Note: The statements, opinions and data contained in all publications are solely those of the individual author(s) and contributor(s) and not of MDPI and/or the editor(s). MDPI and/or the editor(s) disclaim responsibility for any injury to people or property resulting from any ideas, methods, instructions or products referred to in the content. |
© 2024 by the authors. Licensee MDPI, Basel, Switzerland. This article is an open access article distributed under the terms and conditions of the Creative Commons Attribution (CC BY) license (https://creativecommons.org/licenses/by/4.0/).
Share and Cite
Huang, Y.; Yang, Y.; Nie, F.; Jia, X. Production Choices and Food Security: A Review of Studies Based on a Micro-Diversity Perspective. Foods 2024, 13, 771. https://doi.org/10.3390/foods13050771
Huang Y, Yang Y, Nie F, Jia X. Production Choices and Food Security: A Review of Studies Based on a Micro-Diversity Perspective. Foods. 2024; 13(5):771. https://doi.org/10.3390/foods13050771
Chicago/Turabian StyleHuang, Yanfang, Yuying Yang, Fengying Nie, and Xiangping Jia. 2024. "Production Choices and Food Security: A Review of Studies Based on a Micro-Diversity Perspective" Foods 13, no. 5: 771. https://doi.org/10.3390/foods13050771
APA StyleHuang, Y., Yang, Y., Nie, F., & Jia, X. (2024). Production Choices and Food Security: A Review of Studies Based on a Micro-Diversity Perspective. Foods, 13(5), 771. https://doi.org/10.3390/foods13050771