Article

Chemometric Discrimination of Cichorium glandulosum Boiss. et Huet and Cichorium intybus L. via Their Metabolic Profiling, Antioxidative, and Hypoglycemic Activities

1
Jiangsu Key Laboratory of TCM Evaluation and Translation Research, School of Traditional Chinese Pharmacy, China Pharmaceutical University, Nanjing 211198, China
2
Department of Resources Science of Traditional Chinese Medicines, School of Traditional Chinese Pharmacy, China Pharmaceutical University, Nanjing 211198, China
3
Department of Natural Medicinal Chemistry, China Pharmaceutical University, Nanjing 211198, China
*
Authors to whom correspondence should be addressed.
These authors contributed equally to this work.
Foods 2023, 12(4), 901; https://doi.org/10.3390/foods12040901
Submission received: 17 January 2023 / Revised: 15 February 2023 / Accepted: 18 February 2023 / Published: 20 February 2023
(This article belongs to the Section Food Analytical Methods)

Abstract

:
Cichorium glandulosum Boiss. et Huet (CG) and Cichorium intybus L. (CI) are widely used as the main raw material of functional food with hepatoprotective and hypoglycemic effects. Due to the lack of comparison on the chemical ingredients and efficacy, they were often used imprecisely and interchangeably. It is necessary to distinguish between them. With the plant metabolomics based on high-performance liquid chromatography coupled with quadrupole time-of-flight mass spectrometry (HPLC-QTOF-MS) and multivariate chemometric techniques, the chemical ingredients were characterized and 59 compounds between CG and CI were classified. As for antioxidative and hypoglycemic activities in vitro, CI extraction exhibited better antioxidant activity than CG, while CG extraction showed stronger hypoglycemic activity. Furthermore, a bivariate correlation between the chemical composition and efficacy of the extract was also analyzed, and three differentially strong correlation components between CI and CG were prepared, and the antioxidative and hypoglycemic efficacies were compared in vivo and different active phenotypes were obtained. Finally, we revealed chemical and biological differences between CG and CI, providing a basis for achieving better quality control and developing more effective functional foods.

Graphical Abstract

1. Introduction

Cichorium glandulosum Boiss. et Huet (CG) and Cichorium intybus L. (CI) are perennial plants from the Cichorium genus, Asteraceae family. In China, these plant species were admitted to the Chinese Pharmacopoeia. The dry aerial part and root are collectively referred to as chicory and used for clearing liver and bile, stomach strengthening, digestion, and diuretic swelling [1]. They have also been wildly used as fodder for livestock and poultry, vegetables, spices, and even as herbal medicine in recent years [2]. The extractions of CG and CI have been reported to exert hypoglycemic, lipid-lowering, antimicrobial and hepatoprotective effects [3,4]. They are, simultaneously, functional foods with various active ingredients originating from CG or CI and have become very popular in the food industry, mainly carrying out the hepatoprotective and hypoglycemic effects. CG and CI are valuable sources of bioactive substances in new food products, especially since inulin, sesquiterpene lactones, and phenolic compounds [5,6] are found in the plant roots, leaves, seeds [7] and flowers. This research suggests that CG and CI may have potential health effects, which makes them potentially valuable resources for food ingredients, functional foods, beverages, and dietary supplements. For example, health products lsuch as Biodrain and capsules of Astragalus Chicory and Fructus Lycii are now widely used.
Based on the wide range of applications, further research has been done on these. Although they are uniformly listed as chicory in the Chinese pharmacopoeia, the two species are similar in many ways but still possess some distinguishing features. Geographically speaking, CI is widely distributed in Europe, Western Asia, Australia, North America, and Regions of China [8], while CG is mainly distributed in Aksu, Kashgar Prefecture, and other plains and oases in Xinjiang, China. Regarding morphology, for instance, CG stems and leaves are covered with villi, while CI has a smooth appearance. Even so, CG and CI are often confusing to use in the market, which affects the ingredients and health-care efficacy of their products.
Modern studies have shown that CG extraction can regulate lipoidemia [9] and glycemia [10], which is mainly owing to its flavonoids and phenylpropanoids, such as caftaric acid and kaempferol-3-O-glucuronoside. CI extraction has hepatoprotective [11] and antioxidative effects [12] mainly associated with 11β,13-dihydrolactucin and lactucopicrin. Because of the confusion between the two species, the origins of species in these studies may be inaccurate, with serious implications for their future product development. In our literature review, we found that few studies have been able to simply compare the content of certain chemicals between CG and CI. In order to achieve better quality control and develop more effective functional foods, it is necessary to systematically compare and evaluate the composition and efficacy of CG and CI.
In this study, a standard chromatographic fingerprint with a simple and reliable analytical method of CG and CI by HPLC was developed. Metabolites in CG and CI were qualitatively and quantitatively identified by untargeted metabolomics. Additionally, we investigated how chemical differences between CG and CI lead to distinct antioxidative and hypoglycemic activities. The results not only provide chemical information for product quality evaluation but also provide a strong basis for future food product development.

2. Materials and Methods

2.1. Chemicals

Methanol, acetonitrile, and acetic acid were purchased from Merck (Darmstadt, Hesse, Germany) and TEDIA Company Inc. (Fairfield, OH, USA). High-purity water was acquired from Hangzhou Wahaha Group (Hangzhou, China). The remaining chemical reagents were purchased from Sinopharm Co. Ltd. (Shanghai, China). P-nitrophenyl-α-D glucopyranoside (pNPG), 1,1-diphenyl-2-picryl-hydrazyl (DPPH), 2,20-azino-bis-3-ethylbenzthiazoline-6-sulphonic acid (ABTS+), acarbose, glucose (GLU), alloxan (ALX), and L(+)-ascorbic acid (Vc) were purchased from Shanghai Yuanye Bio-Technology Co., Ltd., (Shanghai, China).

2.2. Sample and Sample Preparation

Ten batches of CG and ten batches of CI samples were collected from XinJiang, China for analysis, and the source of informationias listed in the Table S1 (Supporting Materials). Professor Minjian Qin (China Pharmaceutical University) identified the herb species. Voucher samples deposited at the Department of Pharmacognosy, China Pharmaceutical University, Nanjing, China.
CG and CI were pulverized with a pulverizer, and sample was accurately weighed (1 g) and placed in a round-bottomed flask. After 20 mL of methanol water (7:3), the mixture was extracted by ultrasound (500 W) for 50 min, then added methanol water (7:3) as required, adjusting to the initial weight. Extractions were then filtered through a microfiltration membrane (0.22 μm) to obtain the filtrate. The ample solution was stored in the sample injection bottle for HPLC and LC-MS analysis. Quality control (QC) samples were prepared by mixing equal volumes of each sample analyzed in this study.
The powder was decocted in 70%methanol (1:20, 1.5 h). After concentration and centrifugation, extraction supernatant, filtered with microfiltration membrane (0.45 μm), and then further enriched by preparative liquid chromatography.

2.3. HPLC Apparatus and Chromatographic Conditions

The HPLC fingerprint analysis was run on an Agilent 1260 HPLC series (Agilent Technology, Santa Clara, CA, USA), equipped with a low pressure mix binary pump, an auto sampler, a diode array detector (DAD), and an online degasser. Chromatographic separation was carried out at 35 °C on the Agilent ZORBAX SB-C18 column (4.6 mm × 250 mm, 5 μm). The mobile phase was composed of 1% acetic acid aqueous solution (A) and methanol (B) in a gradient elution mode (0–5 min, 10–15% B; 5–15 min, 15–30% B; 15–30 min, 30–45% B; 30–50 min, 45–45% B) at a flow rate of 1.0 mL·min−1. The UV absorbance was monitored at 258 nm. It was kept constant during all the batches.

2.4. LC-QTOF MS Apparatus and Chromatographic Conditions

For the identification of chemical components from samples, an analysis was performed using an Agilent series 1290 Infinity HPLC instrument coupled with an Agilent 6530 Q-TOF mass spectrometer (Agilent Technologies, Santa Clara, CA, USA). Gradient elution procedure is consistent with HPLC. The flow rate was 0.5 mL/min, and the injection volume was 5 μL. Mass spectrometric detection was performed in negative electrospray ionization (ESI) mode. The operating parameters were as follows: capillary voltage, 4000 V; dry gas (N2) flow rate, 8 L/min and the temperature, 325 °C; sheath gas flow rate, 12 L/min and the temperature, 350 °C; nebulizer, 40 psi. Mass spectra were recorded over the mass range of m/z 50–1700 with accurate mass measurement of all mass peaks. The auto MS/MS mode was set to obtain abundant structural information. All the data acquisition were controlled by Agilent Mass Hunter software (version B.01.03 Build 1.3.157.0 2, Agilent, USA). QC and blank samples were analyzed in the batch, and they were placed every 5 randomized sample injections.

2.5. Data Pretreatment and Multivariate Data Analysis

The chemical similarity of chromatographic fingerprints was calculated with the “Similarity Evaluation System for Chromatographic Fingerprint of Traditional Chinese Medicine (2010 A Version, Committee of Chinese Pharmacopeia, China)” software [13]. It was used to assess the quality consistency of the CG and CI. Similarity parameter quantified the difference between two fingerprints. The LC-MS raw data were converted to common data format (mzML) files for the untargeted metabolic analysis using a conversion software program MS converter [14]. After peak alignment, peak matching and peak extraction, a three-dimensional matrix consisting of peak intensity information, variables characterized by retention time (tR) and m/z values was formed. The variables presented in at least 80% of either group were extracted [15]. Metabolite ions with RSD% less than 30% in QC samples were normalized for further data processing. Then he principal component analysis (PCA), and orthogonal partial least squares discriminant analysis (OPLS-DA) were carried out to further identify the data patterns. The PCA was conducted to detect the samples intrinsic variation. The OPLS-DA was used to distinguish the differences in metabolic profiles between sample groups. The characteristic chemical markers were selected by VIP > 1 and p < 0.05 in the moderated t-test. Structure annotation of the potential chemical markers was achieved by the characteristic fragments and the fragmentation patterns confirmed by MS/MS. Compounds were tentatively identified using a combination of accurate mass and MS/MS fragmentation patterns and were compared against published literature on their chemical composition publicly available in online metabolite databases Metlin [16], MassBank, and HMDB [17]. A heat map was used to visualize the variation in the levels of the potential chemical markers in all of the CG and CI extractions.

2.6. In vitro Activity Assay

2.6.1. Assays for Antioxidant Activities In Vitro

In vitro antioxidant activity was assessed by 1,1-diphenyl-2-picrylhydrazyl (DPPH) [18] radical scavenging assay and ABTS radical cation (ABTS+) [19]. In DPPH assay, 2 mL of various dilutions of the samples were mixed with 1mL of a 0.25 mM methanol solution of DPPH. The mixtures were kept at room temperature in the dark for 30 min, and absorbance was measured at 517 nm using the UV spectrophotometer to reflect the scavenging capacity. The ABTS+ was prepared by reacting 7 mM stock solution of ABTS with 2.45 mM potassium persulfate and allowing the mixture to stand in the dark at room temperature for 12 h before use. The ABTS+ solution was diluted with methanol to an absorbance of 0.800 ± 0.05 at 734 nm. Next, 2.85 mL of the methanol solution was added to 0.15 mL of different concentrations of the samples and the absorbance was recorded at 734 nm after mixing up to 10 min. L(+)-ascorbic acid (Vc) was used as the positive control. The radical scavenging activity of the tested samples expressed with IC50 value.

2.6.2. Assays for Hypoglycemic Activities In Vitro

Assays for α-glucosidase inhibition properties (PTG) using the method described by Lei Wang et al. [20]. CG and CI solution with different concentrations were prepared using a phosphate buffer (100 mM, pH 6.9), and 100 μL of α-glucosidase (0.5 U/mL) was added to 100 μL of sample solution and incubated at 37 °C for 10 min. Then, 100 μL of pPNG (5 mM) was added to each reaction vial and further incubated at 37 °C for 20 min, and 1 mL sodium carbonate (1 M) was added and the reaction was terminated. The absorbance value was then measured at 405 nm. The pharmacological inhibitor, acarbose, was introduced as a positive control. The hypoglycemic activities of the test samples are expressed in IC50 values.

2.7. In Vivo Activity Assay

2.7.1. Antioxidant Activity in Larval Zebrafish

The oxidation-sensitive fluorescent probe DCFH-DA was used to detect intracellular ROS generation in zebrafish larvae [21]. The wild-type AB-line larvae zebrafish were developed to 15 dpf. On the 15th day, the larval zebrafish were used for further treatment. Kaempferol-3-O-glucuronoside (CGA), 15-deoxylactucin-8-sulfate, and 8-deacetylmatricarin-8-O-sulfate (CIA) were dissolved directly into embryo water at a concentration of 5, 10 and 20 ug/mL and larvae were pretreated for 20 h. Then, larvae were induced the oxidant stress by H2O2 (2 mM) for 4 h. DCFH-DA can as an indicator of ROS, and a 10 mM solution of DCFH-DA was prepared by dissolving it in DMSO. Larval zebrafish were incubated with 10 μM DCFH-DA (diluted with embryo water) for 30 min at room temperature in the dark. The larvae were washed with embryo water 3 times and kept in CMC-Na (4%) on a glass slide for fixation. The image was captured immediately using a fluorescence stereoscope (Olympus SZX16). ImageJ software (https://imagej.net) was used to measure whole-body fluorescence [22].

2.7.2. Hypoglycemic Effect Determination on Zebrafish Diabetic Model

Zebrafish at 5 dpf were randomly divided and transferred into 6-well plates. The density was 30 fish per well. Zebrafish were cultured in water with 10 mg/mL GLU and 0.025 µM ALX for 24 h to obtain diabetic model [23]. Experimental groups were treated with different concentrations of CGA and CIA (5, 10, and 20 µg/mL), 10 mg/mL GLU were administered at the same time. All groups were incubated in an incubator at 28 ℃ for 24 h, and then zebrafish were collected in 1.5 mL centrifuge tubes. Each tube contained 10 fish, with 3 tubes per group. Determination of glucose content according to the glucose kit protocol was carried out.
All the animal experiments were approved by Ethical Committee of China Pharmaceutical University (SYXK(SU)2021-0010) and Laboratory Animal Management Committee of Jiangsu Province. All the experiments followed the Jiangsu Provincial standard ethical guidelines in using experimental animals under the ethical committees mentioned above.

2.8. Statistical Analysis

All results were expressed as the means ± standard deviations (SDs) of at least three independent measurements. Graph Pad PRISM [24] (Graph Pad Software, United States, USA) was used for comparing the treatment group and corresponding control by one-way ANOVA for the significant differences. The differences between groups were considered as statistically significant at p-value < 0.05.

3. Results and Discussion

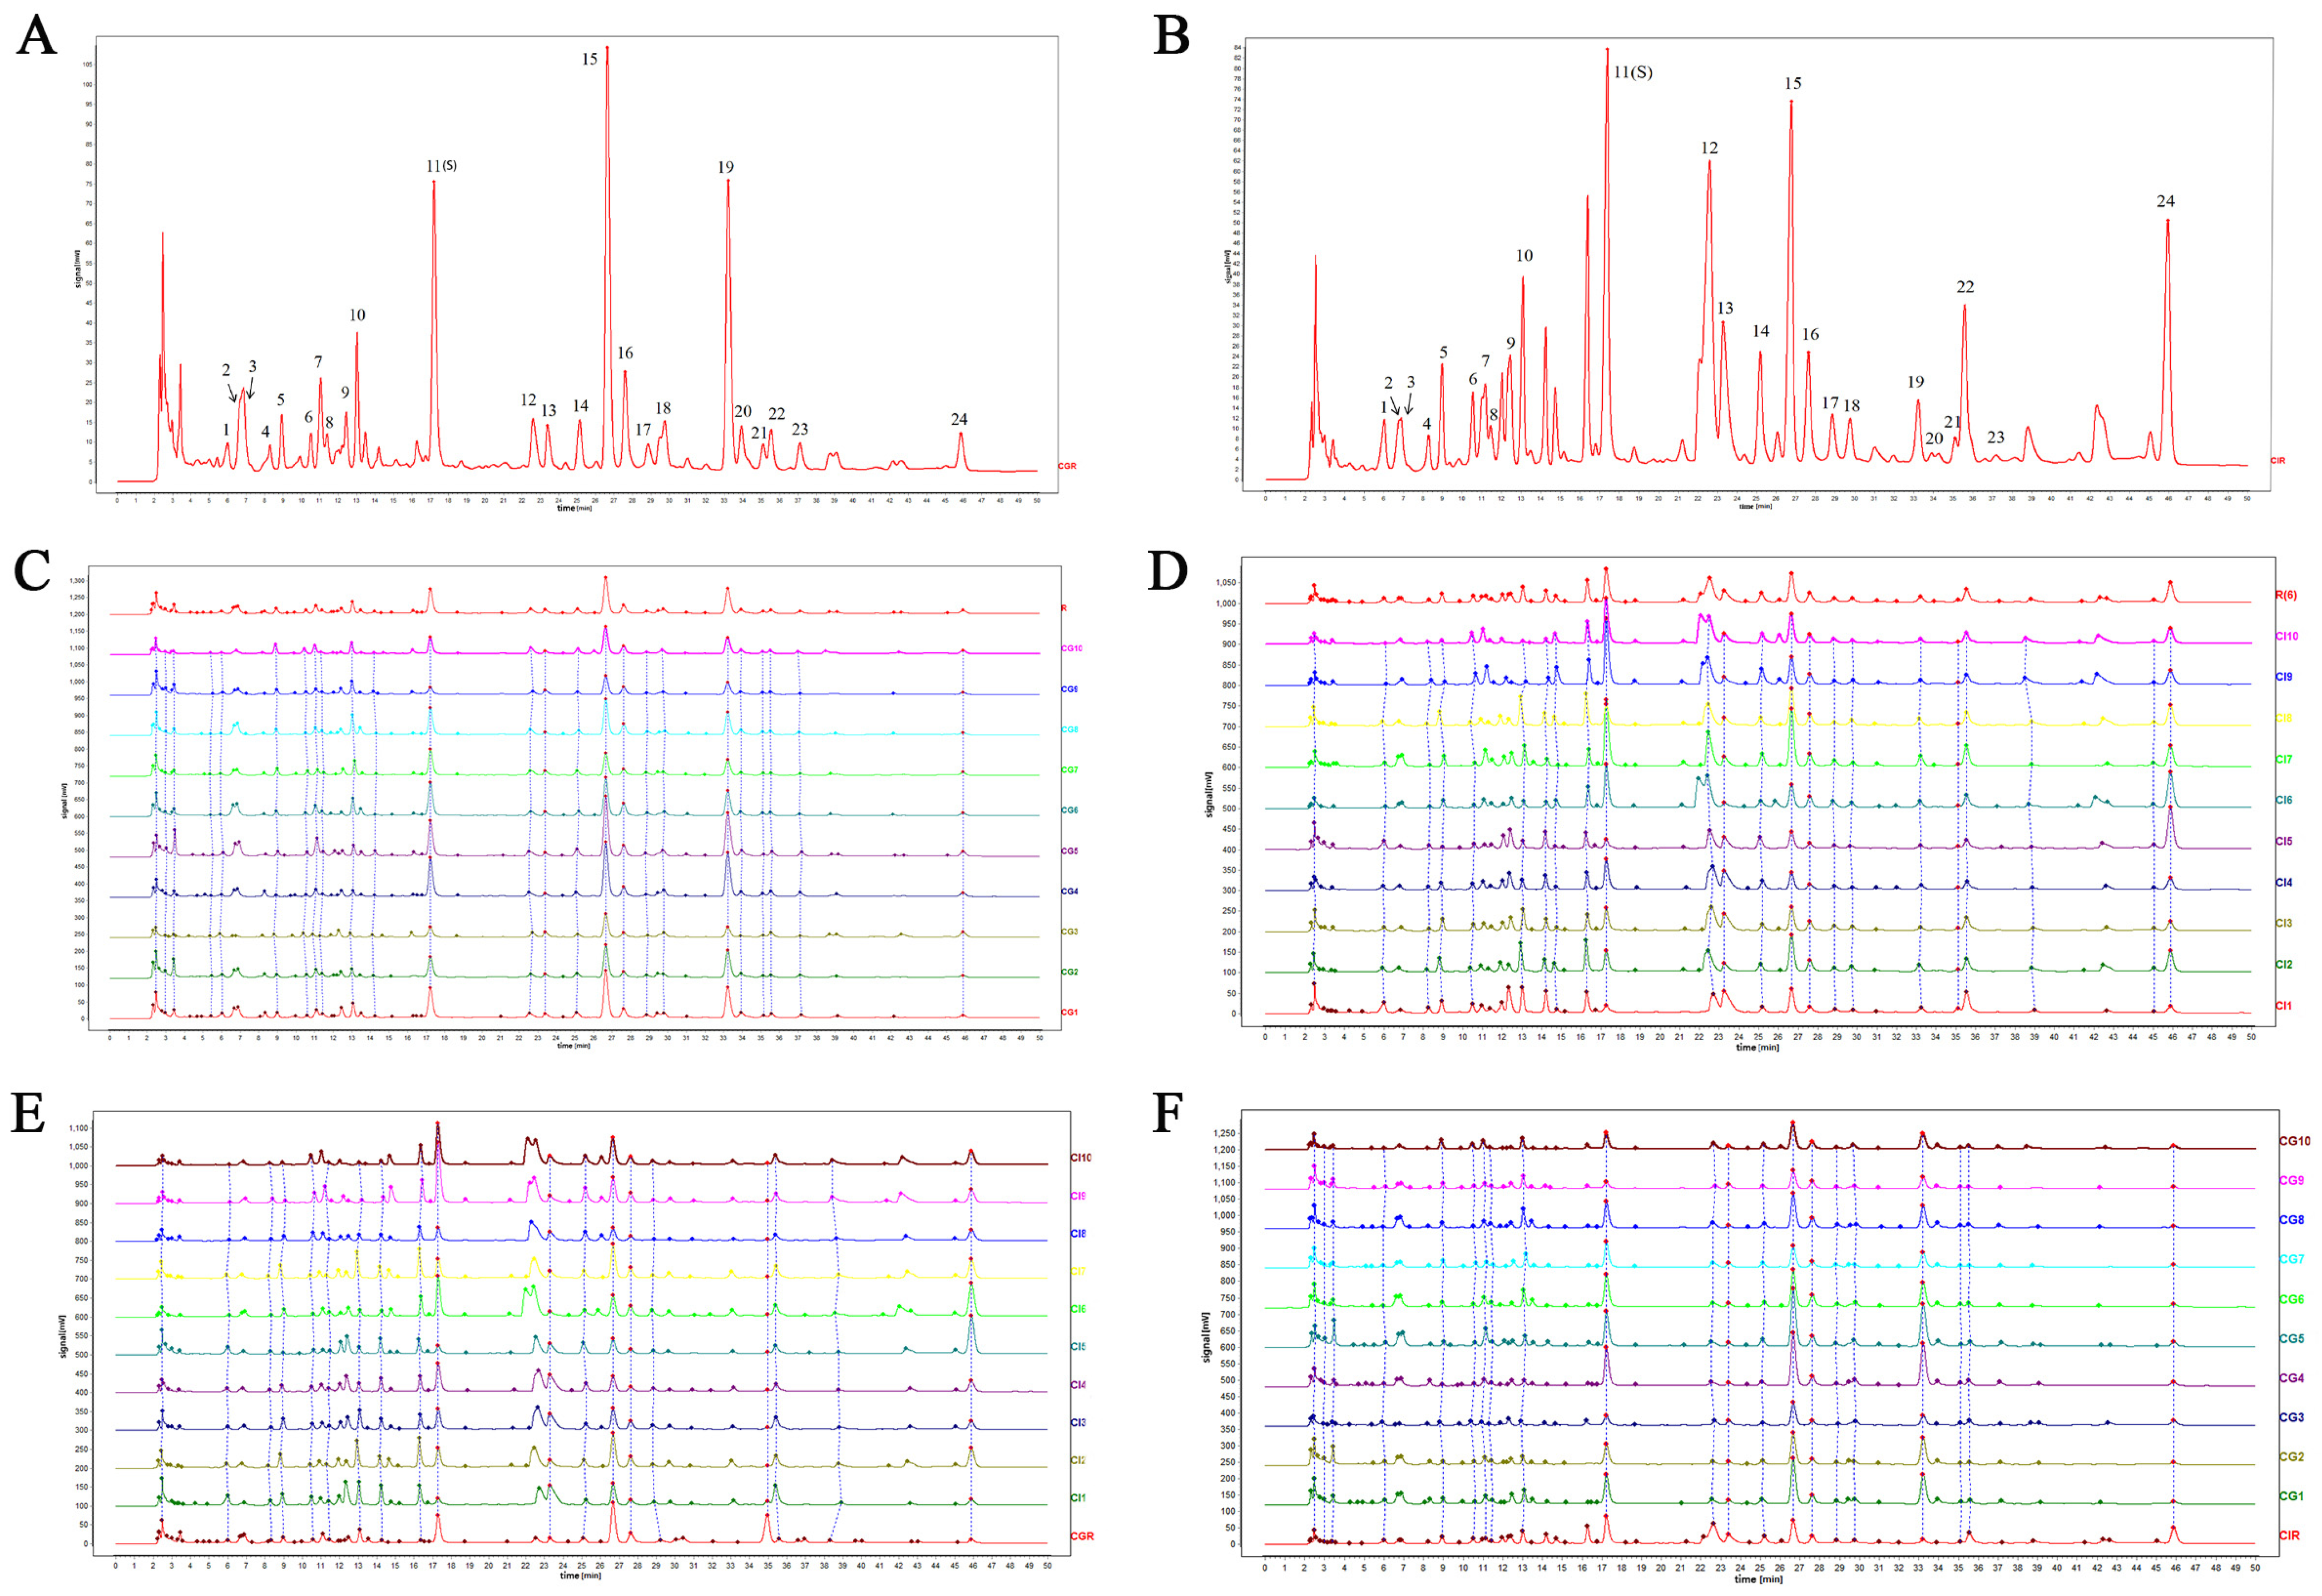
3.1. Identification of the Common Peaks and HPLC Fingerprint Similarity Analysis

HPLC fingerprinting methods for CG and CI were established first. Peaks existing in all chromatograms were assigned as “common peaks”, and 24 common peaks were identified. Peak 11 (s) was chosen as the reference peak to perform method validation (Figure 1A). Precision, reproducibility, and stability were evaluated separately. The RSD of the relative retention time (RRT) and relative peak area (RPA) of each common peak was calculated. The results with relative standard deviation (RSD)s of RRT and RPA are shown in Supporting Materials Tables S2–S7. The RSD of the RRT of each common peak was found to be less than 3.45%, and the RSD of the RPA of each common peak was less than 4.81%. These results suggested that the HPLC fingerprint analysis method was consistent with the requirements.
Ten batches of CG and CI sample chromatograms were processed separately using the median method to generate a reference fingerprint chromatogram (named CGR and CIR; Figure 1A,B), then the similarities between the CGR and CIR and all samples were calculated separately, and the similarity results are shown in Table 1. The similarity of fingerprints is generally used for quality control of plant materials [25]. Similarity between the 10 batches of CG samples and the CGR all were in the range of 0.900–0.991 (Table 1). There was higher similarity within groups, which may be due to the consistency of harvesting period, while similarities between CI samples and CGR are both less than 0.706, except CI7 (0.839). The exception to CI7 may be due to the timing of the harvest and geographical environment because it was collected from Jimisar. In turn, the similarity between CG samples and the CIR is less than 0.72; however, the similarity between CI samples and CIR is greater than 0.789. Among them, CI1 and CI5 are less similar to CIR. This may be due to CI being a perennial wild species. Different growing years for the same species can also make a greater difference, but we did not conduct any further research on the growth years of CI samples. Similarly, a high degree of consistency within the CG group may be due to the fact that they are both annual cultivars. Lower similarity between CG and CI indicates a significant chemical difference between CG and CI. To further identify the differential compounds, a non-targeted metabolomics analysis was carried out.

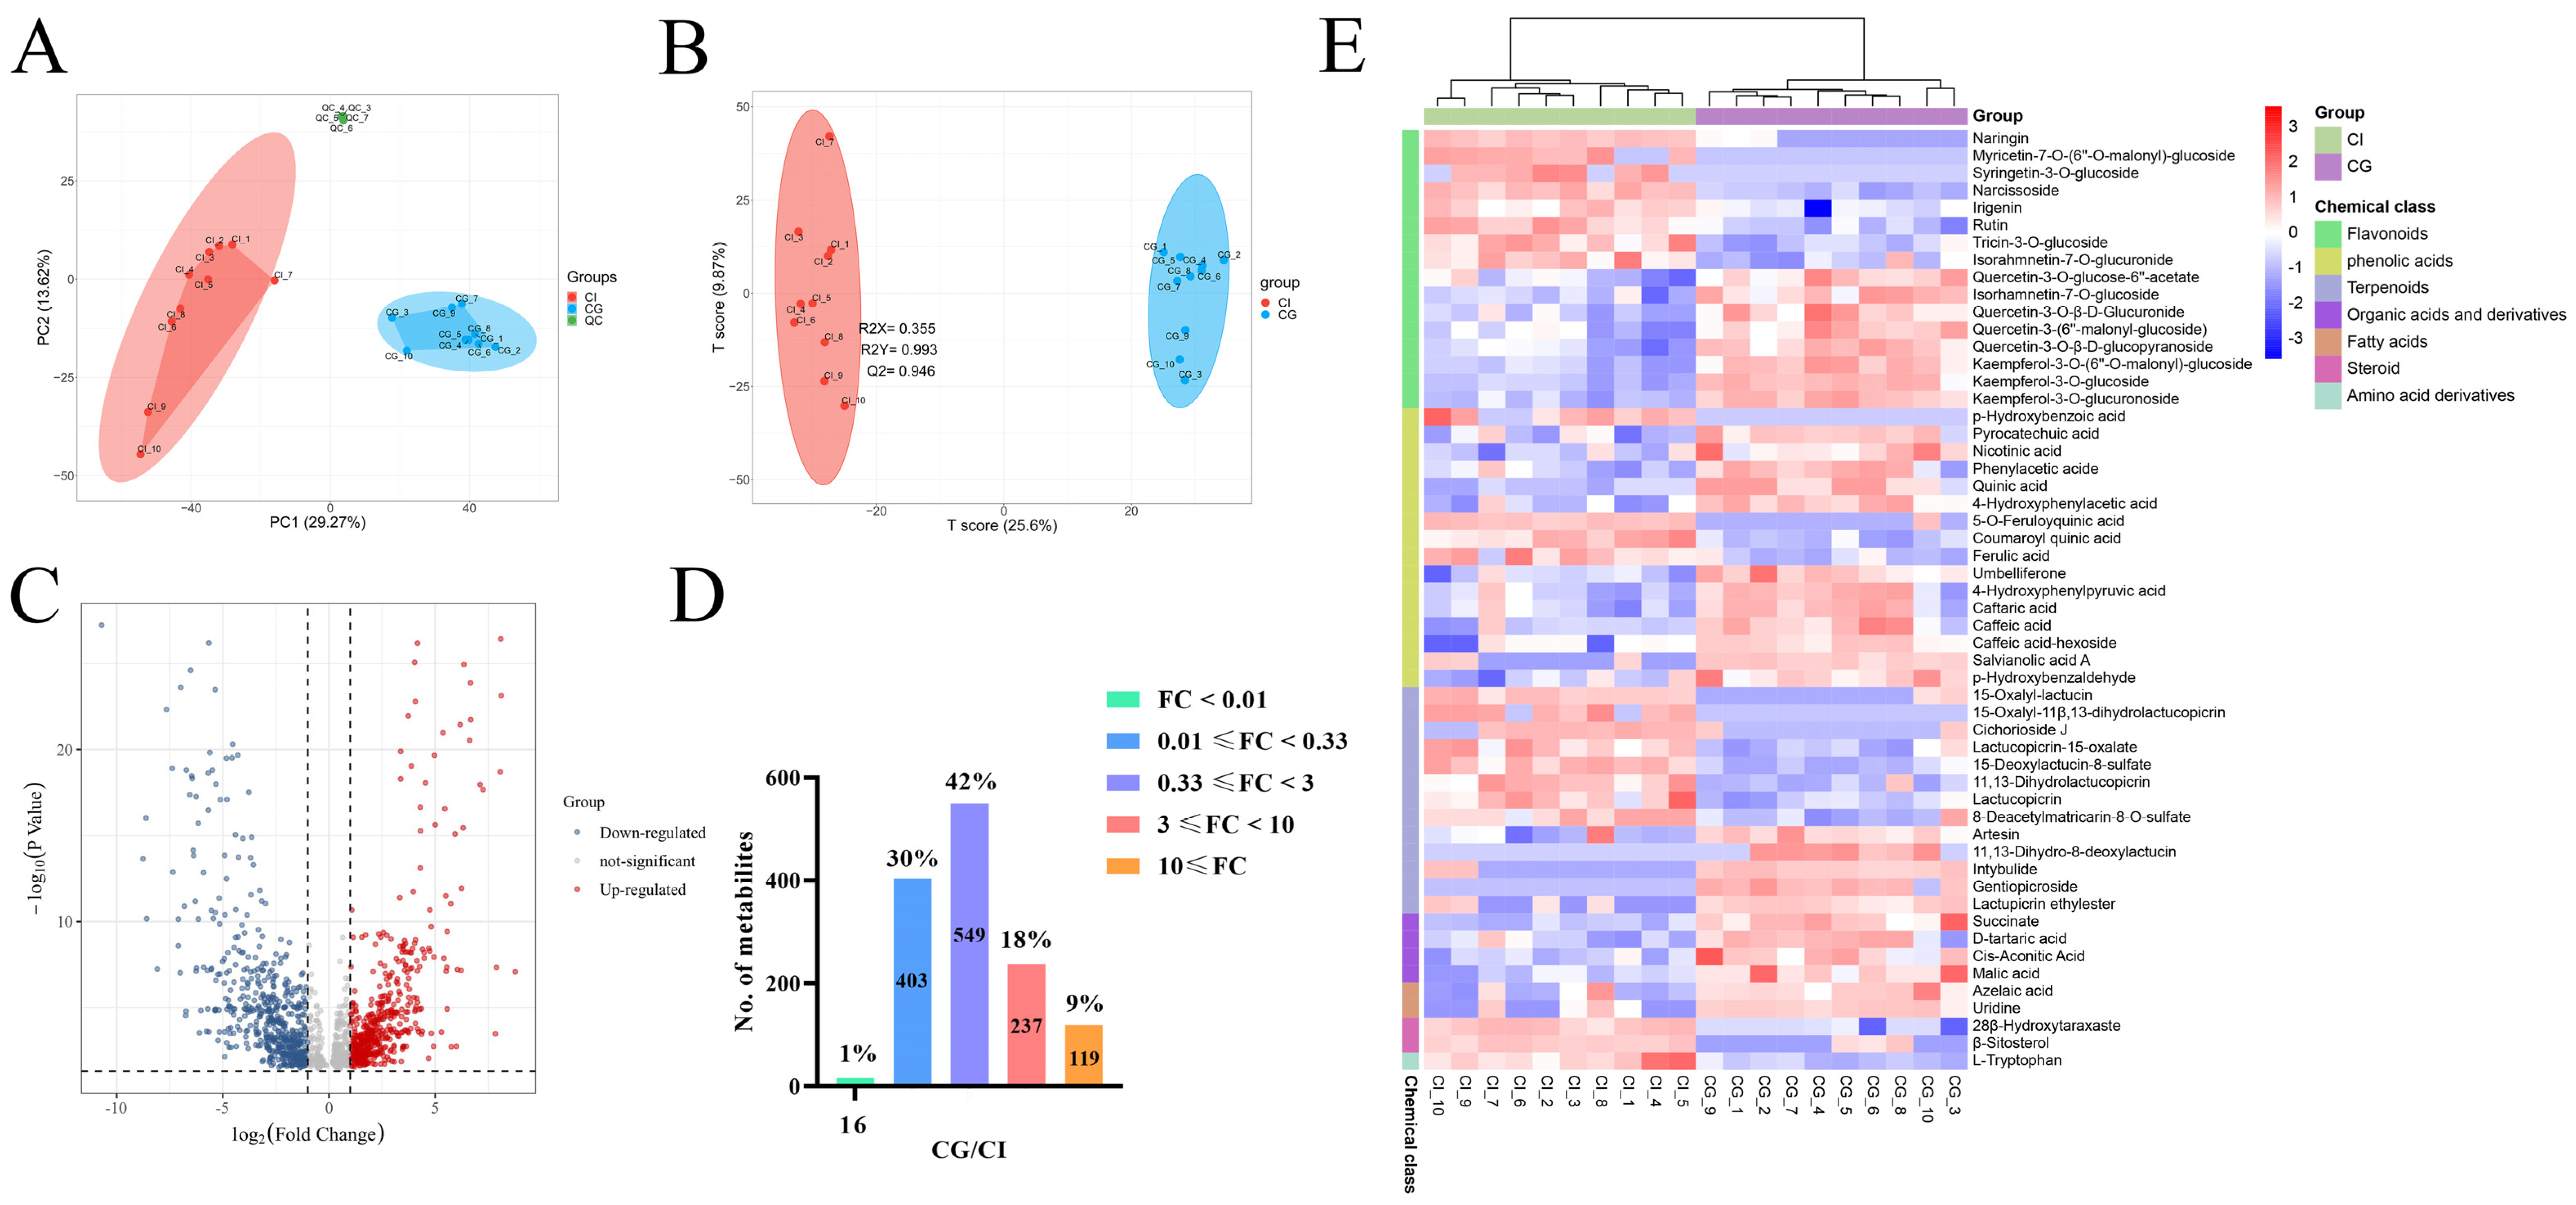
3.2. Non-Targeted LC-QTOF-MS Analysis

Plant metabolomics is an emerging technology of systematic science to analysis and identification metabolites of plants with advantages of high throughput, high sensitivity, and wide coverage [26]. Untargeted metabolomics, based on LC-high resolution mass spectrometry (HRMS) combined with multivariate analysis, is able to screen differential compounds in different plants or under various conditions. A metabolome analysis was performed on HPLC-QTOF-MS as the literature mentioned above. Due to the greater response intensity and more peaks generated by negative ion mode, metabolite data of negative models were selected for HPLC-QTOF-MS analysis. The typical base peak chromatograms (BPCs) of CG and CI in the negative ion mode are shown in Figure S1. Based on the macroscopic comparison of metabolic fingerprints, there is a significant difference between CG and CI. Further data analysis with multivariate statistical method for metabolites data of CG and CI were performed. To monitor stability of the LC-MS system, one QC sample was inserted in the running sequence per five test samples. All QC samples were found to tightly cluster together of the PCA score plot (Figure 2A). These results indicated a good reproducibility of the analytical system.

3.3. Multivariate Statistical Analysis

After processing the raw data for alignment, deconvolution, data reduction, etc., and further screening by “80% rule” and “30% variation”, 3020 ions were retained. Of these, 1779 were general ions. CG and CI contained 502 and 739 characteristic ions, respectively. The normalized abundance of was used as the input for further chemometrics analysis. Both PCA and OPLS-DA were widely used multivariate analysis methods in metabolomics [27]. To evaluate whether the metabolites profiles could effectively distinguish CG and CI samples, PCA was incipiently selected [28]. As the PCA score scatter plots for all samples included the QC samples shown in Figure 2A, the principal components 1 and 2 explained 29.27% and 13.62% of total variances, respectively, and distinct differences were observed among the CG and CI in the PCA score plot.
OPLS-DA is a supervised model which is used to filter out random noises, distinguish differences, and improve validity and analytical ability of the model. Hence, the OPLS-DA model has better classification efficiency than the PCA model. The score scatter plot inferred from the inter-group comparison of CG and CI samples is shown in Figure 2B. All the samples could be clustered individually in the OPLS-DA score plots. The result was basically consistent with that of the PCA. The CG samples were found to be completely separated from the CI samples, suggesting a significant difference in chemical ingredients. The resulting values of R2Y(cum) and Q2(cum) were 0.993 and 0.946, respectively, which demonstrated that OPLS-DA models were stable and reliable.
VIP was a common method for evaluating the contribution of variables in OPLS-DA. To select the chemical markers, the ions were further screened based using VIP value. As shown in the Figure 2C volcano map, a total of 1324 ions were screened. The higher the VIP value for the ions was, the more far it is away from the origin of volcano plot. This included 419 upregulated (VIP > 1, p < 0.05 and FC > 3.0) and 356 downregulated (VIP > 1, p < 0.05 and FC < 0.33). About 42% of these metabolites showed no difference between two species (Figure 2D).

3.4. Identification of Chemical Markers

The identification of the components in CG and CI extraction was identified by HPLC-Q-TOF-MS based on the exact molecular weight of the parent and fragment ions, and the information for the ions was compared against the published literature and publicly available online metabolite databases Metlin, MassBank, and HMDB [17] to identify the compounds. Based on the criteria for determining the differential metabolites, 59 compounds (chemical markers) were identified as shown in Table 2. There were 20 phenolic acids (3, 5, 8–12, 14–16, 20–23, 25–26, 28, 30–31, 39), 16 flavonoids (24, 36, 41–54, 59), 15 terpenoids (7, 17–19, 27, 29, 32–35, 37–38, 55, 57–58), 4 organic acids and derivatives (2, 4, 6, 13), 2 steroids (40, 56), 1 fatty acid (48), and 1 amino acid derivative (1).
As shown in Figure 2D, heat maps were employed to show the relative intensity of differential chemical markers in CG and CI. The high contents are represented by red squares, while the low ones are represented by green squares. The profile of the chemical markers was able to distinguish CI from CG. Among all compounds, CG possessed higher contents of phenolic acids, organic acids and derivatives, fatty acids, quercetin, and kaempferol and its derivatives. As for CI, the higher contents of terpenoids and steroids were determined. It is worth mentioning that two sesquiterpenoids, 15-deoxylactucin-8-sulfate (37) and 8-deacetylmatricarin-8-O-sulfate (38), with higher abundances in CI than those in CG, might be used for rapid distinguishing CI from CG by LC-MS. In addition, the much higher levels of kaempferol-3-O-glucuronoside (46) and caffeic acid-hexoside (15) might be the chemical characters of CG compared to CI.

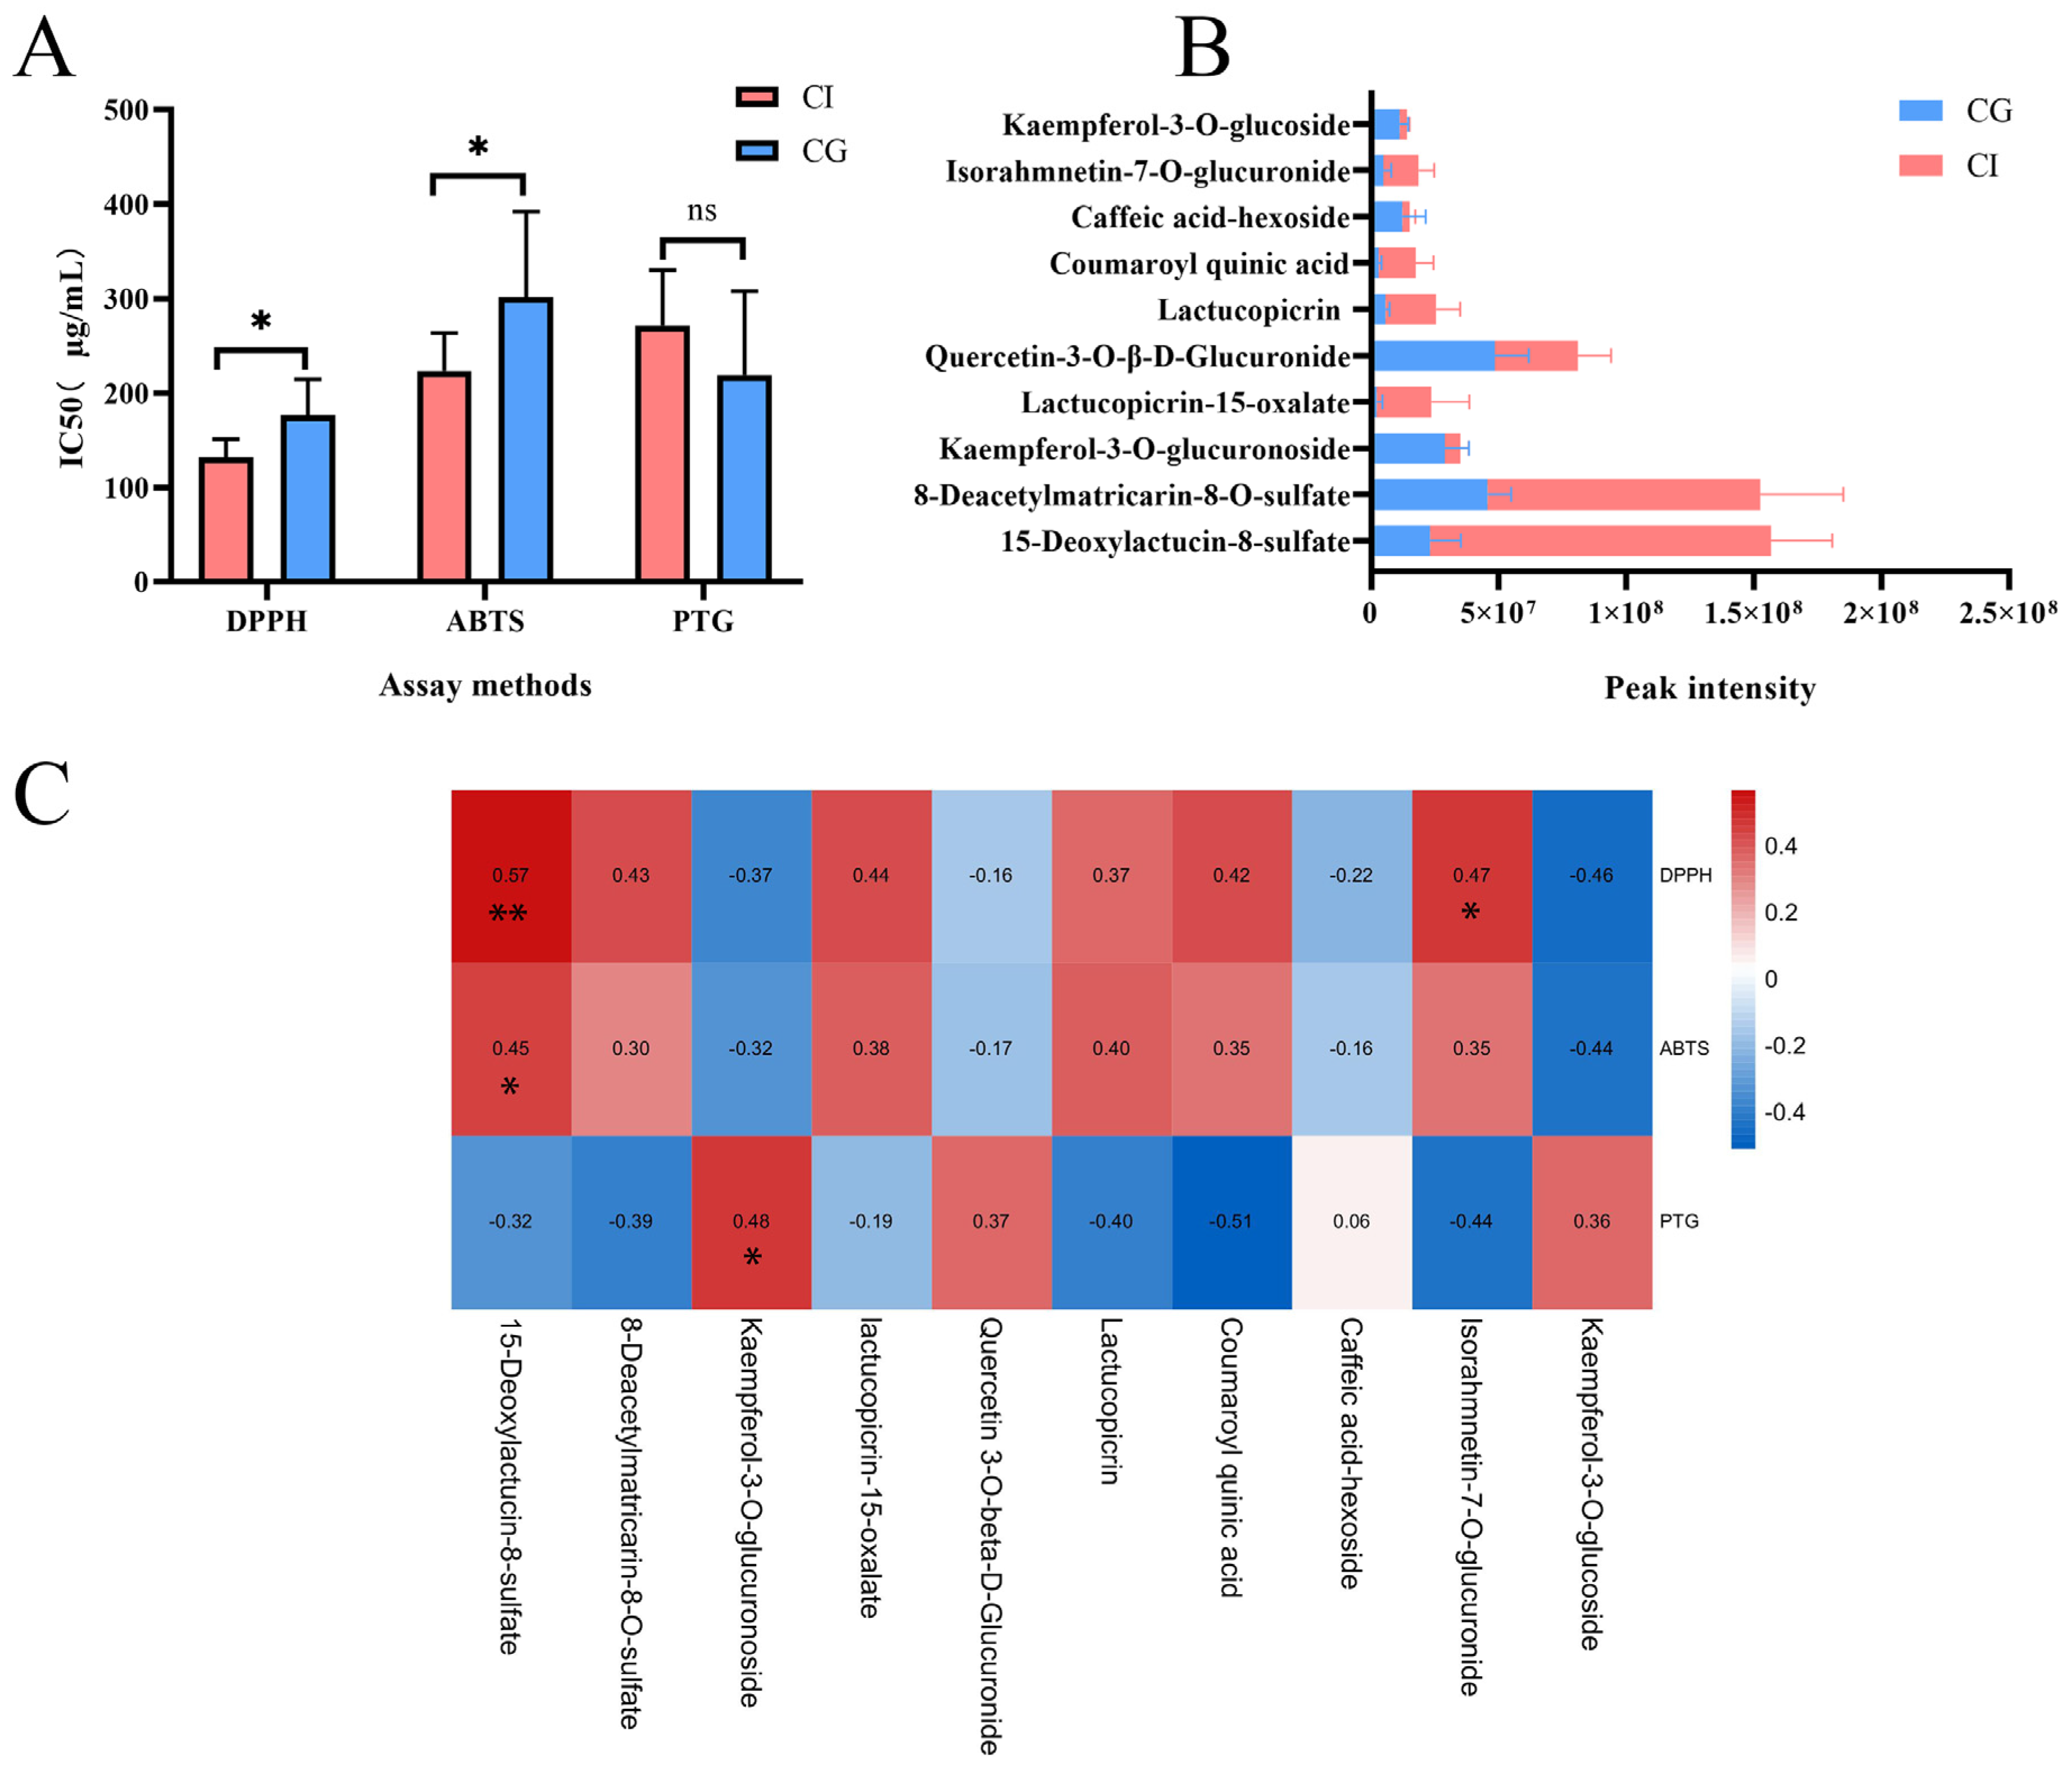
3.5. In Vitro Activity Assay

Based on the difference of chemical composition between CG and CI, the antioxidative and hypoglycemic activities of CG and CI were further compared. The antioxidative activity was determined by DPPH and ABTS assay, while the hypoglycemic activity was assessed by PTG assay. The free radical scavenging ability and hypoglycemic activity of the two samples were concentration-dependent (Figures S2–S4).
As shown in Figure S2, the IC50 of the 10 batches of CI samples were all in the range of 105.428 μg/mL−159.831 μg/mL. The IC50 of CG samples were in the range of 130.347 μg/mL−252.889 μg/mL. L(+)-ascorbic acid (Vc) (positive control) possessed an IC50 value of 5.215 μg/mL. The IC50 value of CI is relatively lower than CG, which indicated a higher antioxidative activity compared to CG. The results of ABTS experiment were similar (Figure S3). As for ABTS+ radical scavenging capability, IC50 values of CG and CI were in the range from 208.938 μg/mL to 464.131 μg/mL and 136.914 μg/mL to 273.541 μg/mL, respectively. Vc showed an IC50 value of 8.649 μg/mL. Taken together, CI extractions showed better antioxidant activity than CG extractions.
α-Glycosidase is an important enzyme for digesting carbohydrates. Inhibiting α-glucosidase is believed to be one of the most effective approaches for diabetes care [29]. As shown in Figure S4, CG and CI showed a dose-dependent inhibition activity against α-glucosidase with IC50 values of 70.356 μg/mL–352.058 μg/mL of CG and 196.033 μg/mL–364.416 μg/mL of CI. The results suggested that CG extractions had better hypoglycemic activity compared to CI. In order to compare the results more visually, statistical analysis on the antioxidative activity and hypoglycemic activity results of CG and CI were carried out respectively (Figure 3A). IC50 values of CI and CG showed significant differences in DPPH and ABTS assays (p < 0.05). CG showed better activity in hypoglycemic activity than CI without significant difference.
In order to further explore the material base for antioxidative and hypoglycemic activities, a bivariate correlation analysis was conducted. We excluded trace components, and screened the top ten chemical components with the largest content difference between CG and CI. The main components were sesquiterpenes and flavonoids, as shown in Figure 3B. CI is rich in 15-deoxylactucin-8-sulfate, 8-deacetylmatricarin-8-O-sulfate, lactucopicrin-15-oxalate, lactucopicrin, coumaroyl quinic acid, caffeic acid-hexoside, and isorahmnetin-7-O-glucuronide. Kaempferol-3-O-glucuronoside, quercetin-3-O-β-D-Glucuronide, caffeic acid-hexoside, and kaempferol-3-O-glucoside levels in CG are higher than those in CI.
The bivariate correlation analysis (Figure 3C) presented a significant (p < 0.05) positive correlation of 15-deoxylactucin-8-sulfate, 8-deacetylmatricarin-8-O-sulfate, and isorahmnetin-7-O-glucuronide to DPPH and ABTS (r-value from 0.296 to 0.570), which declared that the two compounds contributed to the antioxidative activity of CI. Additionally, the significant (p < 0.05) positive correlation of kaempferol-3-O-glucuronoside to PTG (r = 0.483). Therefore, sesquiterpenoids 15-deoxylactucin-8-sulfate, 8-deacetylmatricarin-8-O-sulfate, and flavonoids such as kaempferol-3-O-glucuronoside caused the significant (p < 0.05) differences of antioxidant activities and hypoglycemic activities between CG and CI.

3.6. Composition Preparation and Pharmacodynamic Evaluation

3.6.1. Composition Preparation Using Preparative-HPLC

Based on the above research, in order to further confirm the correlation between chemical composition and bioactivities, the top three components with the largest content difference between CG and CI were separated and prepared by preparative-HPLC. We separated and enriched 15-deoxylactucin-8-sulfate and 8-deacetylmatricarin-8-O-sulfate in CI and kaempferol-3-O-glucoside (CGA) in CG by preparative liquid chromatography. Due to the low separation degree between 15-deoxylactucin-8-sulfate and 8-deacetylmatricarin-8-O-sulfate, those were selected as a mixture named CIA, and CIA is the strongest correlation to the antioxidative activity tested by DPPH and ABTS assays, and CGA is the strongest correlation to the hypoglycemic activity tested by PTG assay. The purity of CGA was above 95%, and that of CIA was above 80%, as shown in Figure S5. Furthermore, we evaluated the antioxidative and hypoglycemic efficacy of the two samples using larval zebrafish.

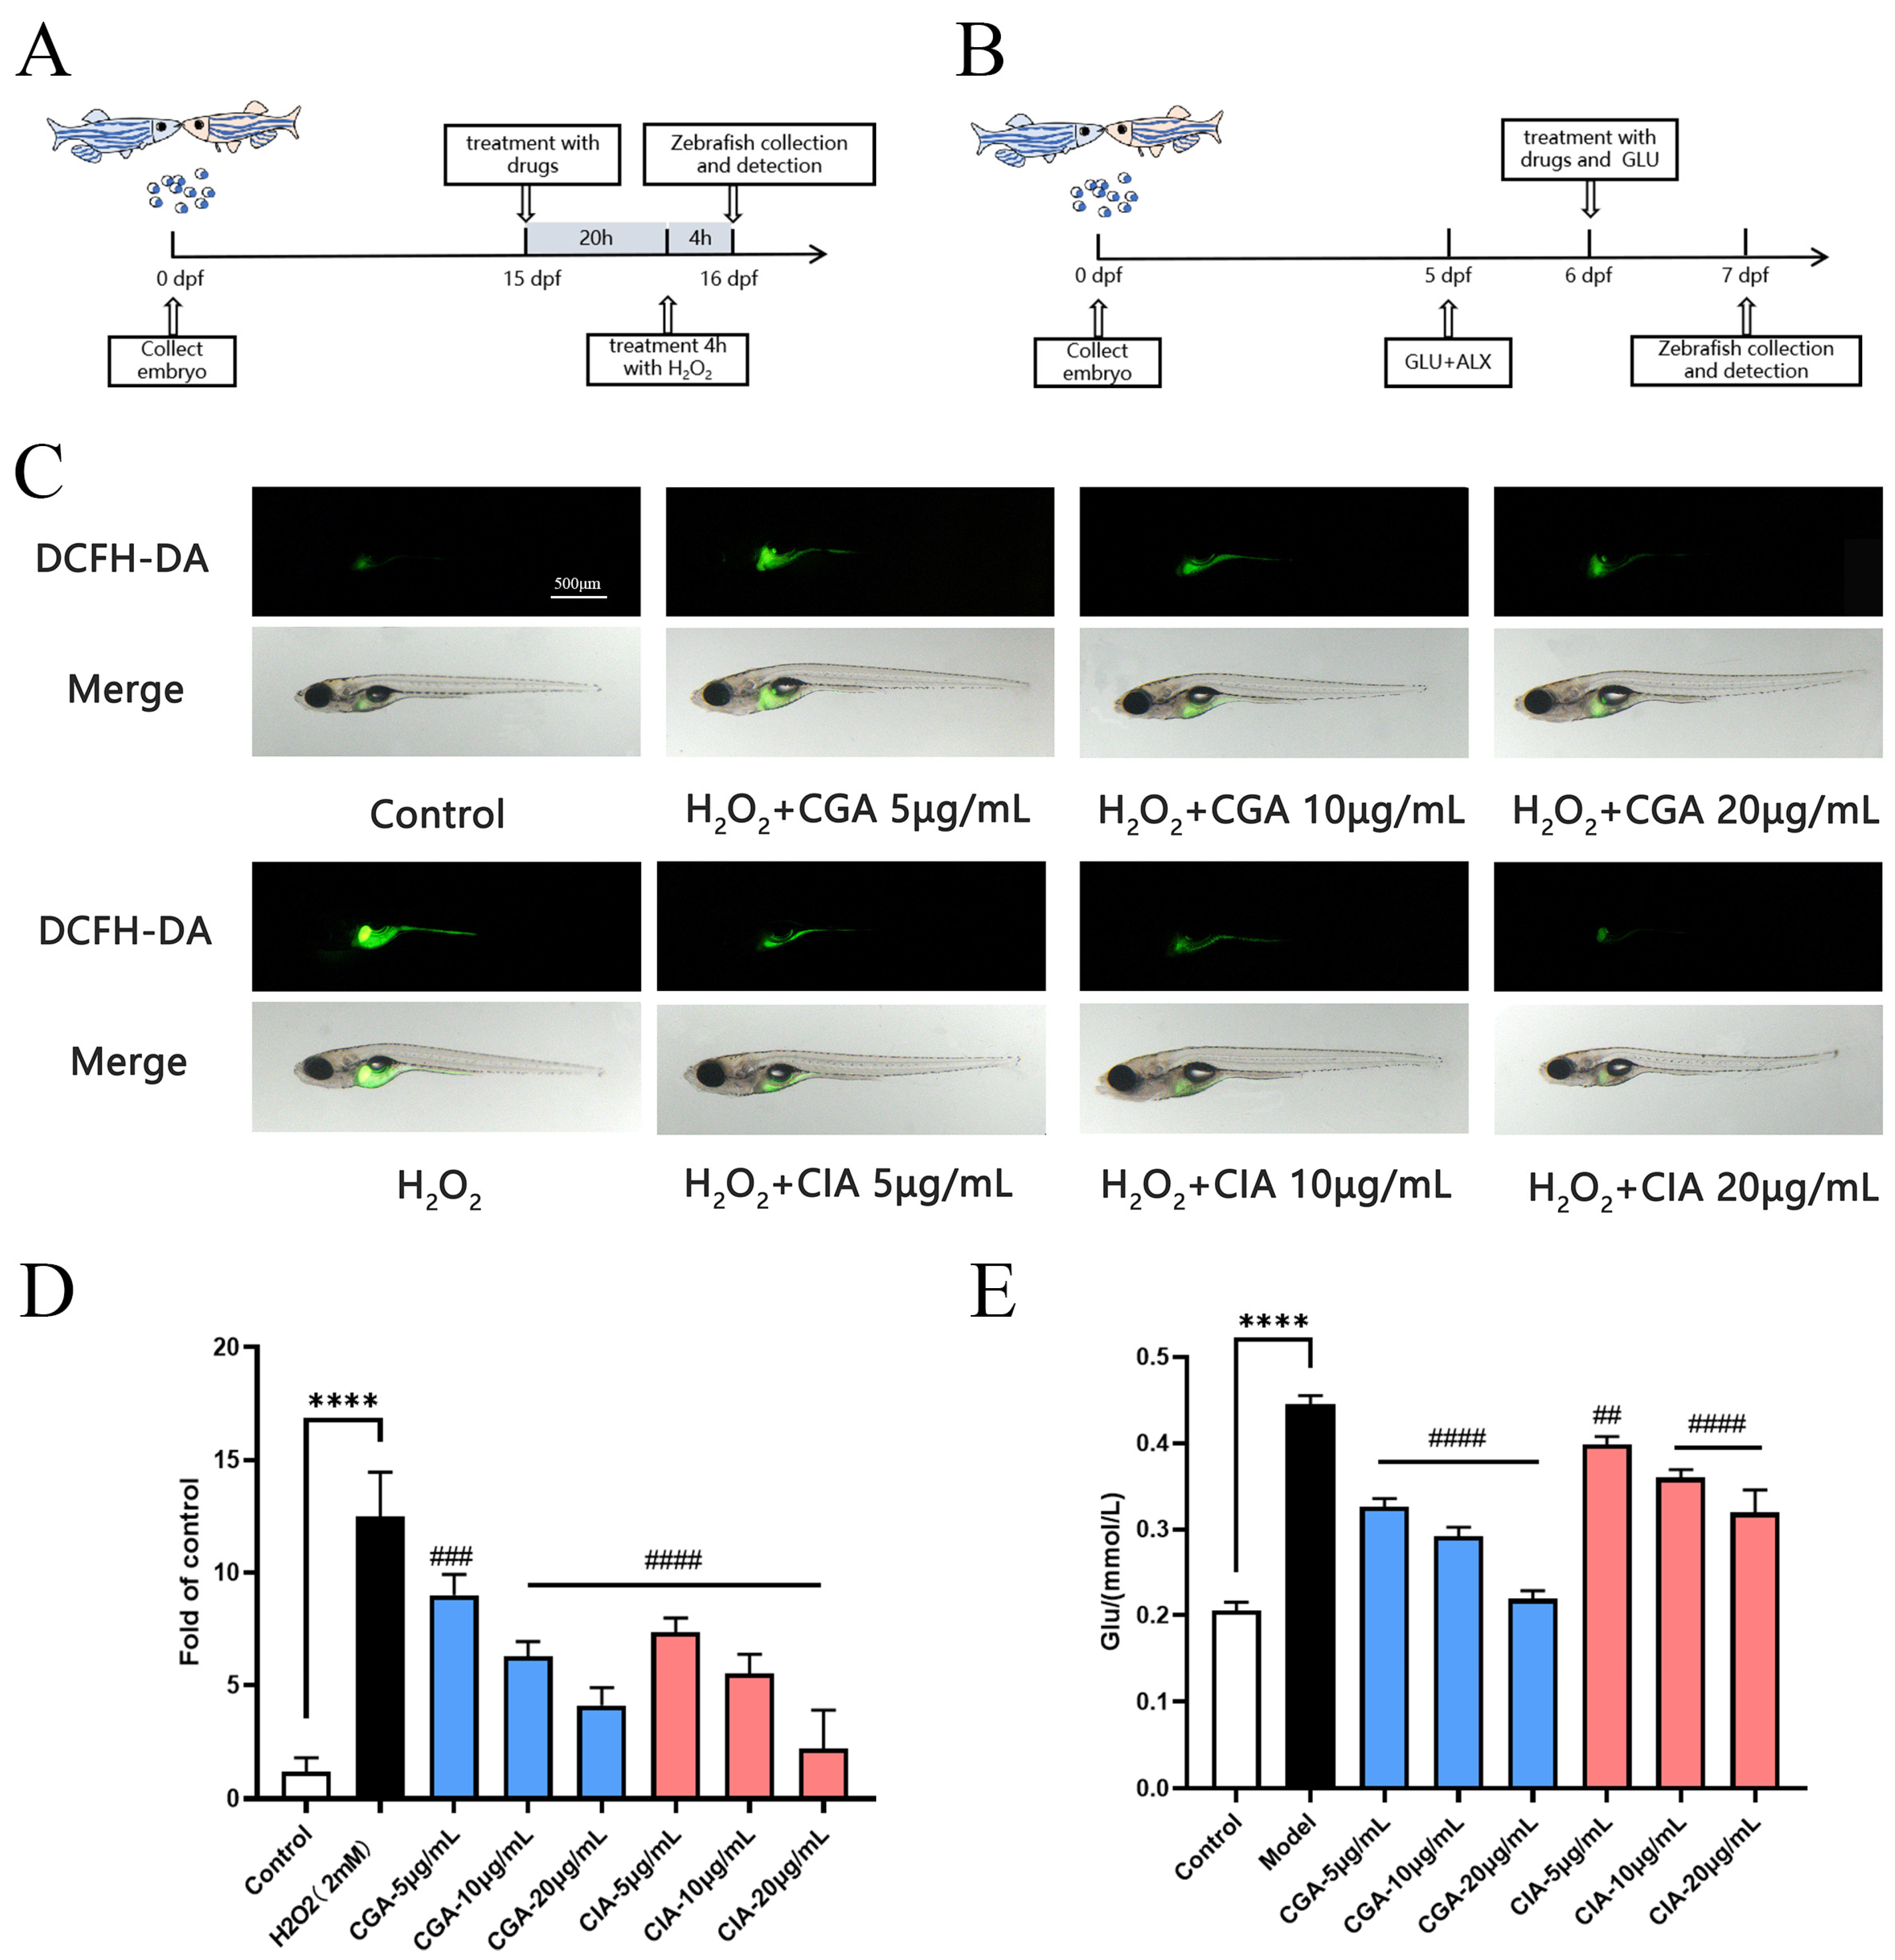
3.6.2. Effect of CG and CI on H2O2-Induced Larval Zebrafish Injury Model In Vivo

To confirm the antioxidative effect of CGA and CIA, an H2O2-induced larval zebrafish model was used to assess the activity of their ROS scavenging capability in vivo (Figure 4A). ROS plays an important role in oxidation stress [30,31]. To examine the intracellular ROS levels, DCFH-DA probe, a reactive oxygen-sensitive dye, can be used to detect intracellular ROS generation [32]. As shown in Figure 4C, compared with the control group, fluorescent signals were indeed enhanced in the fishes’ abdomens in the model group, indicating that ROS was formed in the larvae in the presence of free radical generator (H2O2) and mainly located in the liver and gastrointestinal tissue. This suggests that ROS can cause liver damage. Zebrafish larvae pre-treated with CGA or CIA both showed a lower fluorescent intensity compared to model group. As the corresponding quantified result of ROS shown in Figure 4D, the CGA and CIA (5, 10 and 20 μg/mL) both reduced the liver fluorescent intensity of zebrafish larvae induced by H2O2 with a dose-dependent pattern. The efficacy of CIA was better than that of CGA at the same dose. The ROS levels of the larvae in high CIA exposure group (20 μg/mL) were close to those in the control group, which demonstrated that CGA and CIA exhibit in vivo free radical scavenging activity. It was consistent with the previous results in DPPH and ABTS assays. CIA plays an important role in antioxidant effect of Cichorium intybus L. and is used to protect the liver from damage. The result accorded with the previous report which stated that kaempferol and its derivatives (CGA) have good antioxidant properties in zebrafish larvae [33,34].

3.6.3. Effects of CG and CI on Hypoglycemic Effect Induced by High GLU and ALX in Zebrafish Model

In recent years, zebrafish have shown a significant potential as in vivo models for diabetes-related research. Based on previous study, the combination of GLU and ALX can construct the zebrafish model of insulin-dependent diabetes mellitus. Here, we used 10mg/mL GLU combined with 0.025 μM ALX to induce a diabetes model in zebrafish (Figure 4B). Our results demonstrated that the larvae raised in GLU+ALX solution (Figure 4E) showed increasing of blood glucose levels compared to the control, indicating that the high GLU and ALX caused blood glucose disorder in zebrafish. Treatment with the CGA and CIA resulted in a concentration-dependent decrease in blood glucose of larvae. Compared to CIA, CGA was able to reduce the hyperglycemia of zebrafish more strongly. The results accorded with the previous report which stated that CGA could attenuated blood glucose disorders [35]. The results also implied that CG might be beneficial for diabetics as a dietary supplement. As far as we know, it is the first time to study the hypoglycemic effect of CIA.

4. Conclusions

In this study, the HPLC fingerprint of CG and CI is significantly different and can be easily and quickly distinguished. Comparison of metabolic profiles between CG and CI by HPLC-QTOF-MS clarified that CG is rich in phenolic acids, organic acids and derivatives, fatty acids, and flavonoids, while the contents of terpenoids and steroids are higher in CI. Although the types of chemicals they contain are overlapping, there are significant differences in the content of several components. Higher contents of 15-deoxylactucin-8-sulfate and 8-deacetylmatricarin-8-O-sulfate in CI and kaempferol-3-O-glucuronoside and caffeic acid-hexoside in CG might be used for rapid identification of them from each other. In terms of pharmacodynamics comparison, CG possesses better hypoglycemic activity, while CI is better at antioxidant effects. Taken above, in consideration of functional food product development, CG is more suitable for hypoglycemic or obesity-alleviating products, while CI can be used in the development of hepatoprotective products. However, further understanding of CG and CI’s hepatoprotective and hypoglycemic activities is needed in more animal models and even clinical trials for their further application. Additionally, the differential compounds between CG and CI may also contribute to their difference in multiple bioactivities, which also provides a novel interest for investigating the bioactivity of the compounds CG and CI in various aspects in future.

Supplementary Materials

The following supporting information can be downloaded at: https://www.mdpi.com/article/10.3390/foods12040901/s1, Table S1: Sources of materials tested; Table S2: Relative retention time of common peaks in replicate experiments; Table S3: Relative peak area of common peaks in replicate experiments; Table S4: Precision experiment common peak relative retention time; Table S5: Precision experiment common peak relative peak area; Table S6: Relative retention time of common peaks in stability experiments; Table S7: Stability experiment common peak relative peak area; Figure S1: The base peak chromatograms (BPCs) in negative mode CI (A) and CG (B); Figure S2: Scavenging abilities (%) of CG and CI at different concentrations, determined by DPPH assay. L(+)-ascorbic acid (Vc); Figure S3: Scavenging abilities (%) of CG and CI at different concentrations, determined by DPPH assay. L(+)-ascorbic acid (Vc); Figure S4: Inhibitory effects of CG and CI on α-glucosidase activities; Figure S5: Purity determination of the components obtained from preparative HPLC. (A) CGA peak with >95% purity (UV 258 nm); (B) HPLC analysis of CG after removal of CGA; (C) HPLC analysis of CG; (D) CIA peak with >80% purity (UV 258 nm); (E) HPLC analysis of CI after removal of CIA; F: HPLC analysis of CI.

Author Contributions

M.L. and G.X. contributed equally to this work. Conceptualization, M.L., G.X. and Y.D.; methodology, M.L., G.X., J.M., Q.L., Y.W., Z.P., J.S. (Jianbo Sun) and J.S. (Jing Shang); software, M.L.; validation, M.L.; investigation, M.L., G.X., Y.D. and Q.L.; resources, data curation, M.L., J.M., Z.P., J.S. (Jianbo Sun) and J.S. (Jing Shang); writing—original draft preparation, M.L., G.X. and Y.D.; writing—review and editing, J.S. (Jing Shang); supervision, Y.W.; funding acquisition, J.S. (Jing Shang). All authors have read and agreed to the published version of the manuscript.

Funding

This study was supported by the National Science Technology Major Project of China (No. 2019ZX09301-156).

Institutional Review Board Statement

All the animal experiments were approved by Ethical Committee of China Pharmaceutical University (SYXK(SU)2021-0010) and Laboratory Animal Management Committee of Jiangsu Province. All the experiments followed the Jiangsu Provincial standard ethical guidelines in using experimental animals under the ethical committees mentioned above.

Data Availability Statement

The data presented in this study are available upon request from the corresponding authors.

Conflicts of Interest

The authors declare no conflict of interest.

References

  1. China Pharmacopoeia Committee. Pharmacopoeia of the People’s Republic of China; Chemical Industry Press: Beijing, China, 2015.
  2. Perović, J.; Tumbas Šaponjac, V.; Kojić, J.; Krulj, J.; Moreno, D.A.; García-Viguera, C.; Bodroža-Solarov, M.; Ilić, N. Chicory (Cichorium Intybus L.) as a Food Ingredient—Nutritional Composition, Bioactivity, Safety, and Health Claims: A Review. Food Chem. 2021, 336, 127676. [Google Scholar] [CrossRef] [PubMed]
  3. Muthusamy, V.S.; Anand, S.; Sangeetha, K.N.; Sujatha, S.; Arun, B.; Lakshmi, B.S. Tannins Present in Cichorium Intybus Enhance Glucose Uptake and Inhibit Adipogenesis in 3T3-L1 Adipocytes through PTP1B Inhibition. Chem. Biol. Interact. 2008, 174, 69–78. [Google Scholar] [CrossRef] [PubMed]
  4. Nishimura, M.; Ohkawara, T.; Kanayama, T.; Kitagawa, K.; Nishimura, H.; Nishihira, J. Effects of the Extract from Roasted Chicory (Cichorium Intybus L.) Root Containing Inulin-Type Fructans on Blood Glucose, Lipid Metabolism, and Fecal Properties. J. Tradit. Complement. Med. 2015, 5, 161–167. [Google Scholar] [CrossRef] [PubMed] [Green Version]
  5. Jackson, K.M.P.; Rathinasabapathy, T.; Esposito, D.; Komarnytsky, S. Structural Constraints and Importance of Caffeic Acid Moiety for Anti-Hyperglycemic Effects of Caffeoylquinic Acids from Chicory. Mol. Nutr. Food Res. 2017, 61, 1601118. [Google Scholar] [CrossRef] [PubMed]
  6. Heimler, D.; Isolani, L.; Vignolini, P.; Romani, A. Polyphenol Content and Antiradical Activity of Cichorium Intybus L. from Biodynamic and Conventional Farming. Food Chem. 2009, 114, 765–770. [Google Scholar] [CrossRef]
  7. Tong, J.; Yao, X.; Zeng, H.; Zhou, G.; Chen, Y.; Ma, B.; Wang, Y. Hepatoprotective Activity of Flavonoids from Cichorium Glandulosum Seeds in Vitro and in Vivo Carbon Tetrachloride-Induced Hepatotoxicity. J. Ethnopharmacol. 2015, 174, 355–363. [Google Scholar] [CrossRef]
  8. Nwafor, I.C.; Shale, K.; Achilonu, M.C. Chemical Composition and Nutritive Benefits of Chicory (Cichorium Intybus) as an Ideal Complementary and/or Alternative Livestock Feed Supplement. Sci. World J. 2017, 2017, 7343928. [Google Scholar] [CrossRef] [Green Version]
  9. Ding, L.; Liu, J.-L.; Hassan, W.; Wang, L.-L.; Yan, F.-R.; Shang, J. Lipid Modulatory Activities of Cichorium Glandulosum Boiss et Huet Are Mediated by Multiple Components within Hepatocytes. Sci. Rep. 2014, 4, 4715. [Google Scholar] [CrossRef] [Green Version]
  10. Tong, J.; Ma, B.; Ge, L.; Mo, Q.; Zhou, G.; He, J.; Wang, Y. Dicaffeoylquinic Acid-Enriched Fraction of Cichorium Glandulosum Seeds Attenuates Experimental Type 1 Diabetes via Multipathway Protection. J. Agric. Food Chem. 2015, 63, 10791–10802. [Google Scholar] [CrossRef]
  11. Saggu, S.; Sakeran, M.I.; Zidan, N.; Tousson, E.; Mohan, A.; Rehman, H. Ameliorating Effect of Chicory (Chichorium Intybus L.) Fruit Extract against 4-Tert-Octylphenol Induced Liver Injury and Oxidative Stress in Male Rats. Food Chem. Toxicol. Int. J. Publ. Br. Ind. Biol. Res. Assoc. 2014, 72, 138–146. [Google Scholar] [CrossRef]
  12. Abbas, Z.K.; Saggu, S.; Sakeran, M.I.; Zidan, N.; Rehman, H.; Ansari, A.A. Phytochemical, Antioxidant and Mineral Composition of Hydroalcoholic Extract of Chicory (Cichorium Intybus L.) Leaves. Saudi J. Biol. Sci. 2015, 22, 322–326. [Google Scholar] [CrossRef] [PubMed] [Green Version]
  13. Lv, X.; Feng, S.; Zhang, J.; Sun, S.; Geng, Y.; Yang, M.; Liu, Y.; Qin, L.; Zhao, T.; Wang, C.; et al. Application of HPLC Fingerprint Combined with Chemical Pattern Recognition and Multi-Component Determination in Quality Evaluation of Echinacea Purpurea (L.) Moench. Molecules 2022, 27, 6463. [Google Scholar] [CrossRef] [PubMed]
  14. Fragallah, S.A.D.A.; Wang, P.; Li, N.; Chen, Y.; Lin, S. Metabolomic Analysis of Pollen Grains with Different Germination Abilities from Two Clones of Chinese Fir (Cunninghamia Lanceolata (Lamb) Hook). Molecules 2018, 23, 3162. [Google Scholar] [CrossRef] [Green Version]
  15. Wang, M.; Li, Y.; Huang, Y.; Tian, Y.; Xu, F.; Zhang, Z. Chemomic and Chemometric Approach Based on Ultra-Fast Liquid Chromatography with Ion Trap Time-of-Flight Mass Spectrometry to Reveal the Difference in the Chemical Composition between Da-Cheng-Qi Decoction and Its Three Constitutional Herbal Medicines. J. Sep. Sci. 2014, 37, 1148–1154. [Google Scholar] [CrossRef] [PubMed]
  16. Kind, T.; Tsugawa, H.; Cajka, T.; Ma, Y.; Lai, Z.; Mehta, S.S.; Wohlgemuth, G.; Barupal, D.K.; Showalter, M.R.; Arita, M.; et al. Identification of Small Molecules Using Accurate Mass MS/MS Search. Mass Spectrom. Rev. 2018, 37, 513–532. [Google Scholar] [CrossRef]
  17. Cichon, M.J.; Riedl, K.M.; Schwartz, S.J. A Metabolomic Evaluation of the Phytochemical Composition of Tomato Juices Being Used in Human Clinical Trials. Food Chem. 2017, 228, 270–278. [Google Scholar] [CrossRef] [PubMed]
  18. Burits, M.; Bucar, F. Antioxidant Activity of Nigella Sativa Essential Oil. Phytother. Res. PTR 2000, 14, 323–328. [Google Scholar] [CrossRef] [PubMed]
  19. Mor, M.; Silva, C.; Vacondio, F.; Plazzi, P.V.; Bertoni, S.; Spadoni, G.; Diamantini, G.; Bedini, A.; Tarzia, G.; Zusso, M.; et al. Indole-Based Analogs of Melatonin: In Vitro Antioxidant and Cytoprotective Activities. J. Pineal Res. 2004, 36, 95–102. [Google Scholar] [CrossRef]
  20. Wang, L.; Chen, C.; Zhang, B.; Huang, Q.; Fu, X.; Li, C. Structural Characterization of a Novel Acidic Polysaccharide from Rosa Roxburghii Tratt Fruit and Its α-Glucosidase Inhibitory Activity. Food Funct. 2018, 9, 3974–3985. [Google Scholar] [CrossRef]
  21. Ma, J.; Li, M.; Kalavagunta, P.K.; Li, J.; He, Q.; Zhang, Y.; Ahmad, O.; Yin, H.; Wang, T.; Shang, J. Protective Effects of Cichoric Acid on H2O2-Induced Oxidative Injury in Hepatocytes and Larval Zebrafish Models. Biomed. Pharmacother. Biomedecine Pharmacother. 2018, 104, 679–685. [Google Scholar] [CrossRef]
  22. Sannasimuthu, A.; Arockiaraj, J. Intracellular Free Radical Scavenging Activity and Protective Role of Mammalian Cells by Antioxidant Peptide from Thioredoxin Disulfide Reductase of Arthrospira Platensis. J. Funct. Foods 2019, 61, 103513. [Google Scholar] [CrossRef]
  23. Liu, J.; Li, Q.; Tan, R. Comparison of the Hypoglycemic Effect of the Aqueous Extract of Moras Folium and Gynostemma Pentaphyllum Leaves of Zebrafish as A Model. China Tea Process. 2014, 4, 74–82. [Google Scholar] [CrossRef]
  24. Li, M.; Ma, J.; Ahmad, O.; Cao, Y.; Wang, B.; He, Q.; Li, J.; Yin, H.; Zhang, Y.; He, J.; et al. Lipid-Modulate Activity of Cichorium Glandulosum Boiss. et Huet Polysaccharide in Nonalcoholic Fatty Liver Disease Larval Zebrafish Model. J. Pharmacol. Sci. 2018, 138, 257–262. [Google Scholar] [CrossRef] [PubMed]
  25. Dou, Z.; Dai, Y.; Zhou, Y.; Wang, S. Quality Evaluation of Rhubarb Based on Qualitative Analysis of the HPLC Fingerprint and UFLC-Q-TOF-MS/MS Combined with Quantitative Analysis of Eight Anthraquinone Glycosides by QAMS. Biomed. Chromatogr. BMC 2021, 35, e5074. [Google Scholar] [CrossRef] [PubMed]
  26. Wang, X.J.; Ren, J.L.; Zhang, A.H.; Sun, H.; Yan, G.L.; Han, Y.; Liu, L. Novel Applications of Mass Spectrometry-Based Metabolomics in Herbal Medicines and Its Active Ingredients: Current Evidence. Mass Spectrom. Rev. 2019, 38, 380–402. [Google Scholar] [CrossRef] [PubMed]
  27. Worley, B.; Powers, R. PCA as a Practical Indicator of OPLS-DA Model Reliability. Curr. Metabolomics 2016, 4, 97–103. [Google Scholar] [CrossRef] [Green Version]
  28. Rashid, A.; Ali, V.; Khajuria, M.; Faiz, S.; Gairola, S.; Vyas, D. GC-MS Based Metabolomic Approach to Understand Nutraceutical Potential of Cannabis Seeds from Two Different Environments. Food Chem. 2021, 339, 128076. [Google Scholar] [CrossRef] [PubMed]
  29. Meng, Y.; Su, A.; Yuan, S.; Zhao, H.; Tan, S.; Hu, C.; Deng, H.; Guo, Y. Evaluation of Total Flavonoids, Myricetin, and Quercetin from Hovenia Dulcis Thunb. As Inhibitors of α-Amylase and α-Glucosidase. Plant Foods Hum. Nutr. Dordr. Neth. 2016, 71, 444–449. [Google Scholar] [CrossRef]
  30. Issac, P.K.; Guru, A.; Velayutham, M.; Pachaiappan, R.; Arasu, M.V.; Al-Dhabi, N.A.; Choi, K.C.; Harikrishnan, R.; Arockiaraj, J. Oxidative Stress Induced Antioxidant and Neurotoxicity Demonstrated in Vivo Zebrafish Embryo or Larval Model and Their Normalization Due to Morin Showing Therapeutic Implications. Life Sci. 2021, 283, 119864. [Google Scholar] [CrossRef]
  31. Li, Y.; Chen, Q.; Liu, Y.; Bi, L.; Jin, L.; Xu, K.; Peng, R. High Glucose-Induced ROS-Accumulation in Embryo-Larval Stages of Zebrafish Leads to Mitochondria-Mediated Apoptosis. Apoptosis Int. J. Program. Cell Death 2022, 27, 509–520. [Google Scholar] [CrossRef]
  32. He, Y.; Li, W.; Zheng, Z.; Zhao, L.; Li, W.; Wang, Y.; Li, H. Inhibition of Protein Arginine Methyltransferase 6 Reduces Reactive Oxygen Species Production and Attenuates Aminoglycoside- and Cisplatin-Induced Hair Cell Death. Theranostics 2020, 10, 133–150. [Google Scholar] [CrossRef]
  33. Deng, Y.; Ma, J.; Weng, X.; Wang, Y.; Li, M.; Yang, T.; Dou, Z.; Yin, Z.; Shang, J. Kaempferol-3-O-Glucuronide Ameliorates Non-Alcoholic Steatohepatitis in High-Cholesterol-Diet-Induced Larval Zebrafish and HepG2 Cell Models via Regulating Oxidation Stress. Life 2021, 11, 445. [Google Scholar] [CrossRef] [PubMed]
  34. Uzun, Y.; Dalar, A.; Konczak, I. Sempervivum Davisii: Phytochemical Composition, Antioxidant and Lipase-Inhibitory Activities. Pharm. Biol. 2017, 55, 532–540. [Google Scholar] [CrossRef] [PubMed] [Green Version]
  35. Yin, P.; Wang, Y.; Yang, L.; Sui, J.; Liu, Y. Hypoglycemic Effects in Alloxan-Induced Diabetic Rats of the Phenolic Extract from Mongolian Oak Cups Enriched in Ellagic Acid, Kaempferol and Their Derivatives. Molecules 2018, 23, 1046. [Google Scholar] [CrossRef] [PubMed] [Green Version]
Figure 1. HPLC fingerprints of CG and CI. (A) CG reference fingerprint chromatogram (CGR) and 24 common peaks; (B) CI reference fingerprint chromatogram (CIR); (C) HPLC fingerprints of CG; (D) HPLC fingerprints of CI; (E) HPLC fingerprints of CI compared to CGR; (F) HPLC fingerprints of CG compared to CIR.
Foods 12 00901 g001
Figure 2. The multivariate analysis of metabolites in CG and CI. (A) Principle component analysis (PCA) plot; (B) score scatter plot of the OPLS-DA model; (C) volcano plot of differential metabolites; (D) differential comparison of metabolite intensity; (E) heat map of CG and CI. Significantly up- and downregulated metabolites are indicated in red and green, respectively. Those without significant difference between the two groups are indicated in grey. A greater absolute value on the horizontal axis indicates a greater foldchange between CG and CI. A greater value on the vertical axis indicates greater significance.
Foods 12 00901 g002
Figure 3. Correlation analysis between activities in vitro and abundance of compounds in CG and CI. (A) Comparison of antioxidant activities and hypoglycemic activities between CG and CI evaluated by IC50. ns p > 0.05, * p < 0.05 compared with CI. (B) The peak intensity of TOP10 components. (C) Spearman’s correlation coefficients to each bioactive compound detected by HPLC. * p < 0.05, ** p < 0.01 compared with peak intensity.
Foods 12 00901 g003
Figure 4. Effect of CGA and CIA on antioxidative and hypoglycemic activities in larval zebrafish. (A) Experimental outline of H2O2 induced larval zebrafish. (B) Experimental outline of GLU+ALX induced larval zebrafish. (C) ROS production showed in fluorescence image and merged with light field image. (D) ROS level quantitated by fluorescence quantitative data. (E) Glucose levels of each treated larval group. Bar indicates means ± SD. **** p < 0.0001 compared with control; ## p < 0.01, ### p < 0.001, #### p < 0.0001 compared with model. p < 0.05 was considered as statistical significance calculated by ANOVA followed by Tukey’s test.
Foods 12 00901 g004
Table 1. Results of similarity evaluation of HPLC fingerprint between Cichorium glandulosum Boiss et. Huet and Cichorium intybus L.
Sample NumberSimilaritySample NumberSimilarity
CGRCIRCIRCGR
CG10.9910.642CI10.7890.521
CG20.9830.600CI20.9460.706
CG30.9160.741CI30.9290.646
CG40.9810.600CI40.9140.588
CG50.9820.614CI50.8010.445
CG60.9730.674CI60.8970.557
CG70.9540.723CI70.9290.839
CG80.9830.679CI80.9460.706
CG90.9000.626CI90.9050.689
CG100.9680.708CI100.8990.626
Table 2. Groups of the compounds identified by HPLC-ESI-Q-TOF-MS in CG and CI.
NO.Compound NameElemental CompositiontR
(min)
Observed
[M-H]-
Product Ions (m/z)Chemical Class
1L-TryptophanC11H12N2O22.36203.0188159.03Amino acid derivatives
2Malic acidC4H6O52.76133.017571.01, 115.00Organic acids and derivatives
3Ferulic acidC10H10O42.79193.0277160.84, 117.02Phenolic acids
4Cis-Aconitic acidC6H6O62.82173.015485.02, 129.04Organic acids and derivatives
5Quinic acidC7H12O62.91191.0225111.00, 127.03, 173.04Phenolic acids
6SuccinateC4H6O43.59117.015959.01, 99.02Organic acids and derivatives
7GentiopicrosideC16H20O93.77355.1281191.01, 177.07Terpenoids
8UmbelliferoneC9H6O33.82161.0450117.05Phenolic acids
9Salvianolic acid AC26H22O105.36493.1242295.06Phenolic acids
10Caftaric acidC13H12O96.91311.0416135.04, 179.03, 87.00Phenolic acids
114-Hydroxyphenylpyruvic acidC9H8O46.92179.0340135.04Phenolic acids
12Phenylacetic acidC8H8O26.99135.044191.05Phenolic acids
13D-tartaric acidC4H6O67.07149.008687.00, 103.01Organic acids and derivatives
14Pyrocatechuic acidC7H6O47.16153.0226109.02Phenolic acids
15Caffeic acid-hexosideC15H18O98.65341.0885179.03, 135.04Phenolic acids
16CichoriinC15H16O98.98339.0759177.01, 133.02Phenolic acids
17IntybulideC15H16O59.19275.0936194.90, 150.90Terpenoids
18Lactupicrin ethylesterC25H28O89.48455.1557275.08Terpenoids
198-OmrthylsenecioylaustricinC21H26O510.57357.0709194.9, 173.0, 217.0Terpenoids
20Chlorogenic acidC16H18O911.03353.0935309.09Phenolic acids
214-Hydroxyphenylacetic acidC8H8O312.01151.0397151.04, 107.05Phenolic acids
22EsculetinC9H6O412.99177.0221133.02,131.01Phenolic acids
23Caffeic acidC9H8O413.31179.0337135.04Phenolic acids
24IrigeninC18H16O813.71359.081596.96Flavonoids
25p-HydroxybenzaldehydeC7H6O213.85121.029493.03Phenolic acids
26Nicotinic acidC6H5NO213.87122.031694.05Phenolic acids
27Cichorioside JC22H28O1014.48451.083259.01, 423.07, 361.01Terpenoids
28Coumaroyl quinic acidC16H18O814.50337.1127191.05Phenolic acids
2915-Oxalyl-lactucinC17H16O814.92347.0851213.09, 257.08, 275.09Terpenoids
30Caffeoylquinic acidC16H18O916.33353.0341191.0, 179.0Phenolic acids
31Cichoric acidC22H18O1217.37473.0713179.03Phenolic acids
3211,13-Dihydro-8-deoxylactucinC15H18O419.94261.1068229.08Terpenoids
33ArtesinC15H22O520.71281.1305201.00Terpenoids
3411β,13-dihydrolactucinC15H18O521.31277.0333260.18Terpenoids
3515-Oxalyl-11β,13-dihydrolactucopicrinC25H24O1121.94483.1583325.05, 179.03Terpenoids
36Myricetin-7-O-(6″-O-malonyl)-glucosideC24H22O1622.00565.1735521.1Flavonoids
3715-Deoxylactucin-8-sulfateC15H16O7S22.81339.058996.96, 79.95Terpenoids
388-Deacetylmatricarin-8-O-sulfateC15H18O7S23.39341.071596.95, 79.95Terpenoids
39Chlorogenic acid BC25H24O1224.99515.1215191.05Phenolic acids
4028β-HydroxytaraxasteC30H52O26.14441.0878277.03, 295.04, 259.03Steroid
41Quercetin-3-O-β-D-GlucuronideC21H18O1326.53477.0717301.03Flavonoids
42Quercetin-3-O-β-D-glucopyranosideC21H20O1227.42463.0915300.02Flavonoids
43RutinC27H30O1627.52609.1516300.02Flavonoids
44Quercetin 3-O-(6″-malonyl-glucoside)C24H22O1529.61549.0928505.09, 300.02Flavonoids
45Quercetin 3-O-(6″-acetyl-glucoside)C23H22O1329.79505.1033301.03, 59.01Flavonoids
46Kaempferol-3-O-glucuronosideC21H18O1233.08461.0787285.04Flavonoids
47Kaempferol-3-O-glucosideC21H20O1133.74447.0956284.03, 285.00Flavonoids
48Azelaic acidC9H16O434.46187.0969125.09Fatty acids
49Syringetin-3-O-glucosideC23H24O1334.72507.1187151.00, 303.05Flavonoids
50Isorhamnetin-7-O-glucosideC22H23O1234.94477.1070314.04Flavonoids
51Isorahmnetin-7-O-glucuronideC22H20O1335.25491.0934315.04Flavonoids
52NarcissosideC28H32O1635.60623.1667315.04, 314.04, 300.02Flavonoids
53NaringinC27H32O1435.81625.1574271.10, 151.00Flavonoids
54Kaempferol-3-O-(6″-O-malonyl)-glucosideC24H22O1437.00533.0981285.03, 489.09Flavonoids
55Lactucopicrin-15-oxalateC25H22O1042.96481.1142213.09, 257.08, 151.03Terpenoids
56β-SitosterolC29H50O45.03413.1624395.07Steroid
5711,13-DihydrolactucopicrinC23H24O745.12411.1515215.10, 151.04Terpenoids
58Lactucopicrin C23H22O745.82409.1385213.09, 257.08, 275.09Terpenoids
59Tricin-3-O-glucosideC23H24O1245.85491.1452329.23, 311.21Flavonoids
Disclaimer/Publisher’s Note: The statements, opinions and data contained in all publications are solely those of the individual author(s) and contributor(s) and not of MDPI and/or the editor(s). MDPI and/or the editor(s) disclaim responsibility for any injury to people or property resulting from any ideas, methods, instructions or products referred to in the content.

