
Effect of Medium Chain Triglycerides on the Digestion and Quality Characteristics of Tea Polyphenols-Fortified Cooked Rice


Abstract
:1. Introduction
2. Materials and Methods
2.1. Materials
2.2. Cooked Rice Samples Preparation
2.3. Surface Porosity
2.4. Texture Profile Analysis (TPA)
2.5. Color
2.6. Water Absorption Rate
2.7. Swelling Ratio
2.8. Differential Scanning Calorimetry (DSC)
2.9. X-ray Diffraction (XRD)
2.10. Fourier-Transform Infrared Spectroscopy (FT-IR)
2.11. Raman Spectroscopy
2.12. Confocal Laser Scanning Microscope (CLSM)
2.13. Scanning Electron Microscopy (SEM)
2.14. Viscoelastic Properties during Digestion
2.15. Fluorescence Quenching during Digestion
2.16. In Vitro Starch Digestion
2.17. Statistical Analysis
3. Results and Discussion
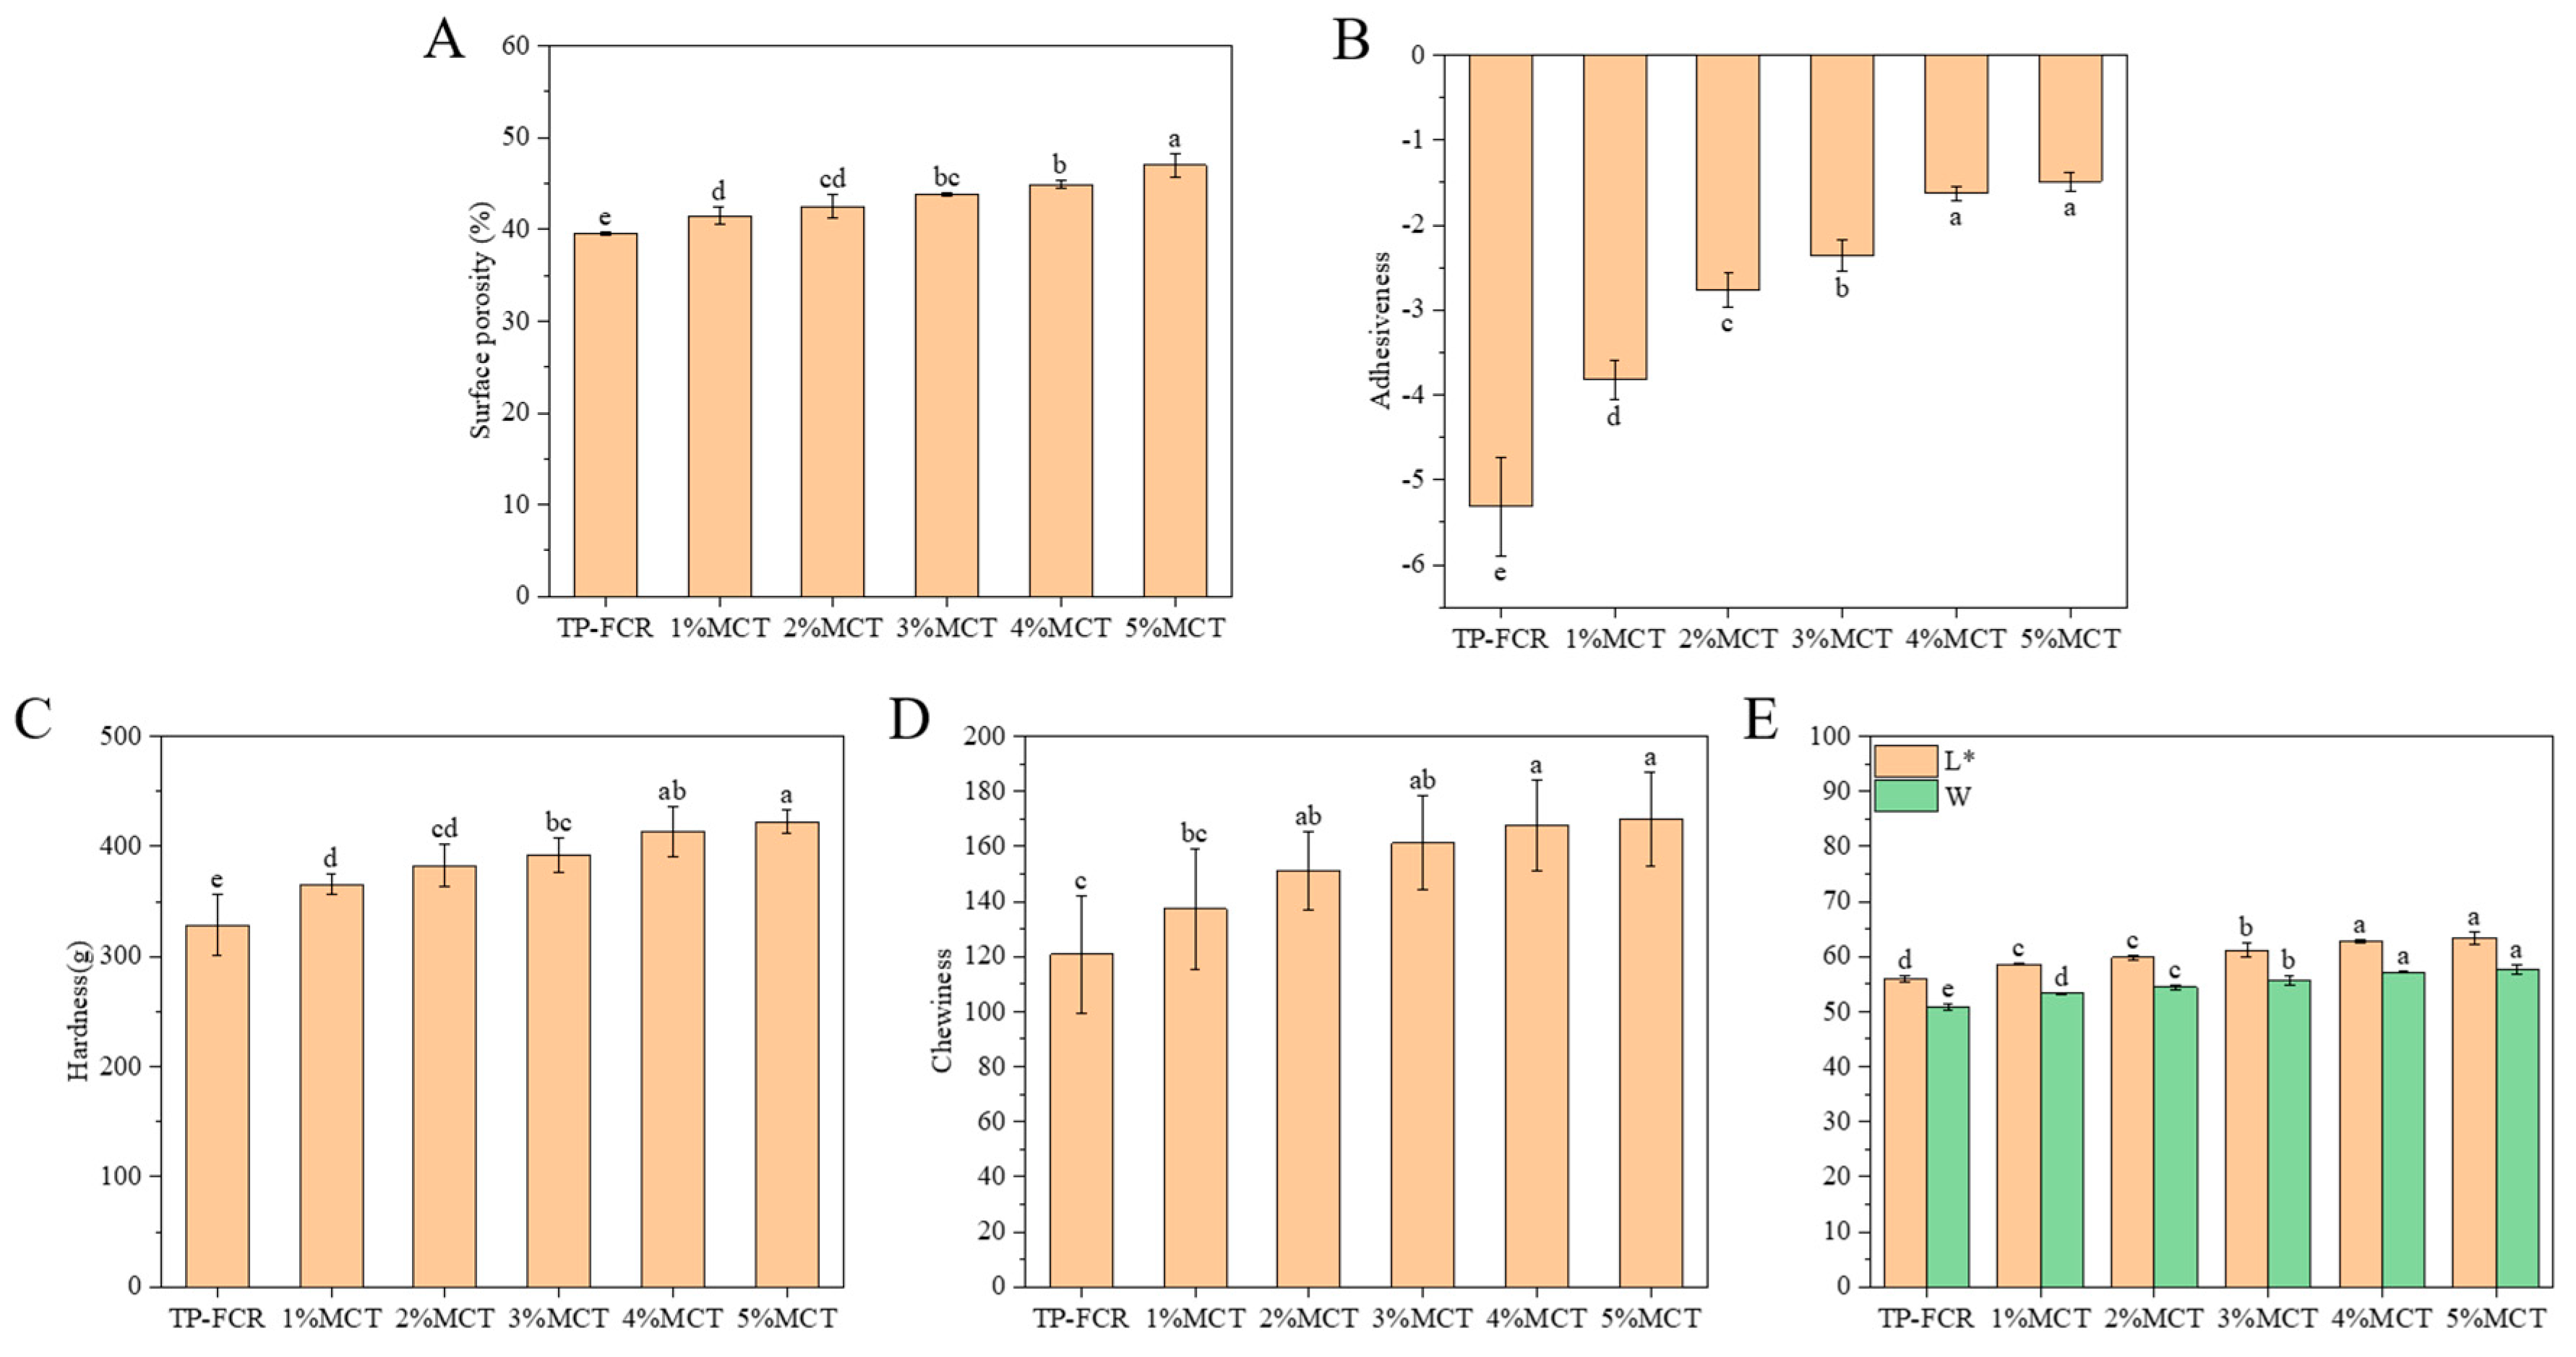
3.1. Surface Porosity, Texture Properties, and Color
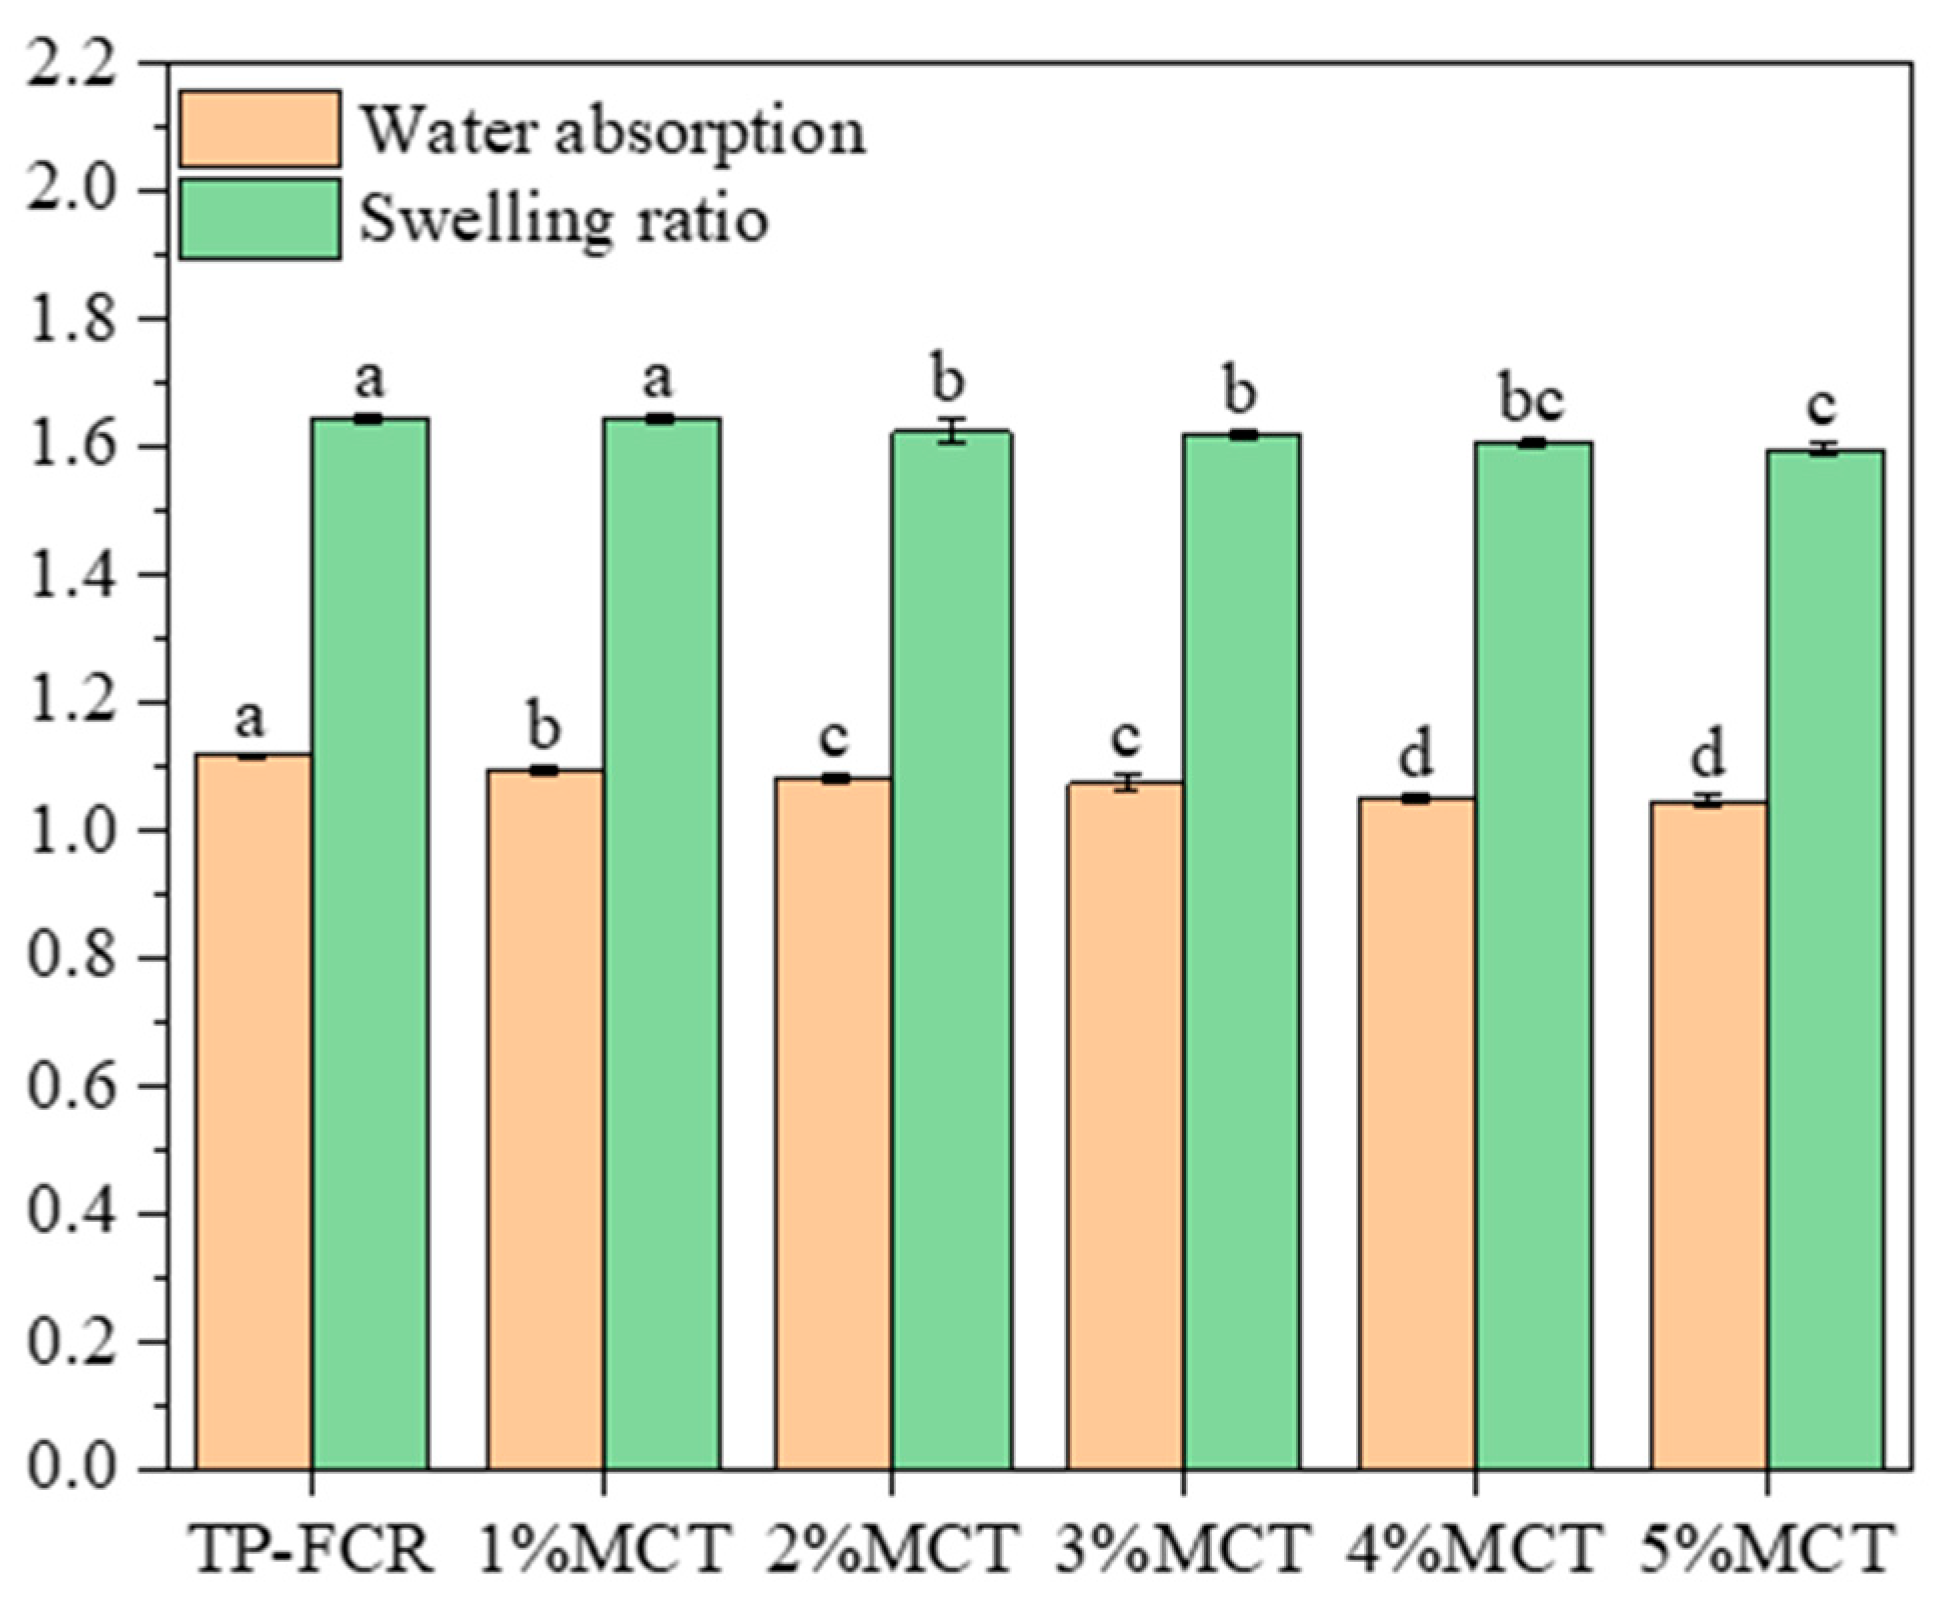
3.2. Water Absorption Rate and Swelling Ratio
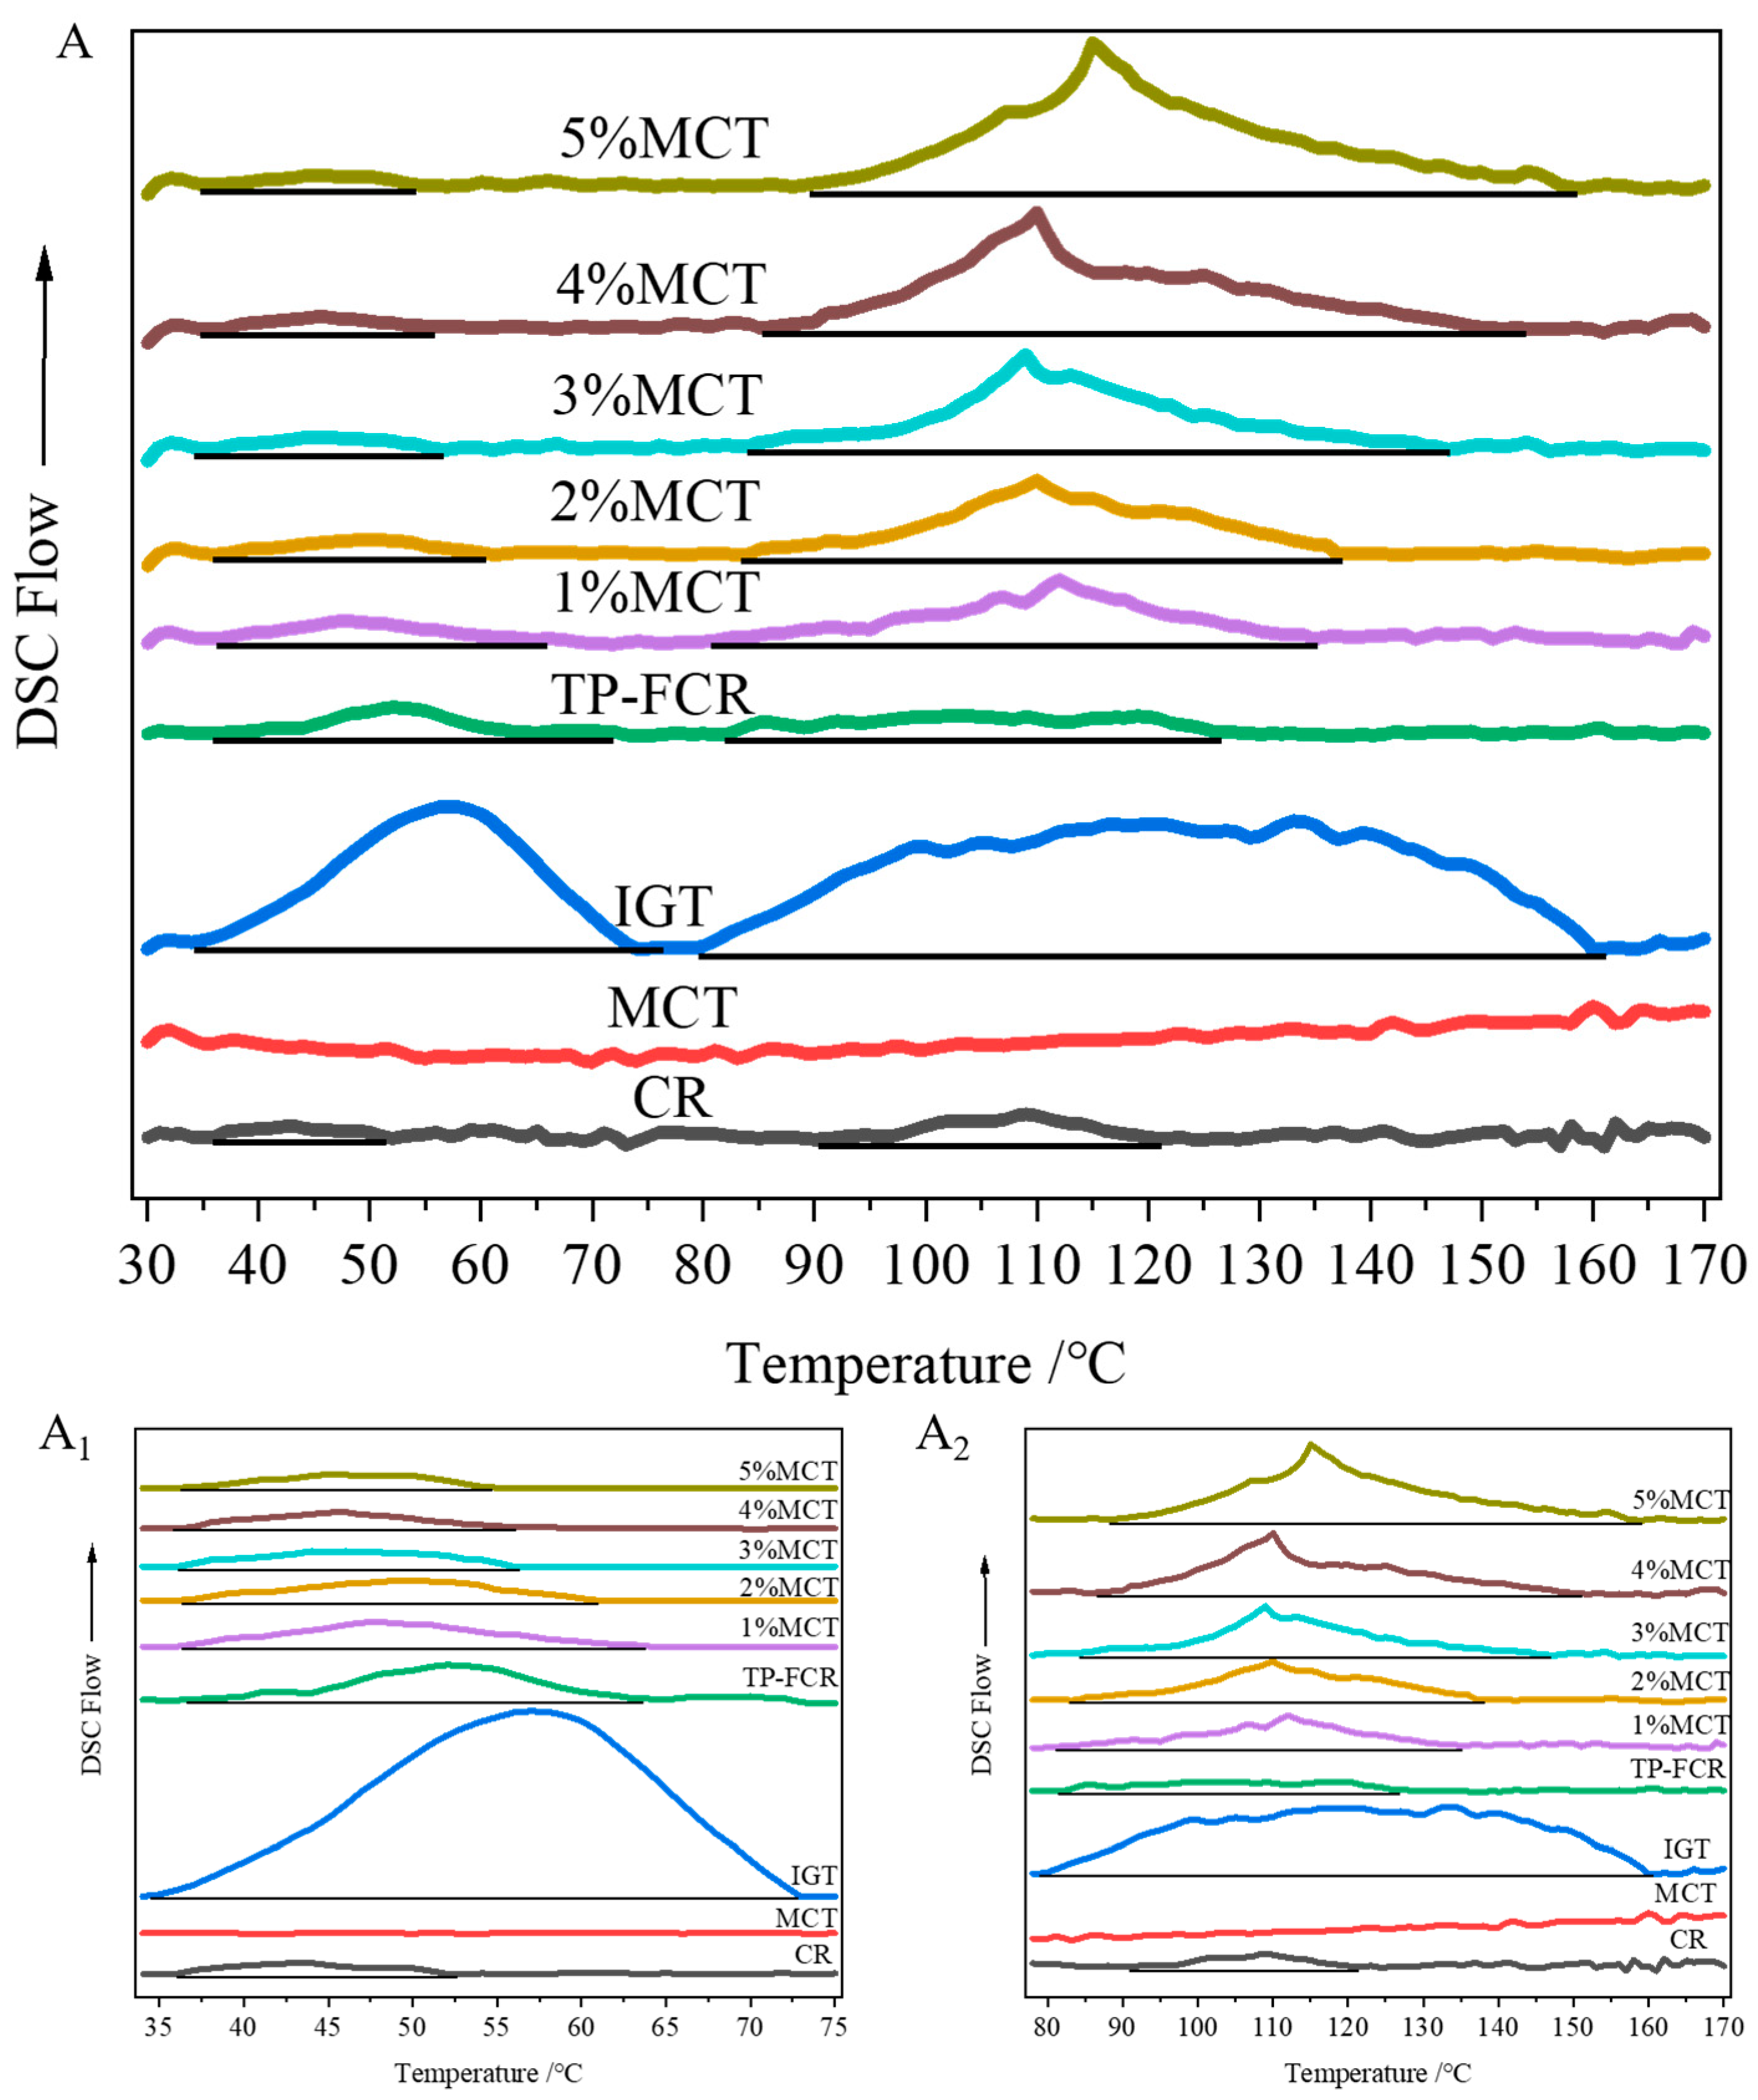
3.3. Thermodynamic Properties
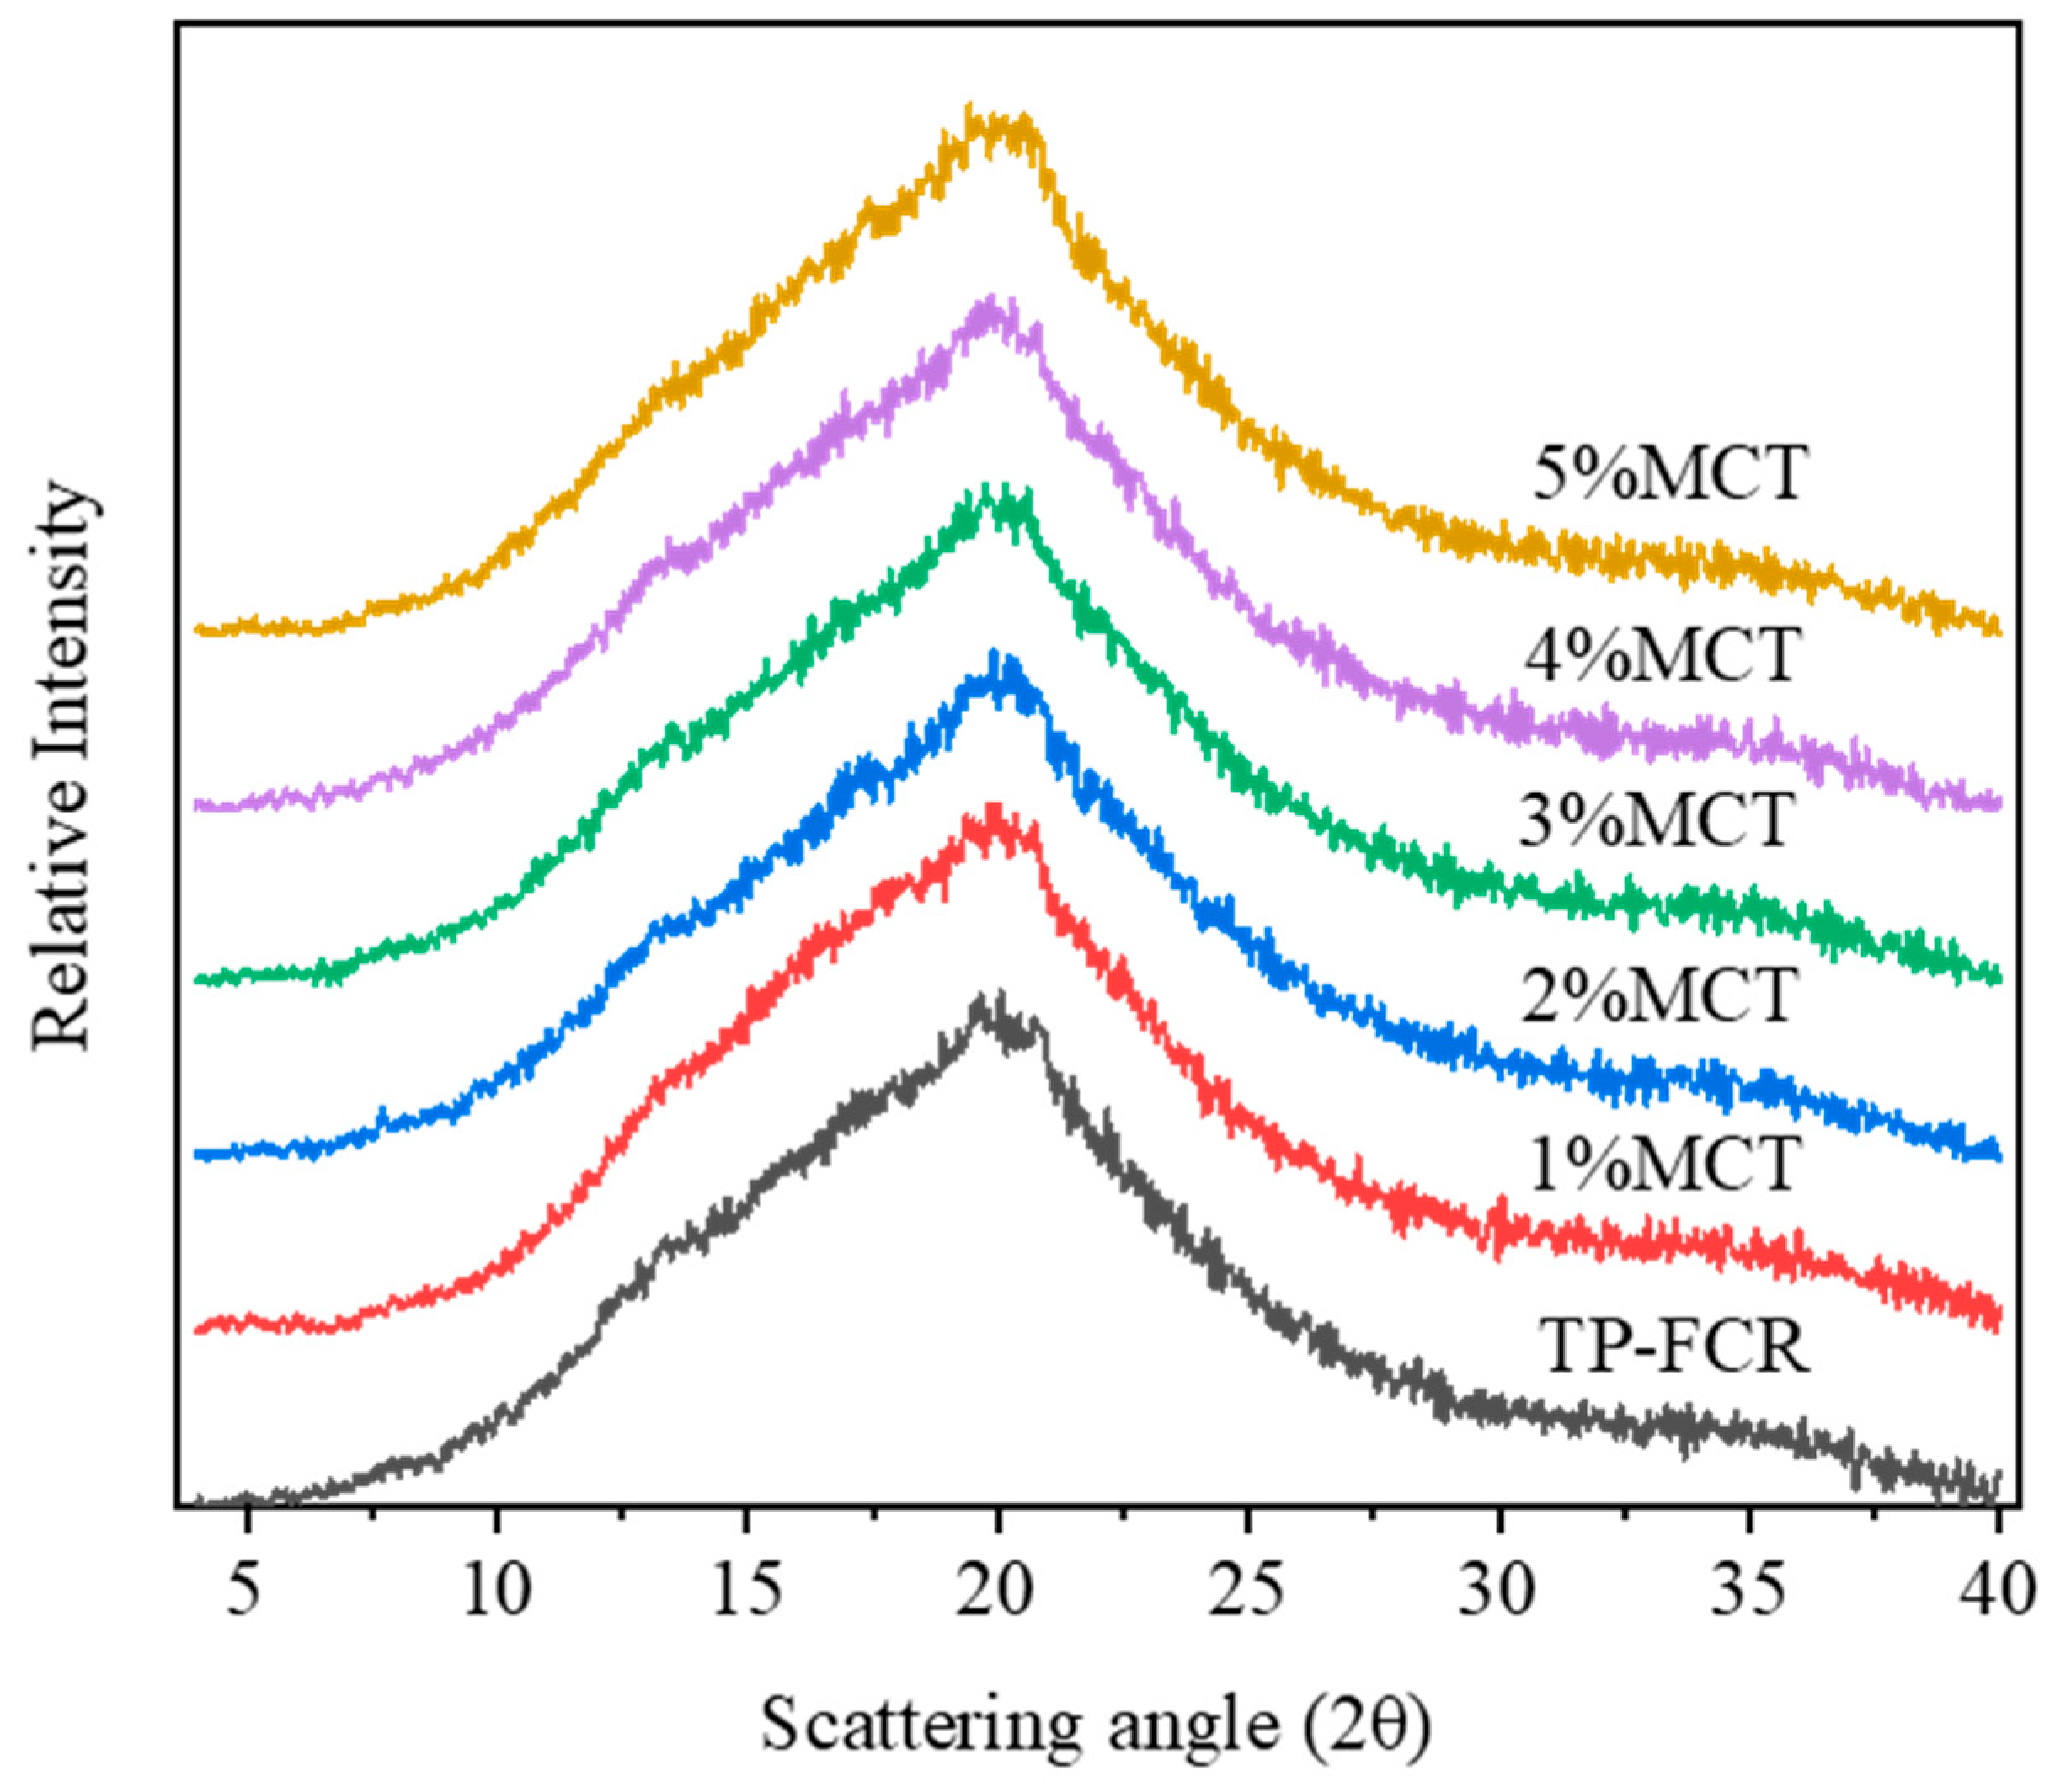
3.4. XRD
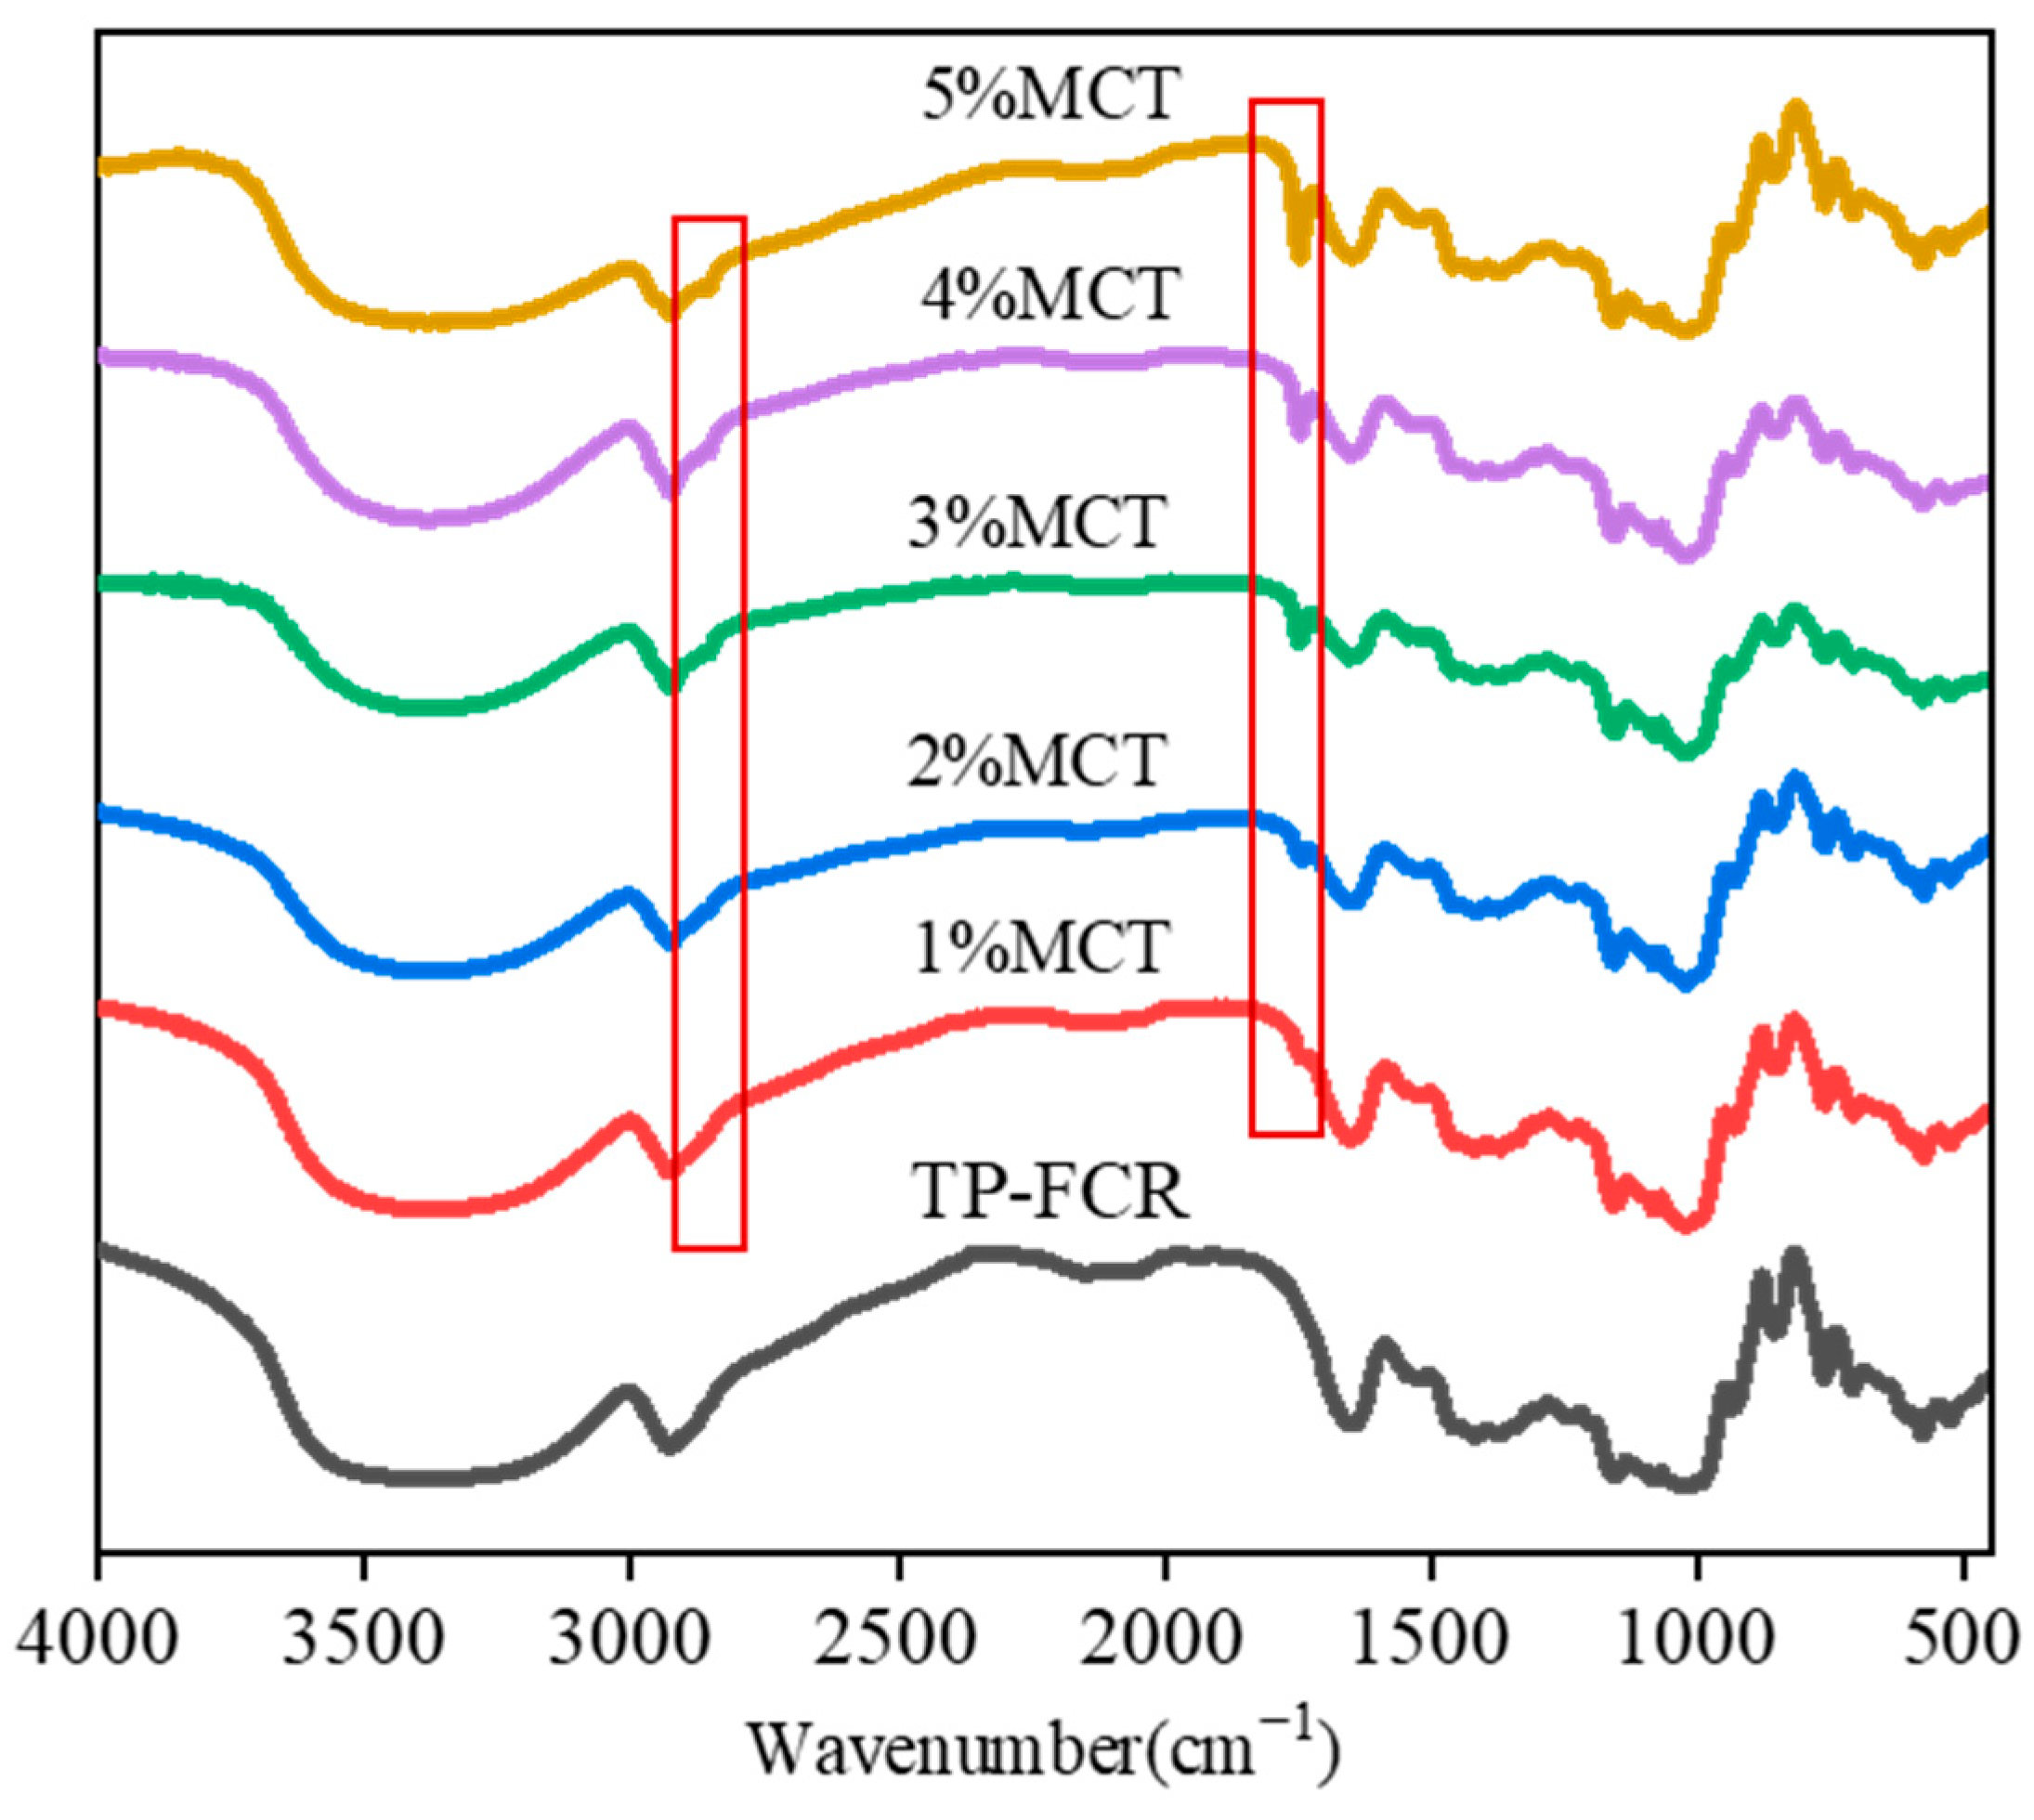
3.5. FT-IR
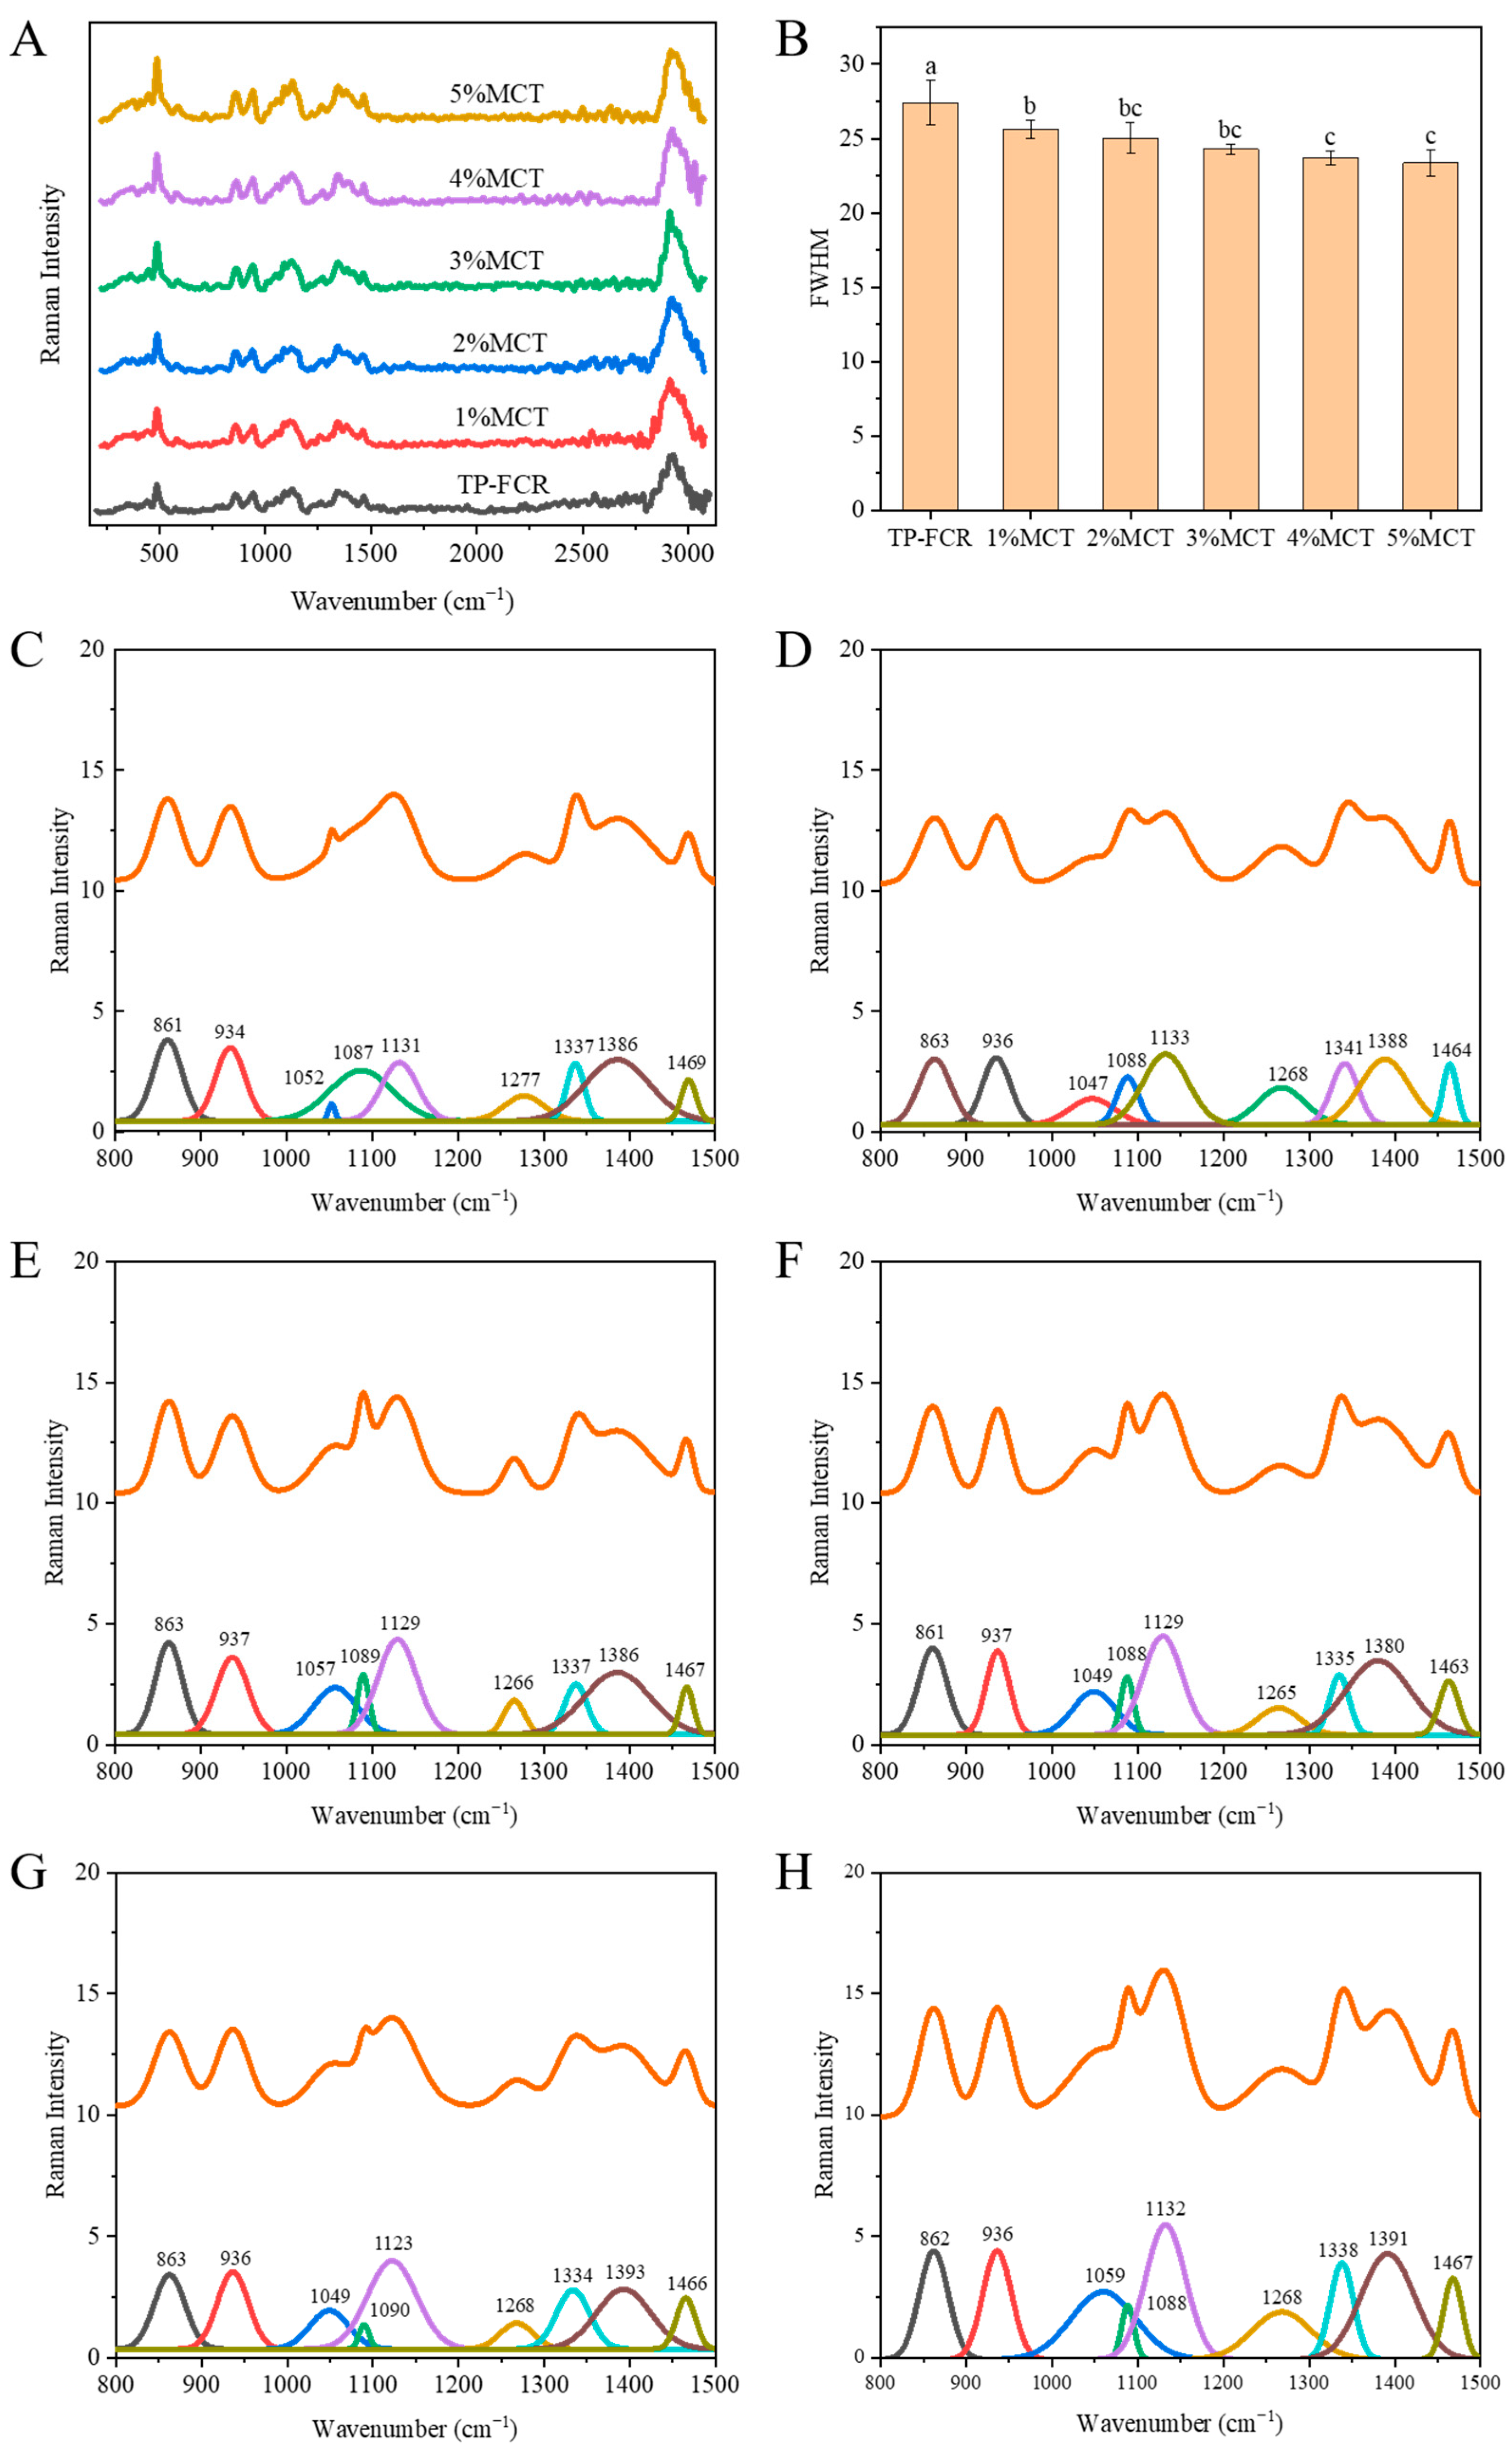
3.6. Raman Spectroscopy
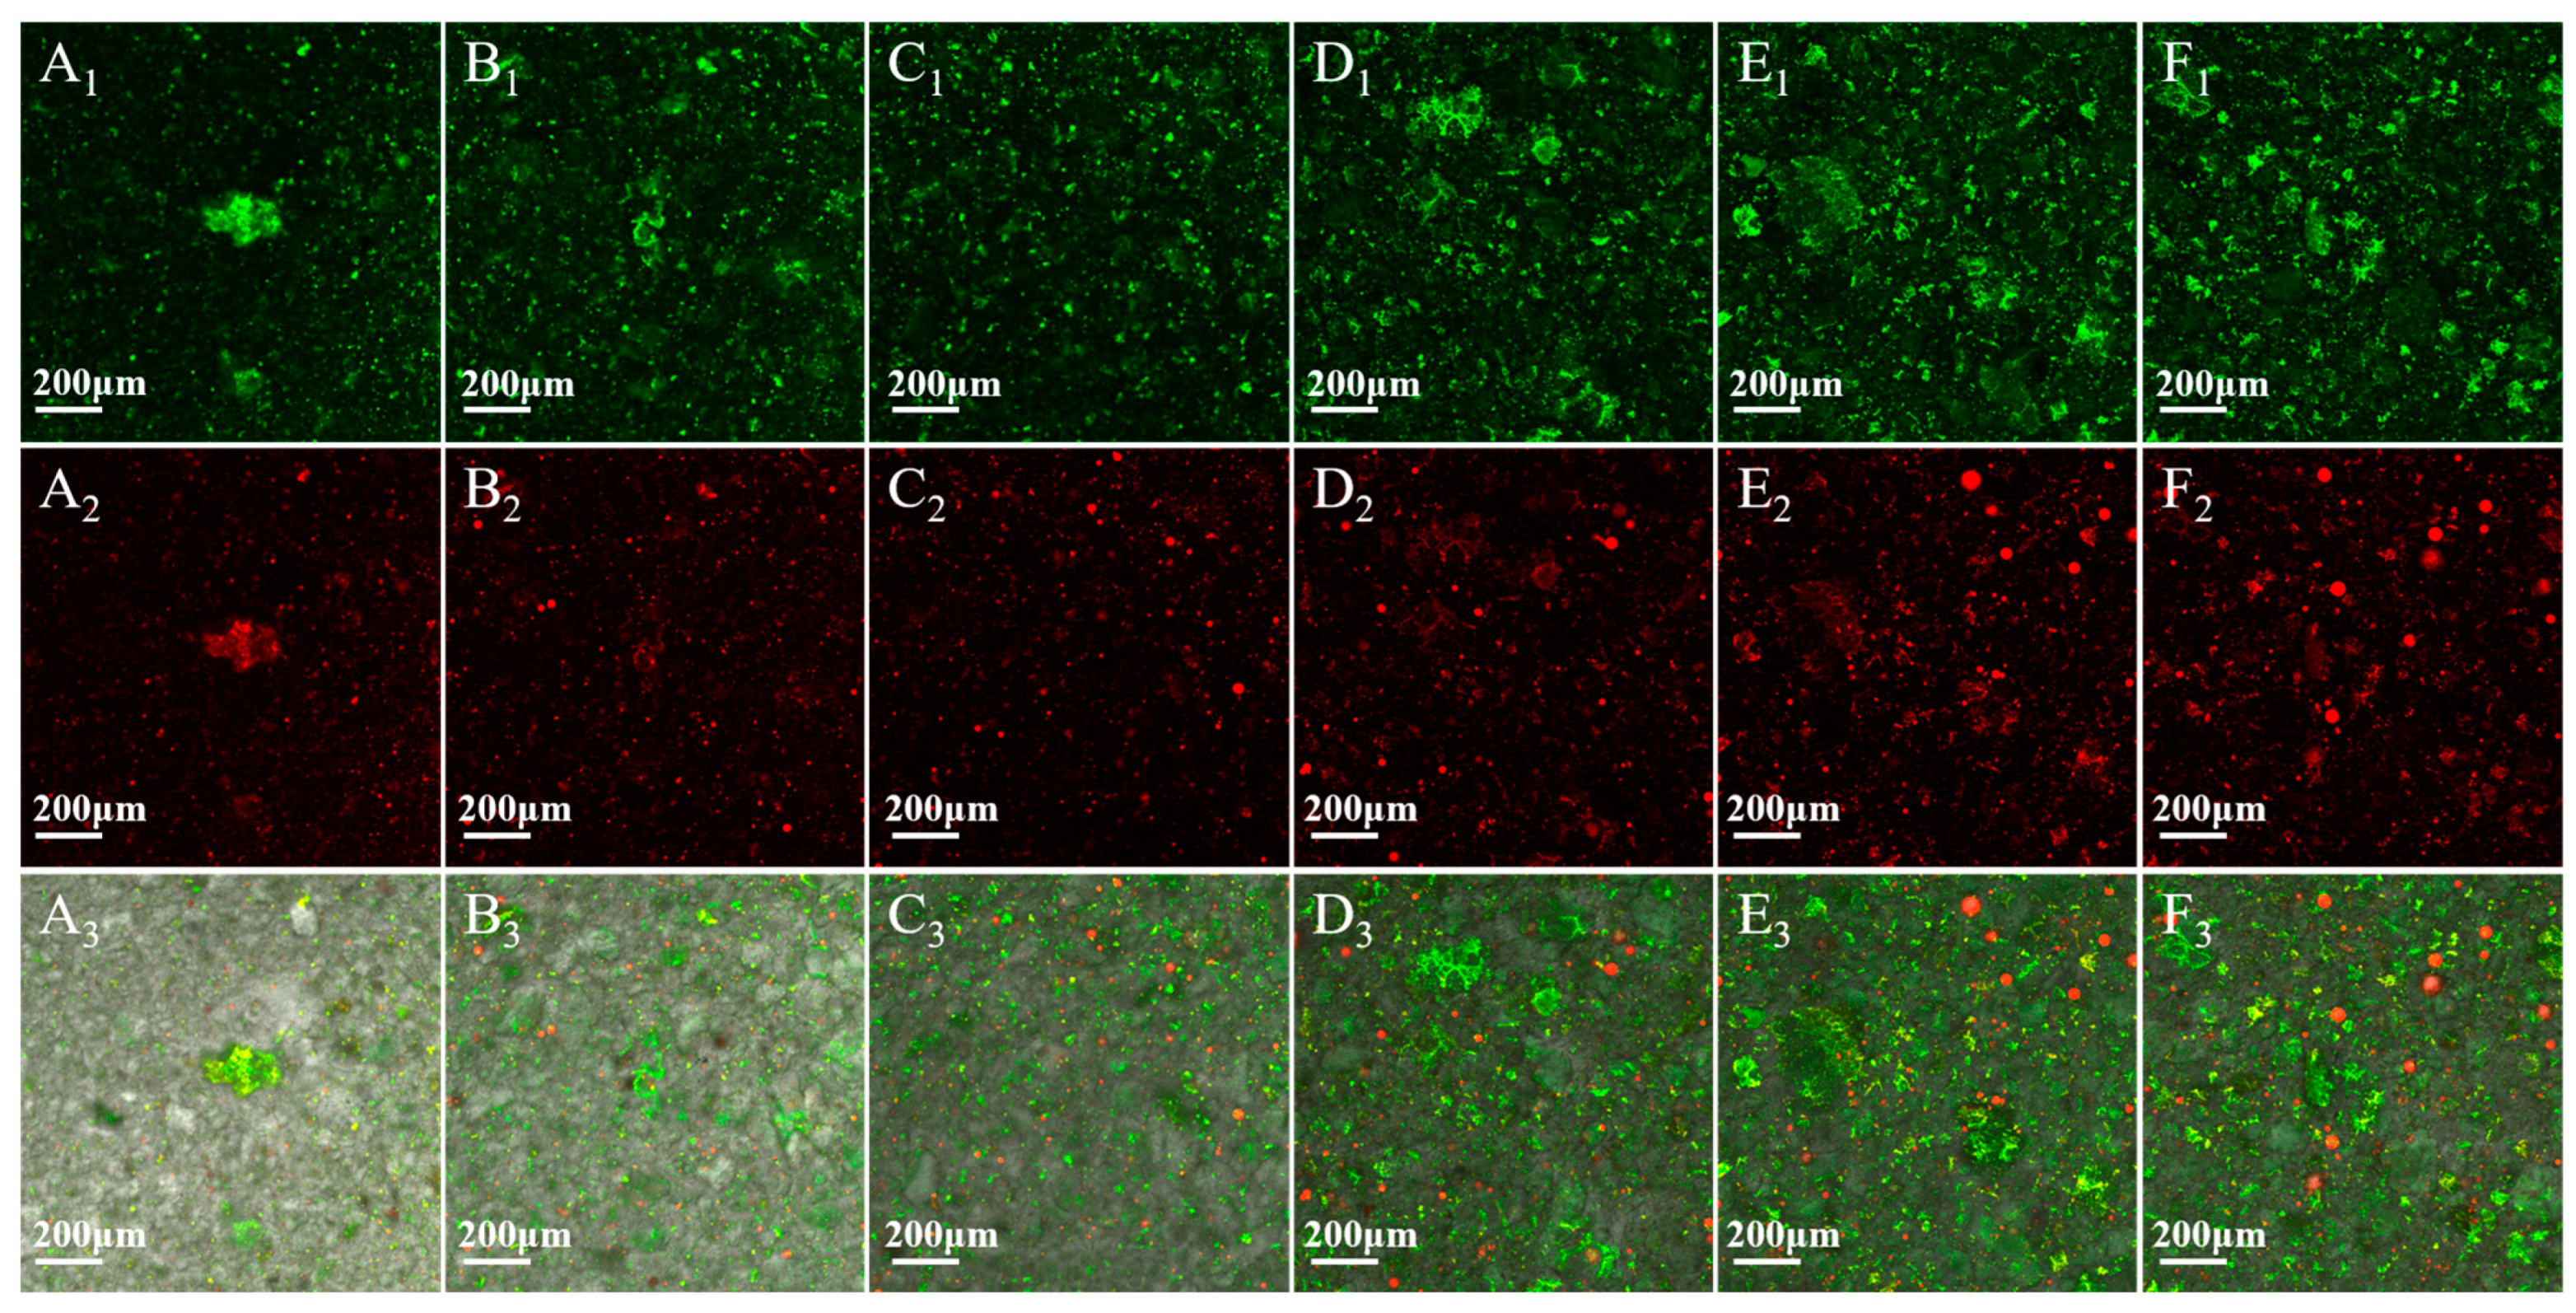
3.7. CLSM
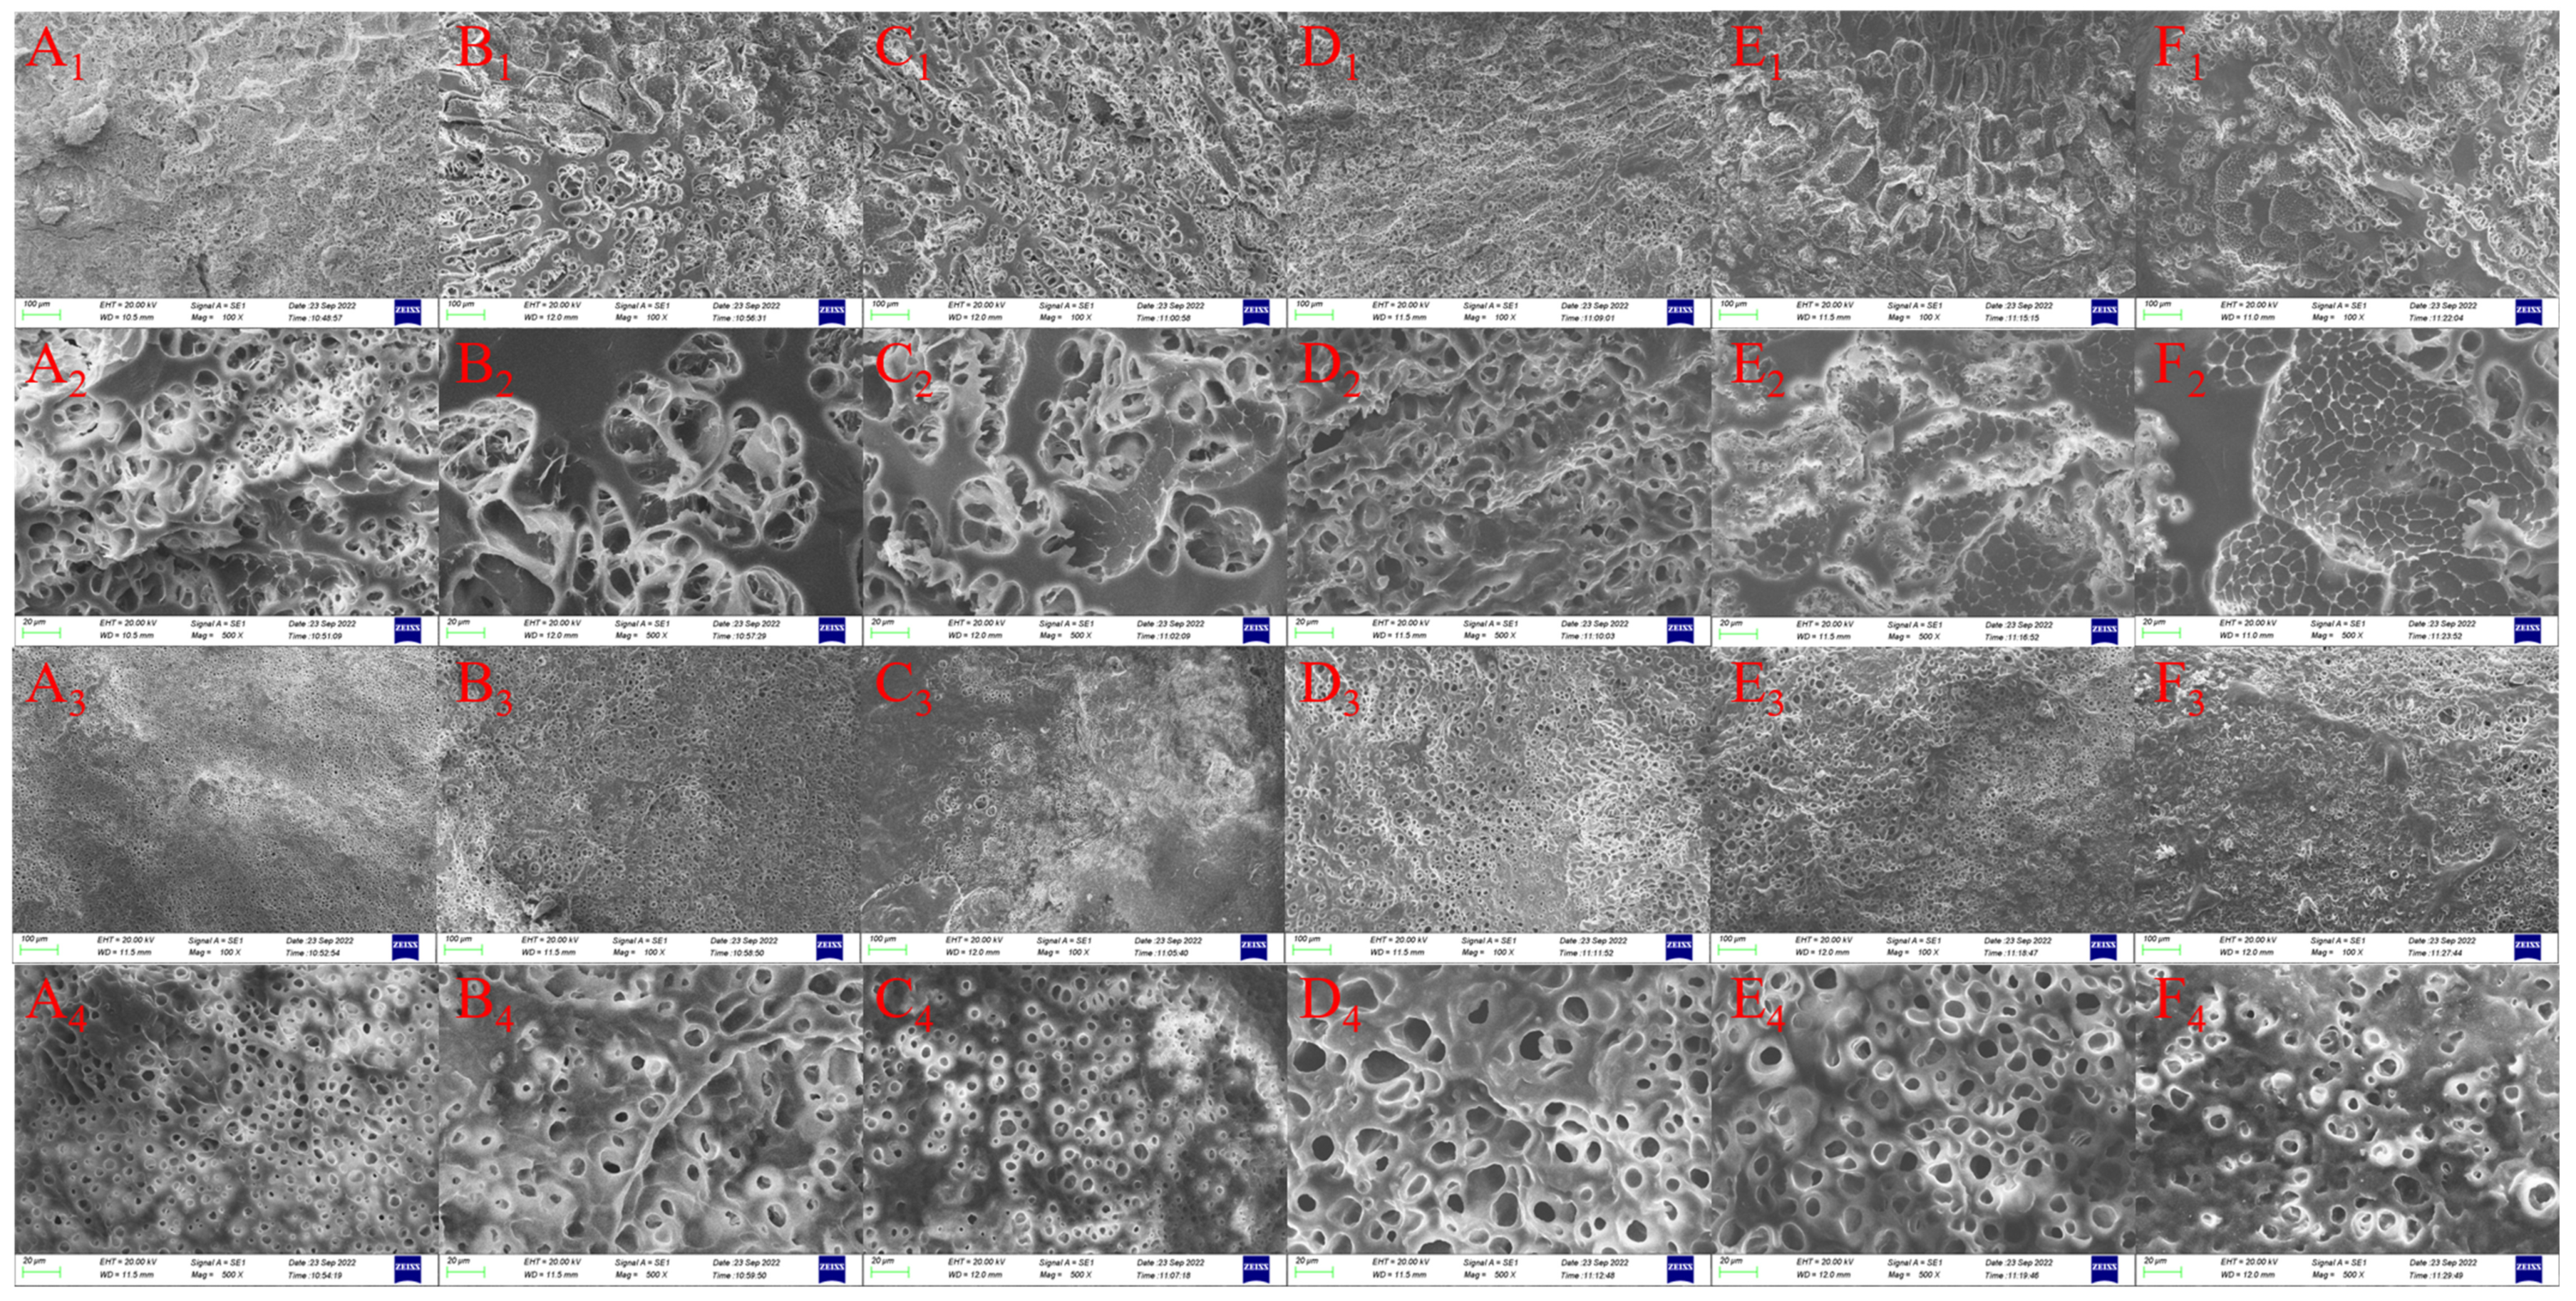
3.8. Microstructure of Tea Polyphenol-Fortified Cooked Rice
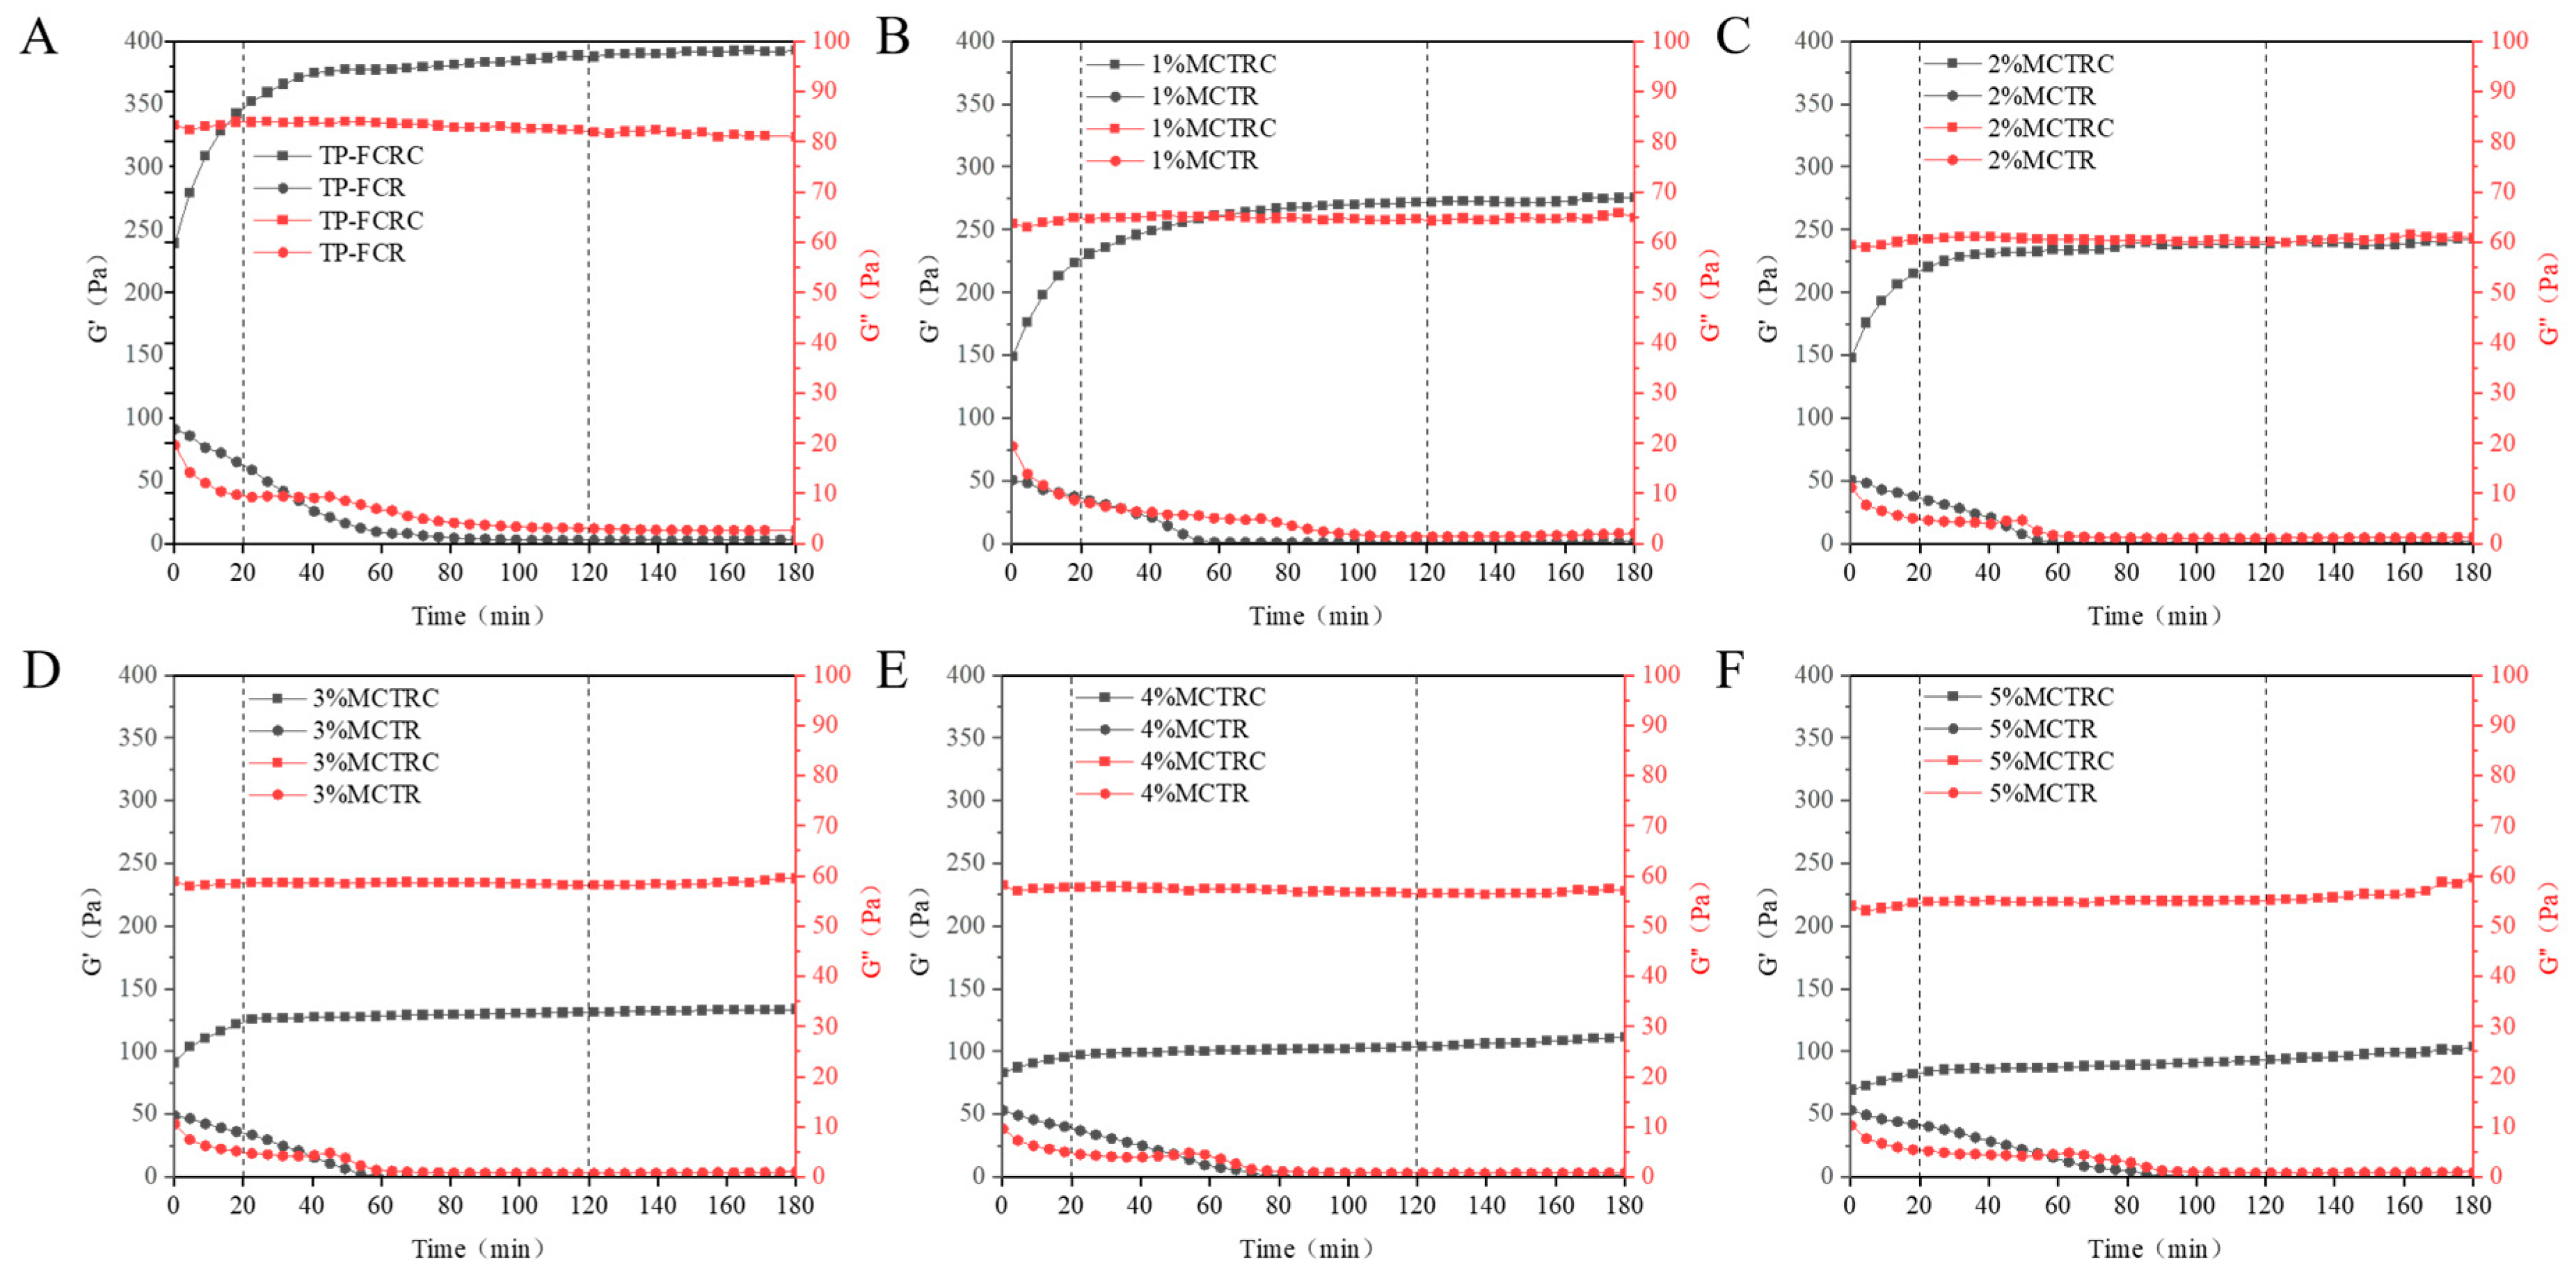
3.9. Viscoelastic Properties during Digestion
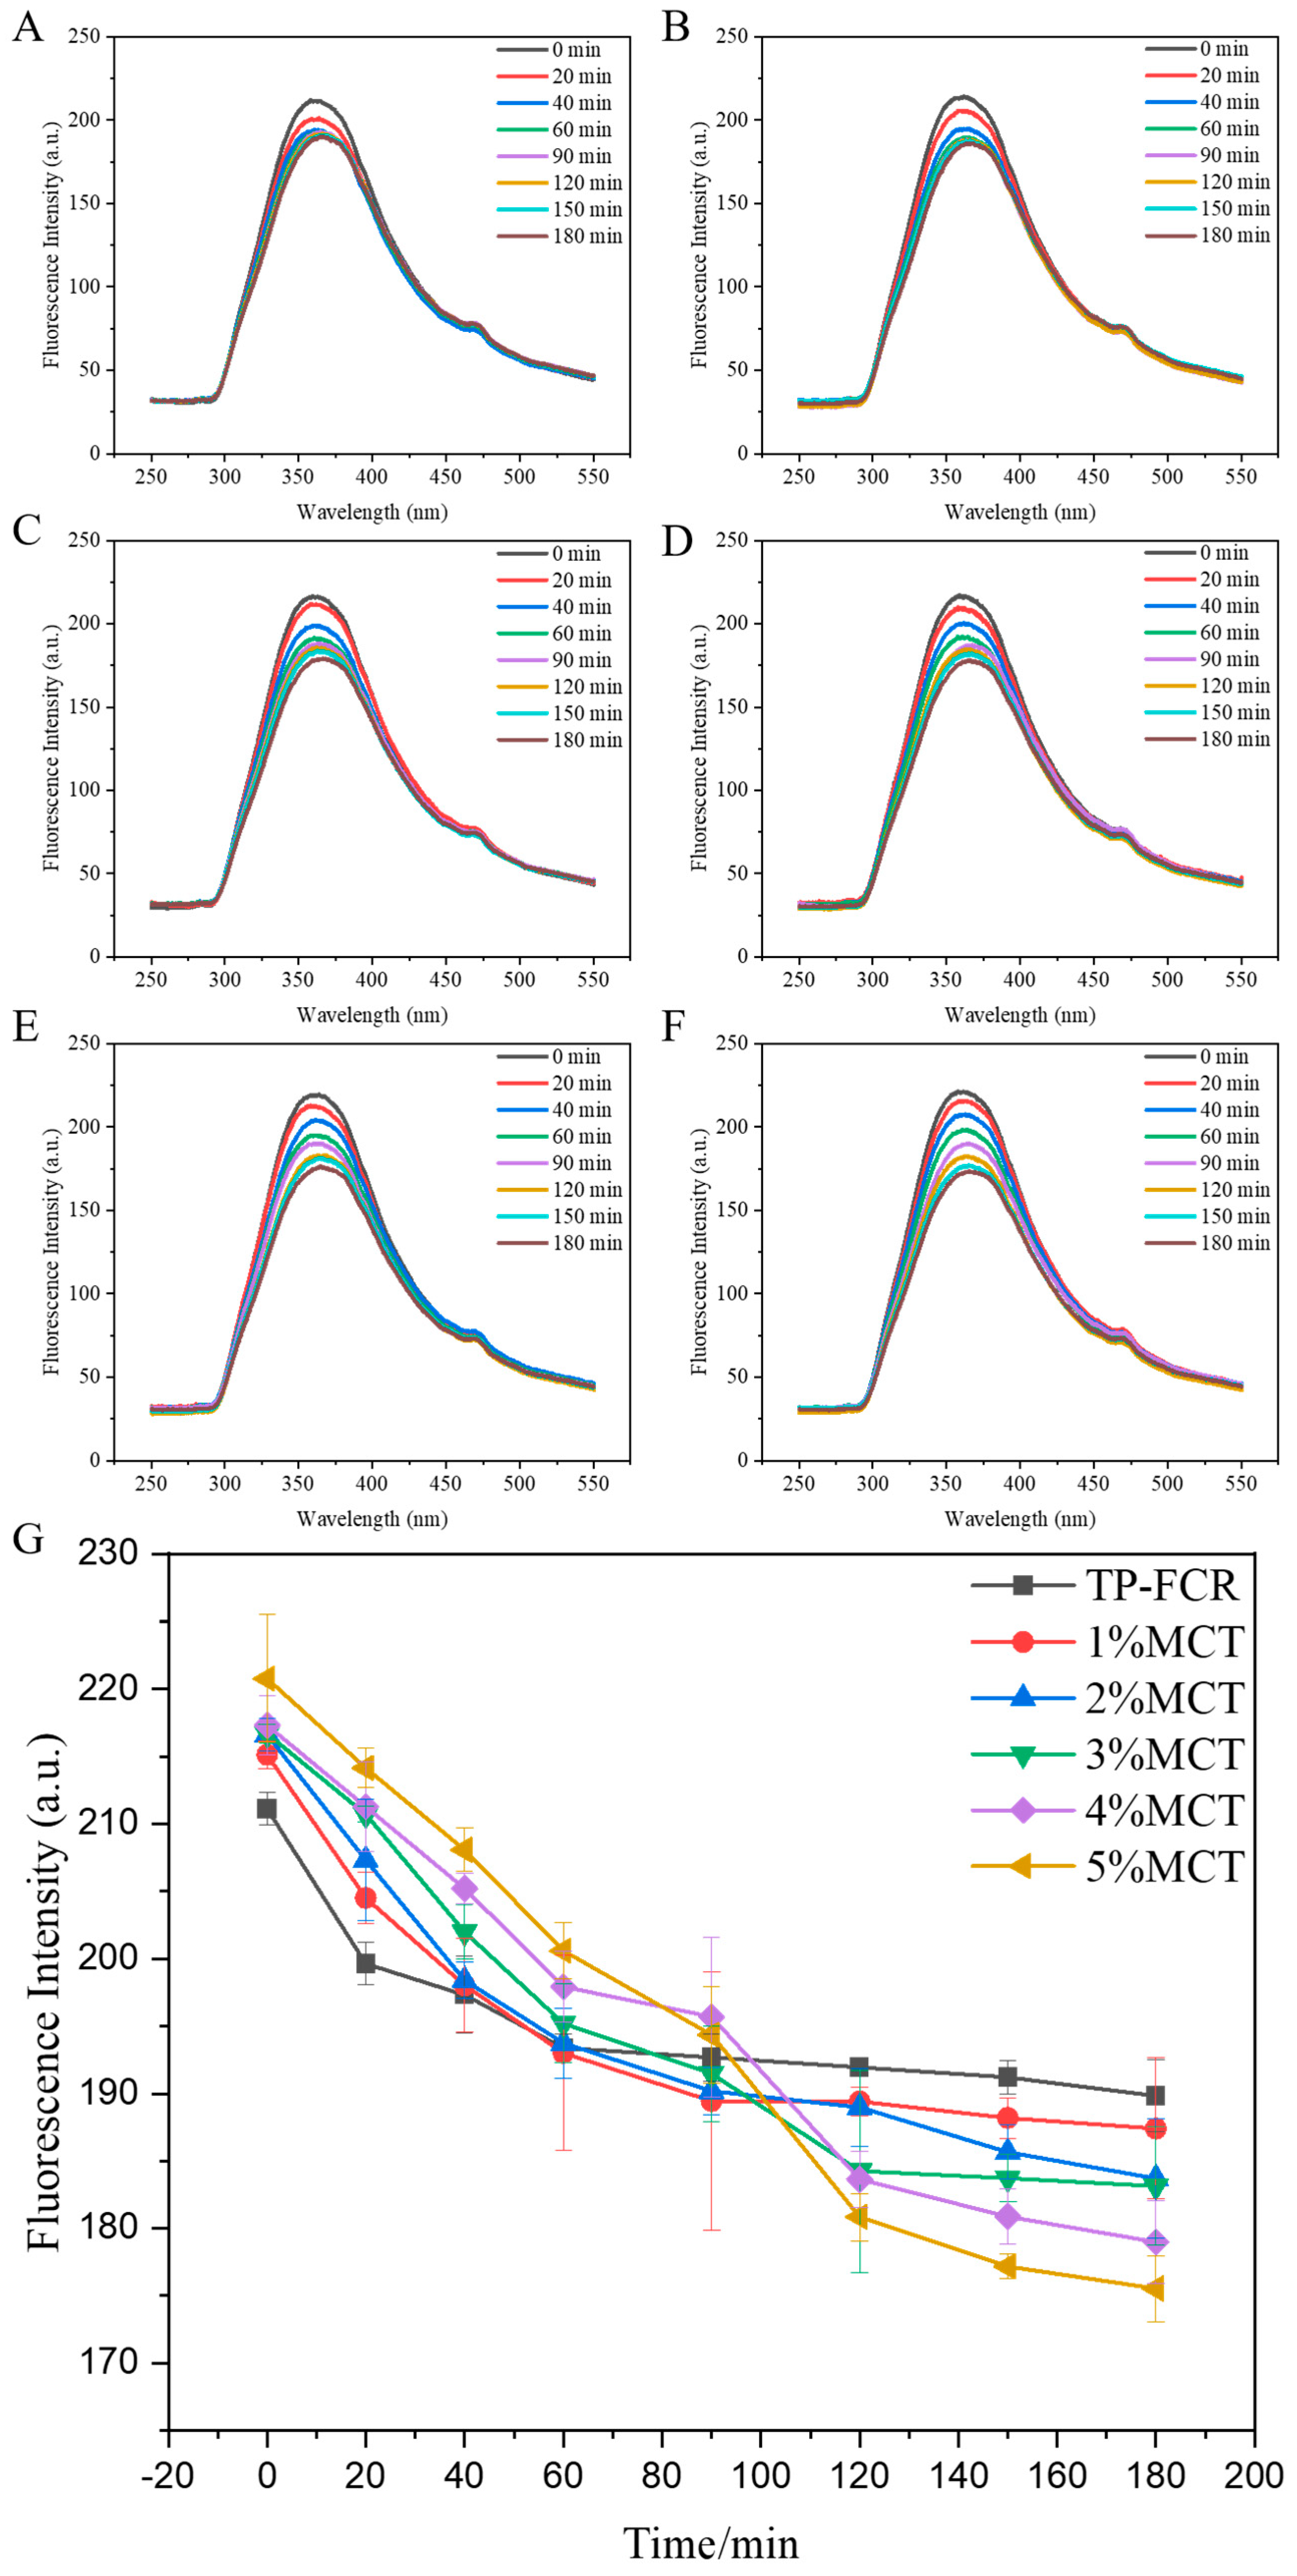
3.10. Fluorescence Quenching
3.11. In Vitro Digestibility Properties
4. Conclusions
Supplementary Materials
Author Contributions
Funding
Institutional Review Board Statement
Informed Consent Statement
Data Availability Statement
Conflicts of Interest
References
- Yan, S.; Shao, H.; Zhou, Z.; Wang, Q.; Zhao, L.; Yang, X. Non-extractable polyphenols of green tea and their antioxidant, anti-α-glucosidase capacity, and release during in vitro digestion. J. Funct. Foods 2018, 42, 129–136. [Google Scholar] [CrossRef]
- Zhang, H.; Jiang, Y.; Pan, J.; Lv, Y.; Liu, J.; Zhang, S.; Zhu, Y. Effect of tea products on the in vitro enzymatic digestibility of starch. Food Chem. 2018, 243, 345–350. [Google Scholar] [CrossRef] [PubMed]
- Gutierrez, A.; Feng, J.; Tan, L.; Kong, L. Inhibitory effect of four types of tea on the in vitro digestion of starch. Food Front. 2020, 1, 465–472. [Google Scholar] [CrossRef]
- Deng, N.; Deng, Z.; Tang, C.; Liu, C.; Luo, S.; Chen, T.; Hu, X. Formation, structure and properties of the starch-polyphenol inclusion complex: A review. Trends Food Sci. Technol. 2021, 112, 667–675. [Google Scholar] [CrossRef]
- Fu, T.; Niu, L.; Li, Y.; Li, D.; Xiao, J. Effects of tea products on in vitro starch digestibility and eating quality of cooked rice using domestic cooking method. Food Funct. 2020, 11, 9881–9891. [Google Scholar] [CrossRef] [PubMed]
- Ai, Y.; Hasjim, J.; Jane, J. Effects of lipids on enzymatic hydrolysis and physical properties of starch. Carbohydr. Polym. 2013, 92, 120–127. [Google Scholar] [CrossRef] [PubMed]
- Luangsakul, N.; Ritudomphol, O. Effect of oil addition on in vitro starch digestibility and physicochemical properties of instant rice. Int. J. Agric. Technol. 2018, 7, 1399–1412. [Google Scholar]
- Sun, S.; Jin, Y.; Hong, Y.; Gu, Z.; Cheng, L.; Li, Z.; Li, C. Effects of fatty acids with various chain lengths and degrees of unsaturation on the structure, physicochemical properties and digestibility of maize starch-fatty acid complexes. Food Hydrocoll. 2021, 110, 106224. [Google Scholar] [CrossRef]
- Zabar, S.; Lesmes, U.; Katz, I.; Shimoni, E.; Bianco-Peled, H. Studying different dimensions of amylose–long chain fatty acid complexes: Molecular, nano and micro level characteristics. Food Hydrocoll. 2009, 23, 1918–1925. [Google Scholar] [CrossRef]
- Lee, Y.Y.; Tang, T.K.; Chan, E.S.; Phuah, E.T.; Lai, O.M.; Tan, C.P.; Wang, Y.; Ab, K.N.; Mat, D.N.; Tan, J.S. Medium chain triglyceride and medium-and long chain triglyceride: Metabolism, production, health impacts and its applications—A review. Crit. Rev. Food Sci. Nutr. 2022, 62, 4169–4185. [Google Scholar] [CrossRef]
- Nimbkar, S.; Leena, M.M.; Moses, J.A.; Anandharamakrishnan, C. Medium chain triglycerides (MCT): State-of-the-art on chemistry, synthesis, health benefits and applications in food industry. Compr. Rev. Food Sci. Food Saf. 2022, 21, 843–867. [Google Scholar] [CrossRef] [PubMed]
- Marten, B.; Pfeuffer, M.; Schrezenmeir, J. Medium-chain triglycerides. Int. Dairy J. 2006, 16, 1374–1382. [Google Scholar] [CrossRef]
- Watanabe, S.; Tsujino, S. Applications of Medium-Chain Triglycerides in Foods. Front. Nutr. 2022, 9, 802805. [Google Scholar] [CrossRef] [PubMed]
- Wang, S.; Zheng, M.; Yu, J.; Wang, S.; Copeland, L. Insights into the Formation and Structures of Starch–Protein–Lipid Complexes. J. Agric. Food Chem. 2017, 65, 1960–1966. [Google Scholar] [CrossRef] [PubMed]
- Lin, L.; Yang, H.; Chi, C.; Ma, X. Effect of protein types on structure and digestibility of starch-protein-lipids complexes. LWT Food Sci. Technol. 2020, 134, 110175. [Google Scholar] [CrossRef]
- Paesani, C.; Gómez, M. Effects of the pre-frying process on the cooking quality of rice. LWT Food Sci. Technol. 2021, 140, 110743. [Google Scholar] [CrossRef]
- Kou, X.; Luo, D.; Li, Y.; Xu, B.; Zhang, K.; Li, P.; Li, X.; Han, S.; Liu, J. Effect of inulin with different degree of polymerisation on textural and rheological properties of wheat starch—Effect of inulin on gel properties of starch. Int. J. Food Sci. Technol. 2018, 53, 2576–2585. [Google Scholar] [CrossRef]
- Lin, J.; Sun-Waterhouse, D.; Tang, R.; Cui, C.; Wang, W.; Xiong, J. The effect of γ-[Glu](1 ≤ n ≤ 5)-Gln on the physicochemical characteristics of frozen dough and the quality of baked bread. Food Chem. 2021, 343, 128406. [Google Scholar] [CrossRef]
- Xu, D.; Hong, Y.; Gu, Z.; Cheng, L.; Li, Z.; Li, C. Effect of high pressure steam on the eating quality of cooked rice. LWT Food Sci. Technol. 2019, 104, 100–108. [Google Scholar] [CrossRef]
- Wei, Q.; Guo, Y.; Liu, X.; Wang, S.; Xu, Z.; Chen, S. Improving the eating quality of brown rice by defatting combined with hydrothermal treatment. Food Res. Int. 2022, 162, 112020. [Google Scholar] [CrossRef]
- Wen, Y.; Yao, T.; Xu, Y.; Corke, H.; Sui, Z. Pasting, thermal and rheological properties of octenylsuccinylate modified starches from diverse small granule starches differing in amylose content. J. Cereal. Sci. 2020, 95, 103030. [Google Scholar] [CrossRef]
- Seo, T.; Kim, J.; Lim, S. Preparation and characterization of crystalline complexes between amylose and C18 fatty acids. LWT Food Sci. Technol. 2015, 64, 889–897. [Google Scholar] [CrossRef]
- Lv, Y.; Zhang, L.; Li, M.; He, X.; Hao, L.; Dai, Y. Physicochemical properties and digestibility of potato starch treated by ball milling with tea polyphenols. Int. J. Biol. Macromol. 2019, 129, 207–213. [Google Scholar] [CrossRef] [PubMed]
- Sivam, A.S.; Sun-Waterhouse, D.; Perera, C.O.; Waterhouse, G.I.N. Application of FT-IR and Raman spectroscopy for the study of biopolymers in breads fortified with fibre and polyphenols. Food Res. Int. 2013, 50, 574–585. [Google Scholar] [CrossRef]
- Oyeyinka, S.A.; Singh, S.; Venter, S.L.; Amonsou, E.O. Effect of lipid types on complexation and some physicochemical properties of bambara groundnut starch. Starch-Stärke 2017, 69, 1600158. [Google Scholar] [CrossRef]
- Lu, S.; Li, J.; Xu, M.; Mu, Y.; Wen, Y.; Li, H.; Wang, J.; Sun, B. The textural properties of cooked convenience rice upon repeated freeze–thaw treatments are largely affected by water mobility at grain level. Food Res. Int. 2023, 163, 112254. [Google Scholar] [CrossRef]
- Xiao, J.; Zhong, Q. Suppression of retrogradation of gelatinized rice starch by anti-listerial grass carp protein hydrolysate. Food Hydrocoll. 2017, 72, 338–345. [Google Scholar] [CrossRef]
- Chen, Z.; Chen, Y.; Xue, Z.; Gao, X.; Jia, Y.; Wang, Y.; Lu, Y.; Zhang, J.; Zhang, M.; Chen, H. Insight into the inactivation mechanism of soybean Bowman-Birk trypsin inhibitor (BBTI) induced by epigallocatechin gallate and epigallocatechin: Fluorescence, thermodynamics and docking studies. Food Chem. 2020, 303, 125380. [Google Scholar] [CrossRef]
- Fu, T.; Niu, L.; Tu, J.; Xiao, J. The effect of different tea products on flavor, texture, antioxidant and in vitro digestion properties of fresh instant rice after commercial sterilization at 121 °C. Food Chem. 2021, 360, 130004. [Google Scholar] [CrossRef]
- Chen, J.; Cai, H.; Yang, S.; Zhang, M.; Wang, J.; Chen, Z. The formation of starch-lipid complexes in instant rice noodles incorporated with different fatty acids: Effect on the structure, in vitro enzymatic digestibility and retrogradation properties during storage. Food Res. Int. 2022, 162, 111933. [Google Scholar] [CrossRef]
- Li, Y.; Xiao, J.; Tu, J.; Yu, L.; Niu, L. Matcha-fortified rice noodles: Characteristics of in vitro starch digestibility, antioxidant and eating quality. LWT Food Sci. Technol. 2021, 149, 111852. [Google Scholar] [CrossRef]
- Zhou, Z.; Robards, K.; Helliwell, S.; Blanchard, C. Effect of the addition of fatty acids on rice starch properties. Food Res. Int. 2007, 40, 209–214. [Google Scholar] [CrossRef]
- Garcia, M.C.; Franco, C.M.L. Effect of glycerol monostearate on the gelatinization behavior of maize starches with different amylose contents. Starch-Stärke 2015, 67, 107–116. [Google Scholar] [CrossRef]
- Gerits, L.R.; Pareyt, B.; Delcour, J.A. Wheat starch swelling, gelatinization and pasting: Effects of enzymatic modification of wheat endogenous lipids. LWT Food Sci. Technol. 2015, 63, 361–366. [Google Scholar] [CrossRef]
- Zhu, F.; Sakulnak, R.; Wang, S. Effect of black tea on antioxidant, textural, and sensory properties of Chinese steamed bread. Food Chem. 2016, 194, 1217–1223. [Google Scholar] [CrossRef] [PubMed]
- Chang, F.; He, X.; Fu, X.; Huang, Q.; Jane, J. Effects of Heat Treatment and Moisture Contents on Interactions Between Lauric Acid and Starch Granules. J. Agric. Food Chem. 2014, 62, 7862–7868. [Google Scholar] [CrossRef]
- Wang, S.; Chao, C.; Cai, J.; Niu, B.; Copeland, L.; Wang, S. Starch–lipid and starch–lipid–protein complexes: A comprehensive review. Compr. Rev. Food Sci. Food Saf. 2020, 19, 1056–1079. [Google Scholar] [CrossRef]
- Horigane, A.K.; Takahashi, H.; Maruyama, S.; Ohtsubo, K.I.; Yoshida, M. Water penetration into rice grains during soaking observed by gradient echo magnetic resonance imaging. J. Cereal Sci. 2006, 44, 307–316. [Google Scholar] [CrossRef]
- Farooq, A.M.; Dhital, S.; Li, C.; Zhang, B.; Huang, Q. Effects of palm oil on structural and in vitro digestion properties of cooked rice starches. Int. J. Biol. Macromol. 2018, 107, 1080–1085. [Google Scholar] [CrossRef]
- Zhang, Q.; Fan, S.; Xie, H.; Zhang, Y.; Fu, L. Polyphenols from pigmented quinoa as potential modulators of maize starch digestion: Role of the starch-polyphenol inclusion and non-inclusion complexes. Food Hydrocoll. 2023, 144, 108975. [Google Scholar] [CrossRef]
- Sun, S.; Hong, Y.; Gu, Z.; Cheng, L.; Li, Z.; Li, C. An investigation into the structure and digestibility of starch-oleic acid complexes prepared under various complexing temperatures. Int. J. Biol. Macromol. 2019, 138, 966–974. [Google Scholar] [CrossRef] [PubMed]
- Vasiliadou, E.; Raphaelides, S.N.; Papastergiadis, E. Effect of heating time and temperature on partially gelatinized starch-fatty acid interactions. LWT Food Sci. Technol. 2015, 60, 698–707. [Google Scholar] [CrossRef]
- Ding, L.; Zhang, B.; Tan, C.P.; Fu, X.; Huang, Q. Effects of limited moisture content and storing temperature on retrogradation of rice starch. Int. J. Biol. Macromol. 2019, 137, 1068–1075. [Google Scholar] [CrossRef] [PubMed]
- Jakobek, L. Interactions of polyphenols with carbohydrates, lipids and proteins. Food Chem. 2015, 175, 556–567. [Google Scholar] [CrossRef] [PubMed]
- Cianciosi, D.; Forbes-Hernández, T.Y.; Regolo, L.; Alvarez-Suarez, J.M.; Navarro-Hortal, M.D.; Xiao, J.; Quiles, J.L.; Battino, M.; Giampieri, F. The reciprocal interaction between polyphenols and other dietary compounds: Impact on bioavailability, antioxidant capacity and other physico-chemical and nutritional parameters. Food Chem. 2022, 375, 131904. [Google Scholar] [CrossRef]
- Chang, F.; He, X.; Huang, Q. Effect of lauric acid on the V-amylose complex distribution and properties of swelled normal cornstarch granules. J. Cereal Sci. 2013, 58, 89–95. [Google Scholar] [CrossRef]
- Zhao, B.; Sun, S.; Lin, H.; Chen, L.; Qin, S.; Wu, W.; Zheng, B.; Guo, Z. Physicochemical properties and digestion of the lotus seed starch-green tea polyphenol complex under ultrasound-microwave synergistic interaction. Ultrason. Sonochem. 2019, 52, 50–61. [Google Scholar] [CrossRef]
- Chen, J.; Cai, H.; Zhang, M.; Chen, Z. Effects of rice protein on the formation and structural properties of starch-lipid complexes in instant rice noodles incorporated with different fatty acids. Food Biosci. 2023, 54, 102851. [Google Scholar] [CrossRef]
- Li, J.; Shen, M.; Xiao, W.; Li, Y.; Pan, W.; Xie, J. Regulating the physicochemical and structural properties of different starches by complexation with tea polyphenols. Food Hydrocoll. 2023, 142, 108836. [Google Scholar] [CrossRef]
- Zhang, C.; Zhou, L.; Lu, Y.; Yang, Y.; Feng, L.; Hao, W.; Li, Q.; Fan, X.; Zhao, D.; Liu, Q. Changes in the physicochemical properties and starch structures of rice grains upon pre-harvest sprouting. Carbohydr. Polym. 2020, 234, 115893. [Google Scholar] [CrossRef]
- Jia, F.; Ma, Z.; Hu, X. Controlling dough rheology and structural characteristics of chickpea-wheat composite flour-based noodles with different levels of Artemisia sphaerocephala Krasch. gum addition. Int. J. Biol. Macromol. 2020, 150, 605–616. [Google Scholar] [CrossRef] [PubMed]
- Chen, B.; Zeng, S.; Zeng, H.; Guo, Z.; Zhang, Y.; Zheng, B. Properties of lotus seed starch-glycerin monostearin complexes formed by high pressure homogenization. Food Chem. 2017, 226, 119–127. [Google Scholar] [CrossRef] [PubMed]
- Zheng, M.; Chao, C.; Yu, J.; Copeland, L.; Wang, S.; Wang, S. Effects of Chain Length and Degree of Unsaturation of Fatty Acids on Structure and in Vitro Digestibility of Starch-Protein-Fatty Acid Complexes. J. Agric. Food Chem. 2018, 66, 1872–1880. [Google Scholar] [CrossRef] [PubMed]
- Chao, C.; Yu, J.; Wang, S.; Copeland, L.; Wang, S. Mechanisms Underlying the Formation of Complexes between Maize Starch and Lipids. J. Agric. Food Chem. 2018, 66, 272–278. [Google Scholar] [CrossRef] [PubMed]
- Pan, J.; Li, M.; Zhang, S.; Jiang, Y.; Lv, Y.; Liu, J.; Liu, Q.; Zhu, Y.; Zhang, H. Effect of epigallocatechin gallate on the gelatinisation and retrogradation of wheat starch. Food Chem. 2019, 294, 209–215. [Google Scholar] [CrossRef] [PubMed]
- Kizil, R.; Irudayaraj, J.; Seetharaman, K. Characterization of irradiated starches by using FT-Raman and FTIR spectroscopy. J. Agric. Food Chem. 2002, 50, 3912–3918. [Google Scholar] [CrossRef] [PubMed]
- Lu, H.; Tian, Y.; Ma, R. Assessment of order of helical structures of retrograded starch by Raman spectroscopy. Food Hydrocoll. 2023, 134, 108064. [Google Scholar] [CrossRef]
- Lyu, Z.; Sala, G.; Scholten, E. Water distribution in maize starch-pea protein gels as determined by a novel confocal laser scanning microscopy image analysis method and its effect on structural and mechanical properties of composite gels. Food Hydrocoll. 2022, 133, 107942. [Google Scholar] [CrossRef]
- Chen, B.; Jia, X.; Miao, S.; Zeng, S.; Guo, Z.; Zhang, Y.; Zheng, B. Slowly digestible properties of lotus seed starch-glycerine monostearin complexes formed by high pressure homogenization. Food Chem. 2018, 252, 115–125. [Google Scholar] [CrossRef]
- Zhu, L.; Bi, S.; Wu, G.; Zhang, H.; Wang, L.; Qian, H.; Qi, X.; Jiang, H. Comparative analysis of the texture and physicochemical properties of cooked rice based on adjustable rice cooker. LWT 2020, 130, 109650. [Google Scholar] [CrossRef]
- Zhu, L.; Zhang, Y.; Wu, G.; Qi, X.; Dag, D.; Kong, F.; Zhang, H. Characteristics of pasting properties and morphology changes of rice starch and flour under different heating modes. Int. J. Biol. Macromol. 2020, 149, 246–255. [Google Scholar] [CrossRef]
- Boehm, M.W.; Warren, F.J.; Moore, J.E.; Baier, S.K.; Gidley, M.J.; Stokes, J.R. Influence of hydration and starch digestion on the transient rheology of an aqueous suspension of comminuted potato snack food. Food Funct. 2014, 5, 2775–2782. [Google Scholar] [CrossRef] [PubMed]
- Li, Y.; Niu, L.; Wu, L.; Li, D.; Sun, C.; Xiao, J. Polyphenol-fortified extruded sweet potato starch vermicelli: Slow-releasing polyphenols is the main factor that reduces the starch digestibility. Int. J. Biol. Macromol. 2023, 253, 127584. [Google Scholar] [CrossRef] [PubMed]
- Shelat, K.J.; Nicholson, T.; Flanagan, B.M.; Zhang, D.; Williams, B.A.; Gidley, M.J. Rheology and microstructure characterisation of small intestinal digesta from pigs fed a red meat-containing Western-style diet. Food Hydrocoll. 2015, 44, 300–308. [Google Scholar] [CrossRef]
- Yin, Z.; Wu, Y.; Chen, Y.; Qie, X.; Zeng, M.; Wang, Z.; Qin, F.; Chen, J.; He, Z. Analysis of the interaction between cyanidin-3-O-glucoside and casein hydrolysates and its effect on the antioxidant ability of the complexes. Food Chem. 2021, 340, 127915. [Google Scholar] [CrossRef] [PubMed]
- Le Bourvellec, C.; Renard, C.M. Interactions between polyphenols and macromolecules: Quantification methods and mechanisms. Crit. Rev. Food Sci. Nutr. 2012, 52, 213–248. [Google Scholar] [CrossRef] [PubMed]
- Exarhopoulos, S.; Raphaelides, S.N. Morphological and structural studies of thermally treated starch-fatty acid systems. J. Cereal. Sci. 2012, 55, 139–152. [Google Scholar] [CrossRef]
- Ortega, N.; Reguant, J.; Romero, M.; Macià, A.; Motilva, M. Effect of Fat Content on the Digestibility and Bioaccessibility of Cocoa Polyphenol by an in Vitro Digestion Model. J. Agric. Food Chem. 2009, 57, 5743–5749. [Google Scholar] [CrossRef]
- Xiao, J.; Niu, L.; Wu, L.; Li, D.; He, H. Preparation of an In Vitro Low-Digestible Rice Starch by Addition of Grass Carp Protein Hydrolysates and Its Possible Mechanisms. Starch-Stärke 2019, 71, 1800159. [Google Scholar] [CrossRef]
- Liu, P.; Kang, X.; Cui, B.; Gao, W.; Wu, Z.; Yu, B. Effects of amylose content and enzymatic debranching on the properties of maize starch-glycerol monolaurate complexes. Carbohydr. Polym. 2019, 222, 115000. [Google Scholar] [CrossRef]


| Samples | Peak I | Peak II | ||||||||
|---|---|---|---|---|---|---|---|---|---|---|
| To (°C) | Tp (°C) | Tc (°C) | ΔH (J/g) | Tc–To (°C) | To (°C) | Tp (°C) | Tc (°C) | ΔH (J/g) | Tc–To (°C) | |
| CR | 36.36 ± 0.27 a | 43.50 ± 2.75 e | 52.58 ± 3.89 f | 0.34 ± 0.05 c | 16.22 ± 3.80 e | 91.41 ± 2.98 a | 103.65 ± 4.40 d | 120.11 ± 0.30 g | 1.41 ± 0.08 f | 28.70 ± 3.28 f |
| MCT | ND | ND | ND | ND | ND | ND | ND | ND | ND | ND |
| IGT | 35.25 ± 1.58 a | 57.48 ± 0.97 a | 73.93 ± 2.03 a | 11.94 ± 0.94 a | 38.68 ± 3.38 a | 79.92 ± 1.26 d | 121.22 ± 1.53 a | 159.07 ± 0.78 a | 25.41 ± 2.22 a | 79.15 ± 0.91 a |
| TP-FCR | 36.12 ± 0.83 a | 54.12 ± 0.96 b | 65.27 ± 0.97 b | 1.16 ± 0.09 b | 29.15 ± 0.47 b | 81.18 ± 2.36 d | 107.35 ± 0.51 c | 127.75 ± 4.08 f | 2.08 ± 0.31 f | 46.58 ± 1.75 e |
| 1%MCT | 35.72 ± 0.60 a | 53.63 ± 0.74 bc | 63.40 ± 1.03 bc | 0.84 ± 0.01 bc | 27.68 ± 1.28 b | 83.17 ± 1.58 d | 107.91 ± 0.68 c | 133.27 ± 1.97 e | 3.85 ± 0.73 e | 50.10 ± 3.51 e |
| 2%MCT | 35.69 ± 0.39 a | 53.55 ± 0.64 bc | 61.62 ± 1.40 cd | 0.73 ± 0.02 bc | 25.94 ± 1.79 bc | 85.86 ± 2.19 cd | 108.57 ± 1.00 c | 141.38 ± 3.77 d | 6.09 ± 0.27 d | 55.52 ± 2.26 d |
| 3%MCT | 35.62 ± 0.38 a | 53.18 ± 1.11 bc | 58.76 ± 0.98 de | 0.62 ± 0.01 bc | 23.14 ± 1.32 cd | 86.17 ± 1.47 bc | 108.87 ± 0.75 c | 147.37 ± 4.73 cd | 7.22 ± 0.14 cd | 61.2 ± 4.88 c |
| 4%MCT | 36.16 ± 0.30 a | 50.37 ± 4.18 cd | 57.04 ± 1.49 e | 0.56 ± 0.01 bc | 20.88 ± 1.64 d | 88.74 ± 2.63 ab | 109.79 ± 0.81 c | 153.14 ± 3.04 c | 8.63 ± 0.35 c | 64.41 ± 0.56 bc |
| 5%MCT | 36.56 ± 0.17 a | 48.68 ± 0.40 d | 56.64 ± 1.27 e | 0.46 ± 0.01 c | 20.08 ± 1.21 d | 88.85 ± 0.26 ab | 113.90 ± 1.08 b | 157.10 ± 1.50 b | 10.69 ± 0.58 b | 68.25 ± 1.68 b |
| Samples | Relative Crystallinity (%) | IR Ratio | Raman Peak Area | ||
|---|---|---|---|---|---|
| 1045/1020 (cm−1) | 1020/995 (cm−1) | 1130 (cm−1) | 1340 (cm−1) | ||
| TP-FCR | 0.87 ± 0.07 d | 0.642 ± 0.018 d | 1.168 ± 0.020 a | 164.60 ± 10.12 d | 52.57 ± 5.80 d |
| 1%MCT | 2.48 ± 0.13 c | 0.658 ± 0.013 cd | 1.145 ± 0.007 ab | 208.83 ± 14.69 c | 67.94 ± 3.67 c |
| 2%MCT | 2.62 ± 0.12 c | 0.668 ± 0.002 bc | 1.151 ± 0.013 ab | 230.95 ± 15.35 bc | 69.10 ± 3.05 c |
| 3%MCT | 2.96 ± 0.14 b | 0.674 ± 0.005 bc | 1.139 ± 0.006 ab | 258.84 ± 15.09 b | 85.03 ± 5.66 b |
| 4%MCT | 4.01 ± 0.14 a | 0.683 ± 0.007 b | 1.121 ± 0.015 bc | 329.95 ± 29.29 a | 88.91 ± 0.58 b |
| 5%MCT | 4.26 ± 0.20 a | 0.711 ± 0.002 a | 1.099 ± 0.026 c | 355.29 ± 23.44 a | 107.56 ± 1.25 a |
| Samples | Starch Fraction | Kinetic Parameters | |||||
|---|---|---|---|---|---|---|---|
| RDS (%) | SDS (%) | RS (%) | K (×10−2/min) | R2 | HI (%) | pGI | |
| TP-FCR | 64.43 ± 1.74 a | 11.21 ± 1.00 e | 24.26 ± 0.72 e | 9.54 ± 0.50 a | 0.995 | 71.79 | 70.08 |
| 1%MCT | 60.74 ± 1.80 b | 12.94 ± 0.09 d | 26.32 ± 0.98 d | 8.70 ± 0.17 b | 0.994 | 69.58 | 68.18 |
| 2%MCT | 57.37 ± 0.79 c | 13.63 ± 0.22 cd | 28.99 ± 0.08 c | 8.25 ± 0.07 c | 0.990 | 66.80 | 65.78 |
| 3%MCT | 55.05 ± 2.52 cd | 13.89 ± 0.11 bc | 31.07 ± 0.04 b | 8.01 ± 0.04 c | 0.990 | 64.76 | 64.02 |
| 4%MCT | 52.39 ± 1.41 de | 15.29 ± 0.26 a | 32.32 ± 1.79 b | 7.48 ± 0.06 d | 0.991 | 63.13 | 62.62 |
| 5%MCT | 50.82 ± 0.88 e | 14.68 ± 0.18 ab | 34.52 ± 1.77 a | 7.44 ± 0.08 d | 0.994 | 61.13 | 60.89 |
Disclaimer/Publisher’s Note: The statements, opinions and data contained in all publications are solely those of the individual author(s) and contributor(s) and not of MDPI and/or the editor(s). MDPI and/or the editor(s) disclaim responsibility for any injury to people or property resulting from any ideas, methods, instructions or products referred to in the content. |
© 2023 by the authors. Licensee MDPI, Basel, Switzerland. This article is an open access article distributed under the terms and conditions of the Creative Commons Attribution (CC BY) license (https://creativecommons.org/licenses/by/4.0/).
Share and Cite
Li, Y.; Niu, L.; Sun, C.; Li, D.; Zeng, Z.; Xiao, J. Effect of Medium Chain Triglycerides on the Digestion and Quality Characteristics of Tea Polyphenols-Fortified Cooked Rice. Foods 2023, 12, 4366. https://doi.org/10.3390/foods12234366
Li Y, Niu L, Sun C, Li D, Zeng Z, Xiao J. Effect of Medium Chain Triglycerides on the Digestion and Quality Characteristics of Tea Polyphenols-Fortified Cooked Rice. Foods. 2023; 12(23):4366. https://doi.org/10.3390/foods12234366
Chicago/Turabian StyleLi, Ying, Liya Niu, Chao Sun, Dongming Li, Zicong Zeng, and Jianhui Xiao. 2023. "Effect of Medium Chain Triglycerides on the Digestion and Quality Characteristics of Tea Polyphenols-Fortified Cooked Rice" Foods 12, no. 23: 4366. https://doi.org/10.3390/foods12234366
APA StyleLi, Y., Niu, L., Sun, C., Li, D., Zeng, Z., & Xiao, J. (2023). Effect of Medium Chain Triglycerides on the Digestion and Quality Characteristics of Tea Polyphenols-Fortified Cooked Rice. Foods, 12(23), 4366. https://doi.org/10.3390/foods12234366