Article

Red Meat Consumption and Cancer Risk: A Systematic Analysis of Global Data

1
State Key Laboratory of Marine Food Processing and Safety Control, College of Food Science and Engineering, Ocean University of China, Qingdao 266404, China
2
Haide College, Ocean University of China, Qingdao 266404, China
3
Laboratory for Marine Drugs and Bioproducts of Qingdao National Laboratory for Marine Science and Technology, Qingdao 266237, China
4
Qingdao Key Laboratory of Food Biotechnology, College of Food Science and Engineering, Ocean University of China, Qingdao 266404, China
5
Key Laboratory of Biological Processing of Aquatic Products, China National Light Industry, Qingdao 266404, China
*
Author to whom correspondence should be addressed.
Foods 2023, 12(22), 4164; https://doi.org/10.3390/foods12224164
Submission received: 12 October 2023 / Revised: 10 November 2023 / Accepted: 14 November 2023 / Published: 17 November 2023
(This article belongs to the Special Issue Food Safety: Risk Analysis, Safety Regulation and Legislation)

Abstract

:
The association between red meat consumption and cancer risk remains a controversy. In this study, we systematically collected and analyzed global data (from Our World in Data and Global Cancer Observatory) to investigate this association for the first time. Our results confirmed significant positive associations between red meat consumption (RMC) and overall cancer incidence (0.798, p < 0.001), or colorectal cancer incidence (0.625, p < 0.001). Several previously unreported cancer types linked to RMC were also unveiled. Gross domestic product (GDP) per capita were found to have an impact on this association. However, even after controlling it, RMC remained significantly associated with cancer incidence (0.463, p < 0.001; 0.592, p < 0.001). Meanwhile, after controlling GDP per capita, the correlation coefficients between white meat consumption and overall cancer incidence were found to be much lower and insignificant, at 0.089 (p = 0.288) for poultry consumption and at −0.055 (p = 0.514) for seafood and fish consumption. Notably, an interesting comparison was performed between changes of colorectal cancer incidence and RMC in many countries and regions. A lag of 15–20 years was found, implying causality between RMC and cancer risk. Our findings will contribute to the development of more rational meat consumption concept.

1. Introduction

Meat is a crucial component of the human diet, providing essential high-quality protein [1,2]. Given that meat offers appealing flavor and essential nutrients [3,4], its global consumption has increased in tandem with improvements in living conditions [1]. The annual per capita meat consumption has steadily increased from 32.10 kg/year in 1961 to 62.57 kg/year in 2019 (according to Our World in Data). This trend is particularly prominent in developing countries and regions [1], such as China, where the annual per capita meat consumption has soared from a mere 7.62 kg/year in 1961 to 102.17 kg/year in 2019 (according to Our World in Data). Accordingly, to develop a more rational concept of meat consumption, it is pertinent to investigate the potential impact of increased meat consumption on human health.
With the continuous increase, more and more researchers believe that the meat consumption pattern should also receive sufficient attention [1,5], especially its impact on health. Commonly, the meat is classified into two categories: red meat and white meat. However, currently, there is no universal definition to differentiate between the two [4,6,7,8]. Typically, red meat is defined as mammalian-derived meat, including pork, beef and lamb, while white meat refers to non-mammalian sources such as poultry, seafood and fish.
There is growing evidence suggesting that higher red meat consumption (RMC) may not be beneficial for human health [1,9,10]. Several epidemiological and pathological studies have reported a positive association between RMC and the incidence of cancer [11,12,13,14], while no positive association has been found between the consumption of white meat and cancer incidence [15,16,17,18,19,20,21]. Moreover, the International Agency for Research on Cancer (IARC) classified red meat as a Group 2A carcinogen in 2015 [6].
However, the results remain greatly controversial by now. There are still studies in this field that have failed to establish such a positive association [4,22,23,24,25], though positive associations between RMC and the incidence of various cancers have been reported in some cohort and case–control studies [11,12,13,14]. Additionally, the IARC classification also indicates that the carcinogenicity of red meat remains highly uncertain [6]. The uncertainty severely hampers the development of a more rational meat consumption concept.
The inconsistency of the studies may be attributed to the limitations of sample sizes, low accuracy of consumption assessment methods, and inadequate research duration. Notably, most of the studies relied on self-reported meat consumption data from participants [7,11,12,13,14,26]. To overcome these limitations, meta-analyses have been frequently conducted based on large amounts of data from previous studies [27,28,29,30]. Recently, to obtain more accurate results, in some meta-analyses, a new risk assessment was applied [31,32,33,34,35]. Nevertheless, meta-analyses may introduce potential confounding factors [36], such as geographical differences, GDP per capita, heterogeneity among study designs and differences in population characteristics, and these meta-analyses also failed to reach consistent and definitive conclusions. Consequently, a study with larger, more objective, and longer-term data is highly necessary now to systematically unveil the association between RMC and cancer incidence accurately.
Although epidemiological studies have frequently reported a positive association between RMC and specific cancer incidence, these studies do not mechanistically demonstrate the association. To understand the mechanisms underlying the higher incidence of cancer with higher RMC, some researchers have conducted pathological studies [37,38,39,40]. However, the evidence of the relevant factors’ contribution is not conclusive either. Therefore, a definitive conclusion regarding the positive association between cancer risk and RMC cannot be reached based solely on these findings.
With the advancement of the internet, numerous global databases have been established and expanded, generating massive amounts of systematically collected data, including consumption and disease incidence [41]. Some of these data have already been utilized for other research analysis, leading to significant findings [42,43,44,45]. This suggests that the global data on RMC and cancer incidence can also be analyzed to make the conclusion clearer. To the best of our knowledge, no such studies have been conducted to date in the area of RMC and cancer risk association exploration.
Consequently, to reveal the definite association between RMC and cancer risk, global consumption data of pork, beef, mutton, poultry, seafood, and fish from Our World in Data and cancer incidence data from the Global Cancer Observatory were obtained and systematically analyzed for the first time here. Correlation coefficients were calculated, and the effects of geographical and economic factors on correlation coefficients were analyzed. Furthermore, changes of RMC and cancer incidence over an extended period were examined. Comparative analysis of white meat was also conducted to understand the association between RMC and cancer risk further.

2. Methods

2.1. Data Source and Selection

2.1.1. Association between Meat Consumption and Cancer Incidence

Data on the annual per capita consumption of pork, beef, lamb, and poultry in 182 countries and regions for the period of 1961–2017 were obtained from Our World in Data (https://ourworldindata.org/grapher/per-capita-meat-consumption-by-type-kilograms-per-year (accessed on 1 February 2023)). Similarly, data on annual per capita seafood and fish consumption (SFC) in the same period for 182 countries and regions were obtained from the same source (https://ourworldindata.org/grapher/fish-and-seafood-consumption-per-capita (accessed on 1 February 2023)). It is worth noting that seafood consumption and fish consumption were treated as one item here, encompassing all major seafood categories such as crustaceans, cephalopods, and mollusks, as well as various fish species. Furthermore, data on the annual overall cancer incidence (OCI) from Our World in Data (https://ourworldindata.org/grapher/cancer-incidence (accessed on 1 February 2023)) for the period of 1990–2017, covering 195 countries and regions, were collected.
As for selection, 177 countries and regions with both the OCI and meat consumption data were chosen at first, spanning the years from 1990 to 2017 for OCI data and from 1961 to 2017 for meat consumption data. However, the statistical year of the data is not exactly the same for all countries and regions. In order to balance as many countries and regions as possible and a longer year span, this span was reduced to 1992–2017. At this time, there are still some missing data countries and regions, such as Belgium (its meat consumption data was only available from 2000 to 2017). These are excluded eventually. The final number of retained countries and regions was 159. The annual per capita consumption of pork, beef, and lamb was summed as annual RMC per capita. Finally, RMC, poultry meat consumption (PMC), SFC and OCI data of the each retained countries and regions were averaged.
The annual incidences of 26 types of cancer (colon, rectum and anus are grouped as colorectum) for males and females across 42 countries and regions, spanning the years from 1943 to 2018, were obtained from the Global Cancer Observatory (https://gco.iarc.fr/overtime/ (accessed on 1 February 2023)). Additionally, gender ratios for these countries and regions from 1960 to 2021 were obtained from The World Bank (https://data.worldbank.org/indicator/SP.POP.TOTL.MA.ZS?end=2021&start=2021&view=map&year=2021 (accessed on 1 February 2023)). These data were utilized to calculate cancer incidence for both genders (excluding breast cancer, prostate cancer, testicular cancer, etc.). Following similar procedure described in the above paragraph, a total of 40 countries and regions spanning from 1999 to 2010 were selected. In addition, data on meat consumption in these countries and regions were collected correspondingly, and these items were summed and averaged as described above.
In order to systematically understand the associations between RMC and cancer incidence by cluster analysis, incidences of 36 types of cancer (colon, rectum and anus are separated) in 185 countries and regions in 2020 were obtained from the Global Cancer Observatory (https://gco.iarc.fr/today/ (accessed on 1 February 2023)).

2.1.2. Effect of Regional Conditions and Customs

To calculate the partial correlation coefficients between OCI and meat consumption, annual gross domestic product (GDP) per capita for the years 1992–2017 was collected from Our World in Data (https://ourworldindata.org/grapher/gdp-per-capita-in-us-dollar-world-bank (accessed on 1 February 2023)) for 144 countries and regions (from the 159 countries and regions), and then averaged. Likewise, to calculate the partial correlation coefficients between colorectal cancer (CRC) incidence and meat consumption, annual GDP per capita for the years 1999–2010 was obtained from the same website for the abovementioned 40 countries and regions, and was also averaged.

2.1.3. Lag of Influence from RMC on CRC Incidence

When investigating the lag of influence from RMC on CRC incidence, separate analyses were performed for each country, and data from 41 countries were used (data from The United Kingdom of Great Britain and Northern Ireland were excluded, as some data were missed). The available annual CRC incidence and annual meat consumption data for all these 41 countries and regions were used without any selection or averaging.

2.2. Statistical Analysis

2.2.1. Association between RMC and Cancer Incidence

Since the data were not normally distributed, Spearman correlation coefficient was chosen to determine the correlation. The Spearman correlation coefficients were calculated using SPSS (V 25) to assess the relationship between OCI and RMC, as well as between RMC and the incidences of 26 types of cancer. A significance level of p < 0.05 was applied. Scatters and bubble charts were generated using Prism 9.
Cluster analysis of the incidences of 36 cancers in 2020 across 185 countries and regions was performed using Clustvis (https://biit.cs.ut.ee/clustvis/ (accessed on 1 February 2023)). Cancer incidences and countries were clustered vertically and horizontally, respectively. A heatmap was created using the same software. Since the volume of data is large, the impact of noise should be minimized. Therefore, correlation distance measure was used to calculate the distance between rows or columns, and average linkage criterion was used to cluster rows or columns. Moreover, analysis of variance (ANOVA) was performed to validate the clusters (Table S2).

2.2.2. Effect of Regional Conditions and Customs

Geographic heat maps of RMC, OCI, and GDP per capita (for 144 countries and regions) were created using Tableau Desktop 2022.2 to visually compare the data. To account for the potential influence of GDP per capita on the relationship between RMC and cancer incidence, partial correlation coefficients were calculated using SPSS (V 25) with GDP per capita as the control variable. The first-order partial correlation coefficients between OCI and RMC (n = 144) and between CRC incidence and RMC (n = 40) were computed.

2.2.3. Lag of Influence from RMC on CRC Incidence

The changes in RMC and CRC incidence were compared for each of the 41 countries and regions. Line charts were drawn using Prism 9 to visualize RMC changes and CRC incidence changes in these countries and regions. Based on the analysis of these countries and regions, the lag of influence from RMC on CRC incidence was estimated in detail.

2.2.4. Association between Poultry Meat Consumption or SFC and Cancer Incidence

Spearman correlation coefficients between the OCI (averages from 1992–2017, n = 159) and PMC or SFC, as well as between the average CRC incidence (averages from 1999–2010, n = 40) and PMC or SFC, were calculated. Additionally, partial correlation coefficients between OCI and PMC or SFC (n = 144) were calculated, with annual GDP per capita (averages from 1992–2017) as the control variable. Similarly, partial correlation coefficients between CRC incidence and PMC or SFC (n = 40) were calculated, with annual GDP per capita (averages from 1999–2010) as the control variable.

3. Results and Discussion

3.1. RMC and Cancer Incidence

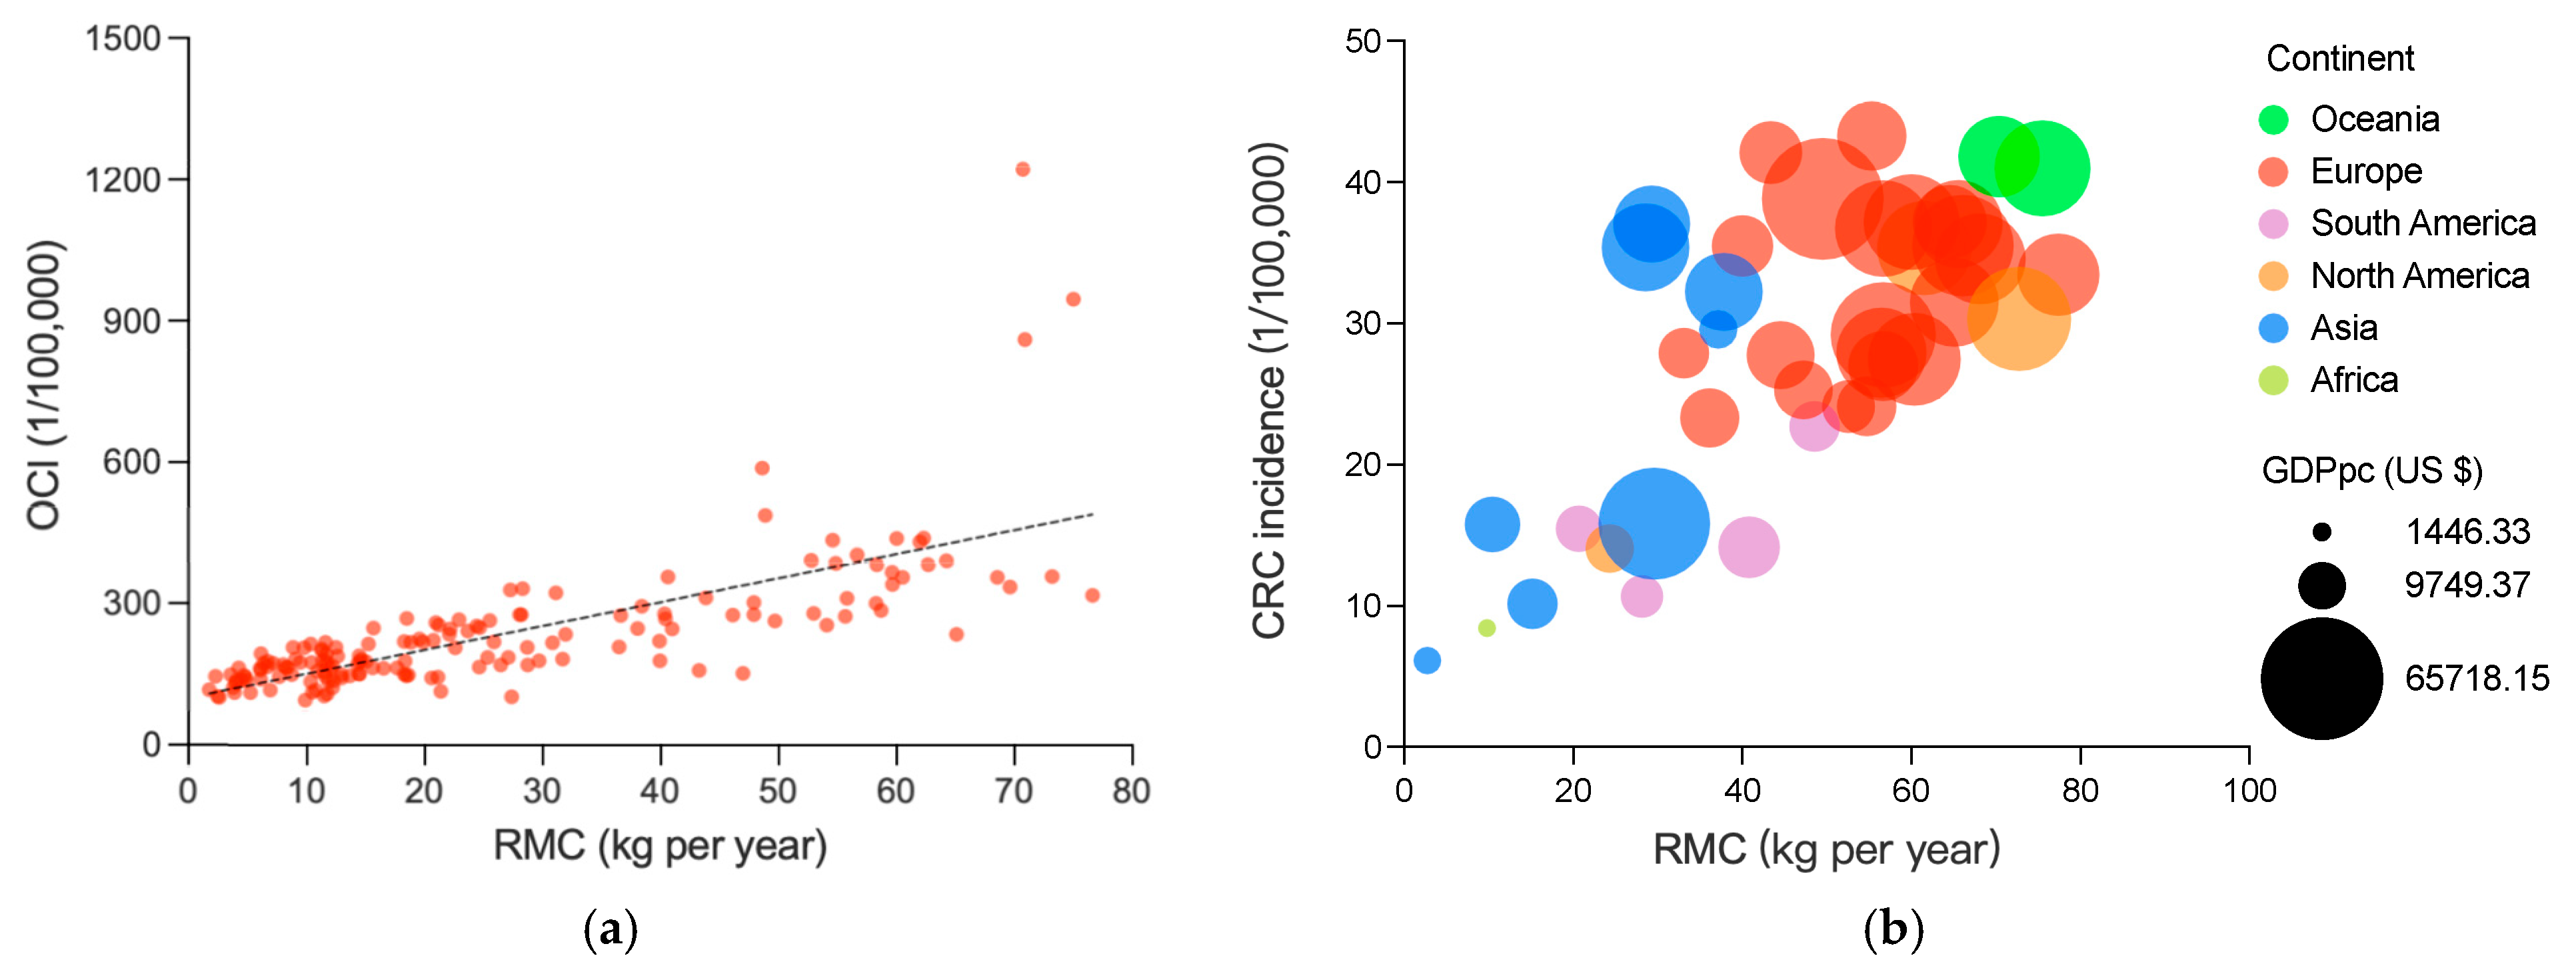
3.1.1. Association between RMC and OCI

Figure 1a shows a significantly positive association between RMC and OCI, with a correlation coefficient of 0.798 (p < 0.001), which indicates a significant and strongly positive association between the two variables. After being tested, this result is reliable (Table S1). Previous studies have largely focused on the association between specific cancer incidence and RMC, rather than on the association between OCI and RMC. Only a few studies covered overall cancers, and the results were inconsistent [46,47]. By analyzing much larger and more objective data, this study has allowed us to draw the conclusion that there is a strongly positive association between OCI and RMC.
According to previous studies on specific cancer incidence [4,22,23], due to a limited sample size, the conclusion regarding the association between RMC and cancer incidence remains uncertain. In previous cohort studies, the sample size was often less than 100,000 participants; the insufficient sample size would limit the certainty of conclusion drawing. To address this limitation, larger data were collected, including a 470,000 person cohort study [14]. Additionally, meta-analyses were conducted [27,28,29,30,31], most of which covered between 1 million to 10 million participants. By contrast, the significance of this work is highlighted by the involvement of at least 5 billion people (estimated from population data from 159 countries and regions in 1992). With such a large sample size, the certainty of the conclusions is greatly improved.
In addition, epidemiological studies commonly relied on self-assessment by participants to obtain RMC data [7,11,12,13,14,26], which raised questions about the objectivity and accuracy of the data. The systematic reviews also depend on those data. In contrast, the global data in this study, regardless of the meat consumptions or the cancer incidences, were all obtained from third-party databases. These data were obtained from credible sources with careful collection and strict review processes. In the process of data collection and updating, the regulation is standard, consistent and open. More importantly, data collection is not based on any research purposes. So, it is believed to improve the objectivity and accuracy.
However, the data were obtained passively by us, which may lead to data incompleteness. In order to minimize these issues, the missing data countries and regions were excluded, and an appropriate time span was fixed to guarantee the maximum volume of data. After exclusion and time span setting, the data still cover 159 countries and regions, and have a span of 26 years (for details, see Section 2.1.1).

3.1.2. Association between RMC and CRC Incidence

Association between RMC and incidence of CRC is a popular but still disputed topic [1,14,22,30,48], thus it was calculated here to further confirm the association (Figure 1b). The correlation coefficient of 0.625 (p < 0.001) again suggests a statistically significant and strongly positive association between RMC and CRC incidence.
Regarding specific types of cancer, CRC is one of the most commonly reported cancers that frequently shows a positive association with RMC [1,2,10,14,27,30,31]. Despite these studies, the association between CRC incidence and RMC also remains a controversial issue [4,22]. In this study, we focused specifically on examining this relationship and found that our results align with most cohort studies and meta-analyses. The findings provide further evidence supporting the positive association between CRC incidence and RMC. Consequently, the above-mentioned controversy is addressed to some extent.

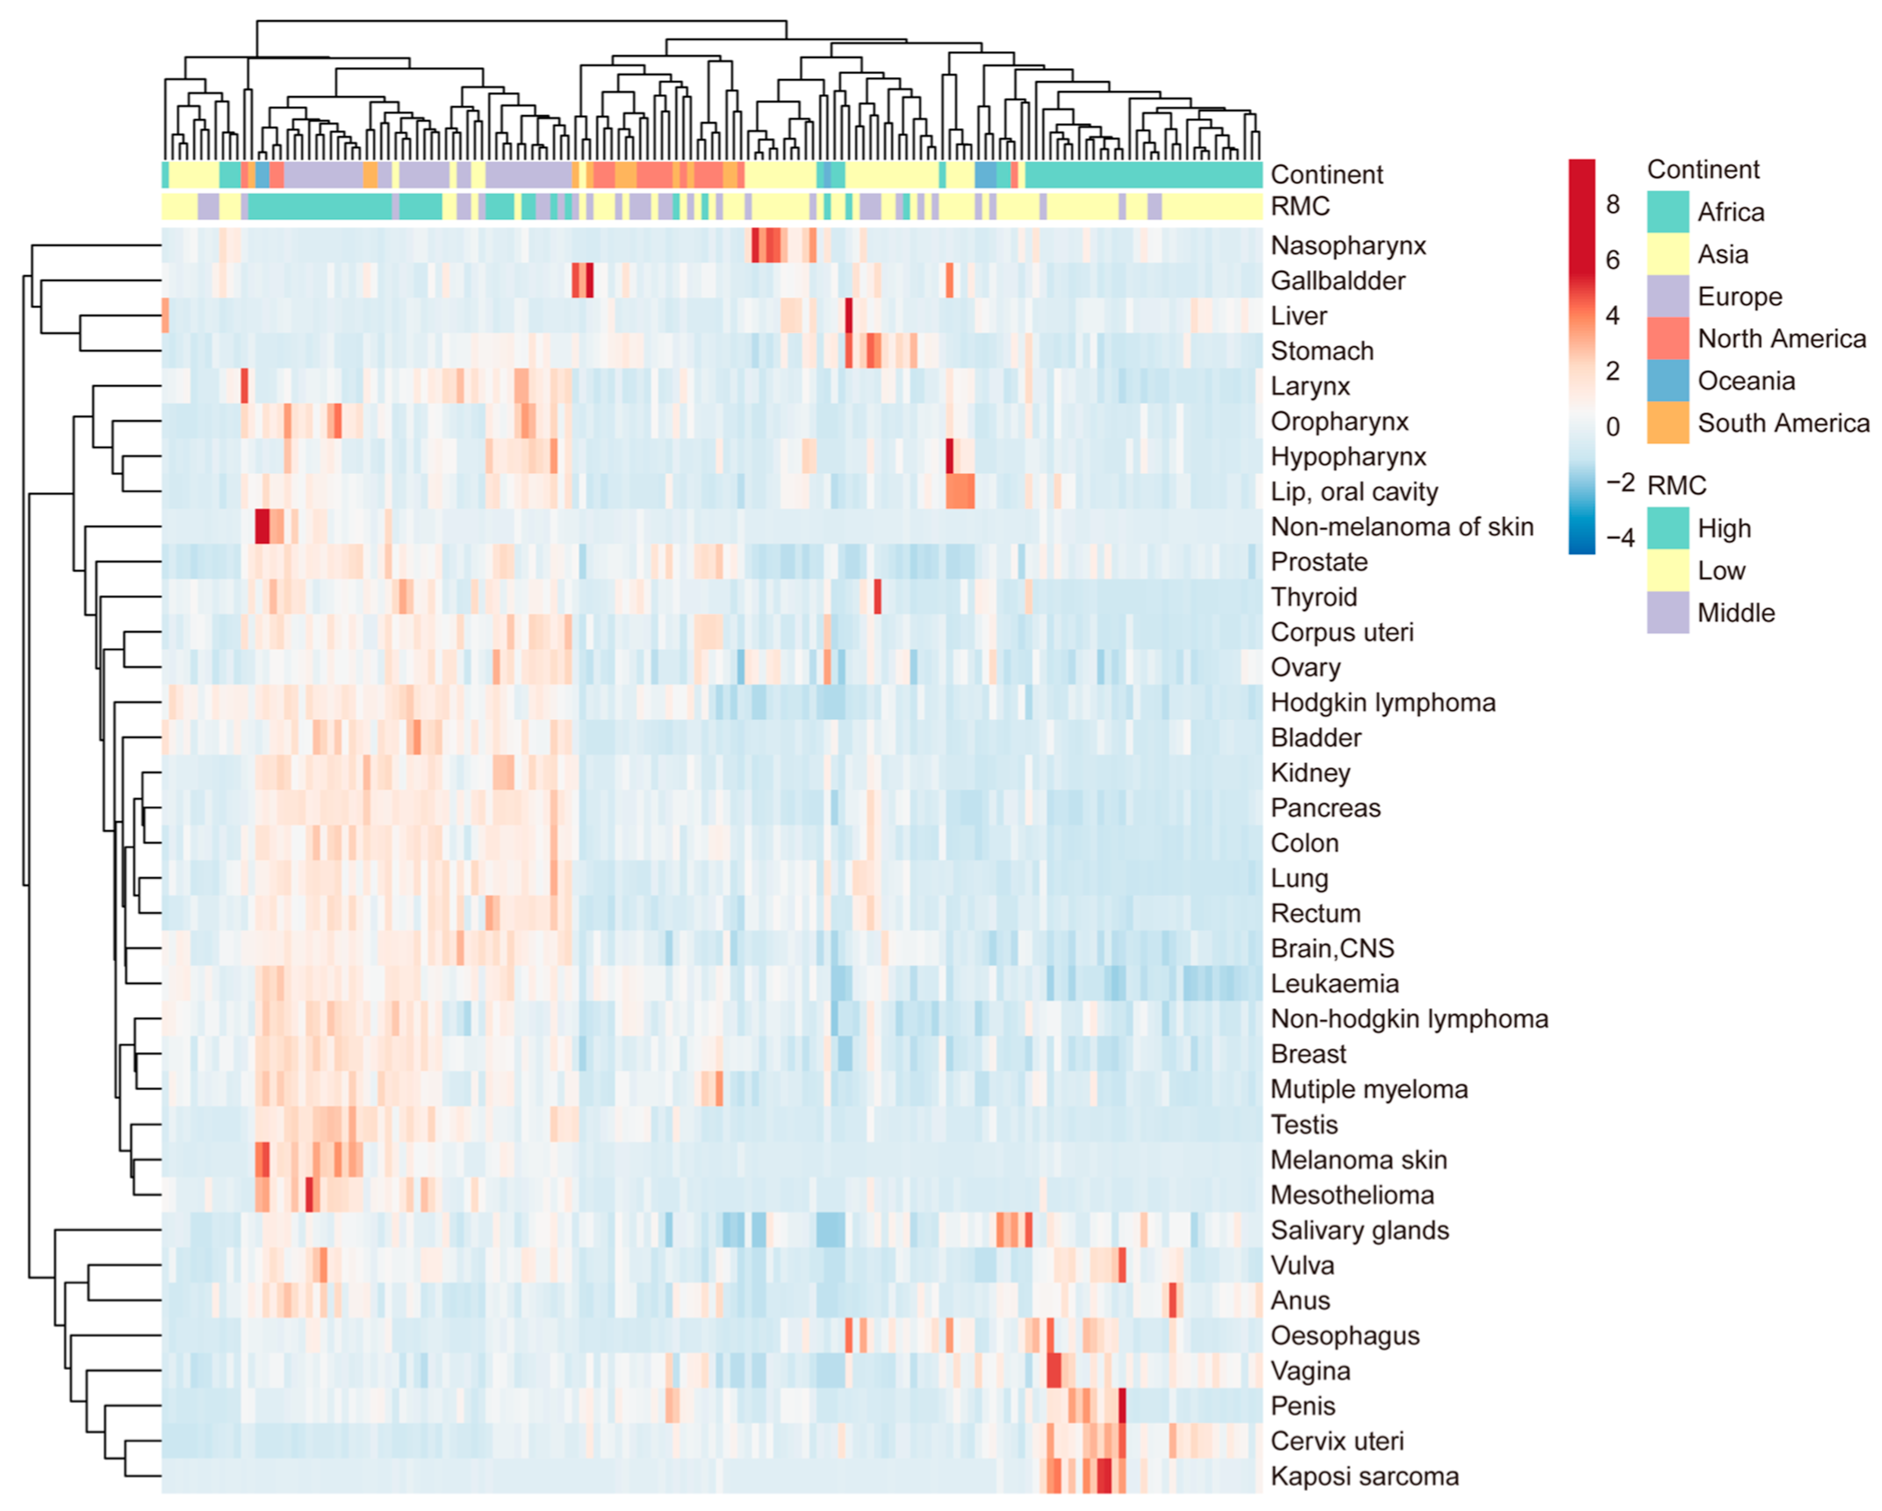
3.1.3. Association between RMC and Other Specific Cancer Incidences

In Table 1, the correlation coefficients between incidences of 26 different other cancers and RMC were presented. The range of correlation coefficients was wide, spanning from −0.473 (p = 0.002) to 0.771 (p < 0.001). Interestingly, several unexpected or counterintuitive results were observed. For instance, the incidences of stomach and cervix uteri cancer were found to be negatively associated with RMC, with correlation coefficients of −0.392 (p = 0.012) and −0.473 (p = 0.002), respectively.
Significant and positive associations have been observed between RMC and the incidences of 17 types of cancer. Notably, positive associations have been found between RMC and the incidences of nine cancers, such as skin melanoma, multiple melanoma, leukemia, testis cancer, Hodgkin lymphoma, brain (CNS) cancer, corpus uteri cancer, ovary cancer and oropharynx cancer. However, to the best of our knowledge, previous studies have not given sufficient attention to the associations between these nine cancer incidences and RMC.
Although the association between CRC incidence and RMC is the most commonly reported one previously, and the positive association has been confirmed in Section 3.1.2, it is noteworthy that the correlation coefficient between CRC incidence and RMC is not the highest among the 26 cancers studied (Table 1). Specifically, we identified five cancer types (multiple myeloma, skin melanoma, breast, leukemia, and prostate) with positive correlation coefficients higher than that of CRC incidence. It is worth to mention that the associations between RMC and incidences of multiple myeloma, skin melanoma and leukemia have not been adequately explored.
The associations between RMC and the incidences of stomach and cervix uteri cancers were unexpected and surprising, which differed from those of other cancer types studied. A meaningful negative association between stomach cancer incidence and RMC was observed (−0.392, p = 0.012), contrary to previous reports [28], suggesting a positive association. Meanwhile, the identified negative association between RMC and cervix uteri cancer incidence (−0.473, p = 0.002) was unreported by now.
These findings highlight the need for further investigation into the association between RMC and specific cancer incidence, particularly for the newly identified associations reported here, and further research is needed to elucidate the underlying mechanisms and potential implications of these unexpected findings.

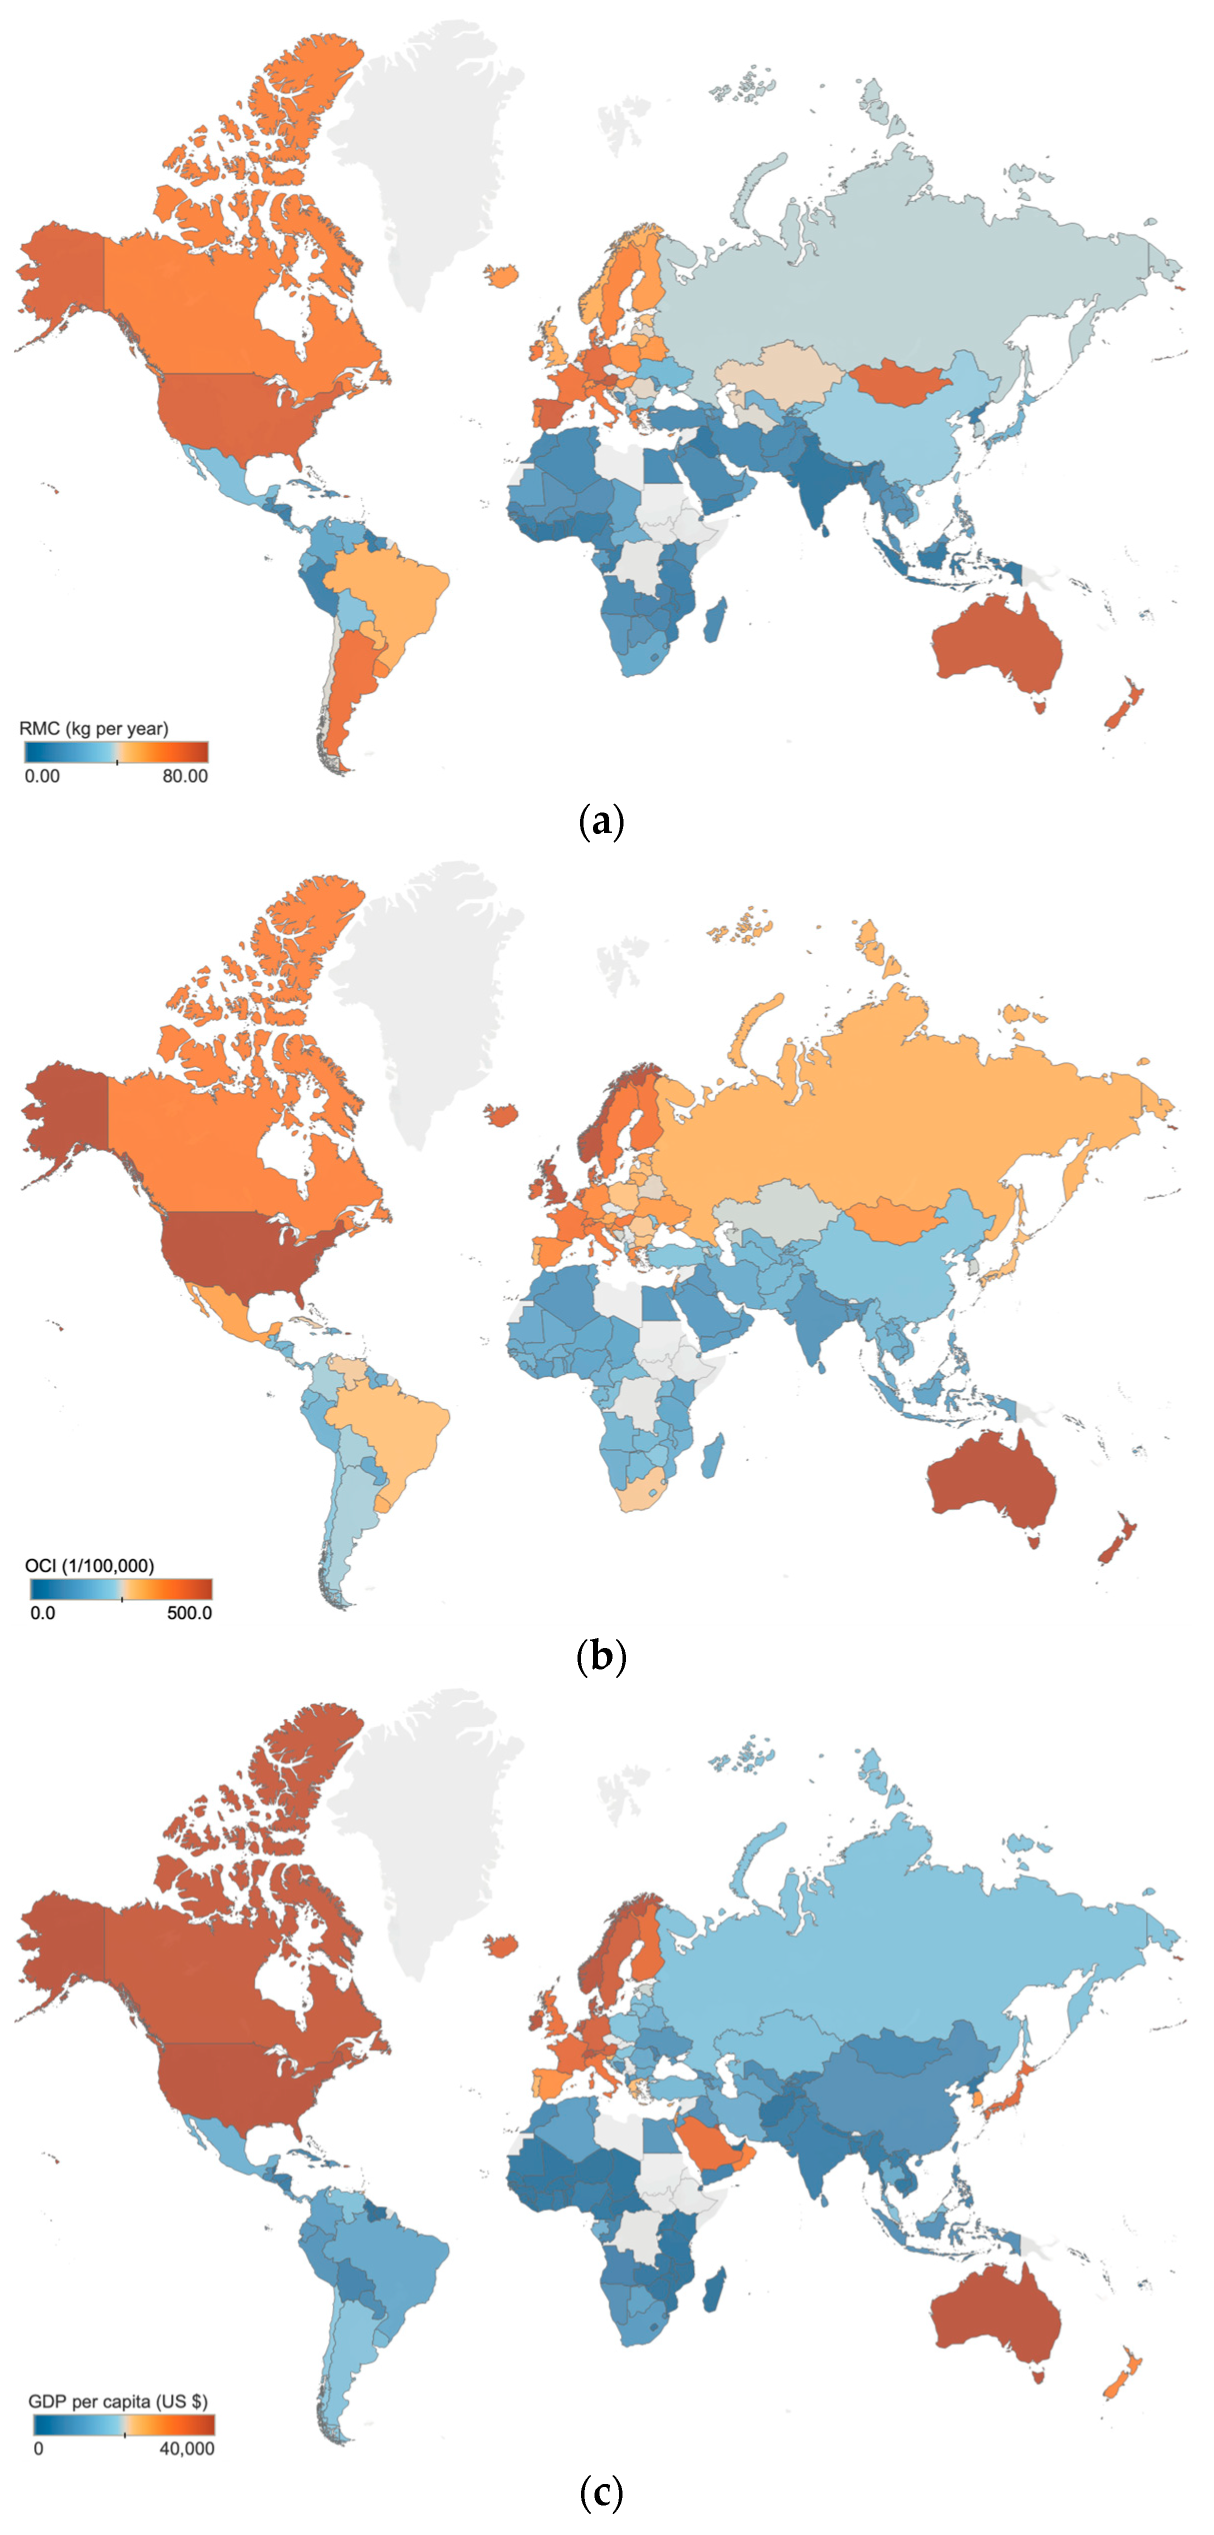
3.2. Effect of Regional Conditions and Customs

3.2.1. Cluster Analysis of Countries and Regions

To systematically investigate the associations between RMC and cancer incidence, a cluster analysis was performed (presented in Figure 2). The 153 countries and regions were clustered into two major groups, with the larger group was further subdivided into three clusters. Coincidentally, these four groups correspond to the four continents (Europe, Asia, Africa, and America). The incidences of 36 cancer types were clustered into three major groups. As illustrated in Figure 2, the three cancer clusters were found to be highly prevalent in Europe (with high RMC), Asia (with middle RMC), and Africa (with low RMC), respectively. However, special cancer incidence profile was not found in South America and North America (with differing RMC).
The findings from both the clustering analysis and correlation analysis exhibited a remarkable concordance. Specifically, it is found that the cluster of cancers with high prevalence in Europe (with high RMC) includes all cancers that have correlation coefficients higher than 0.3 in Table 1. Furthermore, the cancers with insignificant or negative coefficients in Table 1 were clustered into the other two groups, namely Africa with low RMC, and Asia with middle RMC. In Figure 2, it was observed that cervix uteri, vulva, anus, salivary gland, penis, vagina and oesophagus cancer and Kaposi sarcoma (low correlation coefficients) were clustered into the same group (Africa with low RMC).
Concerning the cluster analysis results, these four divided groups of countries and regions roughly coincide with four continents. Additionally, most cancers with low coefficients (cervix uteri, vulva, anus, salivary gland, penis, vagina and oesophagus cancer and Kaposi sarcoma) were prevalent in the Africa group (with low RMC). It should be noted that the great majority of these cancers are associated with viral infections, such as HPV or HIV [49,50]. This cannot help but remind us of the impact of geographical factors on the association.

3.2.2. Distribution and Partial Correlation Analysis of GDP per Capita

In Figure 3, the distribution of RMC, OCI, and GDP per capita across different regions is shown. The data demonstrate that these three variables were all the highest in Europe, followed by Asia, and the lowest in Africa. Furthermore, countries and regions located in the same continent were found to exhibit similar RMC and cancer incidence. It is important to acknowledge how the regional conditions and cultural practices potentially influence the association between RMC and cancer incidence [36], and which factors are crucial to be taken into consideration. It remains unknown whether some factors, such as geography and GDP per capita, could significantly confound the conclusion drawing. It has been widely observed that regions with higher GDP per capita tend to exhibit higher RMC and cancer incidence [1,51]. Therefore, among the various factors that influence these trends, GDP per capita is probably the most influential and comprehensive.
To exclude the influence of GDP per capita, the partial correlation coefficient between RMC and OCI was calculated (the linearity assumptions are met, as shown in Figure S2). The value was 0.463 (p < 0.001), indicating a moderately positive and still significant association. Similarly, we also calculated the partial-correlation coefficient between RMC and CRC incidence. The value (0.592, p < 0.001) also indicated a significant and moderately positive association, although weaker than the former. In a word, both of these associations remain significant and moderately positive, even after accounting for the influence of GDP per capita.
The possible influence of regional conditions and customs has been pointed out in previous meta-analyses [36]. However, due to the lack of systematic data, this impact has rarely been systematically and quantitatively discussed, and it may further contribute to the uncertainty of the previous conclusions [36]. It is also clear from these results that the correlations are indeed affected by GDP per capita, and all of them decrease after controlling for GDP per capita. Moreover, it is confirmed that although GDP per capita does have an impact, after controlling it, the positive partial correlation coefficient between RMC and OCI or CRC incidence remains significant.

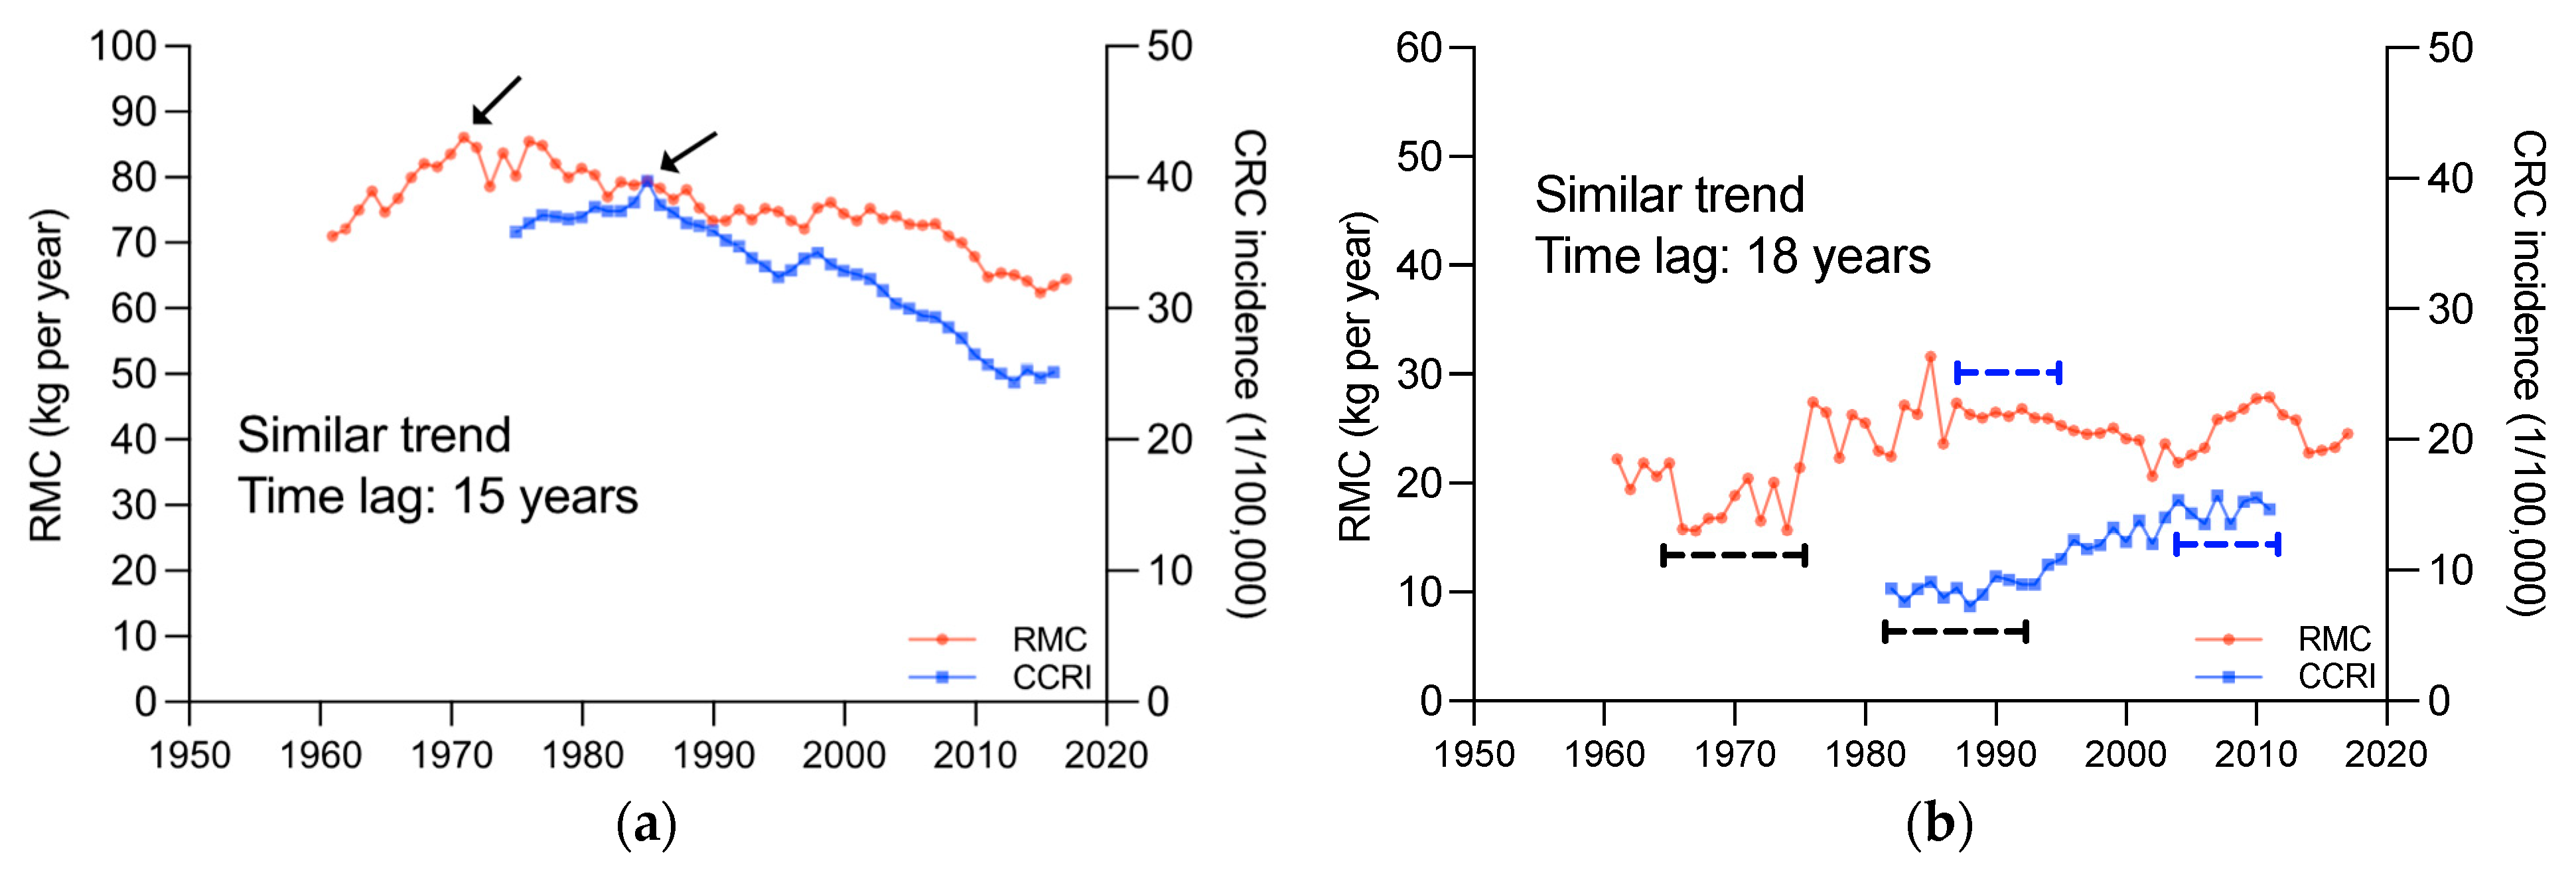
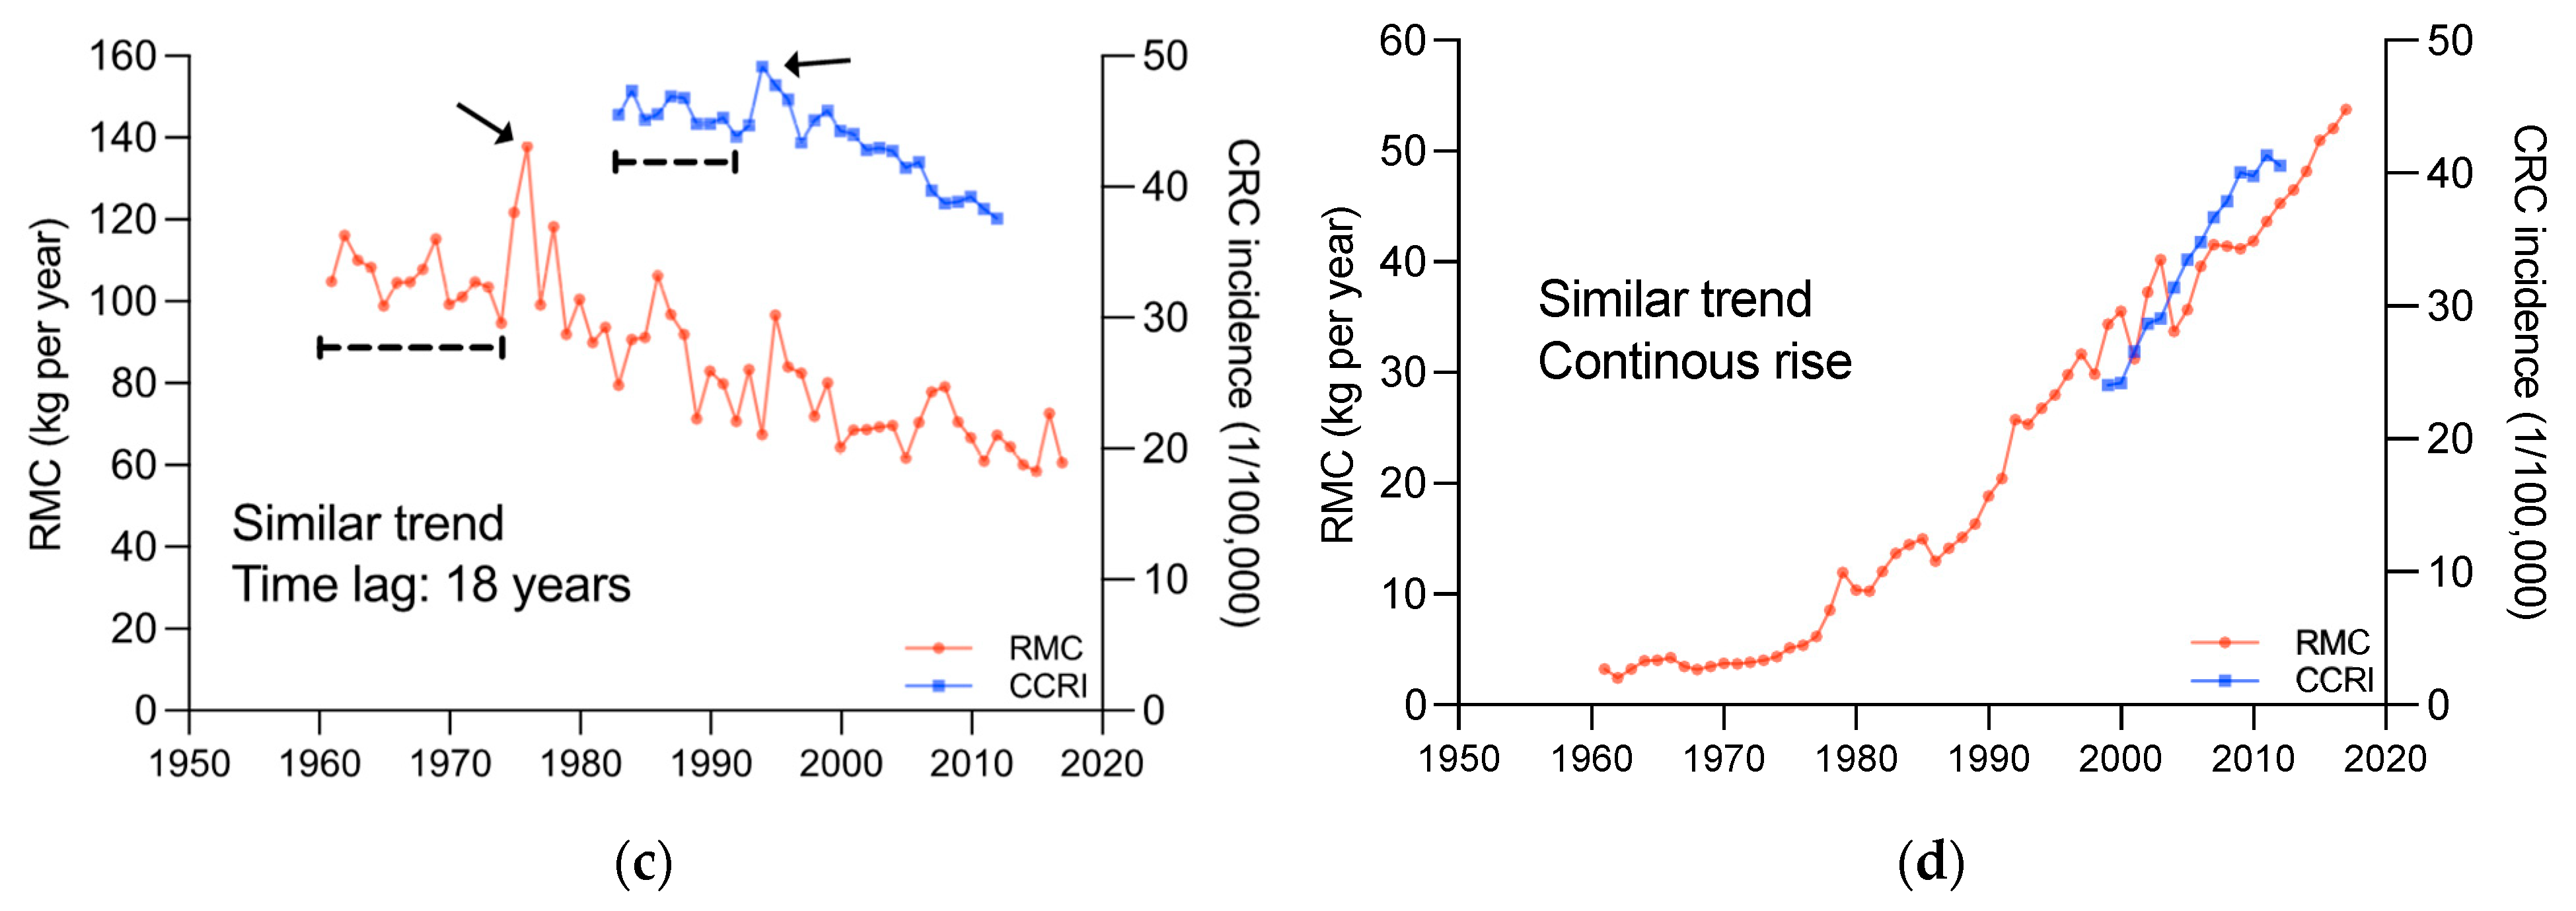
3.3. Lag of RMC’s Influence on CRC Incidence

It is important to note that a high and significant correlation coefficient between two sets of data does not necessarily prove a direct cause-and-effect association between them [52]. So far, in all those correlation analyses, no one has definitively stated that increased RMC or GDP is a cause of increased cancer risk, although the positive correlation coefficients have frequently been obtained.
As such, the influence of time dimension on the association between RMC and cancer incidence are also worth to be explored. The changes of RMC and CRC incidence in 41 countries and regions were compared (Figure 4, more details see also Figures S3 and S4). The results indicated that in most countries and regions, CRC incidence changes exhibited trends similar to RMC changes, and lagged behind RMC changes by about 15–20 years.
The RMC and CRC incidence changes in four typical countries, United States of America, Costa Rica, New Zealand, and Republic of Korea, were displayed in Figure 4. In United States of America (Figure 4a), RMC showed an upward and then downward trend, peaking in 1970, and CRC incidence also showed an upward and then downward trend, peaking in 1985, with similar trends and a lag of around 15 years. In Costa Rica (Figure 4b), both RMC and CRC incidence exhibited “S”-shaped trends, with a lag of around 18 years. In New Zealand (Figure 4c), both RMC and CRC incidence showed an overall downward trend, but with an abrupt upward trend in 1974 and 1992, respectively, and there was a lag of around 18 years. In Republic of Korea (Figure 4d), both RMC and CRC incidence were continuously increasing, without any noticeable changes in trend. This phenomenon has not been reported before.
This novel finding sheds new light on the relationship between these two factors. The similar trends and noticeable lag strongly imply that CRC incidence changes may be caused by RMC changes. Moreover, it is also suggested that the change in CRC incidence caused by the change in RMC may not be observable sufficiently since epidemiological studies are limited by the short follow-up duration; namely, many studies on humans have lasted much less than 10 years [12,13,14,17]. Therefore, we reasoned that the uncertainty of causality from such studies may be related to the short duration.

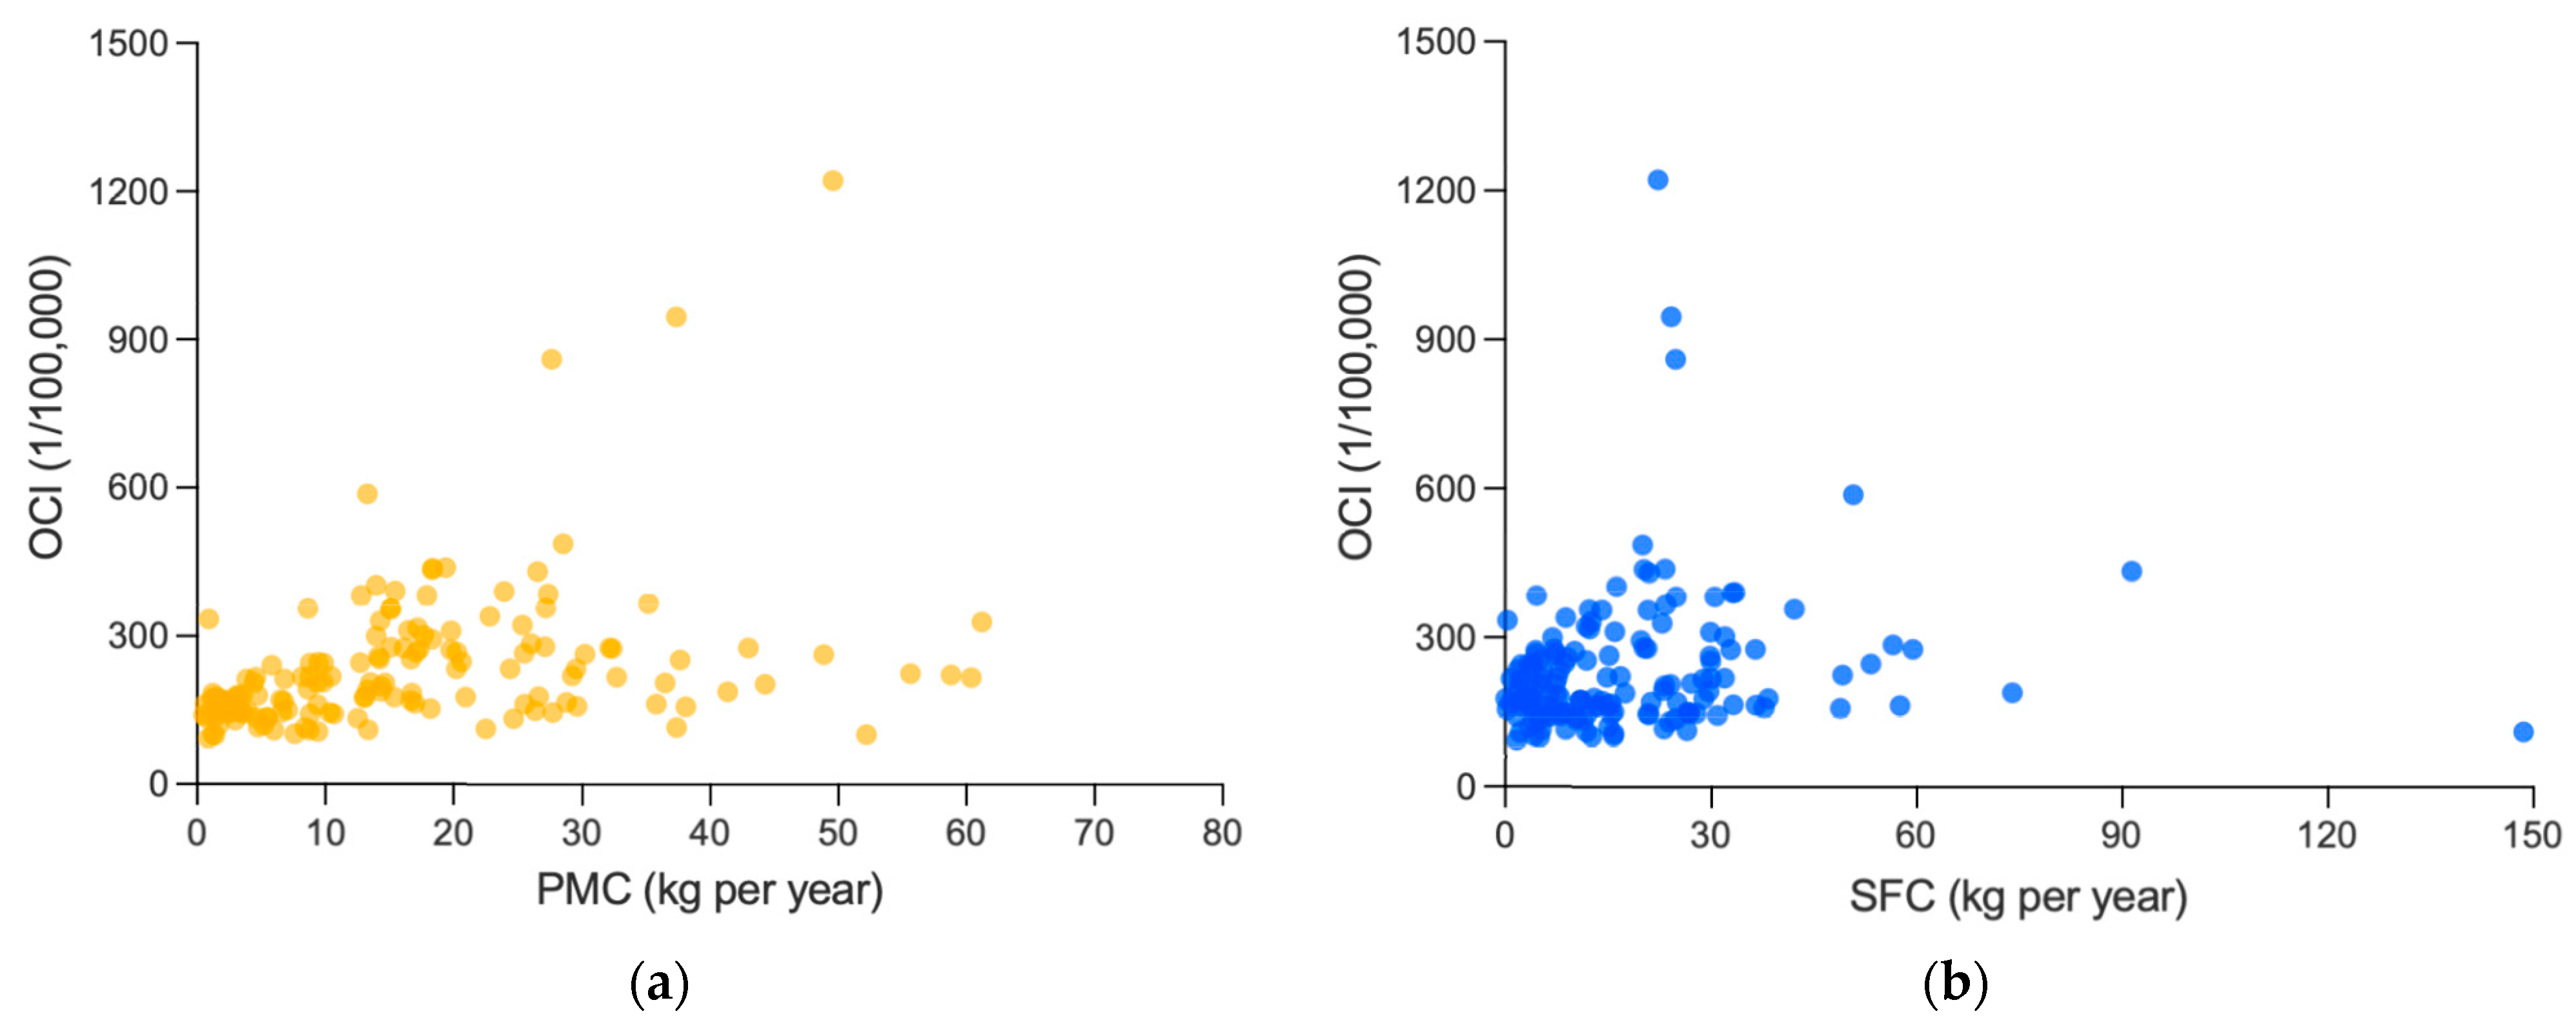
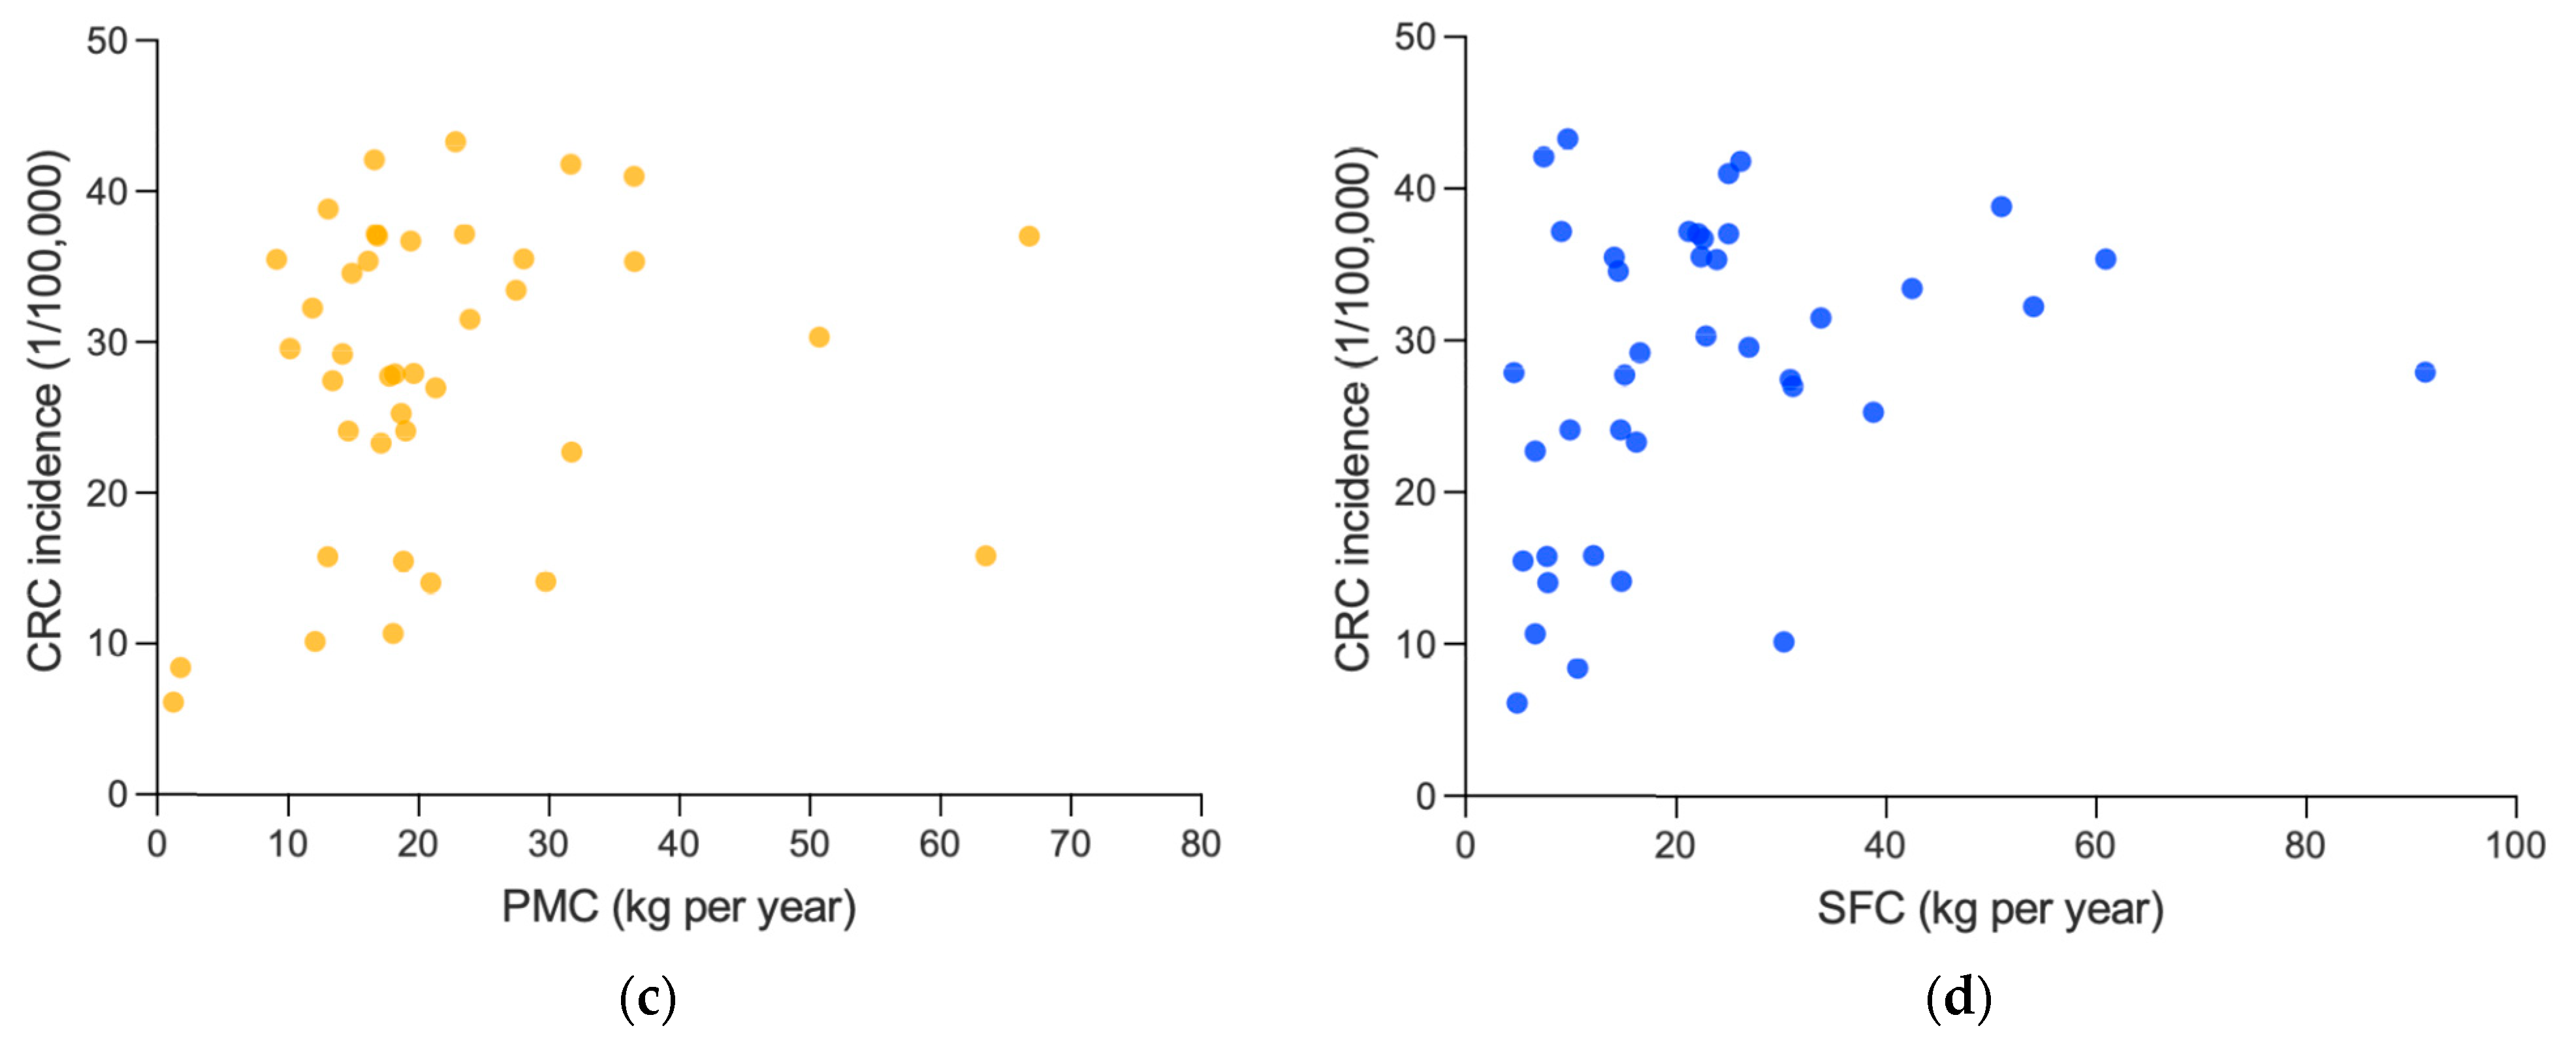
3.4. Association between PMC or SFC and Cancer Incidence

To facilitate comparative analysis with RMC, the association between white meat consumption and cancer incidence was explored (as shown in Table 2 and Figure 5). It is worth noting that PMC, and SFC were reported separately in most studies [15,16,17,18,19,20,21,28]. In this analysis, the convention was followed.
At first, the analysis revealed that there is a significant and moderately positive association between PMC and OCI (0.499, p < 0.001), and a significant and weakly positive correlation coefficient between SFC and OCI (0.213, p = 0.007), which were both weaker than that of RMC (0.798, p < 0.001). Similar results were obtained in CRC incidence. The correlation coefficient of RMC (0.625, p < 0.001) here was also more significant and stronger than those of PMC (0.232, p = 0.150) or SFC (0.330, p = 0.038).
However, referring to Section 3.2.2, after controlling GDP per capita, both PMC (0.089, p = 0.288) and SFC (−0.055, p = 0.514) were non-significantly associated with OCI, different from the remained significantly positive association between RMC and OCI (0.463, p < 0.001), and the partial correlation coefficients between PMC (−0.018, p = 0.912) or SFC (0.081, p = 0.625) and CRC incidence were also non-significant, and much weaker than that between RMC and CRC incidence (0.592, p < 0.001). Thus, the positive association of PMC or SFC mentioned above might probably be attributed to the influence of GDP per capita.
In a word, after taking into account GDP per capita, the two associations are almost negligible, and the P values are all higher than 0.05, consistent with previous epidemiological studies [15,16,17,19,28]. Some studies even suggest a negative relationship between SFC and cancer incidence [18,20,21]; however, it is not seen here. Thus, the positive association between RMC and cancer incidence is more conclusive after comparison with the association between white meat consumption and cancer incidence.
To further fix the effect of GDP per capita, case analysis was performed, as presented in Table 3. In the table, data of PMC, SFC, RMC, OCI and GDP per capita of the top 22 countries and regions with the highest GDP per capita and regions in this study was selected from the 159 countries. Notably, the RMC in Kuwait, Japan, Saudi Arabia, and Oman are found to be distinctly lower from other countries and regions, but the PMC or SFC of them are higher. Consistent with their lower RMC, the OCI therein were also significantly lower than those in other countries and regions with high RMC. It again proves that it is not PMC or SFC, but RMC positively associated with OCI.

3.5. Analysis of Causality between RMC and Cancer Risk

It has been 8 years since the IARC classified red meat as a group 2A carcinogen in 2015 [6], but it seems to have had little impact on meat consumption pattern. In many developing countries, an increase in total meat consumption is still considered as an important indicator of living improvement standards, and the meat consumption is continuously growing [1]. Additionally, meat consumption remains consistently high in developed countries [1]. The concept of a rational meat consumption pattern has attracted little attention.
The reason for this is probably that the causality between RMC and cancer risk has not been established. Although it cannot definitively determine a causality just from the statistical evidence of correlation found in this research yet; the finding of the lag between CRC incidence and RMC strongly supports that the causality exists. After the associations between PMC or SFC and cancer incidence were analyzed, the comparative analysis results further confirm that higher RMC, rather than other meat consumptions, is associated with higher cancer incidence. Therefore, under the trend of meat consumption rising, more attention should be paid to the rationality of the meat consumption pattern [3,53,54,55].

4. Conclusions

In this study, using global data, it systematically confirms that higher RMC is associated with higher cancer incidence. Although the GDP per capita were found to have a great influence on association between RMC and cancer incidence, the significantly positive association remains after controlling this factor. Meanwhile, no association between white meat consumption and cancer incidence was found comparatively after controlling GDP per capita. In addition, some interesting findings in detail were revealed also. Firstly, RMC is significantly and positively associated with OCI and 17 types of cancer incidences. Some of these cancers, such as multiple myeloma, leukemia, testis cancer, have not received adequate attention and require further investigation. Moreover, a lag of around 15–20 years was found between CRC incidence changes and RMC changes. The finding points out the certain causality, and suggests that the follow-up time length in epidemiological studies of the association between RMC and cancer risk should be prolonged enough.
The conclusions based on such a huge, objective third-party database were considered to be reliable, and important in settling the controversy over the association between RMC and cancer risk. Also, they provide directions for future studies on the association between them, and consequently contribute to the development of more rational meat consumption concept, which in turn guides the public towards healthier meat consumption.

Supplementary Materials

The following supporting information can be downloaded at: https://www.mdpi.com/article/10.3390/foods12224164/s1.

Author Contributions

H.M. contributed materials/analysis tools, analyzed the data and wrote the paper. X.Q. conceived and designed the analysis and wrote the paper. All authors have read and agreed to the published version of the manuscript.

Funding

This work was supported by the Key Technology Research and Development Program of Shandong Province (No. 2019JZZY010814).

Data Availability Statement

All the data involved in this research are available in the links provided in Methods.

Acknowledgments

Thanks to all the providers of Our World in Data and Global Cancer Observatory databases.

Conflicts of Interest

The authors declare no competing interests.

Abbreviations

RMCRed Meat Consumption
PMCPoultry Meat Consumption
SFCSeafood and Fish Consumption
OCIOverall Cancer Incidence
CRCColorectal Cancer
GDPGross Domestic Product
IARCInternational Agency for Research on Cancer

References

  1. Godfray, H.C.J.; Aveyard, P.; Garnett, T.; Hall, J.W.; Key, T.J.; Lorimer, J.; Pierrehumbert, R.T.; Scarborough, P.; Springmann, M.; Jebb, S.A. Meat consumption, health, and the environment. Science 2018, 361, eaam5324. [Google Scholar] [CrossRef]
  2. Oostindjer, M.; Alexander, J.; Amdam, G.V.; Andersen, G.; Bryan, N.S.; Chen, D.; Corpet, D.E.; De Smet, S.; Dragsted, L.O.; Haug, A.; et al. The role of red and processed meat in colorectal cancer development: A perspective. Meat Sci. 2014, 97, 583–596. [Google Scholar] [CrossRef]
  3. Gonera, A.; Svanes, E.; Bugge, A.B.; Hatlebakk, M.M.; Prexl, K.-M.; Ueland, Ø. Moving Consumers along the Innovation Adoption Curve: A New Approach to Accelerate the Shift toward a More Sustainable Diet. Sustainability 2021, 13, 4477. [Google Scholar] [CrossRef]
  4. McAfee, A.J.; McSorley, E.M.; Cuskelly, G.J.; Moss, B.W.; Wallace, J.M.; Bonham, M.P.; Fearon, A.M. Red meat consumption: An overview of the risks and benefits. Meat Sci. 2010, 84, 1–13. [Google Scholar] [CrossRef] [PubMed]
  5. Latvala, T.; Niva, M.; Mäkelä, J.; Pouta, E.; Heikkilä, J.; Kotro, J.; Forsman-Hugg, S. Diversifying meat consumption patterns: Consumers’ self-reported past behaviour and intentions for change. Meat Sci. 2012, 92, 71–77. [Google Scholar] [CrossRef] [PubMed]
  6. Bouvard, V.; Loomis, D.; Guyton, K.Z.; Grosse, Y.; Ghissassi, F.E.; Benbrahim-Tallaa, L.; Guha, N.; Mattock, H.; Straif, K. Carcinogenicity of consumption of red and processed meat. Lancet Oncol. 2015, 16, 1599–1600. [Google Scholar] [CrossRef] [PubMed]
  7. Stewart, C.; Piernas, C.; Cook, B.; Jebb, S.A. Trends in UK meat consumption: Analysis of data from years 1–11 (2008-09 to 2018-19) of the National Diet and Nutrition Survey rolling programme. Lancet Planet. Health 2021, 5, e699–e708. [Google Scholar] [CrossRef]
  8. Williams, P. Nutritional composition of red meat. Nutr. Diet. 2007, 64, S113–S119. [Google Scholar] [CrossRef]
  9. Zhong, V.W.; Van Horn, L.; Greenland, P.; Carnethon, M.R.; Ning, H.; Wilkins, J.T.; Lloyd-Jones, D.M.; Allen, N.B. Associations of Processed Meat, Unprocessed Red Meat, Poultry, or Fish Intake With Incident Cardiovascular Disease and All-Cause Mortality. JAMA Intern. Med. 2020, 180, 503–512. [Google Scholar] [CrossRef]
  10. González, N.; Marquès, M.; Nadal, M.; Domingo, J.L. Meat consumption: Which are the current global risks? A review of recent (2010–2020) evidences. Food Res. Int. 2020, 137, 109341. [Google Scholar] [CrossRef]
  11. Wei, X.; Zhu, C.; Ji, M.; Fan, J.; Xie, J.; Huang, Y.; Jiang, X.; Xu, J.; Yin, R.; Du, L.; et al. Diet and Risk of Incident Lung Cancer: A Large Prospective Cohort Study in UK Biobank. Am. J. Clin. Nutr. 2021, 114, 2043–2051. [Google Scholar] [CrossRef] [PubMed]
  12. Inoue-Choi, M.; Sinha, R.; Gierach, G.L.; Ward, M.H. Red and processed meat, nitrite, and heme iron intakes and postmenopausal breast cancer risk in the NIH-AARP Diet and Health Study. Int. J. Cancer 2016, 138, 1609–1618. [Google Scholar] [CrossRef]
  13. Lo, J.J.; Park, Y.M.; Sinha, R.; Sandler, D.P. Association between meat consumption and risk of breast cancer: Findings from the Sister Study. Int. J. Cancer 2020, 146, 2156–2165. [Google Scholar] [CrossRef]
  14. Bradbury, K.E.; Murphy, N.; Key, T.J. Diet and colorectal cancer in UK Biobank: A prospective study. Int. J. Epidemiol. 2020, 49, 246–258. [Google Scholar] [CrossRef]
  15. Vieira, A.R.; Abar, L.; Chan, D.S.M.; Vingeliene, S.; Polemiti, E.; Stevens, C.; Greenwood, D.; Norat, T. Foods and beverages and colorectal cancer risk: A systematic review and meta-analysis of cohort studies, an update of the evidence of the WCRF-AICR Continuous Update Project. Ann. Oncol. 2017, 28, 1788–1802. [Google Scholar] [CrossRef] [PubMed]
  16. Jiang, G.; Li, B.; Liao, X.; Zhong, C. Poultry and fish intake and risk of esophageal cancer: A meta-analysis of observational studies. Asia Pac. J. Clin. Oncol. 2016, 12, e82–e91. [Google Scholar] [CrossRef]
  17. Wang, F.; Chandler, P.D.; Zeleznik, O.A.; Wu, K.; Wu, Y.; Yin, K.; Song, R.; Avila-Pacheco, J.; Clish, C.B.; Meyerhardt, J.A.; et al. Plasma Metabolite Profiles of Red Meat, Poultry, and Fish Consumption, and Their Associations with Colorectal Cancer Risk. Nutrients 2022, 14, 978. [Google Scholar] [CrossRef] [PubMed]
  18. Song, J.; Su, H.; Wang, B.L.; Zhou, Y.Y.; Guo, L.L. Fish consumption and lung cancer risk: Systematic review and meta-analysis. Nutr. Cancer 2014, 66, 539–549. [Google Scholar] [CrossRef]
  19. Pham, N.M.; Mizoue, T.; Tanaka, K.; Tsuji, I.; Tamakoshi, A.; Matsuo, K.; Wakai, K.; Nagata, C.; Inoue, M.; Tsugane, S.; et al. Fish consumption and colorectal cancer risk: An evaluation based on a systematic review of epidemiologic evidence among the Japanese population. Jpn. J. Clin. Oncol. 2013, 43, 935–941. [Google Scholar] [CrossRef]
  20. Nindrea, R.D.; Aryandono, T.; Lazuardi, L.; Dwiprahasto, I. Protective Effect of Omega-3 Fatty Acids in Fish Consumption Against Breast Cancer in Asian Patients: A Meta-Analysis. Asian Pac. J. Cancer Prev. 2019, 20, 327–332. [Google Scholar] [CrossRef] [PubMed]
  21. McClain, K.M.; Bradshaw, P.T.; Khankari, N.K.; Gammon, M.D.; Olshan, A.F. Fish/shellfish intake and the risk of head and neck cancer. Eur. J. Cancer Prev. 2019, 28, 102–108. [Google Scholar] [CrossRef]
  22. Alexander, D.D.; Cushing, C.A. Red meat and colorectal cancer: A critical summary of prospective epidemiologic studies. Obes. Rev. 2011, 12, e472–e493. [Google Scholar] [CrossRef]
  23. Wilunda, C.; Yamaji, T.; Iwasaki, M.; Inoue, M.; Tsugane, S.; Sawada, N. Meat consumption and gastric cancer risk: The Japan Public Health Center-based Prospective Study. Am. J. Clin. Nutr. 2022, 115, 652–661. [Google Scholar] [CrossRef]
  24. Han, M.A.; Zeraatkar, D.; Guyatt, G.H.; Vernooij, R.W.M.; El Dib, R.; Zhang, Y.; Algarni, A.; Leung, G.; Storman, D.; Valli, C.; et al. Reduction of Red and Processed Meat Intake and Cancer Mortality and Incidence: A Systematic Review and Meta-analysis of Cohort Studies. Ann. Intern. Med. 2019, 171, 711–720. [Google Scholar] [CrossRef]
  25. Wu, K.; Liu, L.; Shu, T.; Li, A.; Xia, D.; Sun, X. The relationship between processed meat, red meat, and risk of types of cancer: A Mendelian randomization study. Front. Nutr. 2022, 9, 942155. [Google Scholar] [CrossRef]
  26. Shim, J.S.; Oh, K.; Kim, H.C. Dietary assessment methods in epidemiologic studies. Epidemiol. Health 2014, 36, e2014009. [Google Scholar] [CrossRef]
  27. Farvid, M.S.; Sidahmed, E.; Spence, N.D.; Mante Angua, K.; Rosner, B.A.; Barnett, J.B. Consumption of red meat and processed meat and cancer incidence: A systematic review and meta-analysis of prospective studies. Eur. J. Epidemiol. 2021, 36, 937–951. [Google Scholar] [CrossRef] [PubMed]
  28. Kim, S.R.; Kim, K.; Lee, S.A.; Kwon, S.O.; Lee, J.K.; Keum, N.; Park, S.M. Effect of Red, Processed, and White Meat Consumption on the Risk of Gastric Cancer: An Overall and Dose–Response Meta-Analysis. Nutrients 2019, 11, 826. [Google Scholar] [CrossRef] [PubMed]
  29. Taunk, P.; Hecht, E.; Stolzenberg-Solomon, R. Are meat and heme iron intake associated with pancreatic cancer? Results from the NIH-AARP diet and health cohort. Int. J. Cancer 2016, 138, 2172–2189. [Google Scholar] [CrossRef]
  30. Smolińska, K.; Paluszkiewicz, P. Risk of colorectal cancer in relation to frequency and total amount of red meat consumption. Systematic review and meta-analysis. Arch. Med. Sci. 2010, 6, 605–610. [Google Scholar] [CrossRef] [PubMed]
  31. Lescinsky, H.; Afshin, A.; Ashbaugh, C.; Bisignano, C.; Brauer, M.; Ferrara, G.; Hay, S.I.; He, J.; Iannucci, V.; Marczak, L.B.; et al. Health effects associated with consumption of unprocessed red meat: A Burden of Proof study. Nat. Med. 2022, 28, 2075–2082. [Google Scholar] [CrossRef] [PubMed]
  32. Zheng, P.; Afshin, A.; Biryukov, S.; Bisignano, C.; Brauer, M.; Bryazka, D.; Burkart, K.; Cercy, K.M.; Cornaby, L.; Dai, X.; et al. The Burden of Proof studies: Assessing the evidence of risk. Nat. Med. 2022, 28, 2038–2044. [Google Scholar] [CrossRef] [PubMed]
  33. Stanaway, J.D.; Afshin, A.; Ashbaugh, C.; Bisignano, C.; Brauer, M.; Ferrara, G.; Garcia, V.; Haile, D.; Hay, S.I.; He, J.; et al. Health effects associated with vegetable consumption: A Burden of Proof study. Nat. Med. 2022, 28, 2066–2074. [Google Scholar] [CrossRef] [PubMed]
  34. Dai, X.; Gil, G.F.; Reitsma, M.B.; Ahmad, N.S.; Anderson, J.A.; Bisignano, C.; Carr, S.; Feldman, R.; Hay, S.I.; He, J.; et al. Health effects associated with smoking: A Burden of Proof study. Nat. Med. 2022, 28, 2045–2055. [Google Scholar] [CrossRef]
  35. Razo, C.; Welgan, C.A.; Johnson, C.O.; McLaughlin, S.A.; Iannucci, V.; Rodgers, A.; Wang, N.; LeGrand, K.E.; Sorensen, R.J.D.; He, J.; et al. Effects of elevated systolic blood pressure on ischemic heart disease: A Burden of Proof study. Nat. Med. 2022, 28, 2056–2065. [Google Scholar] [CrossRef]
  36. Tong, T.Y.N.; Papier, K.; Key, T.J. Meat, vegetables and health—Interpreting the evidence. Nat. Med. 2022, 28, 2001–2002. [Google Scholar] [CrossRef]
  37. Mutanen, M.; Pajari, A.M.; Oikarinen, S.I. Beef induces and rye bran prevents the formation of intestinal polyps in Apc(Min) mice: Relation to beta-catenin and PKC isozymes. Carcinogenesis 2000, 21, 1167–1173. [Google Scholar] [CrossRef]
  38. Parnaud, G.; Peiffer, G.; Taché, S.; Corpet, D.E. Effect of meat (beef, chicken, and bacon) on rat colon carcinogenesis. Nutr. Cancer. 1998, 32, 165–173. [Google Scholar] [CrossRef]
  39. Pierre, F.; Freeman, A.; Taché, S.; Van der Meer, R.; Corpet, D.E. Beef meat and blood sausage promote the formation of azoxymethane-induced mucin-depleted foci and aberrant crypt foci in rat colons. J. Nutr. 2004, 134, 2711–2716. [Google Scholar] [CrossRef] [PubMed]
  40. Rombouts, C.; Van Meulebroek, L.; De Spiegeleer, M.; Goethals, S.; Van Hecke, T.; De Smet, S.; De Vos, W.H.; Vanhaecke, L. Untargeted Metabolomics Reveals Elevated L-Carnitine Metabolism in Pig and Rat Colon Tissue Following Red Versus White Meat Intake. Mol. Nutr. Food Res. 2021, 65, e2000463. [Google Scholar] [CrossRef]
  41. Sung, H.; Ferlay, J.; Siegel, R.L.; Laversanne, M.; Soerjomataram, I.; Jemal, A.; Bray, F. Global Cancer Statistics 2020: GLOBOCAN Estimates of Incidence and Mortality Worldwide for 36 Cancers in 185 Countries. CA Cancer J. Clin. 2021, 71, 209–249. [Google Scholar] [CrossRef] [PubMed]
  42. Zhang, W.; Belton, B.; Edwards, P.; Henriksson, P.J.G.; Little, D.C.; Newton, R.; Troell, M. Aquaculture will continue to depend more on land than sea. Nature 2022, 603, E2–E4. [Google Scholar] [CrossRef] [PubMed]
  43. Costello, C.; Cao, L.; Gelcich, S.; Cisneros-Mata, M.; Free, C.M.; Froehlich, H.E.; Golden, C.D.; Ishimura, G.; Maier, J.; Macadam-Somer, I.; et al. The future of food from the sea. Nature 2020, 588, 95–100. [Google Scholar] [CrossRef]
  44. Geyik, Ö.; Hadjikakou, M.; Bryan, B.A. Climate-friendly and nutrition-sensitive interventions can close the global dietary nutrient gap while reducing GHG emissions. Nat. Food 2023, 4, 61–73. [Google Scholar] [CrossRef]
  45. Wassénius, E.; Porkka, M.; Nyström, M.; Søgaard Jørgensen, P. A global analysis of potential self-sufficiency and diversity displays diverse supply risks. Global Food Secur. 2023, 37, 100673. [Google Scholar] [CrossRef]
  46. Diallo, A.; Deschasaux, M.; Latino-Martel, P.; Hercberg, S.; Galan, P.; Fassier, P.; Allès, B.; Guéraud, F.; Pierre, F.H.; Touvier, M. Red and processed meat intake and cancer risk: Results from the prospective NutriNet-Santé cohort study. Int. J. Cancer 2018, 142, 230–237. [Google Scholar] [CrossRef]
  47. Huang, Y.; Cao, D.; Chen, Z.; Chen, B.; Li, J.; Guo, J.; Dong, Q.; Liu, L.; Wei, Q. Red and processed meat consumption and cancer outcomes: Umbrella review. Food Chem. 2021, 356, 129697. [Google Scholar] [CrossRef]
  48. Seiwert, N.; Heylmann, D.; Hasselwander, S.; Fahrer, J. Mechanism of colorectal carcinogenesis triggered by heme iron from red meat. Biochim. Biophys. Acta. Rev. Cancer 2020, 1873, 188334. [Google Scholar] [CrossRef]
  49. Schiller, J.T.; Lowy, D.R. An Introduction to Virus Infections and Human Cancer. Recent Results Cancer Res. 2021, 217, 1–11. [Google Scholar]
  50. Araldi, R.P.; Sant’Ana, T.A.; Módolo, D.G.; de Melo, T.C.; Spadacci-Morena, D.D.; de Cassia Stocco, R.; Cerutti, J.M.; de Souza, E.B. The human papillomavirus (HPV)-related cancer biology: An overview. Biomed. Pharmacother. 2018, 106, 1537–1556. [Google Scholar] [CrossRef]
  51. Casas, C.P.R.; Albuquerque, R.C.R.; Loureiro, R.B.; Gollner, A.M.; Freitas, M.G.; Duque, G.; Viscondi, J.Y.K. Cervical cancer screening in low- and middle-income countries: A systematic review of economic evaluation studies. Clinics 2022, 77, 100080. [Google Scholar] [CrossRef]
  52. Rothman, K.J.; Greenland, S. Causation and causal inference in epidemiology. Am. J. Public Health 2005, 95 (Suppl. S1), S144–S150. [Google Scholar] [CrossRef] [PubMed]
  53. Ueland, Ø.; Rødbotten, R.; Varela, P. Meat consumption and consumer attitudes—A Norwegian perspective. Meat Sci. 2022, 192, 108920. [Google Scholar] [CrossRef] [PubMed]
  54. Font, I.F.M.; Guerrero, L. Spanish perspective on meat consumption and consumer attitudes. Meat Sci. 2022, 191, 108874. [Google Scholar] [CrossRef] [PubMed]
  55. Estévez-Moreno, L.X.; Miranda-de la Lama, G.C. Meat consumption and consumer attitudes in México: Can persistence lead to change? Meat Sci. 2022, 193, 108943. [Google Scholar] [CrossRef]
Figure 1. Associations between RMC and OCI or CRC incidence: (a) the association between RMC and OCI, RMC and OCI are averages from 1992 to 2017, including 159 countries and regions; and the (b) association between RMC and CRC incidence; bubble colors represent the different continents and bubble size represents the GDP per capita. RMC and CRI are averages from 1999 to 2010, including 40 countries and regions. The results of the dose–response analysis is shown in Figure S1.
Foods 12 04164 g001
Figure 2. Associations between RMC and specific cancer incidences: cluster analysis of 36 cancer types; cancer incidence is for the year 2020, including 153 countries and regions. The average RMC from 1992 to 2017 is used to assess the level of RMC in these areas, with 0–20 kg per year defined as low, 20–40 kg per year defined as middle, and more than 40 kg per year defined as high.
Foods 12 04164 g002
Figure 3. Distribution of RMC, OCI and GDP per capita: (a) the distribution of RMC; (b) the distribution of OCI; (c) the distribution of GDP per capita. The averaged data from 1992 to 2017 are used to assess the level of local RMC, OCI and GDP per capita, including 144 countries and regions. The gray areas in the maps indicate no data.
Foods 12 04164 g003
Figure 4. Changes in RMC and CRC incidence, 1961~2017; (a), United States of America. (b), Costa Rica. (c), New Zealand. (d), Republic of Korea. The area indicated by the arrows and line segments is the basis for determining similarity.
Foods 12 04164 g004aFoods 12 04164 g004b
Figure 5. Association between white meat consumption and cancer incidences: (a) association between PMC and OCI; and (b) association between SFC and OCI. PMC, SFC and OCI are averages from 1992 to 2017, including 159 countries and regions. (c) Association between PMC and CRC incidence. (d) Association between PMC and CRC incidence. PMC, SFC and OCI are averages from 1999 to 2010, including 40 countries and regions.
Foods 12 04164 g005aFoods 12 04164 g005b
Table 1. Correlation coefficients between incidences of cancers and RMC.
Cancer TypeCorrelation Coefficientp-Value
Skin melanoma **0.7710.000
Multiple myeloma **0.7660.000
Breast0.7550.000
Leukemia **0.7120.000
Prostate0.6820.000
Colorectum0.6250.000
Testis **0.6080.000
Hodgkin lymphoma **0.5620.000
Non-Hodgkin lymphoma0.5500.000
Bladder0.5250.001
Kidney0.5060.001
Brain, CNS **0.4700.002
Corpus uteri **0.4400.004
Lung0.3870.014
Ovary **0.3720.018
Pancreas0.3610.022
Oropharynx **0.3330.036
Larynx0.1470.364
Oesophagus0.1470.367
Kaposi sarcoma−0.0030.985
Thyroid0.0190.908
Gallbladder−0.1150.479
Liver−0.1430.379
Uterus−0.2160.180
Stomach−0.3920.012
Cervix uteri **−0.4730.002
Incidences of the 26 cancers and RMC are averages from 1999 to 2010, including 40 countries and regions. A “**” indicates that this type of cancer has not been given sufficient attention previously.
Table 2. Correlation coefficients between meat consumption and cancer incidences.
TypeCorrelation Coefficient (n = 159/40)p-ValuePartial-Correlation Coefficient (n = 144/40)p-Value
OCI/RMC0.7980.0000.4630.000
OCI/PMC0.4990.0000.0890.288
OCI/SFC0.2130.007−0.0550.514
CRC incidence/RMC0.6250.0000.5920.000
CRC incidence/PMC0.2320.150−0.0180.912
CRC incidence/SFC0.3300.0380.0810.625
The correlation coefficients between OCI and RMC cover 159 countries and the partial correlation coefficients cover 144 countries. The correlation coefficients and partial correlation coefficients between CRC incidence and RMC both cover 40 countries.
Table 3. GDP per capita, OCI, RMC, PMC, SFC in high GDP per capita countries and regions.
Countries and RegionsGDP per Capita
(US $)
OCI
(1/100,000)
RMC
(kg/Year)
PMC
(kg/Year)
SFC
(kg/Year)
NOR63,400.99587.5248.6813.3050.83
KWT52,182.33100.4527.3952.2512.69
CHE48,385.96402.5256.7213.9816.26
USA46,827.121221.5170.7749.6422.37
IRL41,997.98430.4162.0326.5821.06
AUS40,018.90945.4375.0737.4024.31
DNK39,982.15438.2462.3519.4223.40
NLD39,166.50437.7160.0618.3820.28
CAN38,243.56365.5559.6435.2423.43
SWE36,893.81382.0558.3412.8330.59
DEU36,474.24354.9368.5615.1314.16
AUT36,453.57316.4676.6217.2112.34
ISL34,852.42433.7254.6418.3591.45
JPN34,202.50275.9428.2216.1459.50
FRA34,012.14390.2864.2623.9433.15
FIN33,659.75390.6552.8215.4833.59
SAU33,268.51114.9110.7837.438.85
GBR33,105.29486.5648.9328.5720.11
ITA32,559.55381.8162.6917.9324.96
TWN30,874.74274.6046.1632.4132.90
OMN29,910.23111.7221.3922.5426.51
NZL28,864.18860.1170.9527.6624.95
The GDP per capita, OCI, RMC, PMC, SFC of 159 countries and regions has been arranged based on their GDP per capita (as shown in Table S3), and the top 22 countries and regions have been selected and listed, with their names represented by abbreviations. The GDP per capita, OCI, RMC, PMC, SFC are all averages from 1992 to 2017. Kuwait, Japan, Saudi Arabia, Oman are the four countries that display unique data, with considerably lower RMC compared to other countries that have similar GDP per capita. The data from these four countries are bolded.
Disclaimer/Publisher’s Note: The statements, opinions and data contained in all publications are solely those of the individual author(s) and contributor(s) and not of MDPI and/or the editor(s). MDPI and/or the editor(s) disclaim responsibility for any injury to people or property resulting from any ideas, methods, instructions or products referred to in the content.

