Communication

Genetic Diversity of Aspergillus flavus on Maize in Guatemala

1
USDA ARS National Biological Control Laboratory, 59 Lee Road, Stoneville, MS 38776, USA
2
Semilla Nueva, 7 Avenida 14-44 Zona 9 Edificio La Galería, Oficina 35 Guatemala, Guatemala City 01009, Guatemala
3
Department of Biological Sciences, University of Memphis, 3774 Walker Avenue, Memphis, TN 38152, USA
*
Author to whom correspondence should be addressed.
Foods 2023, 12(20), 3864; https://doi.org/10.3390/foods12203864
Submission received: 12 September 2023 / Revised: 6 October 2023 / Accepted: 17 October 2023 / Published: 21 October 2023
(This article belongs to the Section Food Quality and Safety)

Abstract

:
Aflatoxin contamination of maize is a leading threat to health in Guatemala. This contamination is the result of infection from Aspergillus flavus and has been effectively reduced in other countries through application of nonaflatoxigenic, indigenous strains of A. flavus. We collected 82 maize samples from throughout Guatemala in two years and isolated 272 A. flavus from these samples, including 126 unique genotypes. We provide here a phenotypic and simple sequence repeat (SSR)-based genotypic description of these isolates, as well as an analysis of the diversity of this population. High levels of genetic diversity were observed with the nonaflatoxigenic isolates in this study, but this information contributes to the development of indigenous aflatoxin biocontrol products.

1. Introduction

Maize is central to the lives of people in Guatemala. Over 40% of the agriculture land in Guatemala is devoted to maize cultivation, and about 60% of this is managed by subsistence farmers [1]. Over 900,000 families produce maize, including about 600,000 families in poverty and over 150,000 families in extreme poverty [2]. Annual per capita maize consumption is 92 kg and maize food products are foundational to the diet in rural households [3]. While the best commercial farms might yield over 8 MT/ha (ca. 130 bu/acre) [4], the national average production is about 2 MT/ha and subsistence farmers are only slightly over 1 MT/ha [3].
Aspergillus flavus is a minor, opportunistic pathogen of maize, but is highly important because infected maize can become contaminated with aflatoxin (AFs), a set of related secondary metabolites. Aflatoxin B1, one of these metabolites, is the most potent carcinogen found in nature [5]. In high-income nations of the world, the maize trade is well regulated and robustly monitored, and AF-contaminated maize is removed from the market or diverted to lower-value uses (e.g., industrial applications). AF contamination is undetected and unregulated in maize outside of the commercial markets, as is the case with subsistence farming. Factors that facilitate A. flavus infection of maize such as extreme heat, drought stress, insect damage, poor fertility, and poor storage conditions are commonplace in Guatemala. Furthermore, several practices that mitigate A. flavus infection, including genetically engineered insect resistance, irrigation, appropriate nitrogen fertility, prompt harvest and rapid drying and storage of the crop, are generally out of reach for Guatemalan farmers. This environment and the associated cultural practices support a high incidence of aflatoxin in maize, and dangerous aflatoxin concentrations are frequently observed. One survey in Guatemala noted that 22% of maize samples contained over 20 ppb, the threshold for general consumption in the U.S, and 14% contained over 10 times the threshold (200 ppb) [6]. The people of Guatemala have unhealthy biomarkers consistent with chronic aflatoxin exposure and associated with cirrhosis, liver cancer and childhood stunting [6,7,8,9].
In some maize-growing nations AF contamination of maize has been prevented using a biological control strategy of applying indigenous isolates of A. flavus that are aflatoxin non-producers [10,11]. This biological control strategy has been highly effective, typically resulting in over a 90% reduction in AF, and is relatively affordable [12].
Our objectives in the present research were to document the genetic diversity of A. flavus on Guatemalan maize samples. Isolates were collected, examined for aflatoxigenicity and genetically characterized with SSR and mating type markers to contribute towards the identification of biocontrol isolates suitable for AF mitigation in Guatemala.

2. Materials and Methods

2.1. Isolation and Characterization of Aspergillus favus from Grain Samples

Grain samples were collected directly from maize producers in February 2021 and March 2023 and delivered to the USDA-ARS Biological Control of Pests Research Unit, Stoneville, MS, under APHIS permit. Milled grain samples were diluted with 0.1% Triton before being isolated on mDRB media [13], with 4–5 isolates collected per grain sample and 272 isolates collected in total. Isolates from mDRB were transferred to ß-cyclodextrin-adjusted potato dextrose agar (ß-CD PDA) for morphological characterization. Sporulating agar plugs from ß-CD PDA were preserved in sterile water in screw-top vials at room temperature and archived for future research. After 6–7 days of incubation in the dark at 28 °C the undersides of the cultures were observed and the color, ‘white’ or ‘yellow’, was recorded, as described previously [14]. The media was examined under UV light for the presence of fluorescence, which in some studies, has been linked to aflatoxigenicity [14]. The aflatoxigenicity of each isolate was evaluated by growing it on maize, extracting it with 70% methanol and quantifying it using HPLC-FLD, as described previously [15]. They were then grouped as zero, low (1–20 ng/mL), medium (20–300 ng/mL) or high (>300 ng/mL) aflatoxin producers [16,17].
The DNA was isolated from spores using the method outlined by Callicott et al. [18]. Simple sequence repeat (SSR) markers were amplified with 16 primer pairs [16,18,19,20] and amplicons were separated on an ABI 373 DNA Analyzer with the LIZ 500 size standard to genotype A. flavus isolates. Strains 21882 and 18543 were also amplified as a quality control/sizing standards. Ramirez-Prado [21] primers were utilized to amplify the MAT mating type locus. Geneious Prime 2002.2.1 (www.geneious.com, accessed on 16 October 2023) was used to score SSR and MAT locus alleles.

2.2. Population Genetic Analyses

The genotypic diversity of the 272 isolates was assessed; however, some of these samples could represent clones and potentially bias genetic diversity statistics. Therefore, we analyzed our data set in two ways: in the first, we assessed haplotypic diversity on the full data set. i.e., 272 samples. In the second, we analyzed genetic diversity on 126 unique haplotypes.
In order to identify the clone-only data set, we used the software program GENODIVEv. 2.0b27 [22] to assign individuals to clones. Assignment to clones was carried out using the Meirmans and Van Tienderen [22] algorithm, which calculates a genetic distance matrix and uses a clonal threshold. This information is used to delineate samples as unique clones using the stepwise mutation model option and missing data is ignored. In the clone-only data set, toxicity groups were assigned to clones by calculating the median for all samples in that clone.
Measures of haplotypic diversity for both data sets were calculated for each SSR locus using GenAlEx 6.5 [23] in Microsoft Excel; number of alleles (Na), number of effective alleles (Ne = 1/(Sum pi2)), Shannon’s information index (I = −1 × Sum (pi × Ln (pi)), haplotype diversity (h = 1 − Sum pi2), and unbiased diversity (uh = (N/(N − 1)) × h), where N is the number of individuals, pi is the frequency of the i-th allele in the population, and Sum pi2 is the sum of the squared population allele frequencies. Significance for differences among toxicity groupings in genetic diversity was assessed using a two-way analysis of variance (ANOVA) with the main effects (factors) of toxicity group and locus, and with the dependent variables (response variables), number of different alleles (Na), number of effective alleles (Ne), information index (I), haploid genetic diversity (h), and unbiased haploid genetic diversity (uh). Use of a common set of genetic markers across groupings can result in increased statistical resolution for differences among populations because locus-to-locus variation is explicitly included in the model. Two-factor ANOVAs were followed with post hoc LS mean differences Tukey tests using JMP version 13 (SAS Institute, Cary, NC, USA).
The MSTree V2 algorithm was used on the 272 sample dataset with GrapeTree 1.5.0 software to visualize a minimum spanning tree (MSTree). MSTree V2 implements Edmonds’ algorithm [24] and is a novel minimum spanning tree from Zhou et al. [25] and is more tolerant of missing data than classical MSTrees.

3. Results and Discussion

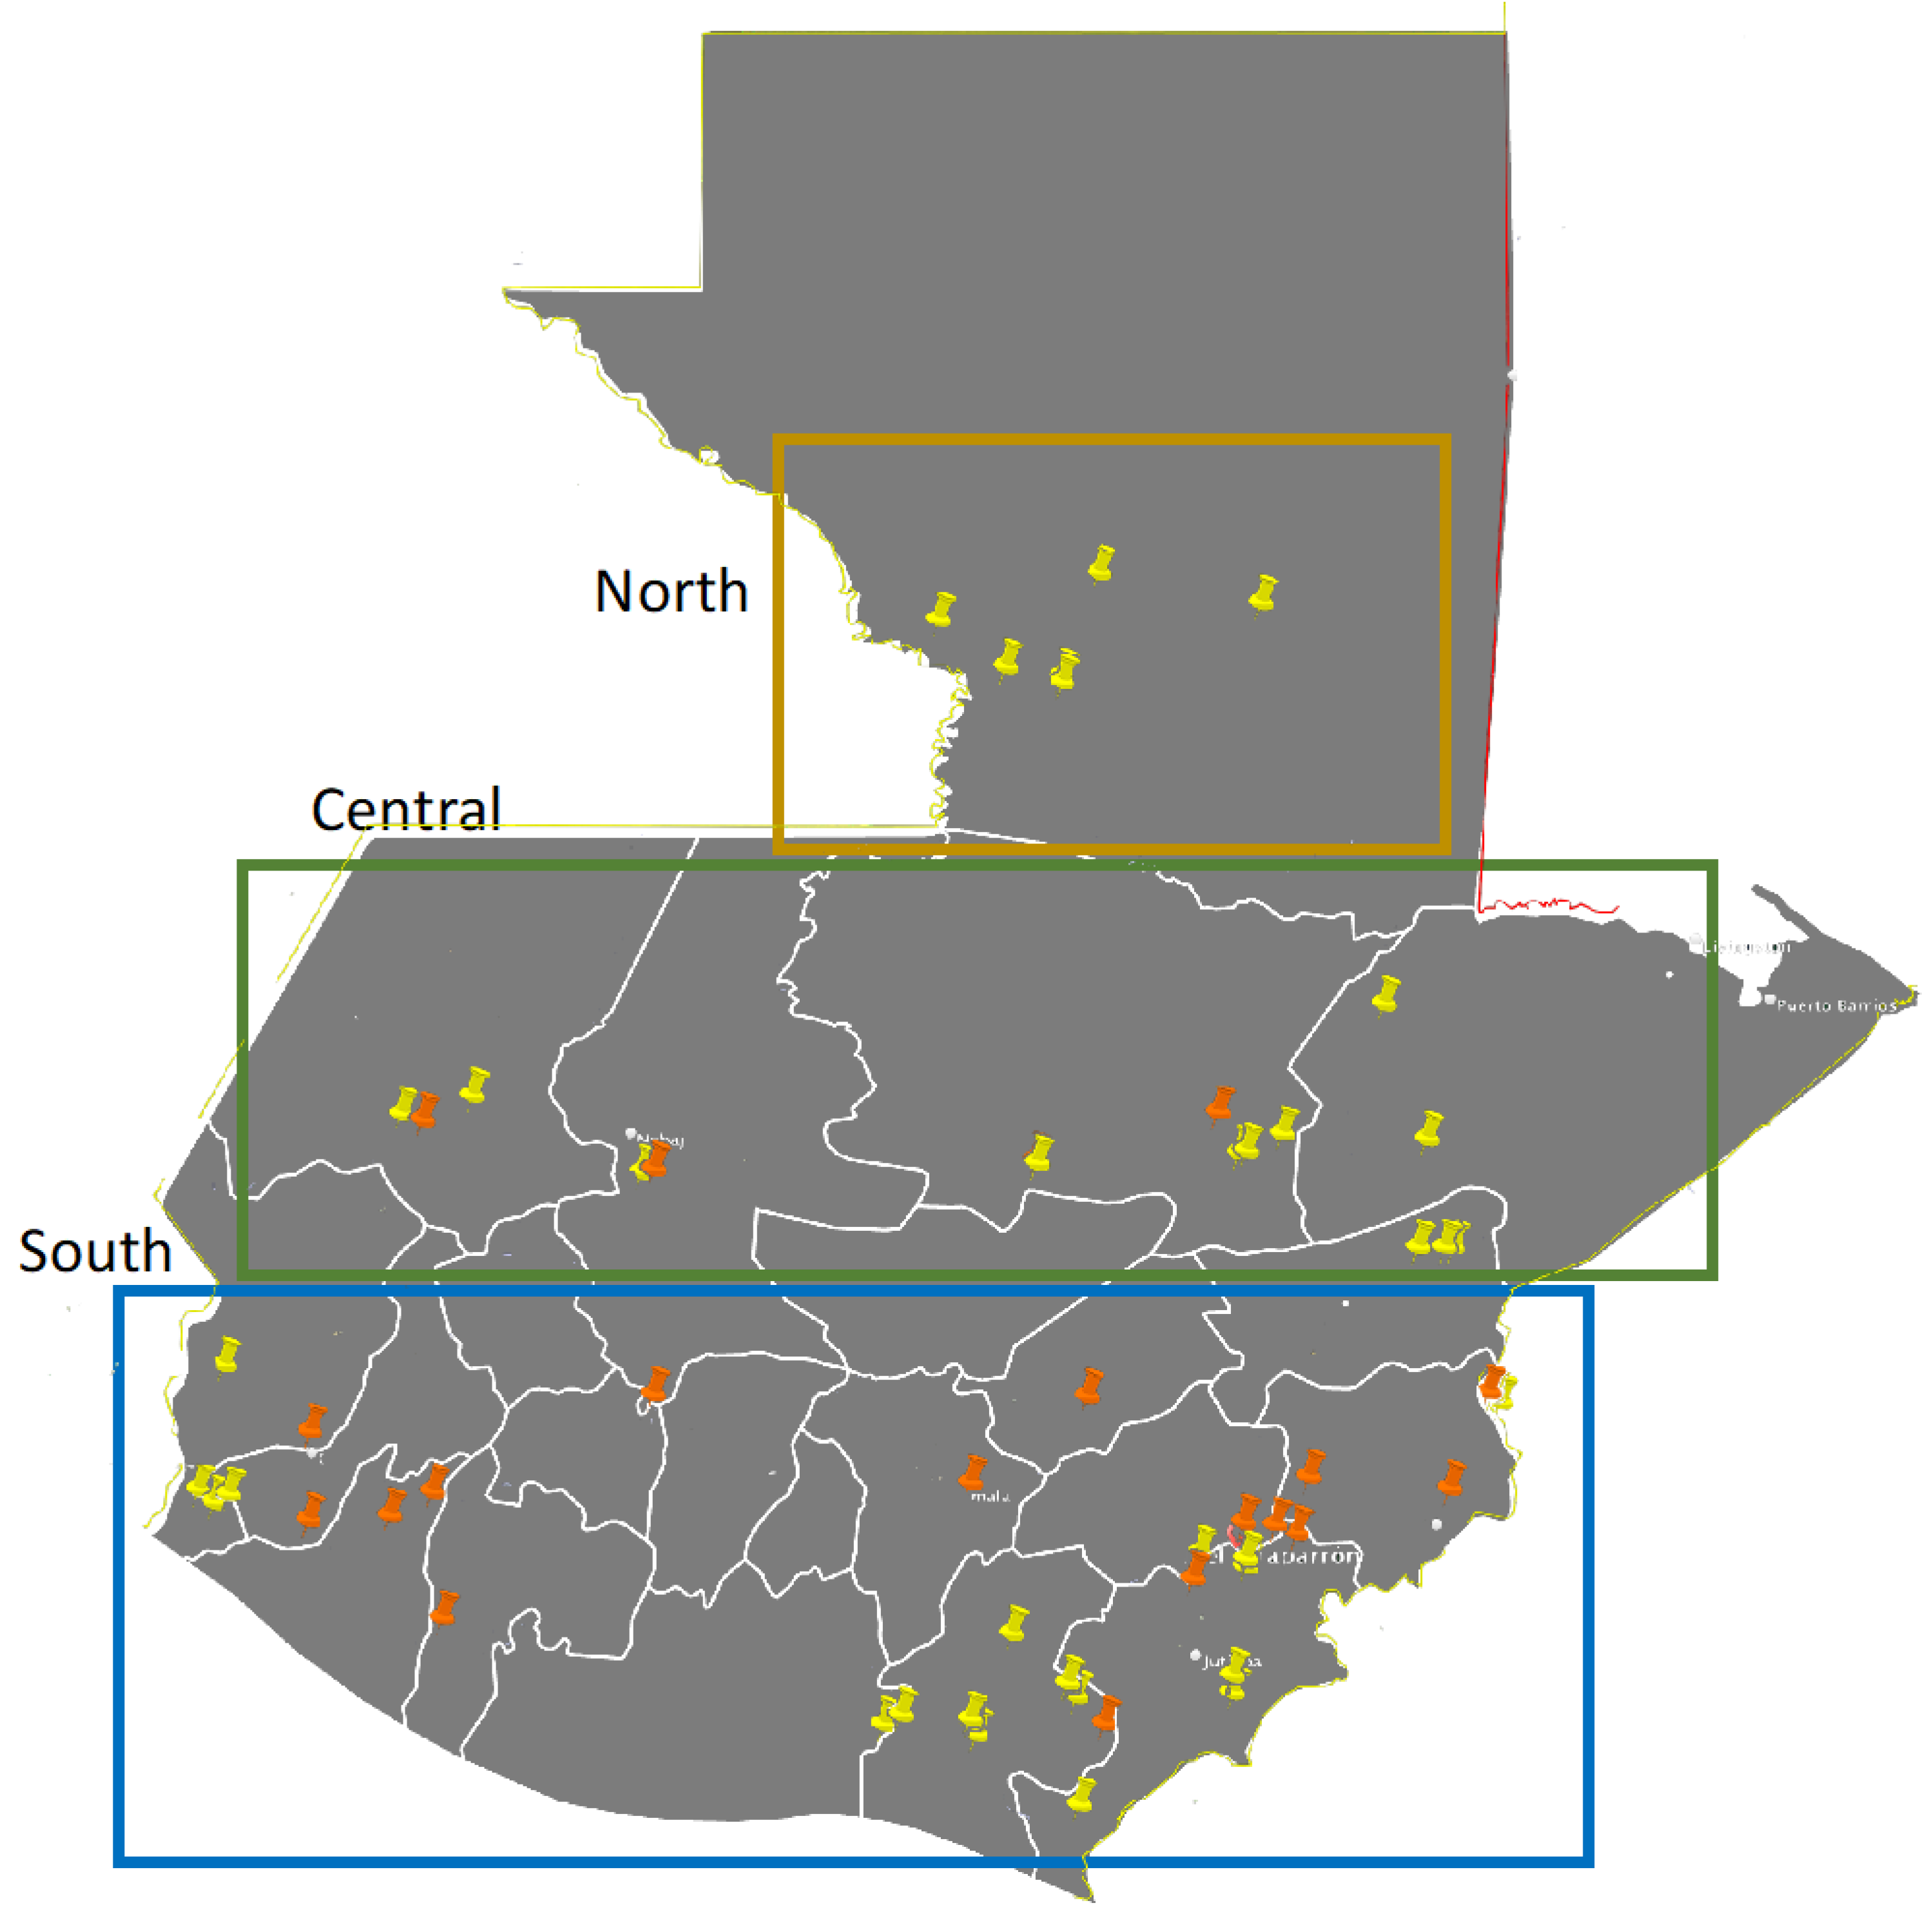
3.1. Grain Samples and Phenotypes of Isolates

Isolations of A. flavus from 34 maize samples in 2021 and 48 maize samples in 2023 resulted in 272 unique isolates. These maize samples included locally produced cultivars; conventional varieties, commercial maize hybrids, as well as recently developed hybrids with improved nutritional qualities [26]. The collection locations are indicated in Figure 1, with detailed location and cultivars in Table 1. The A. flavus isolates were scored for pigmentation of the culture media and for the presence or absence of fluorescence when viewed under UV light. Detailed results are available in Supplemental Table S2 and summarized in Figure 2. There was a nearly even divide among the four visual phenotypes in 2021, and a strong shift in 2023 with over 80% of the isolates being scored as yellow, fluorescent. This shift was associated with an almost complete disappearance of the two white phenotypes.
The aflatoxigenic potential of each isolate was also measured after growth on autoclaved maize. Over half of the isolates in the present survey produced over 20 ppb aflatoxin when grown on maize in laboratory conditions. For comparison, only about 40% of isolates from maize in the United States that was exceptionally highly contaminated with aflatoxin were similarly aflatoxigenic [16]. Less than one-fourth of the isolates were ‘medium’ or ‘high’ aflatoxin producers in another survey of grain isolates from Louisiana, USA [17]. The fact that the Guatemalan A. flavus population is shifted so strongly toward a highly toxigenic state is an indication of the difficulty in producing safe maize in that country. It also may represent a surprising opportunity for biological control. That is, if the aflatoxin levels common in Guatemalan maize are related to the highly aflatoxigenic state of the indigenous A. flavus population, then shifting that population through application of biocontrol isolates might be especially effective.

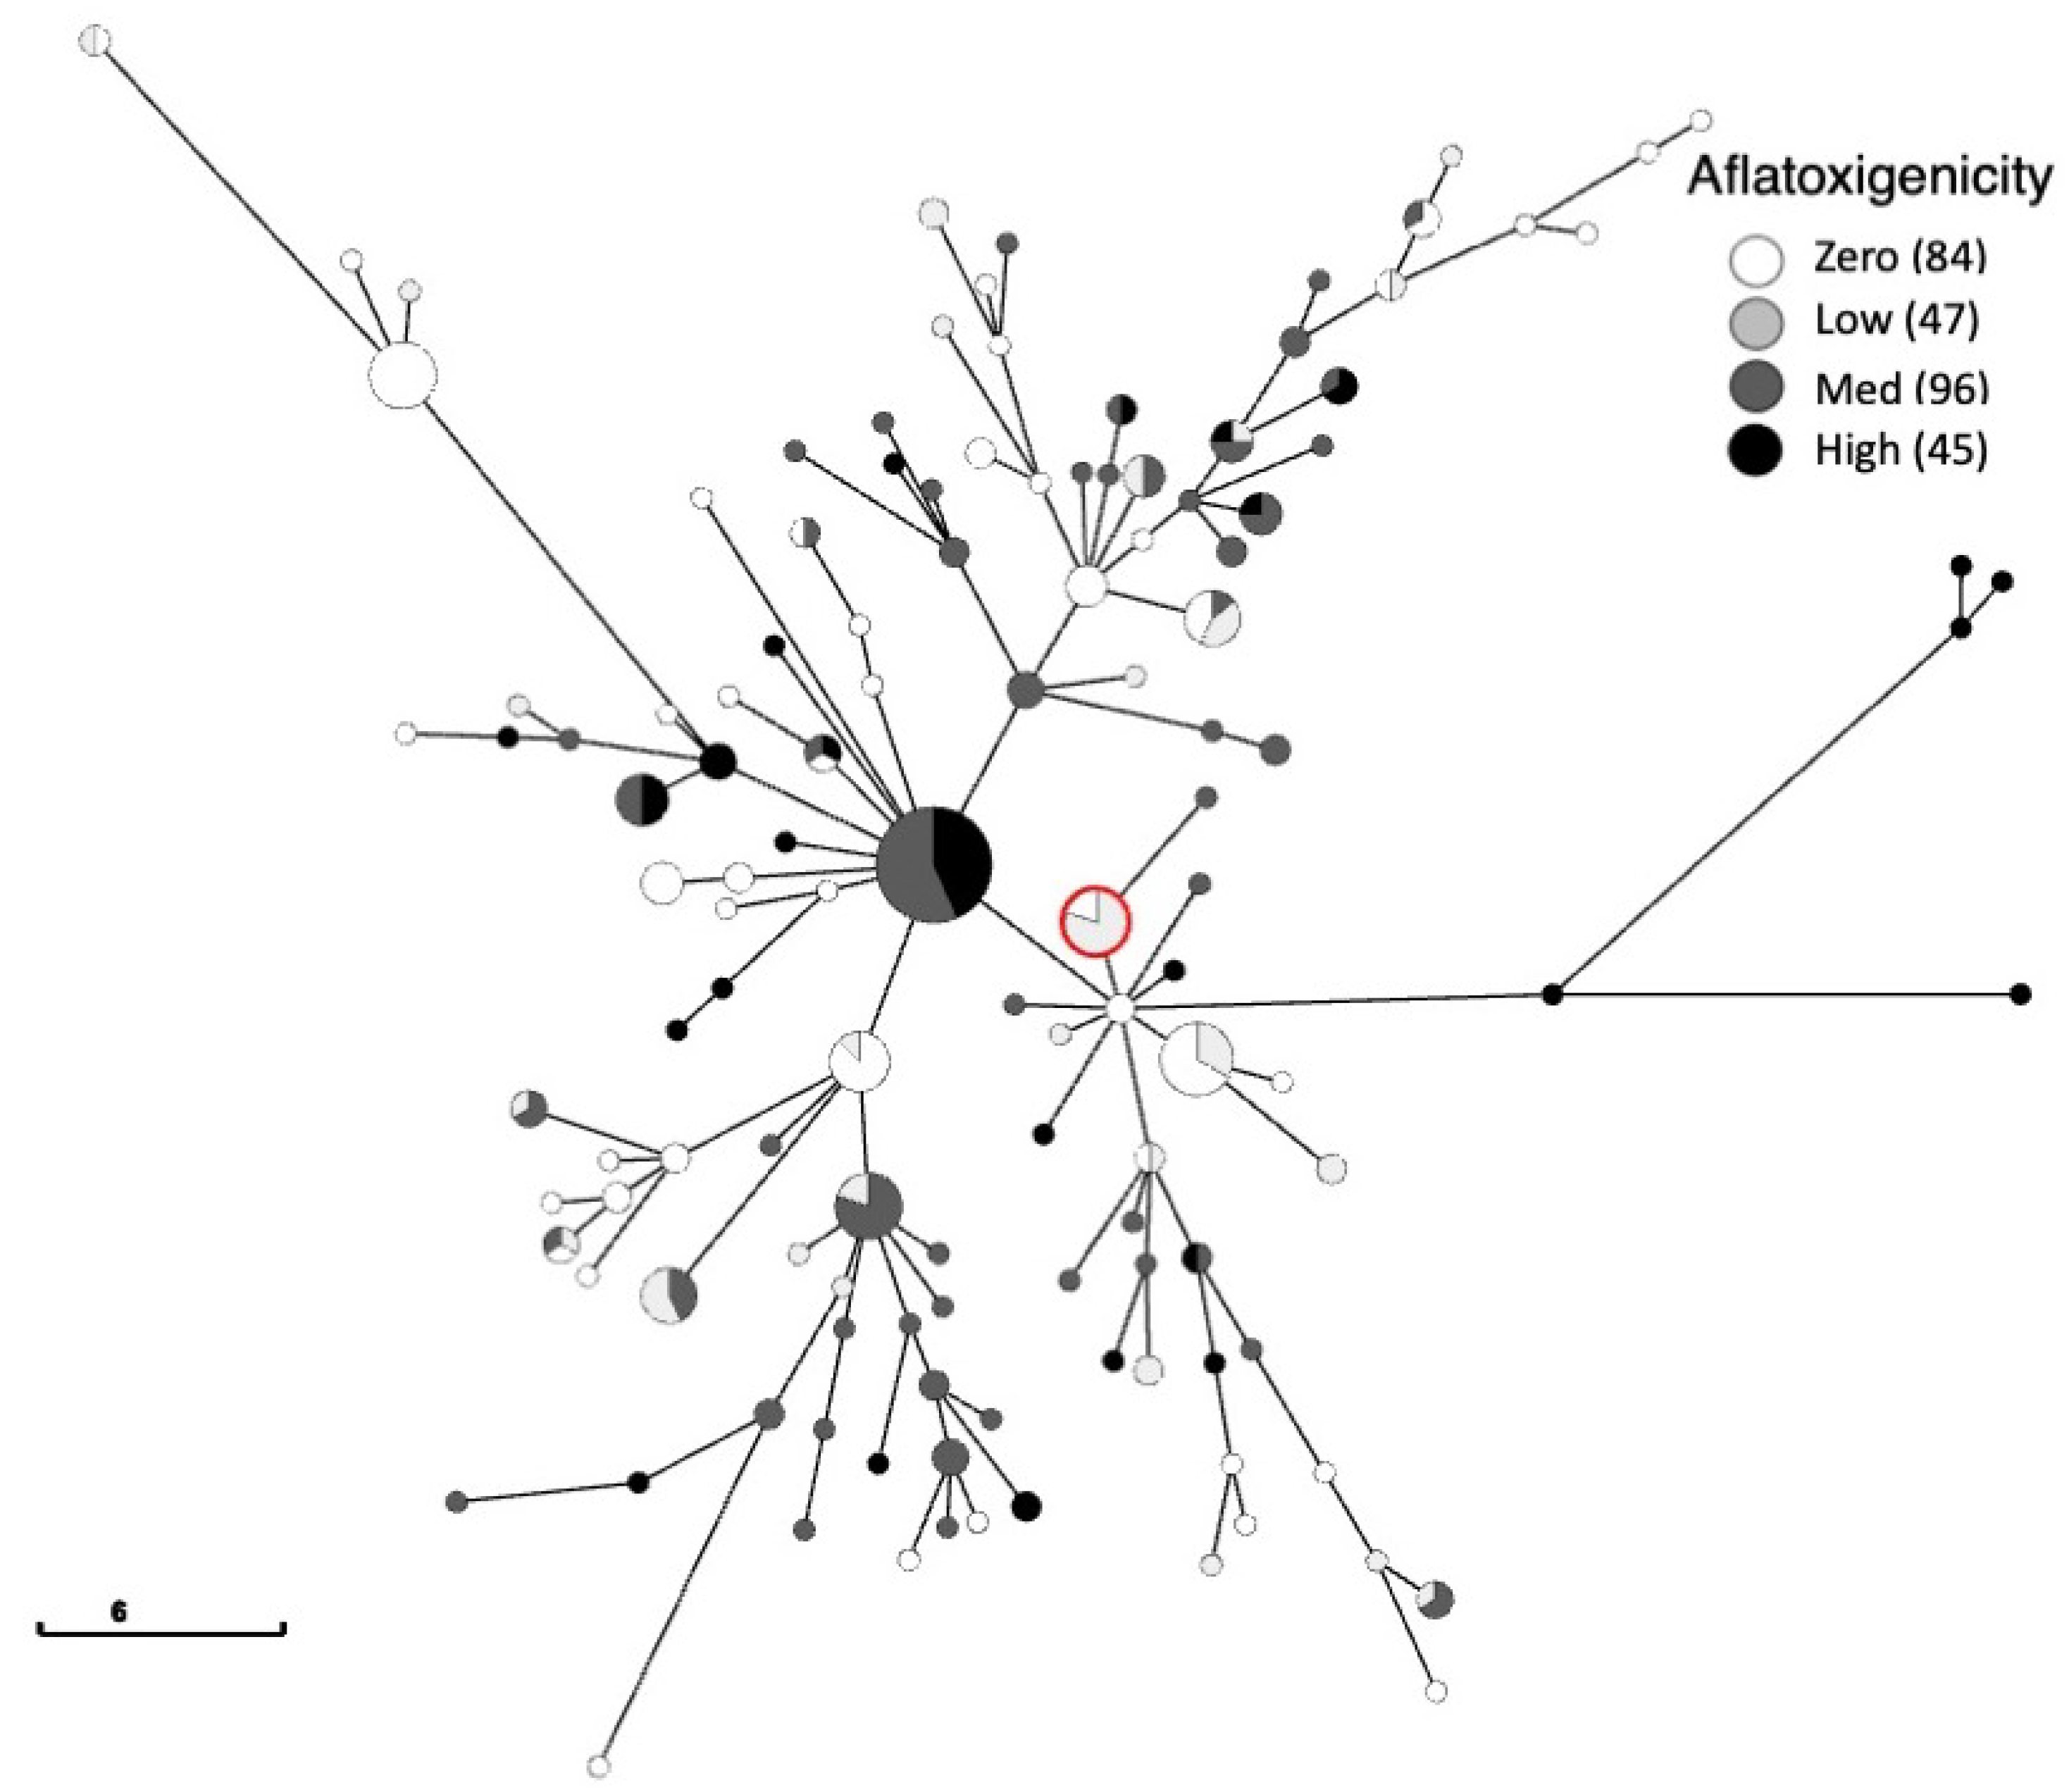
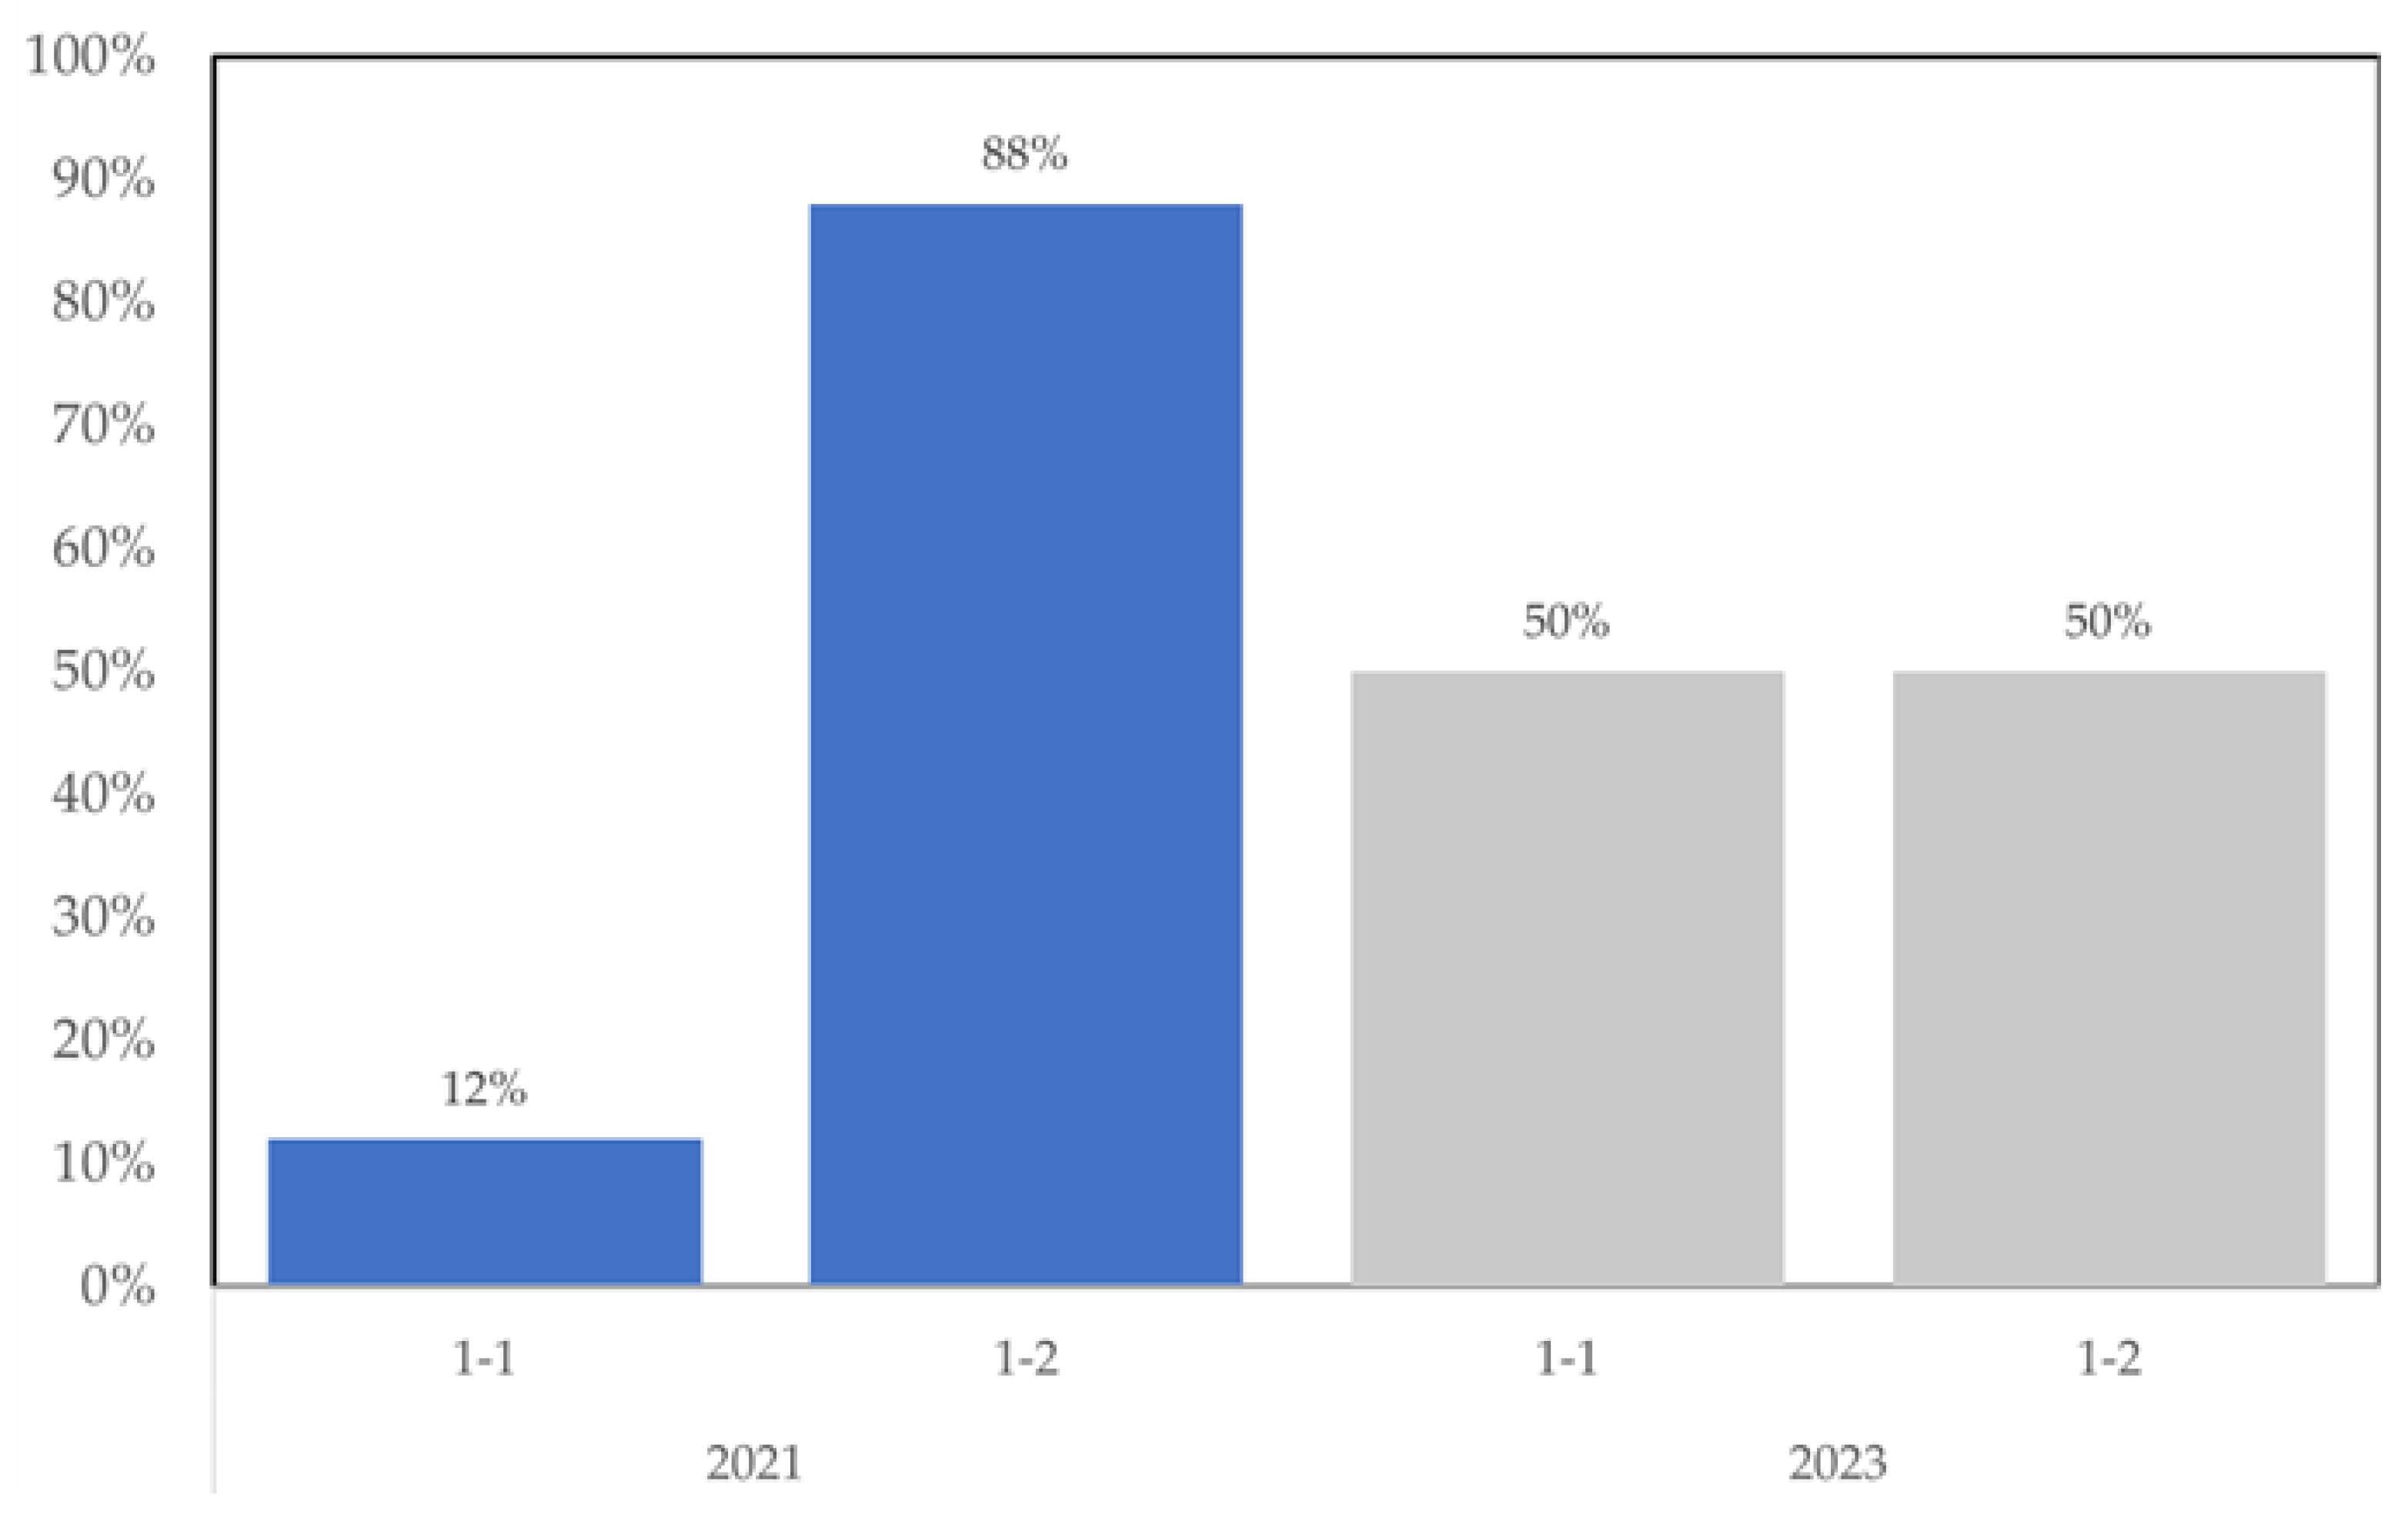
3.2. Genetic Analysis

The A. flavus mating type distribution was different in each of the two years of the present study. As indicated in Figure 3, almost 90% of the A. flavus isolated from maize in 2021 was mating type 1–2, while in 2023 there was an even split between Mat 1-1 and 1-2. One possible explanation is that the variance is indicative of the small sample size. Alternatively, there are substantial changes in the population from year to year. Some relevant comparisons of population mating type distribution of field collections of A. flavus on maize include our work [16], which found 55% to be Mat 1-2, and that of Sweany et al. [17] which found 96% of maize isolates to be Mat 1-2.
The population genetic data revealed that accounting for clones in the data set indeed influenced the overall patterns of haplotypic diversity (Table 2). We carried out a two-way analysis of variance (ANOVA), which allowed for the use of both gene/locus and toxicity groupings as independent effects (though we were most concerned with difference in toxicity groupings since individual loci may differ in genetic diversity). For the full set of 272 samples, toxicity groupings (zero, low, medium, high) were only significantly different for Na, but this difference went away when the effective number of alleles was calculated (which accounts for sample size), and none of the other measures differed among aflatoxigenicity groupings (Na, Ne, I, h, uh) (measures summarized in Table 2). Several authors have advocated for accounting for clonality in the data set so as to not bias the results based on abundance or sampling efforts (e.g., [27]); when we accounted for clones in the data set, the genetic differences among these groupings were apparent (Figure 4). The two-way ANOVA revealed that all measures (Na, Ne, I, h, uh) were significant with respect to the toxicity groupings (significance shown with asterisks in Table 2). The zero grouping, i.e., the nonalfatoxigenic population, had the highest level of genetic diversity across all measures. This presents a challenge for the selection of biological control isolates. The high genetic diversity among nonalfatoxigenic isolates prevents clear identification of especially common, presumably well-adapted genotypes. Overall, measurements of genetic diversity and effective alleles were lower in the present study than a previous data set [16], analyzed with the same alleles and metrics. Critical differences between the two studies are that the previous work included samples from a larger geographic area and from more than two time points.
The minimum spanning tree can be viewed interactively on the web server https://achtman-lab.github.io/GrapeTree/MSTree_holder.html (accessed on 16 October 2023)with the provided profile and metadata files (See supplementary files). The user can view the MSTree by clone genet, toxicity, region, year, etc. One view of the MSTree is presented in Figure 4. In the view presented here, it is apparent that there is aflatoxigenic variation within the clones, indicating that genotypes alone are insufficient in predicting aflatoxigenicity. The most abundant genotype, near the center of this tree, consists of 17 ‘medium’ or ‘high’ aflatoxin producers, consistent with our observation of the highly toxigenic state of this population. Interacting with this MSTree can aid in finding nonaflatoxigenic genotypes that are present in both years or isolated from multiple geographic regions. Interestingly, the genotype of A. flavus strain 21882, which has been commercially utilized as a biocontrol product, is present in isolates from both years. Strain 21882 has been thoroughly evaluated as an effective biocontrol isolate [10,28,29], and more recently has been shown to effectively shift the preexisting A. flavus population [30].
We observed that many of the genotypes were only found in a single region, so we considered the possibility that there could be geographic separation in the populations, i.e., that instead of a single A. flavus population, there could be genetic differences from one region to another. Of the total diversity observed in the present collection, the variance attributed to geographic region was only 6%.

4. Conclusions and Next Steps

After characterizing 272 A. flavus isolates from 82 maize samples, we identified 126 unique genotypes. The calculated diversity of this population is about three times higher than that measured on isolates from commercial corn from Southern US states [16]. The population we isolated from Guatemalan maize was also highly aflatoxigenic, with only 84 nonaflatoxigenic isolates. Differences were found in the colony phenotypes and mating type distribution between the two sample years, so further sampling is needed to document the diversity of this population.
Beyond describing the A. flavus population in Guatemala, there is a need to identify biocontrol candidates. The isolates that share a haplotype with strain 21882 merit further examination, but the high diversity of the nonaflatoxigenic isolates makes identification of additional candidates challenging. Biocontrol candidates can be screened for aflatoxin reduction in co-culture with the common, indigenous, highly aflatoxigenic isolates that have been isolated in the present study. Beyond identification of biocontrol strains, challenges remain for the effective and affordable delivery of these strains for aflatoxin mitigation in Guatemala.

Supplementary Materials

The following supporting information can be downloaded at: https://www.mdpi.com/article/10.3390/foods12203864/s1, Table S1: Description of Isolates; Table S2: ANOVA details; Figure S1: Allelic diversity; Figure S2: Minimum Spanning Tree.

Author Contributions

Review, editing and approval of final draft: M.A.W., C.B., L.C.P., A.B., S.G.D. and J.R.M.; data analysis and visualization: M.A.W., L.C.P., S.G.D. and J.R.M.; experimental, observations and data collection: M.A.W., C.B., L.C.P. and A.B.; conceptualization and original draft preparation: M.A.W., L.C.P., S.G.D. and J.R.M. All authors have read and agreed to the published version of the manuscript.

Funding

This research was funded by Agricultural Research Service (ARS) and the U.S Agency for International Development (USAID) Participating Agency Service Agreement.

Data Availability Statement

The data used to support the findings of this study can be made available by the corresponding author upon request.

Acknowledgments

Thanks to cooperators in Guatemala for their assistance in obtaining samples and collecting cultivar and location data. Thanks to Alsha Barksdale for technical assistance in sample processing. Thanks to Sheron Simpson, USDA ARS Genomics and Bioinformatics Research Unit for adapting and executing the SSR protocol.

Conflicts of Interest

The authors declare no conflict of interest. The funders had no role in the design of the study; in the collection, analyses, or interpretation of data; in the writing of the manuscript; or in the decision to publish the results.

References

  1. Tay, K. Guatemala’s Corn Sectors Struggles with Contraband and Low Prices. USDA Foreign Agricultural Service, GT19007, 26 June 2019. Available online: https://agriexchange.apeda.gov.in/marketreport/Reports/Grain_and_Feed_Annual_Guatemala_City_Guatemala_6-26-2019.pdf (accessed on 16 October 2023).
  2. Ministerio de Agricultura, Ganadería y Alimentación—MAGA. Plan Operativo Anual 2020—Reprogramación; MAGA: Guatemala City, Guatemala, 2020. [Google Scholar]
  3. Tay, K. Grain and Animal Feed. USDA Foreign Agricultural Service, GT2022-0004, Guatemala, 15 April 2022. Available online: https://apps.fas.usda.gov/newgainapi/api/Report/DownloadReportByFileName?fileName=Grain%20and%20Feed%20Annual_Guatemala%20City_Guatemala_GT2022-0004.pdf (accessed on 16 October 2023).
  4. Tay, K. Grain and Feed Annual. USDA Foreign Agricultural Service, GT2023-0001, Guatemala, 6 April 2023. Available online: https://apps.fas.usda.gov/newgainapi/api/Report/DownloadReportByFileName?fileName=Grain%20and%20Feed%20Annual_Guatemala%20City_Guatemala_GT2023-0001.pdf (accessed on 16 October 2023).
  5. IARC. Some naturally occurring substances: Food items and constituents, heterocyclic aromatic amines and mycotoxins. In International Agency for Research on Cancer: Monographs on the Evaluation of Carcinogenic Risks to Humans; IARC Press: Lyon, France, 1993; Available online: http://monographs.iarc.fr/ENG/Monographs/vol56/index.php (accessed on 16 October 2023).
  6. Torres, O.; Matute, J.; Gelineau-van Waes, J.; Maddox, J.; Gregory, S.G.; Ashley-Koch, A.E.; Showker, J.L.; Voss, K.A.; Riley, R.T. Human health implications from co-exposure to aflatoxins and fumonisins in maize-based foods in Latin America: Guatemala as a case study. World Mycotoxin J. 2015, 8, 143–159. [Google Scholar] [CrossRef]
  7. Alvarez, C.S.; Hernández, E.; Escobar, K.; Villagrán, C.I.; Kroker-Lobos, M.F.; Rivera-Andrade, A.; Smith, J.W.; Egner, P.A.; Lazo, M.; Freedman, N.D.; et al. Aflatoxin B1 exposure and liver cirrhosis in Guatemala: A case–control study. BMJ Open Gastroenterol. 2020, 7, e000380. [Google Scholar] [CrossRef] [PubMed]
  8. Voth-Gaeddert, L.E.; Torres, O.; Maldonado, J.; Krajmalnik-Brown, R.; Rittmann, B.E.; Oerther, D.B. Aflatoxin exposure, child stunting, and dysbiosis in the intestinal microbiome among children in Guatemala. Environ. Eng. Sci. 2019, 36, 958–968. [Google Scholar] [CrossRef]
  9. Groopman, J.D.; Smith, J.W.; Rivera-Andrade, A.; Alvarez, C.S.; Kroker-Lobos, M.F.; Egner, P.A.; Gharzouzi, E.; Dean, M.; McGlynn, K.A.; Ramírez-Zea, M. Aflatoxin and the aetiology of liver cancer and its implications for Guatemala. World Mycotoxin J. 2021, 14, 305–317. [Google Scholar] [CrossRef]
  10. Dorner, J.W. Biological control of aflatoxin contamination of crops. J. Toxicol. Toxin Rev. 2004, 23, 425–450. [Google Scholar] [CrossRef]
  11. Cotty, P.J.; Mellon, J.E. Ecology of aflatoxin producing fungi and biocontrol of aflatoxin contamination. Mycotoxin Res. 2006, 22, 110–117. [Google Scholar] [CrossRef]
  12. Bandyopadhyay, R.; Ortega-Beltran, A.; Akande, A.; Mutegi, C.; Atehnkeng, J.; Kaptoge, L.; Senghor, A.L.; Adhikari, B.N.; Cotty, P.J. Biological control of aflatoxins in Africa: Current status and potential challenges in the face of climate change. World Mycotoxin J. 2016, 9, 771–789. [Google Scholar] [CrossRef]
  13. Horn, B.W.; Dorner, J.W. Soil populations of Aspergillus species from section Flavi along a transect through peanut-growing regions of the United States. Mycologia 1998, 90, 767–776. [Google Scholar] [CrossRef]
  14. Abbas, H.K.; Zablotowicz, R.M.; Weaver, M.A.; Horn, B.W.; Xie, W.; Shier, W.T. Comparison of cultural and analytical methods for determination of aflatoxin production by Mississippi Delta Aspergillus isolates. Can. J. Microbiol. 2004, 50, 193–199. [Google Scholar] [CrossRef]
  15. Weaver, M.A.; Abbas, H.K.; Brewer, M.J.; Pruter, L.S.; Little, N.S. Integration of biological control and transgenic insect protection for mitigation of mycotoxins in corn. Crop Prot. 2017, 98, 108–115. [Google Scholar] [CrossRef]
  16. Weaver, M.A.; Callicott, K.A.; Mehl, H.L.; Opoku, J.; Park, L.C.; Fields, K.S.; Mandel, J.R. Characterization of the Aspergillus flavus Population from Highly Aflatoxin-Contaminated Corn in the United States. Toxins 2022, 14, 755. [Google Scholar] [CrossRef] [PubMed]
  17. Sweany, R.R.; Damann, K.E., Jr.; Kaller, M.D. Comparison of soil and corn kernel Aspergillus flavus populations: Evidence for niche specialization. Phytopathology 2011, 101, 952–959. [Google Scholar] [CrossRef] [PubMed]
  18. Callicott, K.A.; Kachapalula, P.; Edmunds, D.; Singh, P.; Jaime, R.; Islam, M.S.; Shenge, K.; Adhikari, B.N.; Arone-Maxwell, L.; Ching’anda, C.; et al. Brief Protocols for Research on Management of Aflatoxin-Producing Fungi, 2nd ed.; Phoenix, A.Z., Ed.; ARS: Beltsville, MD, USA; USDA: Washington, DC, USA, 2018. [Google Scholar]
  19. Grubisha, L.C.; Cotty, P.J. Twenty-four microsatellite markers for the aflatoxin-producing fungus Aspergillus flavus. Mol. Ecol. Resour. 2009, 9, 264–267. [Google Scholar] [CrossRef]
  20. Islam, M.S.; Callicott, K.A.; Mutegi, C.; Bandyopadhyay, R.; Cotty, P.J. Aspergillus flavus resident in Kenya: High genetic diversity in an ancient population primarily shaped by clonal reproduction and mutation-driven evolution. Fungal Ecol. 2018, 35, 20–33. [Google Scholar] [CrossRef]
  21. Ramirez-Prado, J.H.; Moore, G.G.; Horn, B.W.; Carbone, I. Characterization and population analysis of the mating-type genes in Aspergillus flavus and Aspergillus parasiticus. Fungal Genet. Biol. 2008, 45, 1292–1299. [Google Scholar] [CrossRef]
  22. Meirmans, P.G.; Van Tienderen, P.H. GENOTYPE and GENODIVE: Two programs for the analysis of genetic diversity of asexual organisms. Mol. Ecol. Notes 2004, 4, 792–794. [Google Scholar] [CrossRef]
  23. Peakall, R.; Smouse, P.E. GenAlEx 6.5: Genetic analysis in Excel. Population genetic software for teaching and research—An update. Bioinformatics 2012, 28, 2537–2539. [Google Scholar] [CrossRef] [PubMed]
  24. Edmonds, J. Optimum branchings. J. Res. Natl. Bur. Stand. B 1967, 71, 233–240. [Google Scholar] [CrossRef]
  25. Zhou, Z.; Alikhan, N.F.; Sergeant, M.J.; Luhmann, N.; Vaz, C.; Francisco, A.P.; Carriço, J.A.; Achtman, M. GrapeTree: Visualization of core genomic relationships among 100,000 bacterial pathogens. Genome Res. 2018, 28, 1395–1404. [Google Scholar] [CrossRef]
  26. Variety Release Announcement. Available online: https://cgspace.cgiar.org/bitstream/handle/10568/123590/ProjectInnovationSummary-Maize-P1870-I1967.pdf?sequence=1&isAllowed=y (accessed on 28 August 2023).
  27. Bentley, K.E.; Mauricio, R. High degree of clonal reproduction and lack of large-scale geographic patterning mark the introduced range of the invasive vine, kudzu (Pueraria montana var. lobata), in North America. Am. J. Bot. 2016, 103, 1499–1507. [Google Scholar] [CrossRef]
  28. Dorner, J.W.; Cole, R.J.; Wicklow, D.T. Aflatoxin reduction in corn through field application of competitive fungi. J. Food Prot. 1999, 62, 650–656. [Google Scholar] [CrossRef] [PubMed]
  29. Weaver, M.A.; Abbas, H.K.; Falconer, L.L.; Allen, T.W.; Pringle, H.L., III; Sciumbato, G.L. Biological control of aflatoxin is effective and economical in Mississippi field trials. Crop Prot. 2015, 69, 52–55. [Google Scholar] [CrossRef]
  30. Molo, M.S.; White, J.B.; Cornish, V.; Gell, R.M.; Baars, O.; Singh, R.; Carbone, M.A.; Isakeit, T.; Wise, K.A.; Woloshuk, C.P.; et al. Asymmetrical lineage introgression and recombination in populations of Aspergillus flavus: Implications for biological control. PLoS ONE 2022, 17, e0276556. [Google Scholar] [CrossRef] [PubMed]
Figure 1. Geographic origin of maize samples. Orange pins indicate 2021 sample points and yellow pins are 2023 sample points.
Foods 12 03864 g001
Figure 2. Distribution of phenotypes among A. flavus isolates from maize samples. Y and W refer to yellow and white media pigmentation. The + and − indicate fluorescence under UV light.
Foods 12 03864 g002
Figure 3. Mating type distribution of A. flavus isolates from maize samples.
Foods 12 03864 g003
Figure 4. Minimum spanning tree. Bar given for distance scale. Red circle indicates genotypes identical to biocontrol isolate 21882.
Foods 12 03864 g004
Table 1. Guatemalan maize samples. Cultivar and geographic origin of each sample provided.
2021 Grain SamplesCultivarElevationAldeaMunicipalityDepartment
1HB 83MidlandsPalos abrazodosMoyutaJutiapa
2JC-24LowlandsPiedra GrandeChiquimulillaSanta Rosa
3JC-24LowlandsPiedra GrandeChiquimulillaSanta Rosa
4Fortaleza F3LowlandsPlacetasChiquimulillaSanta Rosa
5JC-24LowlandsPiedra GrandeChiquimulillaSanta Rosa
6Unknown MidlandsObrajueloAgua BlancaJutiapa
7Unknown Midlands IpalaChiquimula
8Fortaleza F3MidlandsPoza VerdeS. M. ChaparronJalapa
9H5 SGMidlandsLas AnimasS. M. ChaparronJalapa
10Fortaleza F3Midlands JalapaJalapa
11Unknown MidlandsSeamaySenahuAlta Verapaz
12Unknown MidlandsPaijaS.M. TucuruAlta Verapaz
13Unknown MidlandsPanhomaTamahuAlta Verapaz
14Unknown MidlandsLa herradura ChijulS.M. TucuruAlta Verapaz
15Unknown MidlandsPenielTacuruAlta Verapaz
16Fortaleza F3HighlandsPayushyecSacapulasQuiche
17Unknown HighlandsPueblo ViejoSan SebastianHuehuetenango
18Unknown HighlandsPiolSan SebastianHuehuetenango
19Unknown HighlandsChumuxuquimSacapulasQuiche
20Unknown HighlandsPayushyecSacapulasQuiche
21DK 410LowlandsSan Vicente 1CoatepequeQuetzaltenango
22DK 6018LowlandsCaballo BlancoCaballo Blanco Retalhuleu
23DK 390LowlandsSan RafaelCoatepequeQuetzaltenango
24DK 6018LowlandsCaballo BlancoCaballo Blanco Retalhuleu
25Unknown LowlandsLos PalomosLos Palomos Retalhuleu
26Fortaleza F3MidlandsCaulotesEsquipulasChiquimula
27Fortaleza F3MidlandsCaulotesEsquipulasChiquimula
28Fortaleza F3LowlandsLinea C-8S. A. Villa SecaRetalhuleu
29Fortaleza F3LowlandsLinea C-8S. A. Villa SecaRetalhuleu
30Fortaleza F3MidlandsOlopitaEsquipulasChiquimula
31Fortaleza F3MidlandsOlopitaEsquipulasChiquimula
32Fortaleza F3LowlandsLinea C-18S. A. Villa SecaRetalhuleu
33Unknown LowlandsLinea A-3La maquinaSuchitepequez
34Unknown MidlandsEl ovejeroProgresoJutiapa
2023 Grain SamplesCultivarElevationLatitudeLongitude
1DK 390Lowlands14.05702−90.36782Santa Rosa
2UnknownLowlands14.2781−90.28683Santa Rosa
3HB 83Lowlands14.08254−90.37903Santa Rosa
4DK 390Lowlands16.58299−90.09404Peten
5HB 83Lowlands16.35779−90.17787Peten
6CriolloMidlands14.84926−92.06439San Marcos
7Fortaleza F3Highlands15.27847−91.11817Quiche
8CriolloMidlands14.57462−92.12152San Marcos
9AmarilloHighlands15.44222−91.50228Huehuetenango
10DK 390Midlands14.56577−92.05198San Marcos
11DK 390Midlands14.5472−92.08604San Marcos
12Criollo BlancoHighlands15.40105−91.66328Huehuetenango
13NK 102Lowlands16.48032−90.45605Peten
14DK 390Lowlands16.58241−90.09541Peten
15CriolloLowlands16.37866−90.30373Peten
16CriolloLowlands16.34505−90.17684Peten
17Fortaleza F5Lowlands14.07803−90.57511Santa Rosa
18Fortaleza F3Lowlands14.09022−90.37938Santa Rosa
19Fortaleza F5Midlands13.90407−90.13655Jutiapa
20Fortaleza F5Lowlands14.09958−90.53562Santa Rosa
21Unknown Midlands15.32417−89.77944Alta Verapaz
22Unknown Midlands15.35361−89.35777Alta Verapaz
23Unknown Midlands15.32578−89.75277Alta Verapaz
24Unknown Midlands16.5175−89.72888Alta Verapaz
25Unknown Midlands15.36583−89.68333Alta Verapaz
26Unknown Midlands15.30222−90.23189Alta Verapaz
27Unknown Midlands15.32861−89.76222Alta Verapaz
28DK 390
29DK 390
30HS 23
31HB 83
32Fortaleza F5
33Fortaleza F5
34HB 83Lowlands15.11846−89.31867Zacapa
35HB 83Lowlands15.11846−89.37867Zacapa
36CriolloMidlands15.64639−89.45346Chiquimula
37CriolloMidlands14.44197−89.76379Jutiapa
38Fortaleza F3Midlands14.4236−89.76408Jutiapa
39Fortaleza F3Midlands14.79819−89.21239Chiquimula
40Fortaleza F3Midlands14.78059−89.19426Chiquimula
41DK 390Midlands14.16575−90.15913Jutiapa
42DK 390Lowlands14.17018−90.1626Santa Rosa
43H-5Midlands14.45488−89.86585Jalapa
44H-5Midlands14.14853−89.79325Jutiapa
45JC-24Lowlands14.16575−90.15913Santa Rosa
46Fortaleza F3Midlands14.18684−89.79283Jutiapa
47Fortaleza F3Lowlands14.14105−90.14312Santa Rosa
48HB 83Lowlands15.119−89.3Zacapa
Table 2. Measures of population genetic diversity and information. Means and standard errors are shown for each population genetic measure: number of individuals sampled (N), number of different alleles (Na), number of effective alleles (Ne), information index (I), haploid genetic diversity (h), and unbiased haploid genetic diversity (uh). Tukey’s mean separation indicated with letter a–c for each diversity metric.
Aflatoxigenic Status of IsolatesNNaNeIhuh
Zero405.7 (0.57) a2.8 (0.46) a1.1 (0.14) a0.51 (0.06) a0.51 (0.06) a
Low202.8 (0.56) b2.1 (0.32) b0.61 (0.17) c0.33 (0.08) c0.34 (0.09) c
Medium465.1 (0.69) a2.5 (0.47) a0.90 (0.17) b0.42 (0.07) b0.43 (0.08) b
High202.7 (0.53) b2.1 (0.35) b0.61 (0.17) c0.32 (0.08) c0.34 (0.09) c
Clone only1264.1 (0.33)2.3 (0.20)0.80 (0.08)0.39 (0.04)0.41 (0.04)
Total2727.4 (0.74)2.3 (0.36)0.86 (0.15)0.40 (0.07)0.40 (0.07)
Disclaimer/Publisher’s Note: The statements, opinions and data contained in all publications are solely those of the individual author(s) and contributor(s) and not of MDPI and/or the editor(s). MDPI and/or the editor(s) disclaim responsibility for any injury to people or property resulting from any ideas, methods, instructions or products referred to in the content.

