

Effects of Lentilactobacillus buchneri and Kazachstania bulderi on the Quality and Flavor of Guizhou Fermented Red Sour Soup


Abstract
:1. Introduction
2. Materials and Methods
2.1. Materials
2.2. Strains, Culture Media, and Growth Conditions
2.3. Preparation of Red Sour Soup Samples
2.4. Physical, Microbial and Chemical Determination
2.5. GC-IMS Analysis
2.6. Calculation of Relative Odor Activity Value (ROAV)
2.7. Statistical Analysis
3. Results
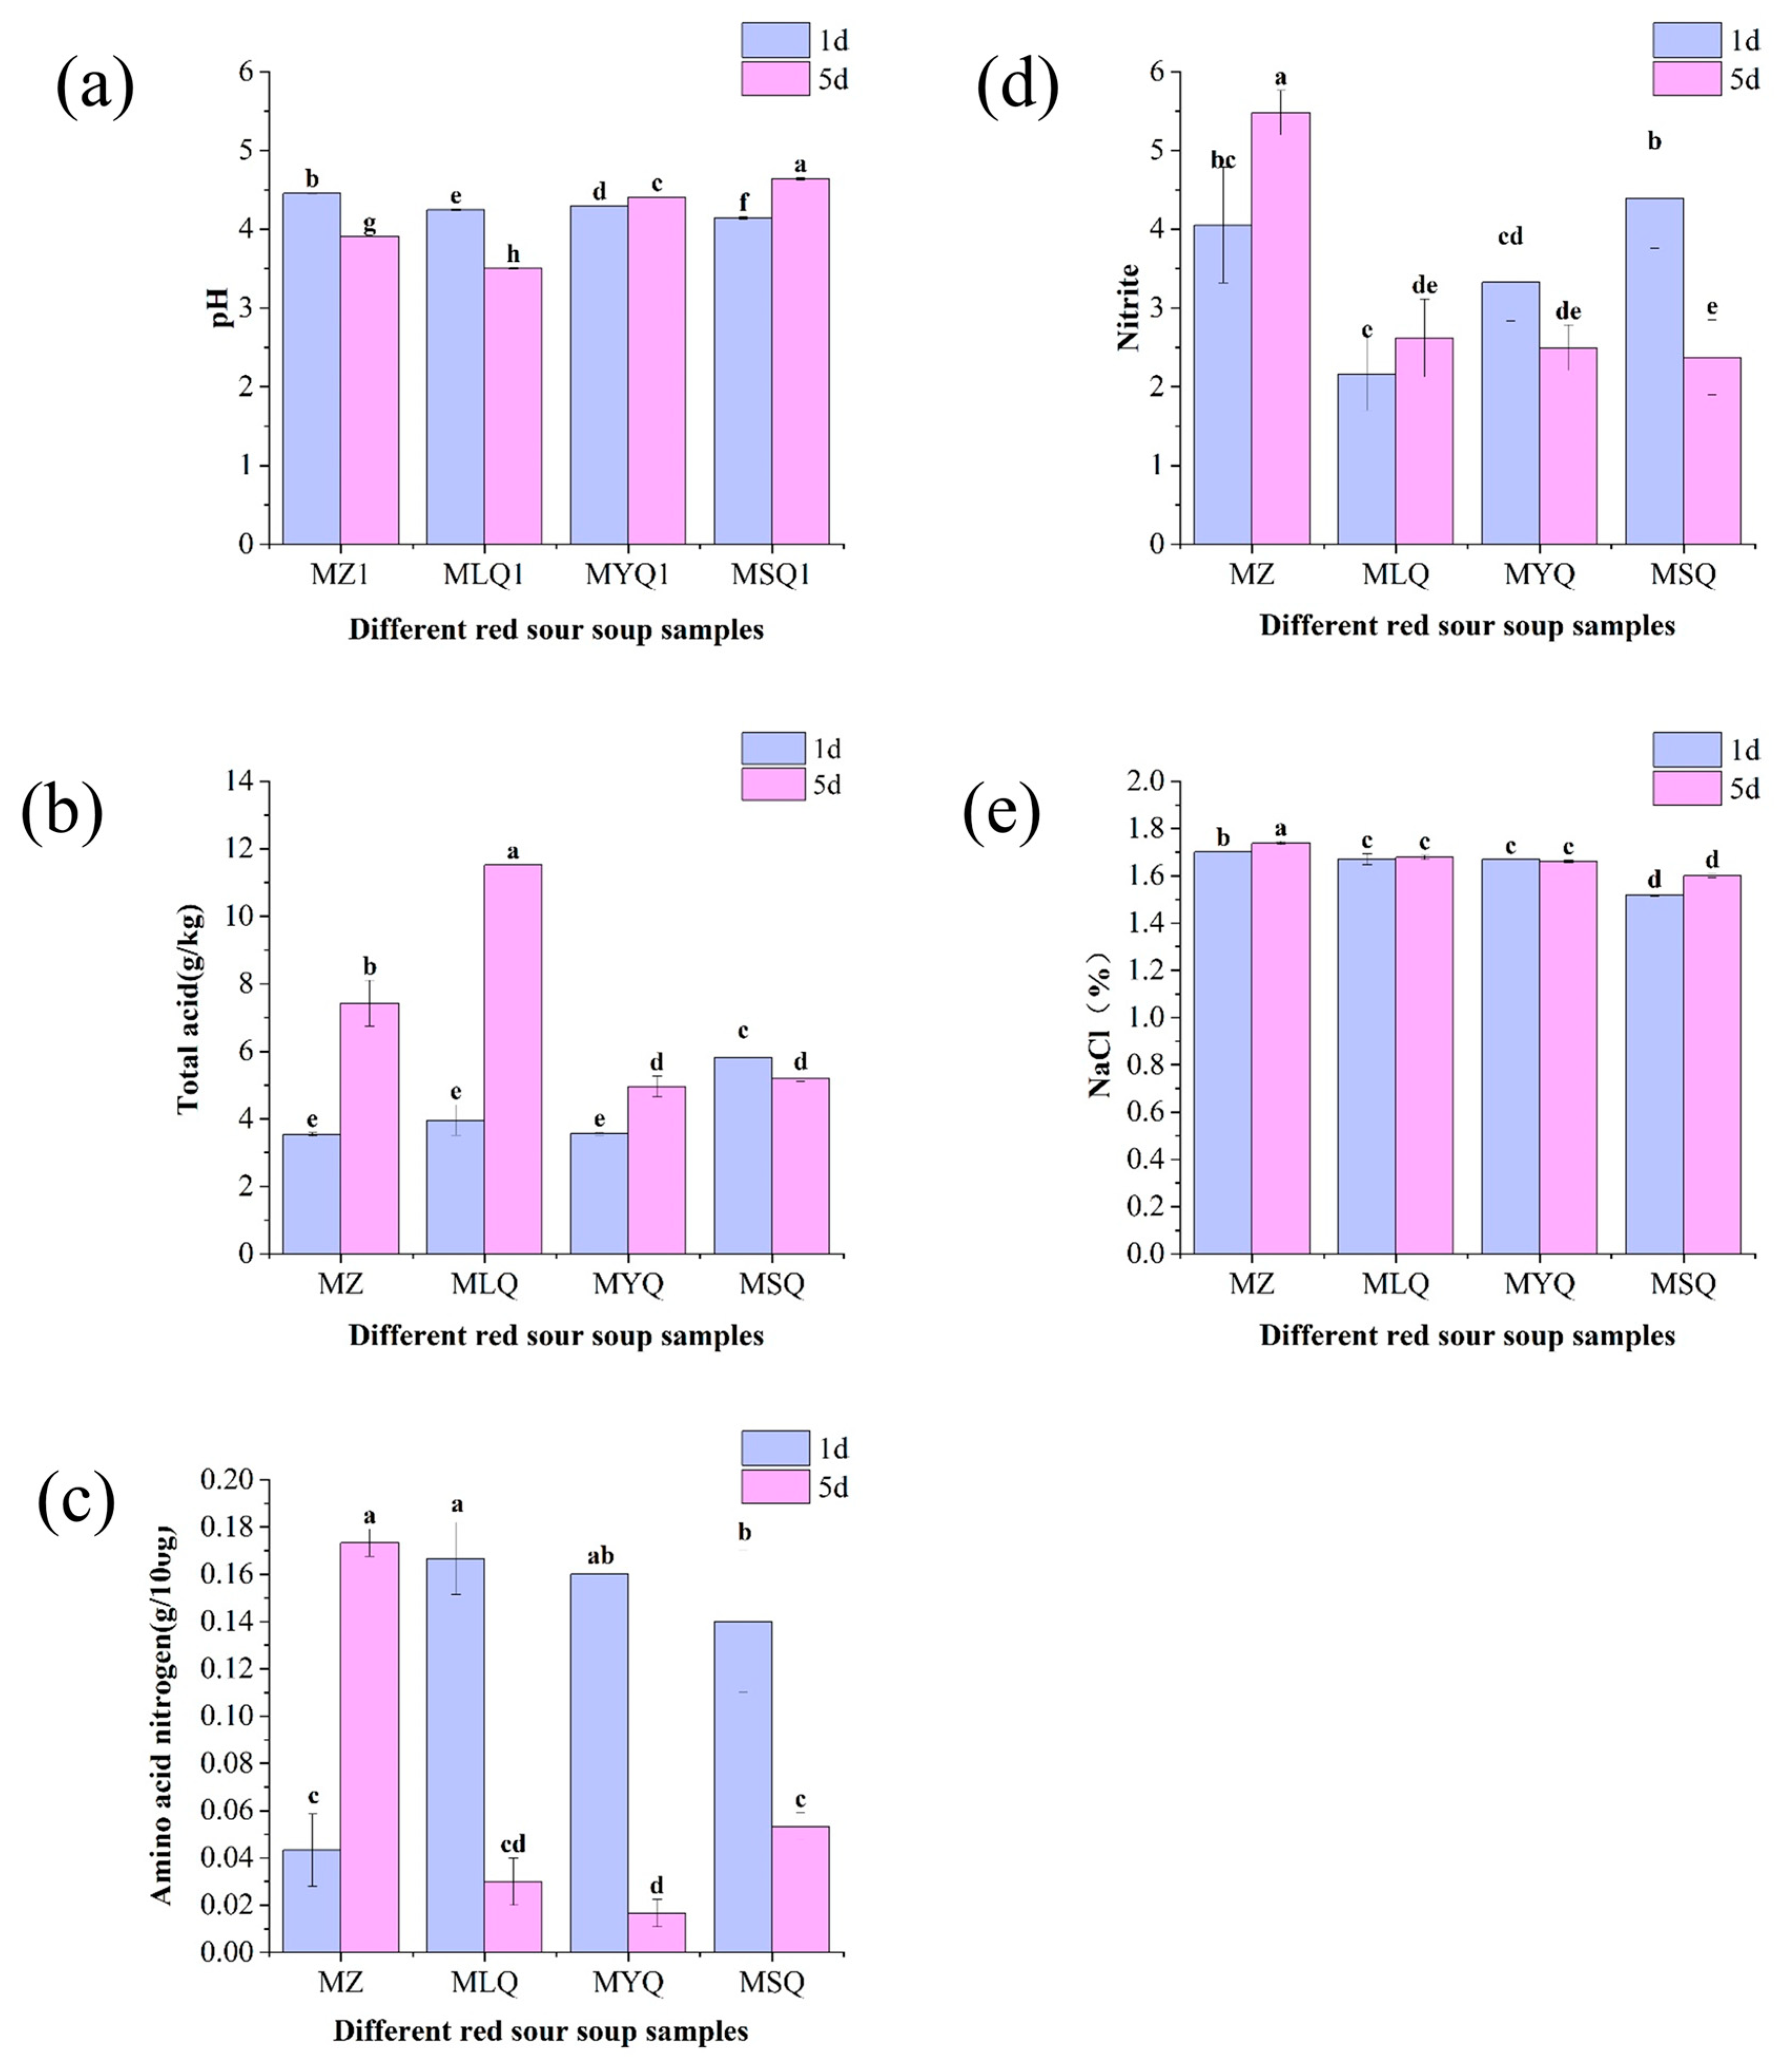
3.1. Physical and Chemical Indicators
3.2. Counting of Microbial Cells
3.3. Changes in Organic Acids in Different Red Sour Soup Samples
3.4. Changes in Lycopene Content in Different Red Sour Soup Samples
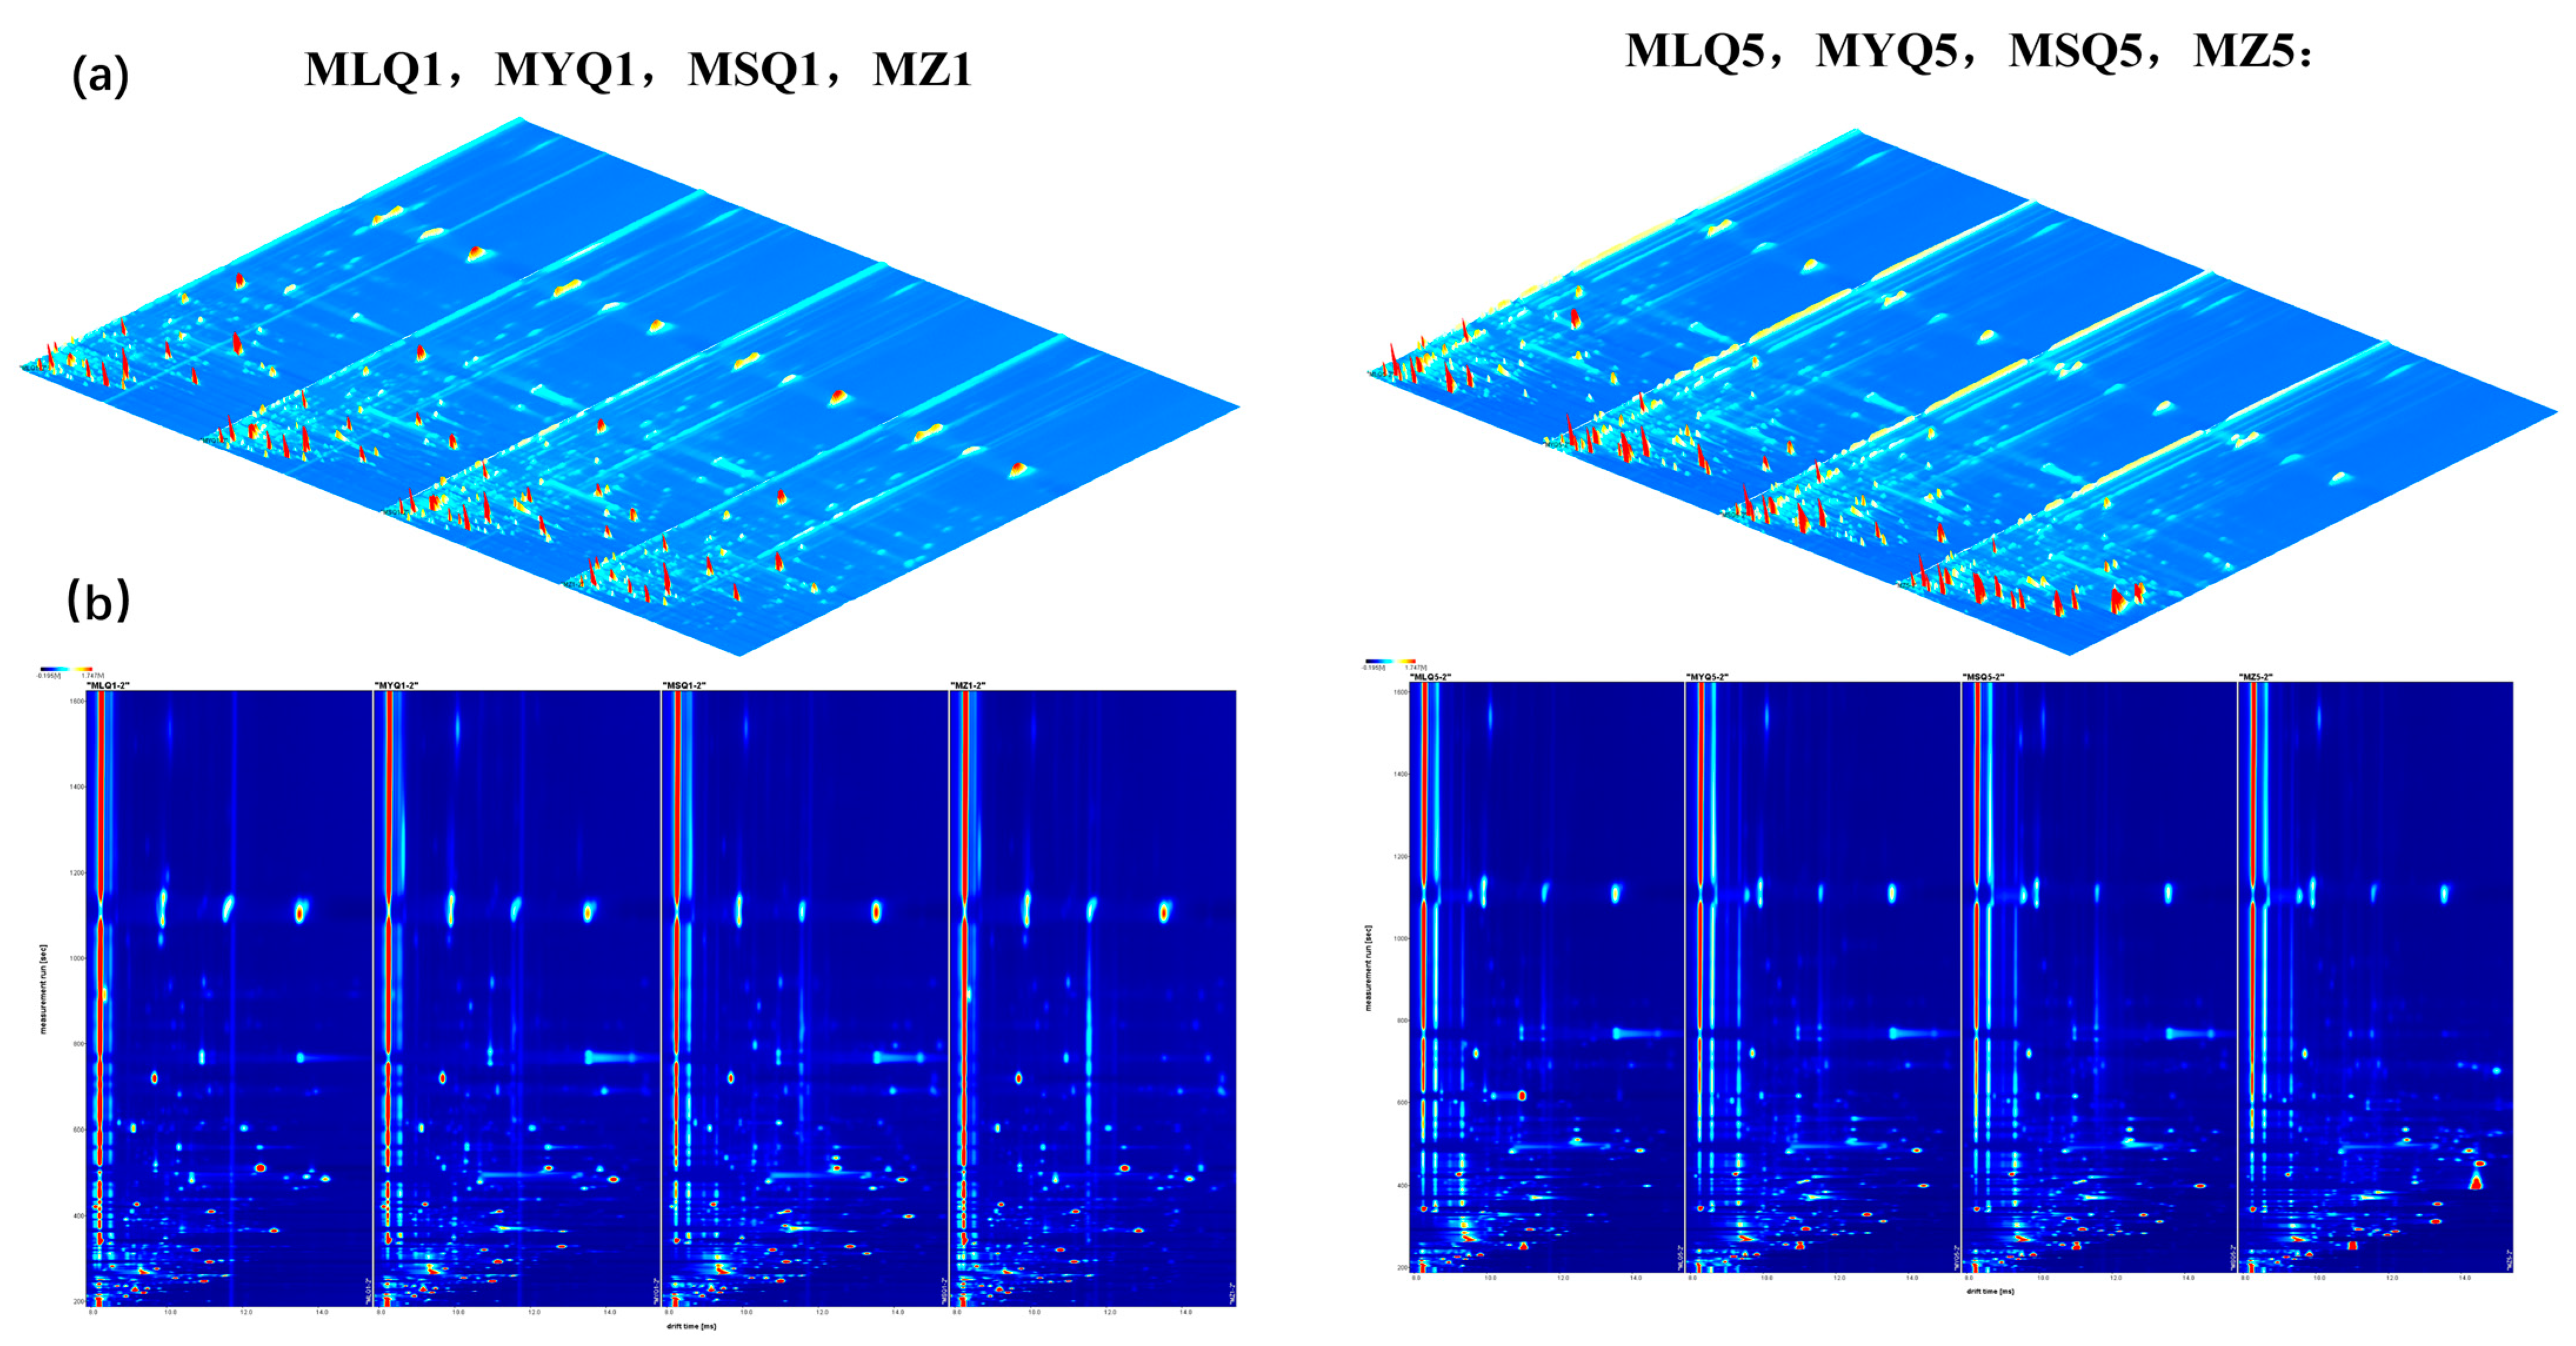
3.5. HS-GC-IMS Topographic Plots of Different Red Sour Soup Samples during Fermentation
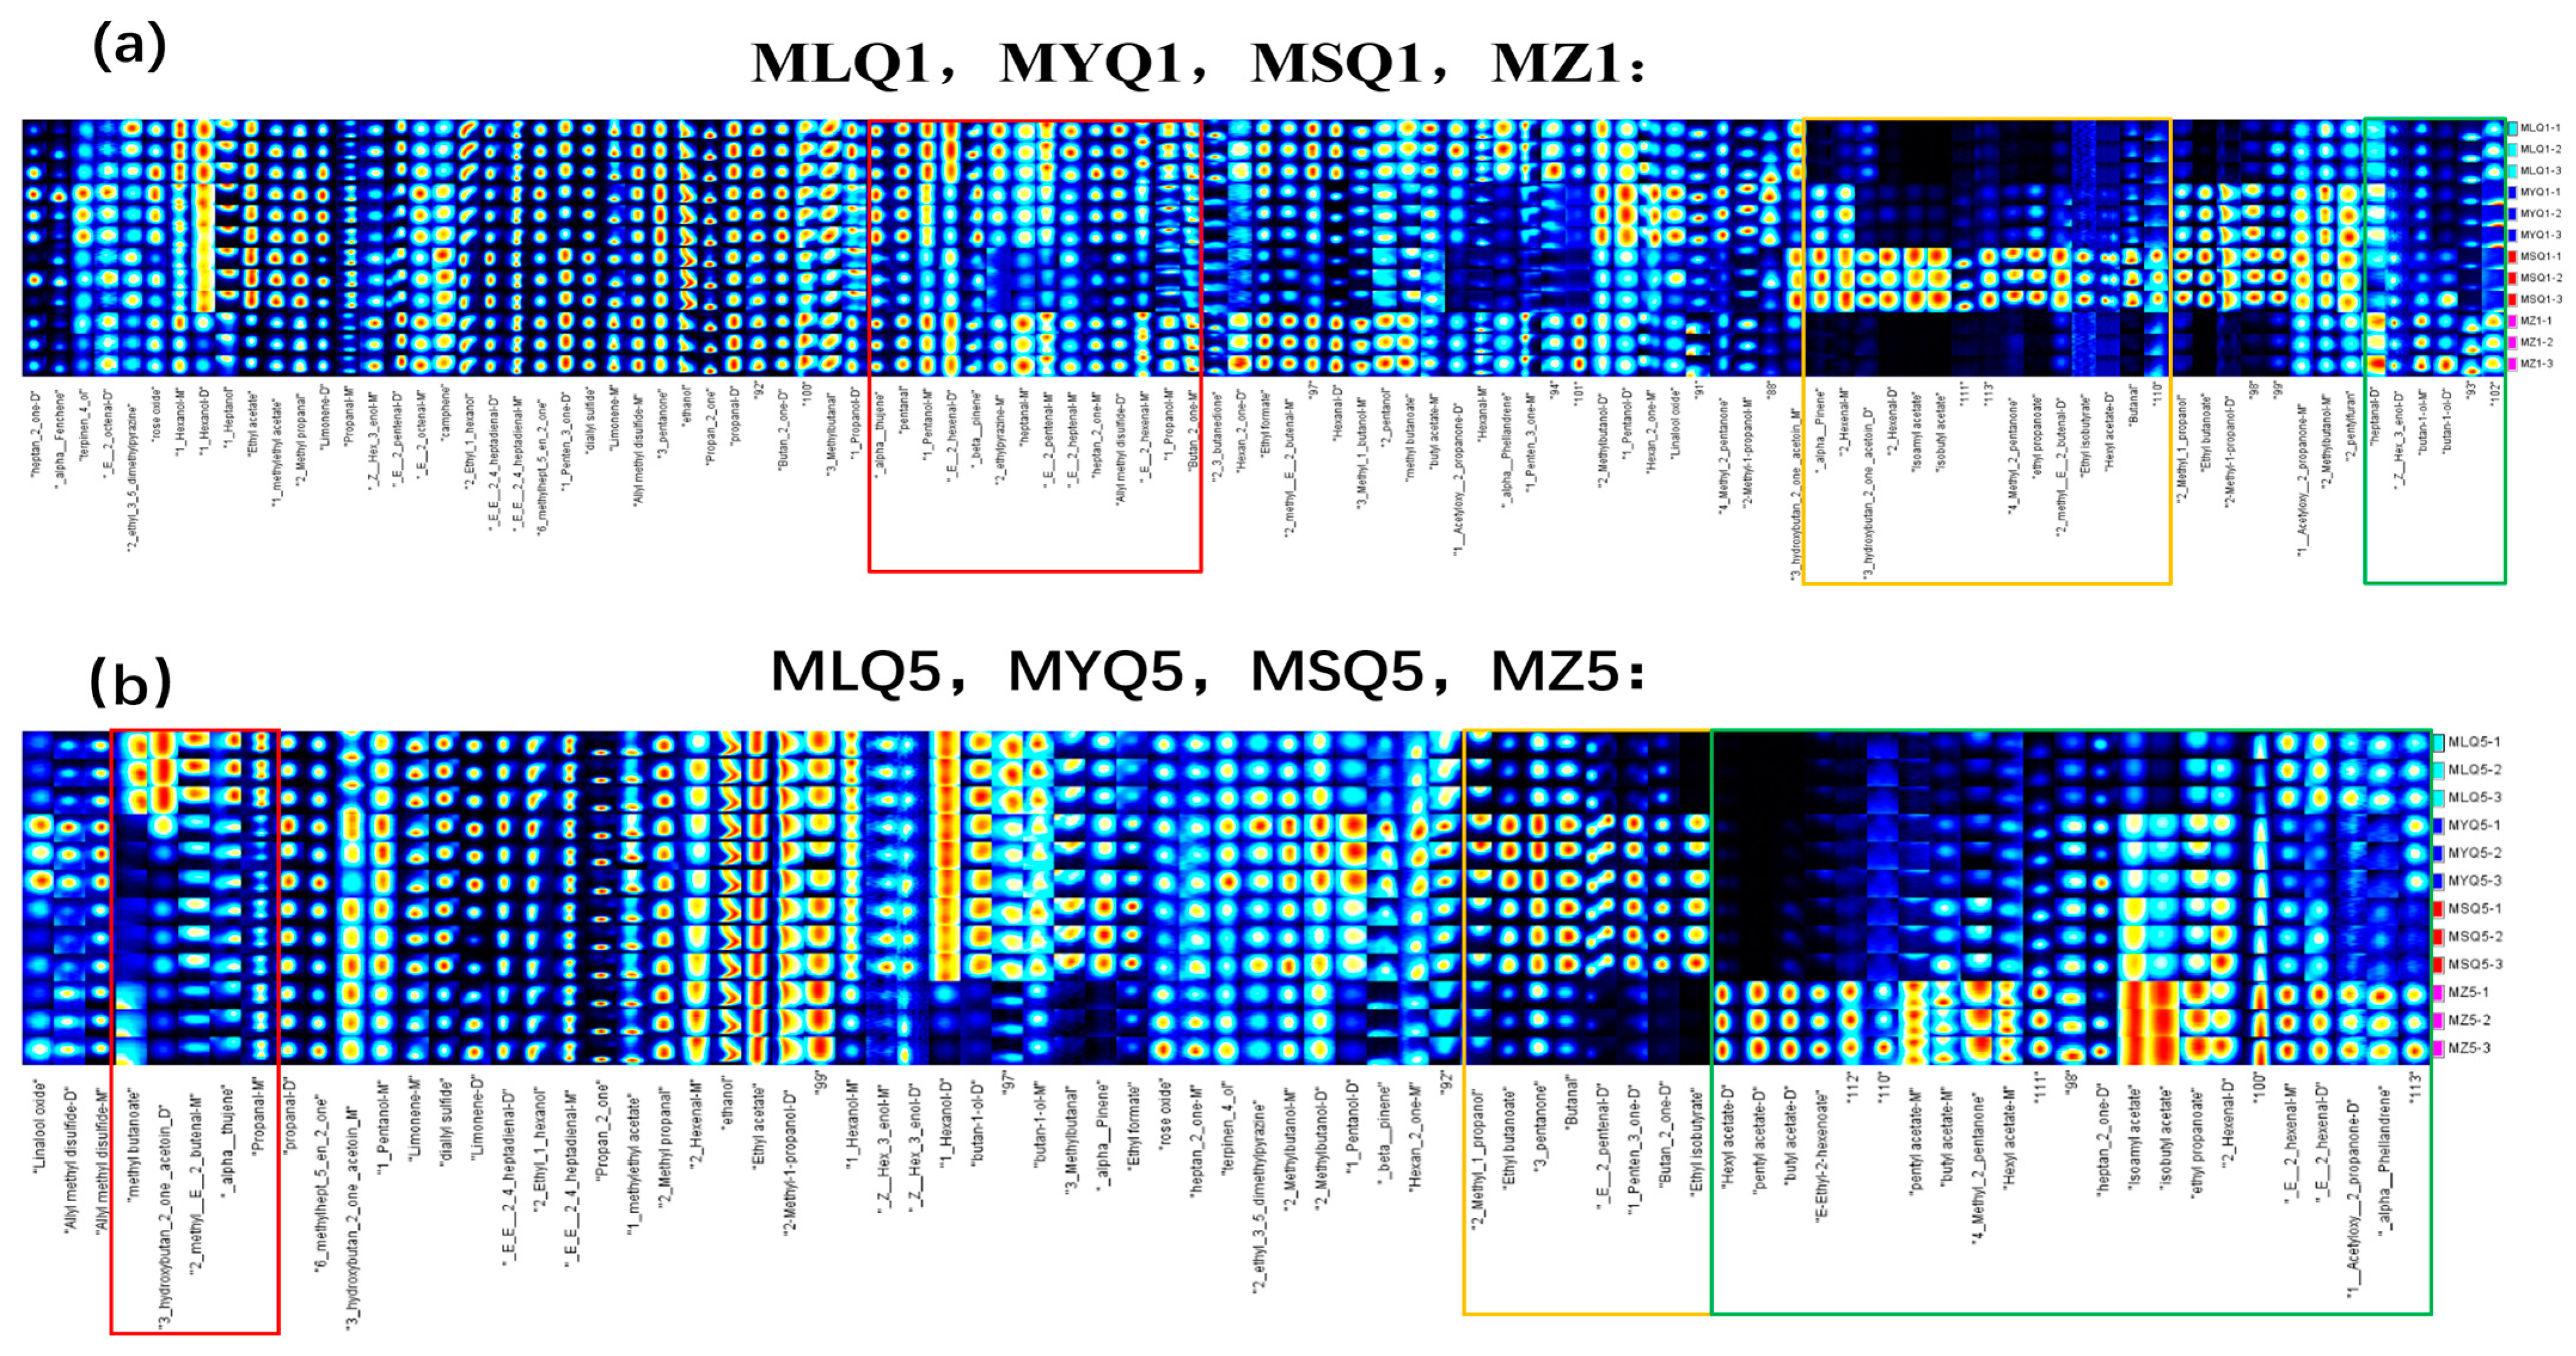
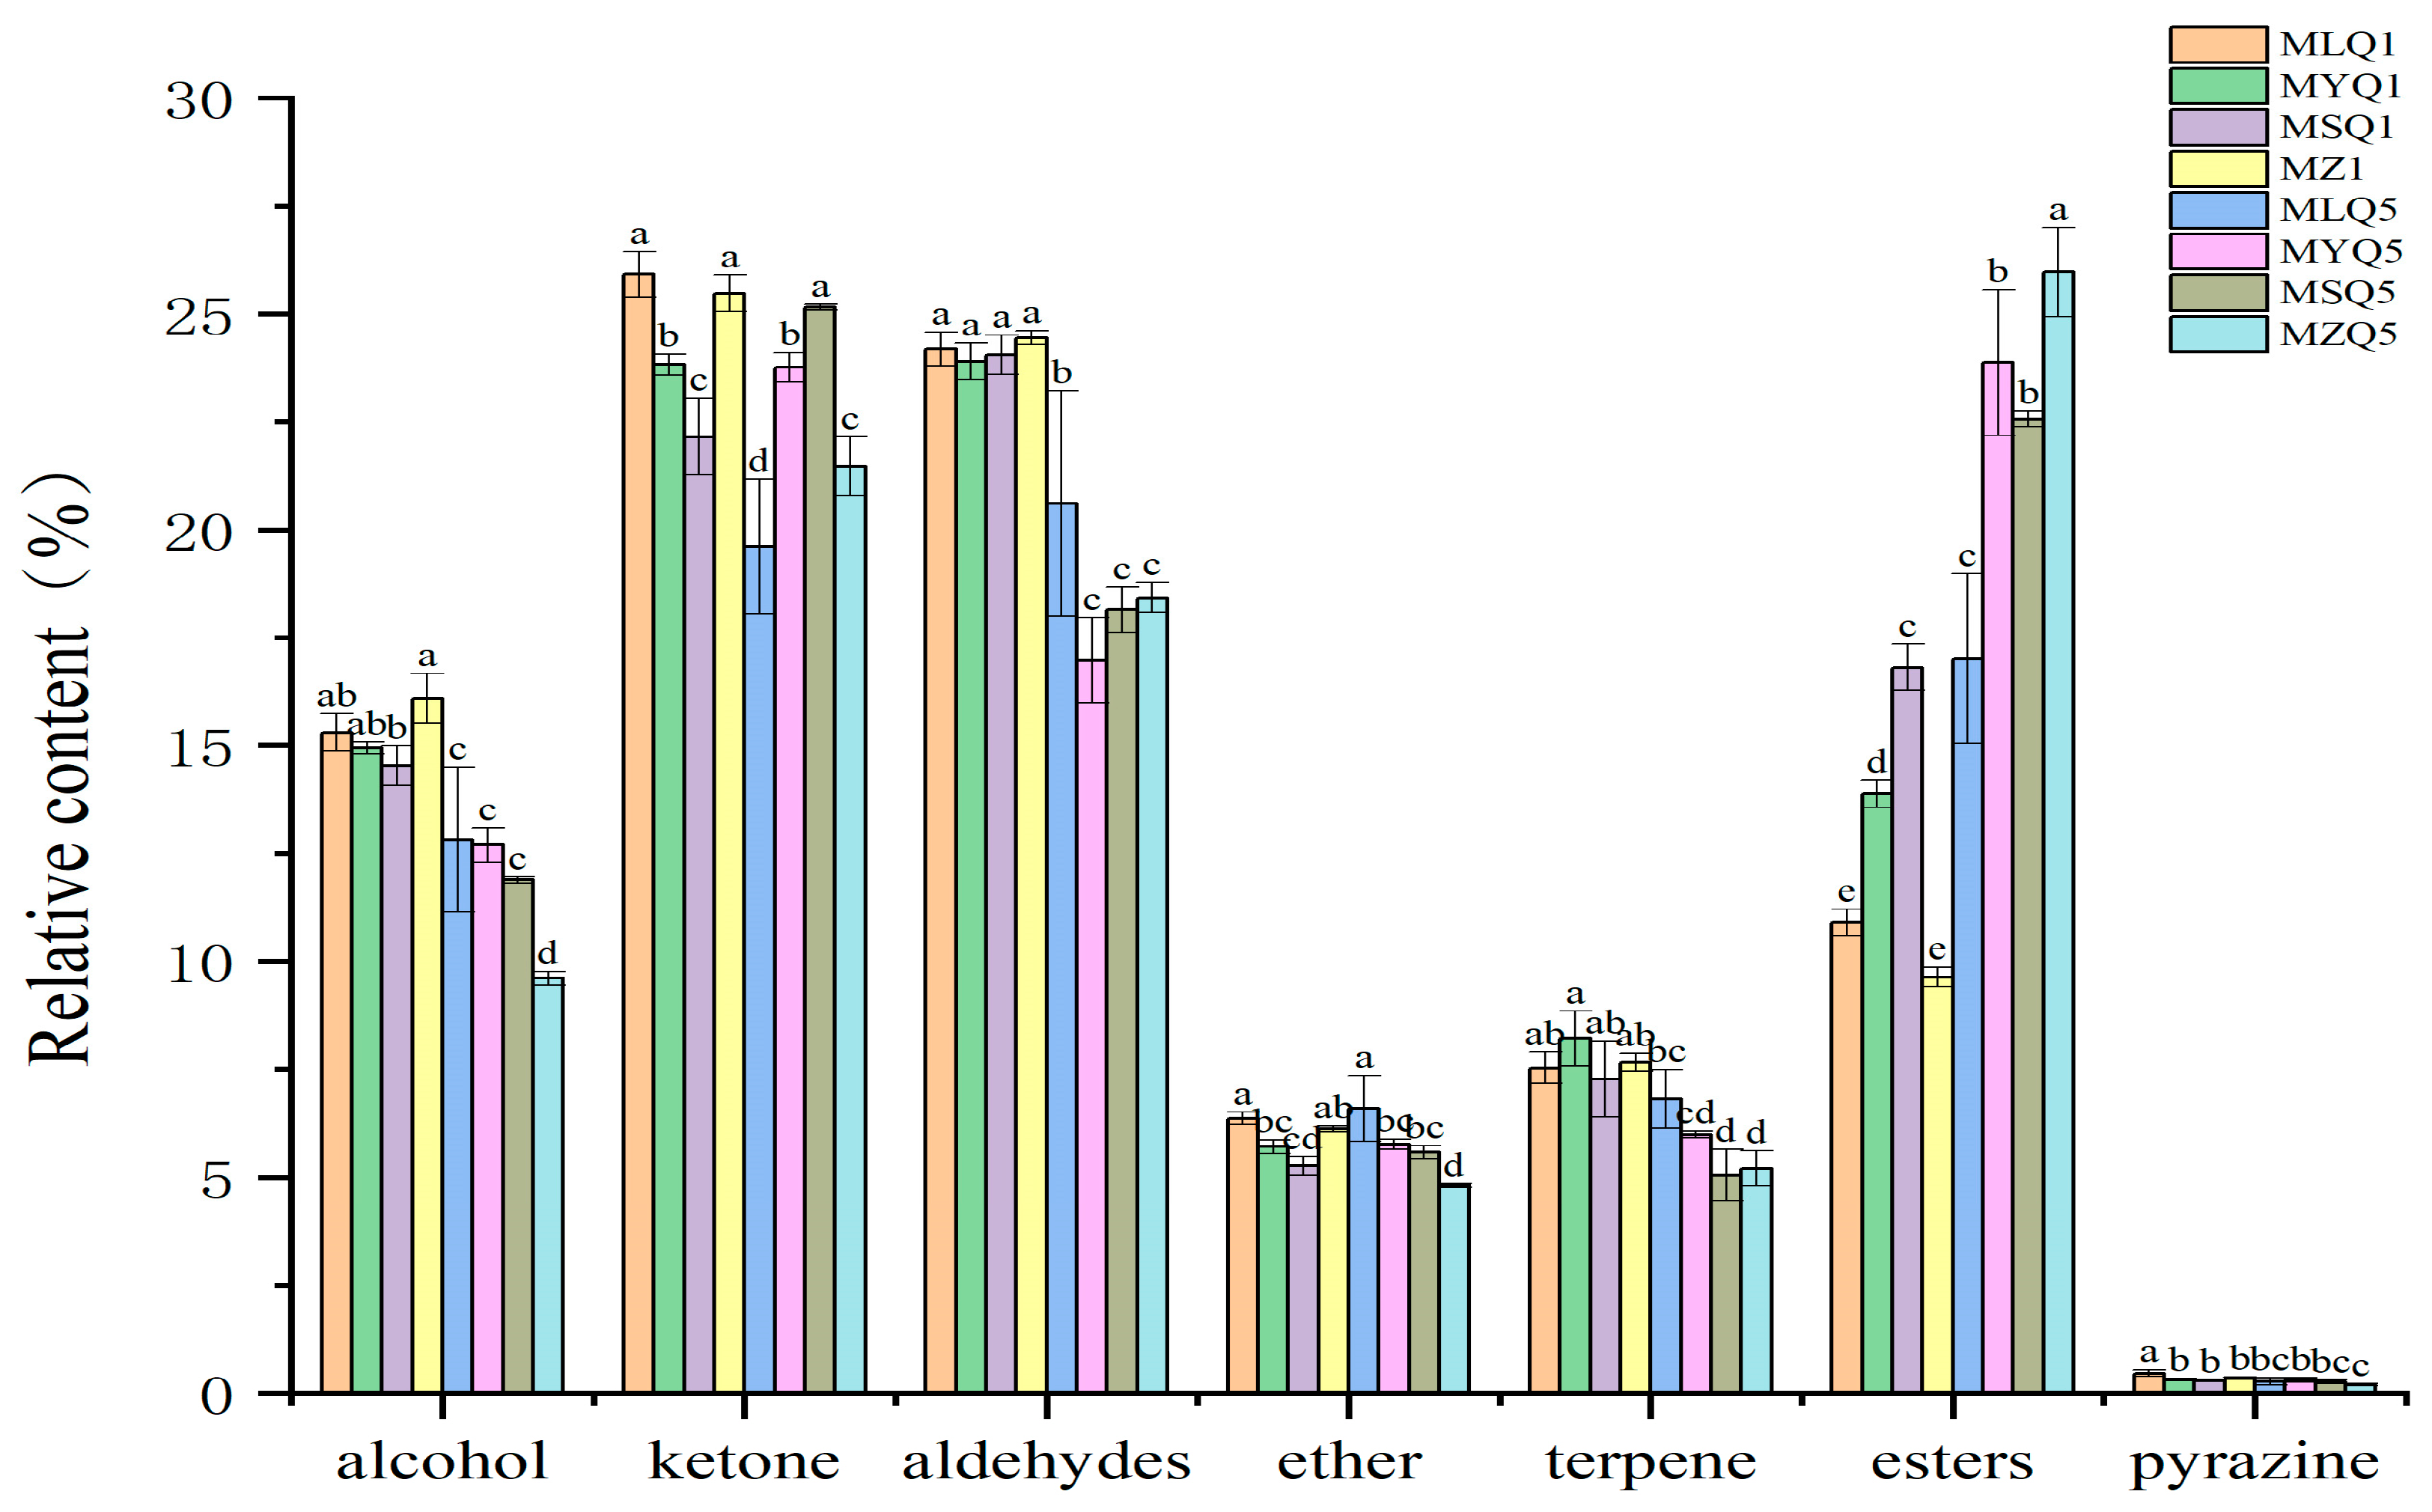
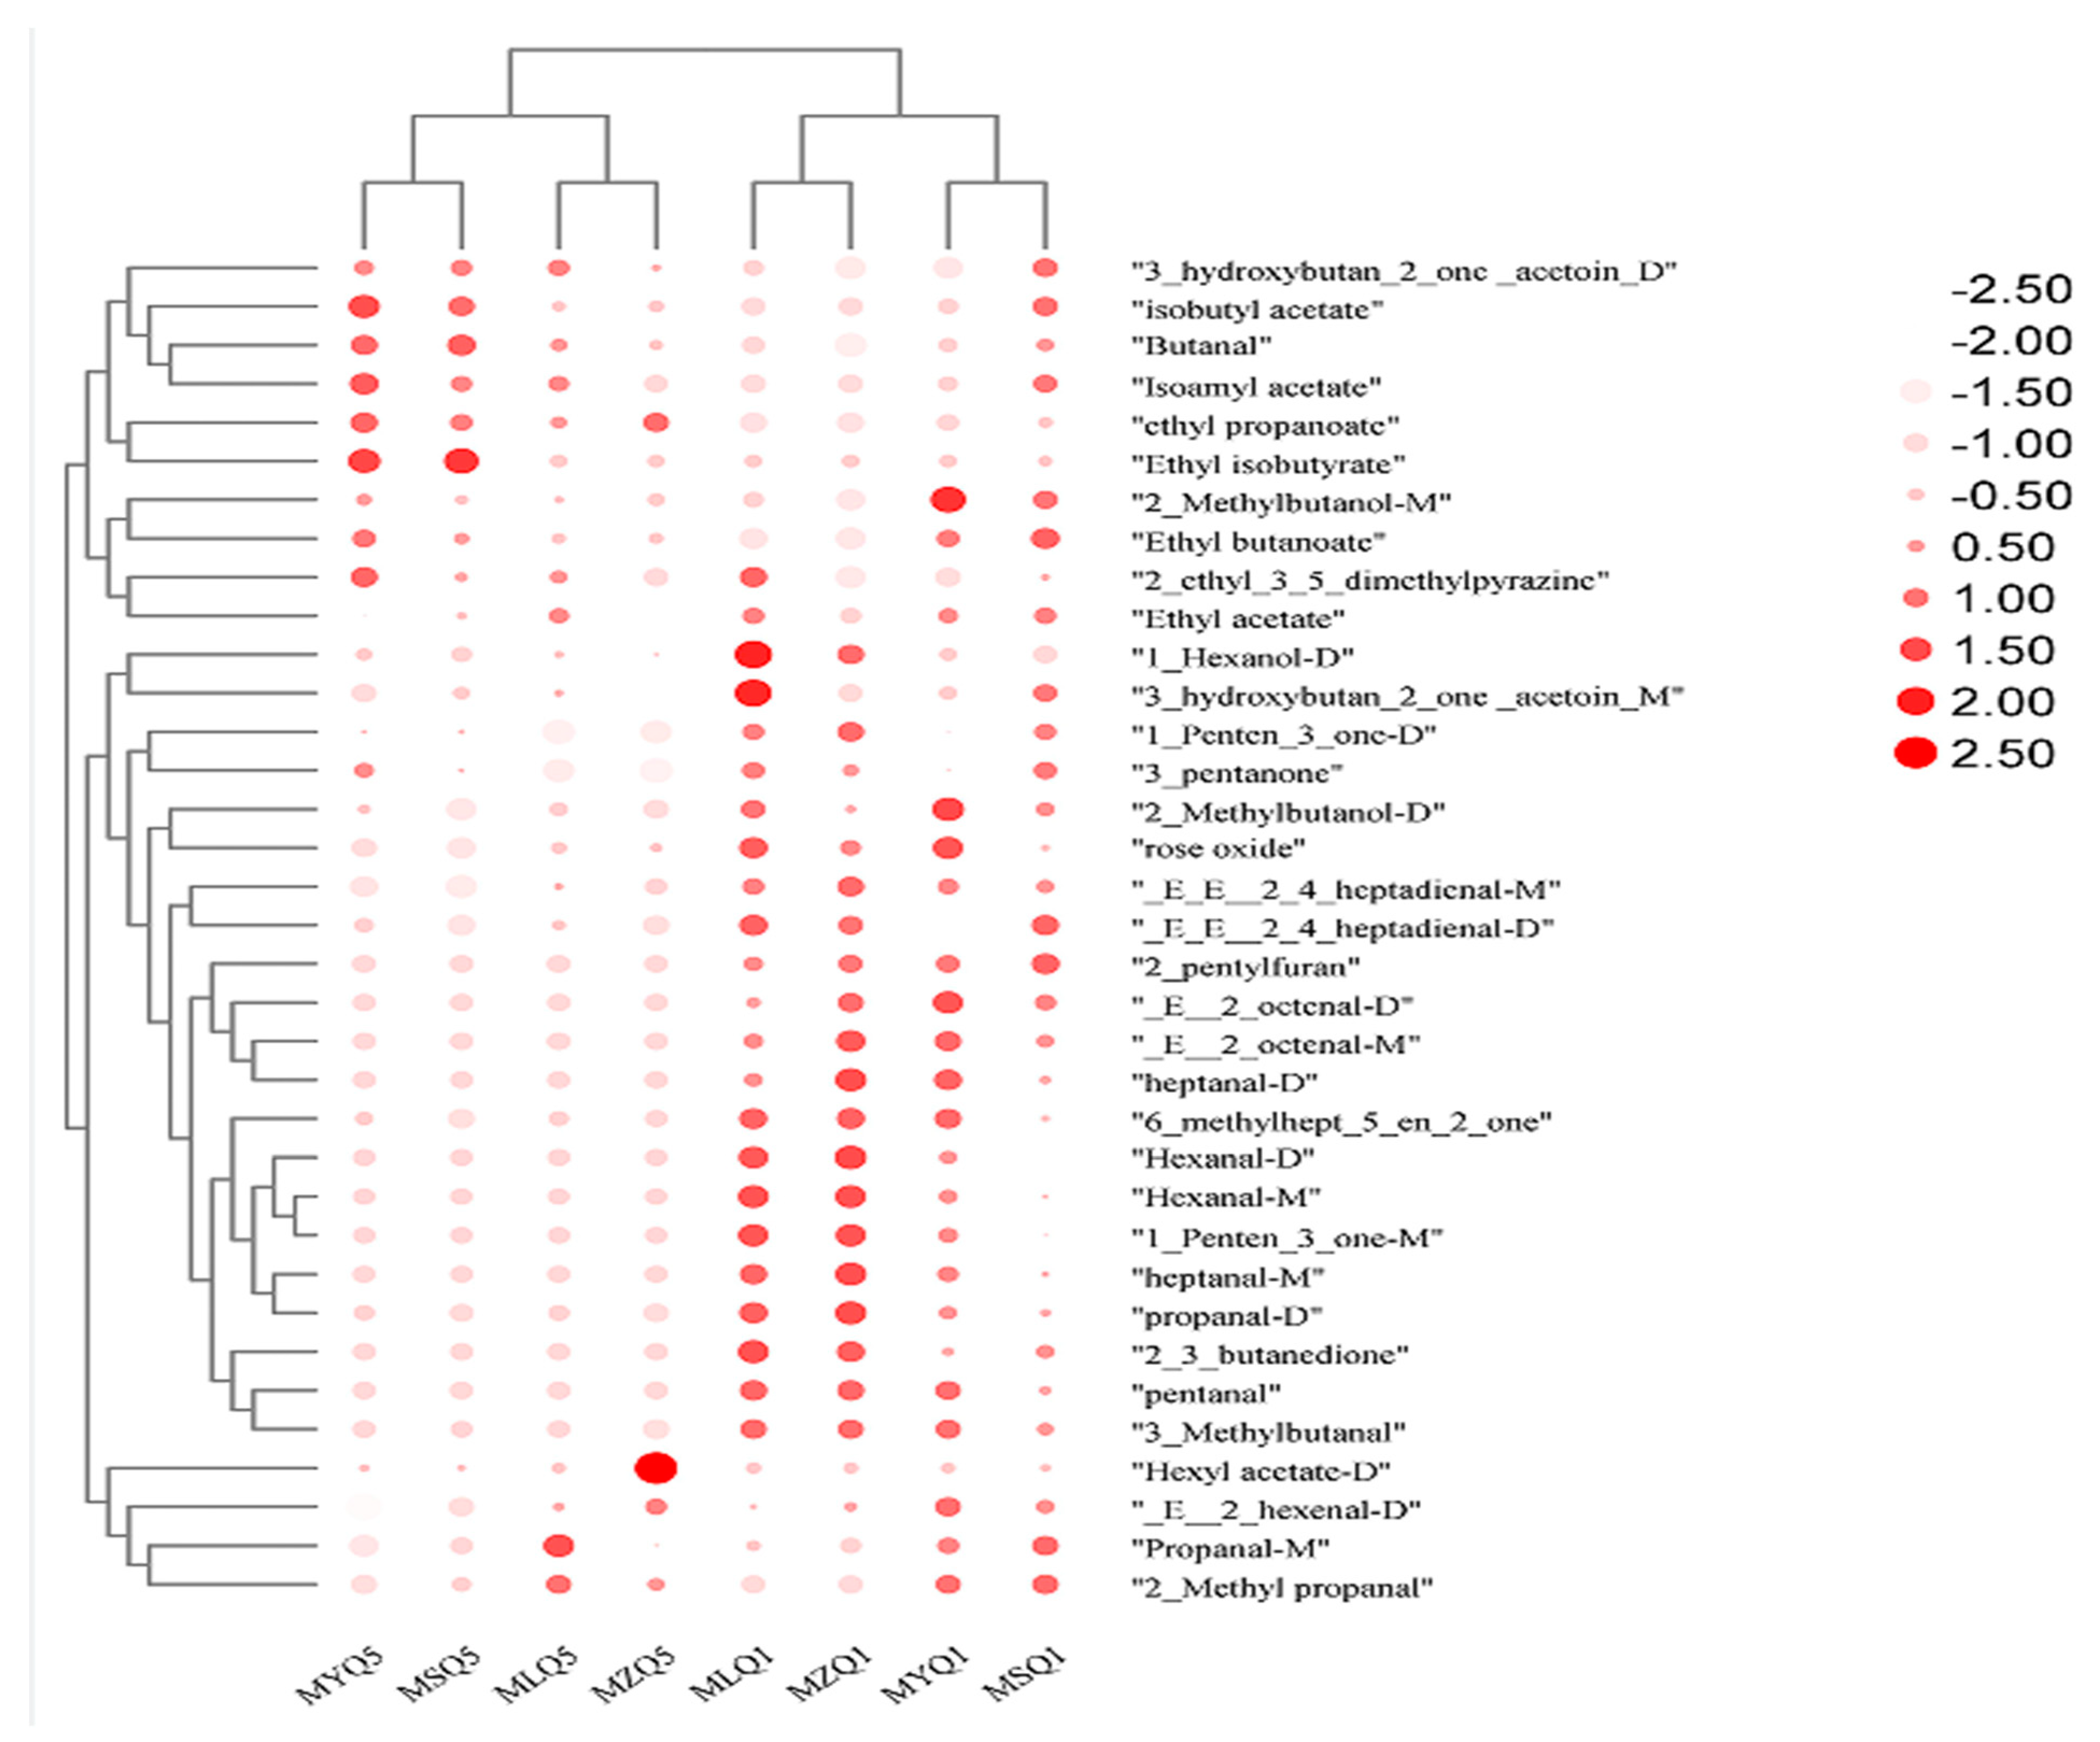
3.6. Comparison of Fingerprint Profiles of Volatile Compounds in Different Red Sour Soup Samples
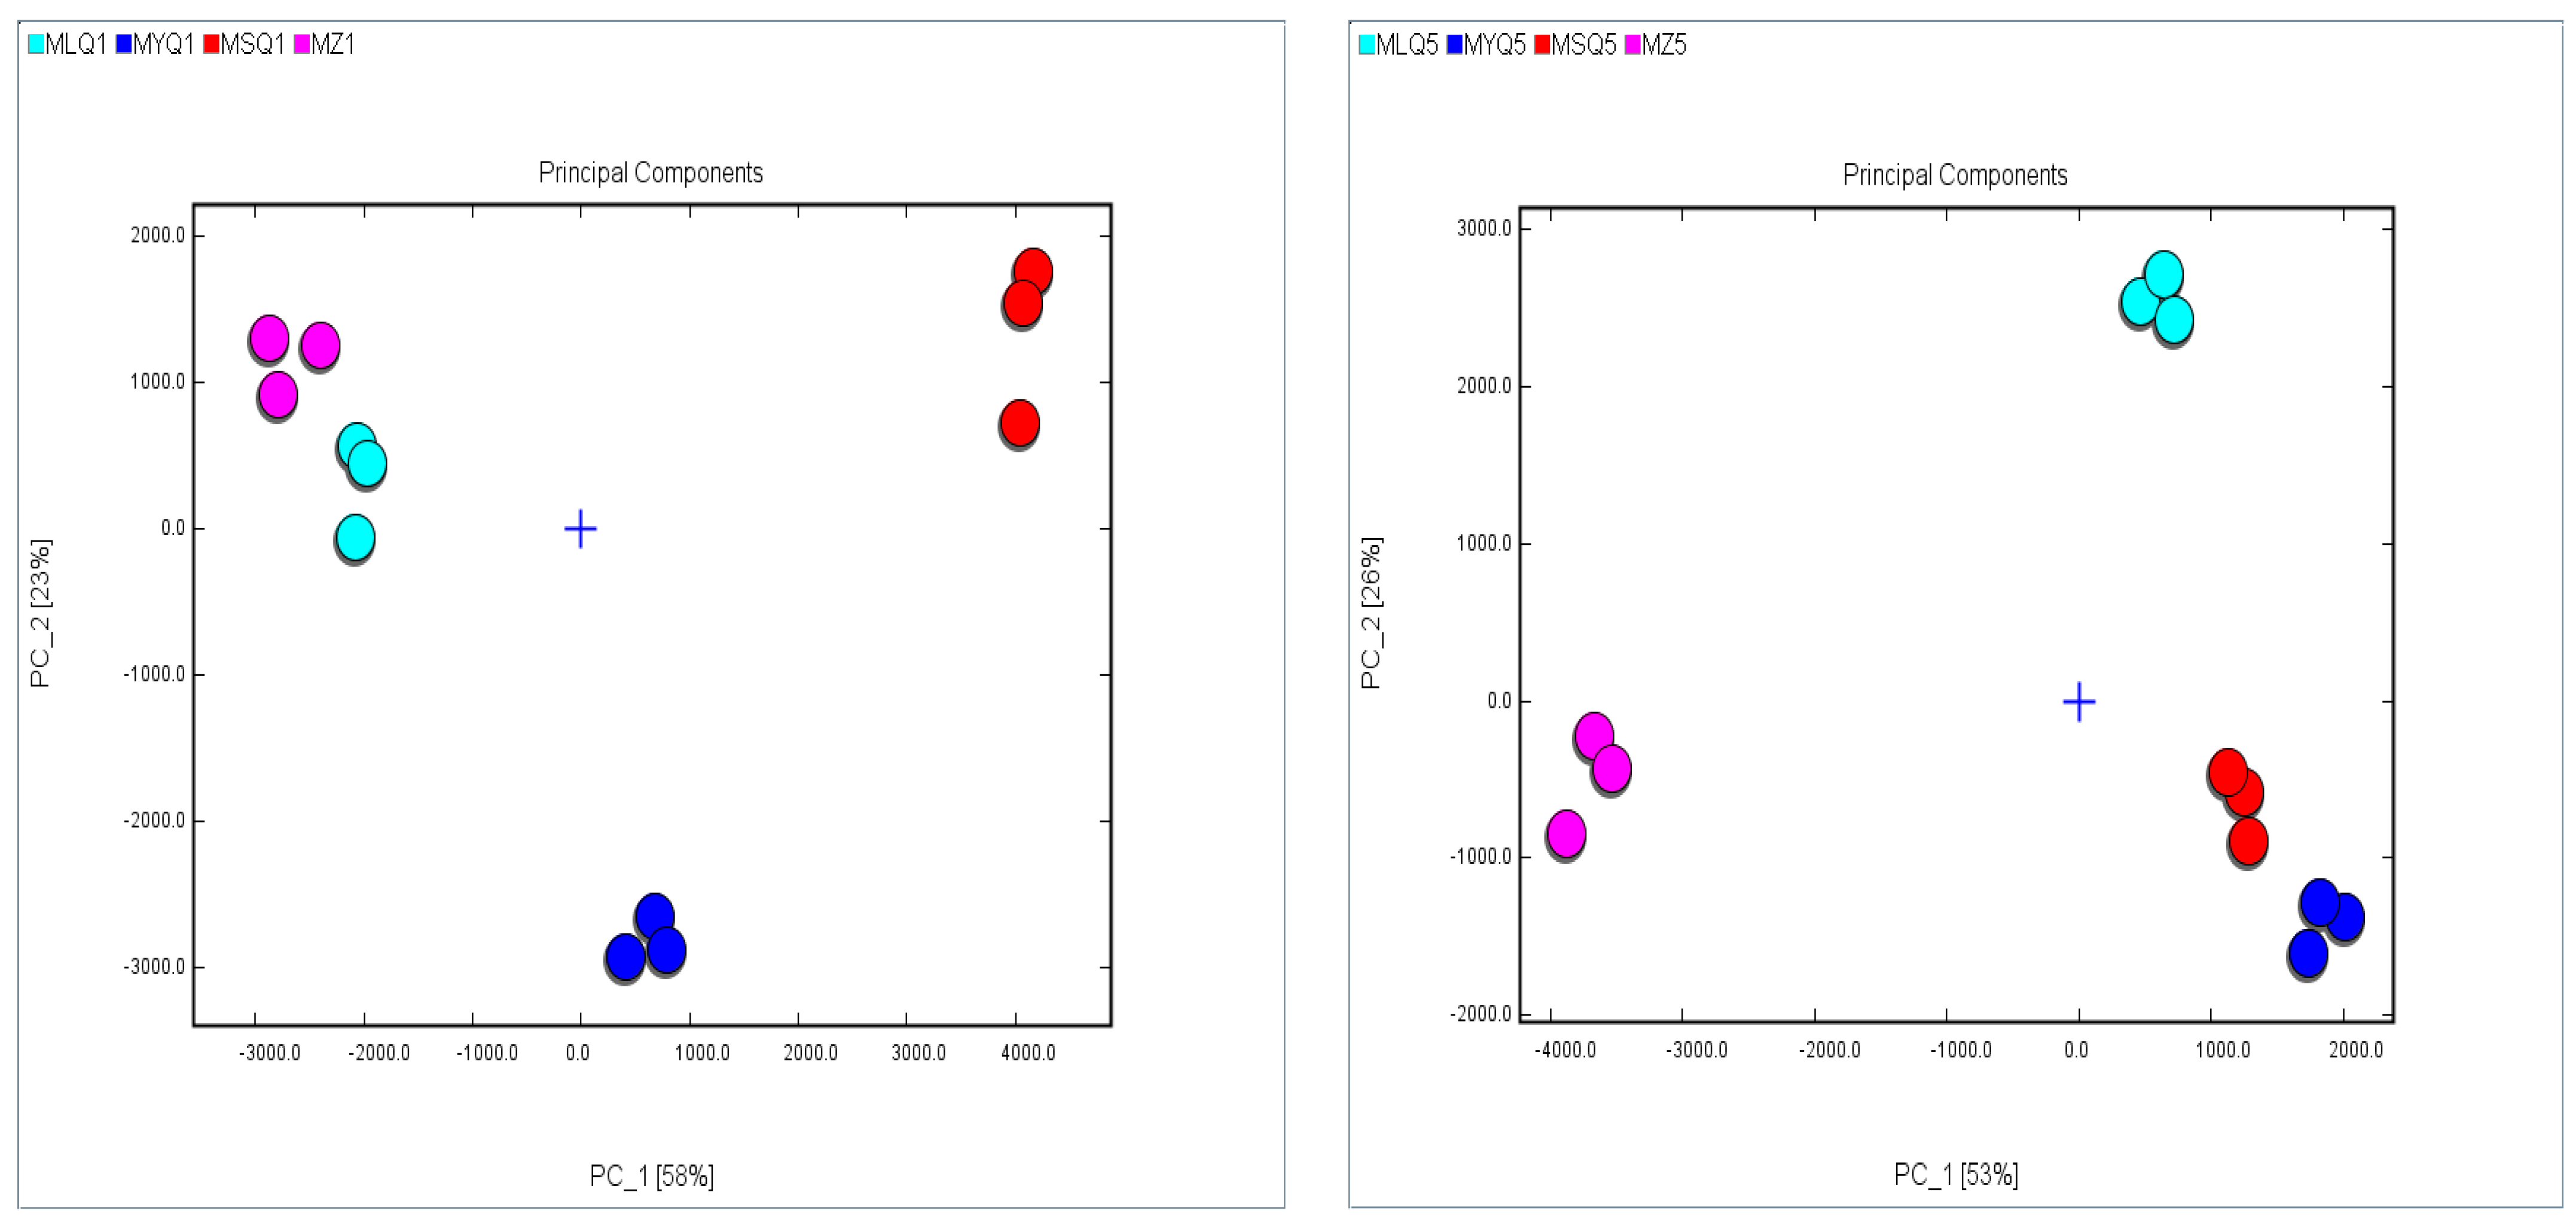
3.7. Principal Component Analysis of Volatile Flavor Compounds in Different Red Sour Soup Samples
3.8. ROAV Analysis of Key Volatile Compounds in Different Red Sour Soup Samples
4. Conclusions
Author Contributions
Funding
Data availability Statement
Conflicts of Interest
References
- Li, D.F.; Duan, F.X.; Tian, Q.M.; Zhong, D.J.; Wang, X.Y.; Jia, L.R. Physiochemical, microbiological and flavor characteristics of traditional Chinese fermented food Kaili Red Sour Soup. LWT 2021, 142, 110933. [Google Scholar] [CrossRef]
- Yang, H.; Xie, J.; Wang, N.; Zhou, Q.; Lu, Y.; Qu, Z.; Wang, H. Effects of Miao sour soup on hyperlipidemia in high-fat diet-induced obese rats via the AMPK signaling pathway. Food Sci. Nutr. 2021, 9, 4266–4277. [Google Scholar] [CrossRef] [PubMed]
- Byun, B.Y.; Bai, X.; Mah, J.-H. Occurrence of biogenic amines in Doubanjiang and Tofu. Food Sci. Biotechnol. 2013, 22, 55–62. [Google Scholar] [CrossRef]
- Fang, Z.; Hongfei, Z.; Junyu, Z.; Dziugan, P.; Shanshan, L.; Bolin, Z. Evaluation of probiotic properties of Lactobacillus strains isolated from traditional Chinese cheese. Ann. Microbiol. 2015, 65, 1419–1426. [Google Scholar] [CrossRef]
- Lu, M.; Chen, C.; Lan, Y.; Xiao, J.; Li, R.; Huang, J.; Huang, Q.; Cao, Y.; Ho, C.T. Capsaicin-the major bioactive ingredient of chili peppers: Bio-efficacy and delivery systems. Food Funct. 2020, 11, 2848–2860. [Google Scholar] [CrossRef]
- Zhang, L.; Qin, Z.; Zhang, L.; Jiang, Y.; Zhu, J. Dynamic changes of quality and flavor characterization of Zhejiang rosy vinegar during fermentation and aging based on untargeted metabolomics. Food Chem. 2023, 404, 134702. [Google Scholar] [CrossRef]
- Wang, S.; Chen, H.; Sun, B. Recent progress in food flavor analysis using gas chromatography-ion mobility spectrometry (GC-IMS). Food Chem. 2020, 315, 126158. [Google Scholar] [CrossRef]
- Liang, H.; He, Z.; Wang, X.; Song, G.; Chen, H.; Lin, X.; Ji, C.; Zhang, S. Bacterial profiles and volatile flavor compounds in commercial Suancai with varying salt concentration from Northeastern China. Food Res. Int. 2020, 137, 109384. [Google Scholar] [CrossRef]
- Wang, Z.M.; Lu, Z.-M.; Shi, J.S.; Xu, Z.H. Exploring flavour-producing core microbiota in multispecies solid-state fermentation of traditional Chinese vinegar. Sci. Rep. 2016, 6, 26818. [Google Scholar] [CrossRef]
- Xiao, M.; Xiong, T.; Peng, Z.; Liu, C.; Huang, T.; Yu, H.; Xie, M. Correlation between microbiota and flavours in fermentation of Chinese Sichuan Paocai. Food Res. Int. 2018, 114, 123–132. [Google Scholar] [CrossRef]
- Liu, N.; Pan, J.; Miao, S.; Qin, L. Microbial community in Chinese traditional fermented acid rice soup (rice-acid) and its correlations with key organic acids and volatile compounds. Food Res. Int. 2020, 137, 109672. [Google Scholar] [CrossRef] [PubMed]
- Liu, N.; Qin, L.; Lu, X.; Zhao, Y.; Miao, S. Fortified Fermented Rice-Acid Can Regulate the Gut Microbiota in Mice and Improve the Antioxidant Capacity. Nutrients 2021, 13, 4219. [Google Scholar] [CrossRef] [PubMed]
- Liu, D.; Bai, L.; Feng, X.; Chen, Y.P.; Zhang, D.; Yao, W.; Zhang, H.; Chen, G.; Liu, Y. Characterization of Jinhua ham aroma profiles in specific to aging time by gas chromatography-ion mobility spectrometry (GC-IMS). Meat Sci. 2020, 168, 108178. [Google Scholar] [CrossRef] [PubMed]
- Song, G.; He, Z.; Wang, X.; Zhao, M.; Cao, X.; Lin, X.; Ji, C.; Zhang, S.; Liang, H. Improving the quality of Suancai by inoculating with Lactobacillus plantarum and Pediococcus pentosaceus. Food Res. Int. 2021, 148, 110581. [Google Scholar] [CrossRef]
- Sha-Sha, Z.; Ping, H.U.J.C.C. Study on Quality Change of Red Sour Soup Fermented by Lactic Acid Bacteria. China Condiment 2019, 44, 65–70. (In Chinese) [Google Scholar]
- Liu, N.; Hu, Y.; Qin, L.; Bao, A.; Qin, W.; Miao, S. Flavor and quality characteristics of Guizhou red sour soup prepared by different artificially fortified fermentation methods. Lwt 2023, 186, 115247. [Google Scholar] [CrossRef]
- Fermented Fruits and Vegetables Liquid and Its Products (T/TSSP 014—2022). Available online: https://www.ttbz.org.cn/upload/file/20220718/6379375792229400983301077.pdf (accessed on 29 August 2023).
- Niamah, A.K.; Al-fekaiki, D.F.; Thyab Gddoa Al-Sahlany, S.; Verma, D.K.; Patel, A.R.; Singh, S. Investigating the effect of addition of probiotic microorganisms (bacteria or yeast) to yoghurt on the viability and volatile aromatic profiles. J. Food Meas. Charact. 2023, 17, 5463–5473. [Google Scholar] [CrossRef]
- Zhong, Q.; Chen, R.; Zhang, M.; Chen, W.; Chen, H.; Chen, W. Effect of the Mixed Inoculation of Lactic Acid Bacteria and Non-Saccharomyces on the Quality and Flavor Enhancement of Fermented Mango Juice. Fermentation 2023, 9, 563. [Google Scholar] [CrossRef]
- Fujimoto, A.; Ito, K.; Itou, M.; Narushima, N.; Ito, T.; Yamamoto, A.; Hirayama, S.; Furukawa, S.; Morinaga, Y.; Miyamoto, T. Microbial behavior and changes in food constituents during fermentation of Japanese sourdoughs with different rye and wheat starting materials. J. Biosci. Bioeng. 2018, 125, 97–104. [Google Scholar] [CrossRef]
- Wang, C.; Song, X.; Li, C.; He, L.; Wang, X.; Zeng, X. Mixed fermentation with Lactobacillus plantarum, Bifidobacterim animalis subsp. lactis and Candida utilis improves the fermentation quality of Hong Suan Tang. Food Chem. 2023, 402, 134488. [Google Scholar] [CrossRef]
- Wang, Z.L.; Mi, S.; Wang, X.H.; Mao, K.M.; Liu, Y.W.; Gao, J.; Sang, Y.X. Characterization and discrimination of fermented sweet melon juice by different microbial strains via GC-IMS-based volatile profiling and chemometrics. Food Sci. Hum. Wellness 2023, 12, 1241–1247. [Google Scholar] [CrossRef]
- Guo, Y.; Chen, D.; Dong, Y.; Ju, H.; Wu, C.; Lin, S. Characteristic volatiles fingerprints and changes of volatile compounds in fresh and dried Tricholoma matsutake Singer by HS-GC-IMS and HS-SPME-GC-MS. J. Chromatogr. B 2018, 1099, 46–55. [Google Scholar] [CrossRef] [PubMed]
- Cavanna, D.; Zanardi, S.; Dall’Asta, C.; Suman, M. Ion mobility spectrometry coupled to gas chromatography: A rapid tool to assess eggs freshness. Food Chem. 2019, 271, 691–696. [Google Scholar] [CrossRef] [PubMed]
- Liu, N.; Miao, S.; Qin, L. Screening and application of lactic acid bacteria and yeasts with L-lactic acid-producing and antioxidant capacity in traditional fermented rice acid. Food Sci. Nutr. 2020, 8, 6095–6111. [Google Scholar] [CrossRef] [PubMed]
- Zhang, D.-Y.; Xu, L.; Lu, Q.-S.; Mou, Q. Optimization of Kaili red sour soup "tomato juice" fermentation process and fortified microflora. Food Sci. Technol. 2018, 43, 313–318. (In Chinese) [Google Scholar] [CrossRef]
- He, Y.; Li, G.; Li, Y.; Luo, X.; Luo, Q.; Shi, B.; Duan, Z.; Liu, N. Analysis of Microflora and Volatile Substances Change in Red Sour Soup during Fermentation. Sci. Technol. Food Ind. 2022, 43, 177–190. (In Chinese) [Google Scholar] [CrossRef]
- Sun, Q.; Yang, C.; Li, J.; Raza, H.; Zhang, L. Lycopene: Heterogeneous Catalytic E/Z Isomerization and In Vitro Bioaccessibility Assessment Using a Diffusion Model. J. Food Sci. 2016, 81, C2381–C2389. [Google Scholar] [CrossRef]
- Ashaolu, T.J.; Reale, A. A Holistic Review on Euro-Asian Lactic Acid Bacteria Fermented Cereals and Vegetables. Microorganisms 2020, 8, 1176. [Google Scholar] [CrossRef]
- Yang, H.; Zou, H.; Qu, C.; Zhang, L.; Liu, T.; Wu, H.; Li, Y. Dominant Microorganisms during the Spontaneous Fermentation of Suan Cai, a Chinese Fermented Vegetable. Food Sci. Technol. Res. 2014, 20, 915–926. [Google Scholar] [CrossRef]
- Liang, H.; Chen, H.; Ji, C.; Lin, X.; Zhang, W.; Li, L. Dynamic and Functional Characteristics of Predominant Species in Industrial Paocai as Revealed by Combined DGGE and Metagenomic Sequencing. Front. Microbiol. 2018, 9, 2416. [Google Scholar] [CrossRef]
- Wang, Z.; Shao, Y. Effects of microbial diversity on nitrite concentration in pao cai, a naturally fermented cabbage product from China. Food Microbiol. 2018, 72, 185–192. [Google Scholar] [CrossRef] [PubMed]
- Yan, P.-M.; Xue, W.-T.; Tan, S.-S.; Zhang, H.; Chang, X.-H. Effect of inoculating lactic acid bacteria starter cultures on the nitrite concentration of fermenting Chinese paocai. Food Control 2008, 19, 50–55. [Google Scholar] [CrossRef]
- Gerardi, C.; Tristezza, M.; Giordano, L.; Rampino, P.; Perrotta, C.; Baruzzi, F.; Capozzi, V.; Mita, G.; Grieco, F. Exploitation of Prunus mahaleb fruit by fermentation with selected strains of Lactobacillus plantarum and Saccharomyces cerevisiae. Food Microbiol. 2019, 84, 103262. [Google Scholar] [CrossRef] [PubMed]
- Guo, H.; Sun, Z.; Hao, Y.; Zhang, L.; Ren, Y.; Zhang, Y.; Chen, Z.; Mandlaa. Correlation between bacterial communities and organic acids in the fermentation stage of traditional Chinese sour porridge. Int. J. Food Prop. 2020, 23, 1430–1440. [Google Scholar] [CrossRef]
- Garcia-Quintans, N.; Repizo, G.; Martin, M.; Magni, C.; Lopez, P. Activation of the diacetyl/acetoin pathway in Lactococcus lactis subsp. lactis bv. diacetylactis CRL264 by acidic growth. Appl. Environ. Microbiol. 2008, 74, 1988–1996. [Google Scholar] [CrossRef]
- Caseiro, M.; Ascenso, A.; Costa, A.; Creagh-Flynn, J.; Johnson, M.; Simões, S. Lycopene in human health. Lwt 2020, 127, 109323. [Google Scholar] [CrossRef]
- Varma, S.; Karwe, M.V.; Lee, T.-C. Effect of High Hydrostatic Pressure Processing on Lycopene Isomers. Int. J. Food Eng. 2010, 6, 5. [Google Scholar] [CrossRef]
- Honest, K.N.; Zhang, H.W.; Zhang, L. Lycopene: Isomerization Effects on Bioavailability and Bioactivity Properties. Food Rev. Int. 2011, 27, 248–258. [Google Scholar] [CrossRef]
- Perez, A.G.; Sanz, C.; Olias, R.; Olias, J.M. Lipoxygenase and hydroperoxide lyase activities in ripening strawberry fruits. J. Agric. Food Chem. 1999, 47, 249–253. [Google Scholar] [CrossRef]
- Guclu, G.; Keser, D.; Kelebek, H.; Keskin, M.; Sekerli, Y.E.; Soysal, Y.; Selli, S. Impact of production and drying methods on the volatile and phenolic characteristics of fresh and powdered sweet red peppers. Food Chem. 2021, 338, 128129. [Google Scholar] [CrossRef]
- Coelho, E.; Azevedo, M.; Teixeira, J.A.; Tavares, T.; Oliveira, J.M.; Domingues, L. Evaluation of multi-starter S. cerevisiae/D. bruxellensis cultures for mimicking and accelerating transformations occurring during barrel ageing of beer. Food Chem. 2020, 323, 126826. [Google Scholar] [CrossRef] [PubMed]
- Shen, Y.; Wu, Y.; Wang, Y.; Li, L.; Li, C.; Zhao, Y.; Yang, S. Contribution of autochthonous microbiota succession to flavor formation during Chinese fermented mandarin fish (Siniperca chuatsi). Food Chem. 2021, 348, 129107. [Google Scholar] [CrossRef] [PubMed]
- Yi, C.; Li, Y.; Zhu, H.; Liu, Y.; Quan, K. Effect of paracasei fermentation on the volatile flavors of mung beans. LWT 2021, 146, 111434. [Google Scholar] [CrossRef]
- Zhang, J.; Zhang, W.; Zhou, L.; Zhang, R. Study on the influences of ultrasound on the flavor profile of unsmoked bacon and its underlying metabolic mechanism by using HS-GC-IMS. Ultrason. Sonochemistry 2021, 80, 105807. [Google Scholar] [CrossRef]
- Qin, L.; Kang, W.; Zhang, Z.; Guo, A. Changes in C6 Volatile Aldehyde and Alcohol Components of Nectarine Fruits Analyzed by Headspace Solid-Phase Microextraction-gas Chromatography/Mass Spectrometry. Xiandai Shipin Keji 2015, 31, 301–307. (In Chinese) [Google Scholar] [CrossRef]
- Zhang, J.H.; Cao, J.; Pei, Z.S.; Wei, P.Y.; Xiang, D.; Cao, X.Y.; Shen, X.R.; Li, C. Volatile flavour components and the mechanisms underlying their production in golden pompano (Trachinotus blochii) fillets subjected to different drying methods: A comparative study using an electronic nose, an electronic tongue and SDE-GC-MS. Food Res. Int. 2019, 123, 217–225. [Google Scholar] [CrossRef]
- Kamda, A.G.S.; Ramos, C.L.; Fokou, E.; Duarte, W.F.; Mercy, A.; Germain, K.; Dias, D.R.; Schwan, R.F. In vitro determination of volatile compound development during starter culture-controlled fermentation of Cucurbitaceae cotyledons. Int. J. Food Microbiol. 2015, 192, 58–65. [Google Scholar] [CrossRef]
- Hosoglu, M.I.; Karagul-Yuceer, Y.; Guneser, O. Aroma characterization of heterotrophic microalgae Crypthecodinium cohnii using solid-phase microextraction and gas chromatography- mass spectrometry/olfactometry during different growth phases. Algal Res. 2020, 49, 101928. [Google Scholar] [CrossRef]
- Liao, Y.; Ding, Y.; Wu, Y.; Du, Q.; Xia, J.; Jia, J.; Lin, H.; Benjakul, S.; Zhang, B.; Hu, Y. Analysis of volatile compounds and flavor fingerprint in hairtail (Trichiurus lepturus) during air-drying using headspace-gas chromatography-ion mobility spectrometry (HS-GC-IMS). Front. Nutr. 2023, 9, 128129. [Google Scholar] [CrossRef]
- Wang, C.; Zhang, Q.; He, L.; Li, C. Determination of the microbial communities of Guizhou Suantang, a traditional Chinese fermented sour soup, and correlation between the identified microorganisms and volatile compounds. Food Res. Int. 2020, 138, 109820. [Google Scholar] [CrossRef]
- Settanni, L.; Corsetti, A. The use of multiplex PCR to detect and differentiate food and beverage-associated microorganisms: A review. J. Microbiol. Methods 2007, 69, 1–22. [Google Scholar] [CrossRef] [PubMed]
- Wang, Y.; Gao, Y.; Liang, W.; Liu, Y.; Gao, H. Identification and analysis of the flavor characteristics of unfermented stinky tofu brine during fermentation using SPME-GC-MS, e-nose, and sensory evaluation. J. Food Meas. Charact. 2020, 14, 597–612. [Google Scholar] [CrossRef]
- Tang, X.; Xia, Y.; Wu, C. Analysis of Volatile Components in Hot Pepper Juice during Fermentation. Food Sci. 2014, 35, 197–201. (In Chinese) [Google Scholar]
- Hu, K.; Jin, G.J.; Mei, W.C.; Li, T.; Tao, Y.S. Increase of medium-chain fatty acid ethyl ester content in mixed H. uvarum/S. cerevisiae fermentation leads to wine fruity aroma enhancement. Food Chem. 2018, 239, 495–501. [Google Scholar] [CrossRef]
- Wang, W.; Zhang, Y.; Lin, L.; Jiang, S.-T.; Lu, J.-F. Effects of two different sterilization methods on the nutritional composition and volatile components of shenxian (fairy) beans. Xiandai Shipin Keji 2015, 31, 245–253. [Google Scholar] [CrossRef]
- Xie, W.; Xu, X.-L.; Zhou, G.-H. Effects of Different Processing Procedures on Volatile Flavor Composition of Water Boiled Salted Duck. Food Sci. 2010, 31, 110–115. (In Chinese) [Google Scholar]
- Sebzalli, Y.M.; Wang, X.Z. Knowledge discovery from process operational data using PCA and fuzzy clustering. Eng. Appl. Artif. Intell. 2001, 14, 607–616. [Google Scholar] [CrossRef]
- Pang, X.; Guo, X.; Qin, Z.; Yao, Y.; Hu, X.; Wu, J. Identification of aroma-active compounds in Jiashi muskmelon juice by GC-O-MS and OAV calculation. J. Agric. Food Chem. 2012, 60, 4179–4185. [Google Scholar] [CrossRef]
- Kim, K.; Chun, I.J.; Suh, J.H.; Sung, J. Relationships between sensory properties and metabolomic profiles of different apple cultivars. Food Chem. X 2023, 18, 100641. [Google Scholar] [CrossRef]
- Li, N.; Wang, L.; Yin, J.; Ma, N.; Tao, Y. Adjustment of impact odorants in Hutai-8 rose wine by co-fermentation of Pichia fermentans and Saccharomyces cerevisiae. Food Res. Int. 2022, 153, 1088128. [Google Scholar] [CrossRef]
- Ando, H.; Hatanaka, K.; Ohata, I.; Yamashita-Kitaguchi, Y.; Kurata, A.; Kishimoto, N. Antifungal activities of volatile substances generated by yeast isolated from Iranian commercial cheese. Food Control 2012, 26, 472–478. [Google Scholar] [CrossRef]


| Sample | Number of Bacterial Colonies (106 CFU/mL) | Total Number of LAB Colonies (106 CFU/mL) | Total Number of Yeast Colonies (106 CFU/mL) |
|---|---|---|---|
| MLQ1 | 1.28 ± 0.25 f | 3.60 ± 0.40 d | 1.43 ± 0.12 ef |
| MLQ5 | 91.33 ± 1.53 b | 27.17 ± 0.31 b | 12.23 ± 0.31 c |
| MYQ1 | 5.03 ± 0.25 e | 0.23 ± 0.02 f | 1.10 ± 0.10 ef |
| MYQ5 | 4.90 ± 0.27 e | 4.93 ± 0.12 c | 64.67 ± 1.53 a |
| MSQ1 | 13.80 ± 0.99 d | 2.90 ± 0.10 de | 2.00 ± 0.20 e |
| MSQ5 | 149.33 ± 4.04 a | 285.90 ± 1.65 a | 48.67 ± 1.53 b |
| MZ1 | 0.25 ± 0.01 f | 0.23 ± 0.02 e | 0.25 ± 0.01 f |
| MZ5 | 74.33 ± 2.08 c | 2.40 ± 0.10 f | 7.50 ± 0.10 d |
| Sample | Oxalic Acid (g/kg) | Tartaric Acid (g/kg) | Malic Acid (g/kg) | Lactic Acid (g/kg) | Acetic Acid (g/kg) | Citric Acid (g/kg) | Succinic Acid (g/kg) |
|---|---|---|---|---|---|---|---|
| MLQ1 | 0 ± 0 b | 0 ± 0 a | 7.79 ± 0.26 a | 2.91 ± 0.33 b | 0 ± 0 d | 3.77 ± 0.46 cd | 0 ± 0 c |
| MLQ5 | 0 ± 0 b | 0 ± 0 a | 12.68 ± 8.43 a | 13.55 ± 11.77 a | 0.55 ± 0.31 cd | 3.59 ± 0.31 d | 0.54 ± 0.32 b |
| MYQ1 | 0.02 ± 0.01 a | 0 ± 0 a | 8.31 ± 0.87 a | 4.26 ± 0.83 b | 0.40 ± 0.12 d | 3.45 ± 0.25 d | 0 ± 0 c |
| MYQ5 | 0 ± 0 b | 0 ± 0 a | 12.09 ± 0.32 a | 5.33 ± 1.06 b | 1.42 ± 0.70 b | 3.30 ± 0.23 d | 0.23 ± 0.23 c |
| MSQ1 | 0 ± 0 b | 0.17 ± 0.30 a | 7.98 ± 0.07 a | 3.37 ± 1.06 b | 1.22 ± 0.77 bc | 4.33 ± 0.06 bc | 0 ± 0 c |
| MSQ5 | 0 ± 0 b | 0.04 ± 0.04 a | 11.83 ± 0.94 a | 0.22 ± 0.19 b | 3.41 ± 0.29 a | 0 ± 0 e | 3.96 ± 0.15 a |
| MZ1 | 0 ± 0 b | 0 ± 0 a | 0.76 ± 0.30 a | 2.00 ± 0.36 b | 0.04 ± 0.07 d | 6.53 ± 0.73 a | 0 ± 0 c |
| MZ5 | 0 ± 0 b | 0 ± 0 a | 13.43 ± 0.20 a | 1.94 ± 0.13 b | 0.26 ± 0.34 d | 4.69 ± 0.10 b | 0 ± 0 c |
| Sample | Trans Lycopene ConCentration (ug/mL) | Cis-Lycopene (µg/mL) | Total Lycopene Content (ug/mL) | Cis-Proportion (%) |
|---|---|---|---|---|
| MLQ1 | 27.93 ± 0.03 d | 2.44 ± 0.03 d | 30.37 ± 0.06 c | 8.04 ± 0.09 c |
| MLQ5 | 22.16 ± 0.54 e | 4.48 ± 0.01 b | 26.64 ± 0.53 d | 16.82 ± 0.36 a |
| MYQ1 | 16.74 ± 0.26 f | 0.60 ± 0.13 e | 17.34 ± 0.13 e | 3.47 ± 0.78 e |
| MYQ5 | 30.15 ± 2.99 c | 2.30 ± 0.11 d | 32.45 ± 3.10 c | 7.11 ± 0.34 d |
| MSQ1 | 48.26 ± 0.26 b | 3.24 ± 0.01 c | 51.50 ± 0.27 b | 6.29 ± 0.01 d |
| MSQ5 | 48.49 ± 0.48 b | 3.40 ± 0.12 c | 51.89 ± 0.36 b | 6.55 ± 0.28 d |
| MZ1 | 13.93 ± 1.03 g | 0 ± 0 f | 13.93 ± 1.04 f | 0 ± 0 f |
| MZ5 | 57.71 ± 0.63 a | 6.02 ± 0.64 a | 63.73 ± 0.72 a | 9.44 ± 0.94 b |
| Count | Classification | Compound | GAS# | Formula | MW | RI | RT (sec) | DT (a.u) | Comment |
|---|---|---|---|---|---|---|---|---|---|
| 1 | alcohol | terpinen-4-ol | C562743 | C10H18O | 154.3 | 1599.4 | 1538.14 | 1.2293 | |
| 2 | 2-Ethyl-1-hexanol | C104767 | C8H18O | 130.2 | 1492.7 | 1114.76 | 1.4029 | ||
| 3 | Linalool | C78706 | C10H18O | 154.3 | 1514.6 | 1190.996 | 1.2202 | ||
| 4 | Linalool oxide | C60047178 | C10H18O2 | 170.3 | 1417.4 | 888.137 | 1.267 | ||
| 5 | (Z)-Hex-3-enol | C928961 | C6H12O | 100.2 | 1401.2 | 845.938 | 1.2399 | Monomer | |
| 6 | (Z)-Hex-3-enol | C928961 | C6H12O | 100.2 | 1400.1 | 843.061 | 1.5122 | Dimer | |
| 7 | 1-Hexanol | C111273 | C6H14O | 102.2 | 1368.5 | 766.334 | 1.3283 | Monomer | |
| 8 | 1-Hexanol | C111273 | C6H14O | 102.2 | 1369.7 | 769.211 | 1.6428 | Dimer | |
| 9 | 1-Pentanol | C71410 | C5H12O | 88.1 | 1261.2 | 560.649 | 1.2564 | Monomer | |
| 10 | 1-Pentanol | C71410 | C5H12O | 88.1 | 1260.8 | 559.984 | 1.5146 | Dimer | |
| 11 | 3-Methyl-1-butanol | C123513 | C5H12O | 88.1 | 1217.9 | 499.005 | 1.2482 | Monomer | |
| 12 | 3-Methyl-1-butanol | C123513 | C5H12O | 88.1 | 1217.3 | 498.318 | 1.4957 | Dimer | |
| 13 | 2-Methylbutanol | C137326 | C5H12O | 88.1 | 1169.5 | 439.224 | 1.2208 | Monomer | |
| 14 | 2-Methylbutanol | C137326 | C5H12O | 88.1 | 1169.2 | 438.88 | 1.484 | Dimer | |
| 15 | (E)-2-pentenal | C1576870 | C5H8O | 84.1 | 1142.9 | 410.147 | 1.1059 | Monomer | |
| 16 | (E)-2-pentenal | C1576870 | C5H8O | 84.1 | 1142.7 | 409.898 | 1.3601 | Dimer | |
| 17 | 2-pentanol | C6032297 | C5H12O | 88.1 | 1099.8 | 367.003 | 1.4533 | ||
| 18 | 1-Propanol | C71238 | C3H8O | 60.1 | 1049.7 | 329.178 | 1.1128 | Monomer | |
| 19 | 1-Propanol | C71238 | C3H8O | 60.1 | 1049.3 | 328.838 | 1.2534 | Dimer | |
| 20 | 1-Heptanol | C111706 | C7H16O | 116.2 | 1000.6 | 296.173 | 1.3926 | ||
| 21 | ethanol | C64175 | C2H6O | 46.1 | 940.1 | 267.081 | 1.133 | ||
| 22 | 2-Methyl-1-propanol | C78831 | C4H10O | 74.1 | 1094.7 | 362.546 | 1.3678 | ||
| 23 | butan-1-ol | C71363 | C4H10O | 74.1 | 1153.7 | 421.783 | 1.183 | Monomer | |
| 24 | butan-1-ol | C71363 | C4H10O | 74.1 | 1153 | 420.959 | 1.3819 | Dimer | |
| 25 | 2-Methyl-1-propanol | C78831 | C4H10O | 74.1 | 1104 | 371.027 | 1.1733 | Monomer | |
| 26 | 2-Methyl-1-propanol | C78831 | C4H10O | 74.1 | 1104.6 | 371.581 | 1.3654 | Dimer | |
| 27 | aldehydes | (E,E)-2,4-heptadienal | C4313035 | C7H10O | 110.2 | 1492.3 | 1113.399 | 1.1948 | Monomer |
| 28 | (E,E)-2,4-heptadienal | C4313035 | C7H10O | 110.2 | 1491.5 | 1110.676 | 1.6334 | Dimer | |
| 29 | (E)-2-octenal | C2548870 | C8H14O | 126.2 | 1438.2 | 945.682 | 1.3364 | Monomer | |
| 30 | (E)-2-octenal | C2548870 | C8H14O | 126.2 | 1437.2 | 942.805 | 1.8237 | Dimer | |
| 31 | (E)-2-heptenal | C18829555 | C7H12O | 112.2 | 1330.3 | 682.894 | 1.258 | Monomer | |
| 32 | (E)-2-heptenal | C18829555 | C7H12O | 112.2 | 1330.7 | 683.853 | 1.6709 | Dimer | |
| 33 | (E)-2-hexenal | C6728263 | C6H10O | 98.1 | 1228 | 512.798 | 1.1814 | Monomer | |
| 34 | (E)-2-hexenal | C6728263 | C6H10O | 98.1 | 1227 | 511.469 | 1.5226 | Dimer | |
| 35 | heptanal | C111717 | C7H14O | 114.2 | 1194.6 | 468.771 | 1.3363 | Monomer | |
| 36 | heptanal | C111717 | C7H14O | 114.2 | 1194.6 | 468.771 | 1.6949 | Dimer | |
| 37 | Hexanal | C66251 | C6H12O | 100.2 | 1099 | 366.255 | 1.2669 | Monomer | |
| 38 | Hexanal | C66251 | C6H12O | 100.2 | 1097.7 | 365.008 | 1.5614 | Dimer | |
| 39 | 2-methyl-(E)-2-butenal | C497030 | C5H8O | 84.1 | 1110.7 | 377.478 | 1.0925 | Monomer | |
| 40 | 2-methyl-(E)-2-butenal | C497030 | C5H8O | 84.1 | 1110.7 | 377.478 | 1.3482 | Dimer | |
| 41 | pentanal | C110623 | C5H10O | 86.1 | 961.1 | 276.608 | 1.1845 | ||
| 42 | 3-Methylbutanal | C590863 | C5H10O | 86.1 | 925.1 | 260.446 | 1.4038 | ||
| 43 | Propionaldehyde | C123386 | C3H6O | 58.1 | 826.1 | 220.689 | 1.0633 | Monomer | |
| 44 | propanal | C123386 | C3H6O | 58.1 | 826.4 | 220.792 | 1.1462 | Dimer | |
| 45 | 2-Methyl propanal | C78842 | C4H8O | 72.1 | 805 | 213.004 | 1.0867 | ||
| 46 | 2-Hexenal | C505577 | C6H10O | 98.1 | 1244.3 | 535.778 | 1.1648 | Monomer | |
| 47 | 2-Hexenal | C505577 | C6H10O | 98.1 | 1244.3 | 535.778 | 1.5154 | Dimer | |
| 48 | Butanal | C123728 | C4H8O | 72.1 | 914.2 | 255.715 | 1.2901 | ||
| 49 | ketone | 1-(Acetyloxy)-2-propanone | C592201 | C5H8O3 | 116.1 | 1471.4 | 1045.331 | 1.1978 | Dimer |
| 50 | 1-(Acetyloxy)-2-propanone | C592201 | C5H8O3 | 116.1 | 1471 | 1043.97 | 1.0943 | Monomer | |
| 51 | 6-methylhept-5-en-2-one | C110930 | C8H14O | 126.2 | 1347.5 | 719.339 | 1.1766 | ||
| 52 | 3-hydroxybutan-2-one (acetoin) | C513860 | C4H8O2 | 88.1 | 1296.4 | 616.475 | 1.066 | Monomer | |
| 53 | 3-hydroxybutan-2-one (acetoin) | C513860 | C4H8O2 | 88.1 | 1296 | 615.81 | 1.3313 | Dimer | |
| 54 | heptan-2-one | C110430 | C7H14O | 114.2 | 1190.4 | 463.617 | 1.264 | Monomer | |
| 55 | heptan-2-one | C110430 | C7H14O | 114.2 | 1191.6 | 464.991 | 1.6335 | Dimer | |
| 56 | Hexan-2-one | C591786 | C6H12O | 100.2 | 1116.8 | 383.463 | 1.2028 | Monomer | |
| 57 | Hexan-2-one | C591786 | C6H12O | 100.2 | 1116.8 | 383.463 | 1.5048 | Dimer | |
| 58 | 1-Penten-3-one | C1629589 | C5H8O | 84.1 | 1038.3 | 321.182 | 1.078 | Monomer | |
| 59 | 1-Penten-3-one | C1629589 | C5H8O | 84.1 | 1037.6 | 320.672 | 1.3119 | Dimer | |
| 60 | 3-pentanone | C96220 | C5H10O | 86.1 | 995.7 | 293.111 | 1.3564 | ||
| 61 | 2,3-butanedione | C431038 | C4H6O2 | 86.1 | 988.7 | 289.708 | 1.1727 | ||
| 62 | Butan-2-one | C78933 | C4H8O | 72.1 | 913.3 | 255.343 | 1.2472 | Dimer | |
| 63 | Butan-2-one | C78933 | C4H8O | 72.1 | 911.7 | 254.662 | 1.0669 | Monomer | |
| 64 | Propan-2-one | C67641 | C3H6O | 58.1 | 841.5 | 226.428 | 1.1136 | ||
| 65 | 4-Methyl-2-pentanone | C108101 | C6H12O | 100.2 | 1024.7 | 311.955 | 1.18 | ||
| 66 | 4-Methyl-2-pentanone | C108101 | C6H12O | 100.2 | 986.7 | 288.749 | 1.4801 | ||
| 67 | ethers | rose oxide | C16409431 | C10H18O | 154.3 | 1334.5 | 691.573 | 1.356 | |
| 68 | Allyl methyl disulfide | C2179580 | C4H8S2 | 120.2 | 1289.2 | 604.512 | 1.1118 | Monomer | |
| 69 | Allyl methyl disulfide | C2179580 | C4H8S2 | 120.2 | 1289.2 | 604.512 | 1.4626 | Dimer | |
| 70 | diallyl sulfide | C592881 | C6H10S | 114.2 | 1158.6 | 427.106 | 1.1215 | ||
| 71 | pyrazine | 2-ethyl-3,5-dimethylpyrazine | C13925070 | C8H12N2 | 136.2 | 1435.1 | 937.051 | 1.2299 | |
| 72 | 2-ethylpyrazine | C13925003 | C6H8N2 | 108.1 | 1297.8 | 619.133 | 1.1418 | Monomer | |
| 73 | 2-ethylpyrazine | C13925003 | C6H8N2 | 108.1 | 1297.4 | 618.468 | 1.519 | Dimer | |
| 74 | terpene | Limonene | C138863 | C10H16 | 136.2 | 1204.8 | 481.826 | 1.2964 | Monomer |
| 75 | Limonene | C138863 | C10H16 | 136.2 | 1206.4 | 483.888 | 1.7248 | Dimer | |
| 76 | beta-pinene | C127913 | C10H16 | 136.2 | 1125.3 | 391.942 | 1.211 | ||
| 77 | alpha-Fenchene | C471841 | C10H16 | 136.2 | 1076 | 348.299 | 1.214 | ||
| 78 | camphene | C79925 | C10H16 | 136.2 | 1059.7 | 336.329 | 1.2013 | ||
| 79 | alpha-thujene | C2867052 | C10H16 | 136.2 | 1030.8 | 316.078 | 1.2165 | ||
| 80 | alpha-Phellandrene | C99832 | C10H16 | 136.2 | 1212.7 | 492.134 | 1.6659 | ||
| 81 | alpha-Pinene | C80568 | C10H16 | 136.2 | 1025.2 | 312.26 | 1.2924 | ||
| 82 | esters | methyl butanoate | C623427 | C5H10O2 | 102.1 | 1001.1 | 296.513 | 1.4267 | |
| 83 | Ethyl acetate | C141786 | C4H8O2 | 88.1 | 895.5 | 247.857 | 1.3356 | ||
| 84 | Ethyl formate | C109944 | C3H6O2 | 74.1 | 866.6 | 236.163 | 1.0581 | ||
| 85 | 1-methylethyl acetate | C108214 | C5H10O2 | 102.1 | 851.9 | 230.424 | 1.1554 | ||
| 86 | Ethyl butanoate | C105544 | C6H12O2 | 116.2 | 1047.8 | 327.82 | 1.5594 | ||
| 87 | Isoamyl acetate | C123922 | C7H14O2 | 130.2 | 1132.5 | 399.316 | 1.7516 | ||
| 88 | isobutyl acetate | C110190 | C6H12O2 | 116.2 | 1026.2 | 312.969 | 1.6185 | ||
| 89 | ethyl propanoate | C105373 | C5H10O2 | 102.1 | 968.4 | 280.009 | 1.4559 | ||
| 90 | Ethyl isobutyrate | C97621 | C6H12O2 | 116.2 | 979.2 | 285.153 | 1.5619 | ||
| 91 | (E)-Ethyl-2-hexenoate | C27829727 | C8H14O2 | 142.2 | 1328.3 | 678.772 | 1.8187 | ||
| 92 | Hexyl acetate | C142927 | C8H16O2 | 144.2 | 1284.6 | 597.075 | 1.3905 | Monomer | |
| 93 | Hexyl acetat | C142927 | C8H16O2 | 144.2 | 1282.7 | 593.932 | 1.9018 | Dimer | |
| 94 | pentyl acetate | C628637 | C7H14O2 | 130.2 | 1182.1 | 453.79 | 1.3124 | Monomer | |
| 95 | pentyl acetate | C628637 | C7H14O2 | 130.2 | 1182.6 | 454.418 | 1.7653 | Dimer | |
| 96 | butyl acetate | C123864 | C6H12O2 | 116.2 | 1086.3 | 356.11 | 1.2392 | Monomer | |
| 97 | butyl acetate | C123864 | C6H12O2 | 116.2 | 1084.8 | 354.932 | 1.6202 | Dimer | |
| 98 | methyl acetate | C79209 | C3H6O2 | 74.1 | 856.3 | 232.13 | 1.1917 | ||
| 99 | 2-pentylfuran | C3777693 | C9H14O | 138.2 | 1238.9 | 528.084 | 1.2546 |
| Compound | T | ROAV | |||||||
|---|---|---|---|---|---|---|---|---|---|
| MLQ1 | MYQ1 | MSQ1 | MZQ1 | MLQ5 | MYQ5 | MSQ5 | MZQ5 | ||
| “1_Hexanol-D” | 0.0056 | 6.05 | 1.74 | 1.15 | 4.60 | 2.31 | 1.84 | 1.45 | 2.55 |
| “2_Methylbutanol-M” | 0.0159 | 1.64 | 2.24 | 2.06 | 1.51 | 1.77 | 1.94 | 1.74 | 1.69 |
| “2_Methylbutanol-D” | 0.0159 | 1.20 | 1.33 | 1.11 | 1.02 | 0.79 | 0.86 | 0.61 | 0.69 |
| “_E_E__2_4_heptadienal-M” | 0.0154 | 7.26 | 7.20 | 7.07 | 7.48 | 6.78 | 5.62 | 5.46 | 5.95 |
| “_E_E__2_4_heptadienal-D” | 0.0154 | 10.10 | 7.97 | 10.02 | 9.72 | 7.22 | 6.70 | 5.72 | 5.95 |
| “_E__2_octenal-M” | 0.0002 | 110.25 | 140.62 | 103.08 | 153.23 | - | - | - | - |
| “_E__2_octenal-D” | 0.0002 | 22.22 | 37.73 | 28.06 | 32.79 | - | - | - | - |
| “_E__2_hexenal-D” | 0.0885 | 1.00 | 1.44 | 1.28 | 1.18 | 1.17 | 0.37 | 0.67 | 1.35 |
| “heptanal-M” | 0.005 | 3.46 | 2.78 | 1.81 | 3.93 | - | - | - | - |
| “heptanal-D” | 0.005 | 1.16 | 1.60 | 0.92 | 1.80 | - | - | - | - |
| “Hexanal-M” | 0.005 | 11.30 | 7.36 | 3.60 | 11.43 | - | - | - | - |
| “Hexanal-D” | 0.005 | 43.47 | 28.45 | 17.39 | 46.86 | - | - | - | - |
| “pentanal” | 0.012 | 20.30 | 19.29 | 12.35 | 20.14 | - | - | - | - |
| “3_Methylbutanal” | 0.0004 | 303.30 | 294.88 | 227.69 | 301.52 | 39.88 | 36.82 | 47.16 | 8.46 |
| “Propanal-M” | 0.0151 | 6.37 | 8.65 | 9.15 | 5.70 | 9.74 | 4.71 | 5.55 | 7.29 |
| “propanal-D” | 0.0151 | 21.26 | 18.99 | 17.89 | 22.03 | 14.18 | 14.22 | 13.57 | 13.29 |
| “2_Methyl propanal” | 0.0015 | 111.27 | 139.20 | 140.15 | 111.08 | 139.26 | 109.46 | 115.34 | 132.45 |
| “Butanal” | 0.002 | 24.91 | 31.89 | 70.40 | 5.21 | 69.98 | 88.22 | 91.91 | 40.68 |
| “3_hydroxybutan_2_one _acetoin_M” | 0.014 | 3.22 | 1.35 | 2.48 | 1.09 | 1.96 | 1.04 | 1.38 | 1.82 |
| “3_hydroxybutan_2_one _acetoin_D” | 0.014 | 1.97 | 0.71 | 5.84 | 0.53 | 5.42 | 5.17 | 5.38 | 4.15 |
| “6_methylhept_5_en_2_one” | 0.068 | 3.05 | 3.01 | 2.23 | 3.06 | 1.95 | 2.01 | 1.71 | 1.85 |
| “1_Penten_3_one-M” | 0.023 | 1.81 | 1.27 | 0.63 | 1.83 | - | - | - | - |
| “1_Penten_3_one-D” | 0.023 | 13.03 | 9.52 | 12.95 | 14.36 | 1.97 | 9.79 | 9.85 | 2.78 |
| “3_pentanone” | 0.06 | 5.34 | 4.96 | 5.36 | 5.17 | 4.24 | 5.26 | 4.98 | 4.15 |
| “2_3_butanedione” | 0.01 | 7.16 | 3.70 | 4.64 | 6.56 | - | - | - | - |
| “2_ethyl_3_5_dimethylpyrazine” | 0.00004 | 441.94 | 277.99 | 373.56 | 254.29 | 398.14 | 441.34 | 382.28 | 283.28 |
| “rose oxide” | 0.0001 | 299.27 | 308.26 | 179.40 | 257.39 | 158.34 | 114.56 | 93.98 | 170.99 |
| “Ethyl acetate” | 0.005 | 67.30 | 65.94 | 67.55 | 47.50 | 66.07 | 57.72 | 53.98 | 31.63 |
| “Ethyl butanoate” | 0.0009 | 13.99 | 265.60 | 304.47 | 3.81 | 112.85 | 270.51 | 216.93 | 109.99 |
| “Isoamyl acetate” | 0.00015 | 7.45 | 99.07 | 581.83 | 10.18 | 525.90 | 684.66 | 535.55 | 38.50 |
| “isobutyl acetate” | 0.073 | 0.02 | 0.16 | 1.28 | 0.02 | 0.38 | 1.54 | 1.31 | 0.32 |
| “ethyl propanoate” | 0.01 | 0.18 | 2.72 | 5.92 | 0.15 | 13.54 | 18.75 | 16.29 | 18.06 |
| “Hexyl acetate-D” | 0.115 | 0.02 | 0.04 | 0.13 | 0.02 | 0.05 | 0.14 | 0.18 | 1.81 |
| “Ethyl isobutyrate” | 0.0009 | 1.50 | 2.43 | 10.77 | 1.48 | 2.72 | 122.84 | 133.21 | 3.35 |
| “2_pentylfuran” | 0.0058 | 3.14 | 3.61 | 4.15 | 3.67 | - | - | - | - |
Disclaimer/Publisher’s Note: The statements, opinions and data contained in all publications are solely those of the individual author(s) and contributor(s) and not of MDPI and/or the editor(s). MDPI and/or the editor(s) disclaim responsibility for any injury to people or property resulting from any ideas, methods, instructions or products referred to in the content. |
© 2023 by the authors. Licensee MDPI, Basel, Switzerland. This article is an open access article distributed under the terms and conditions of the Creative Commons Attribution (CC BY) license (https://creativecommons.org/licenses/by/4.0/).
Share and Cite
Liu, N.; Li, X.; Hu, Y.; Qin, L.; Bao, A.; Qin, W.; Miao, S. Effects of Lentilactobacillus buchneri and Kazachstania bulderi on the Quality and Flavor of Guizhou Fermented Red Sour Soup. Foods 2023, 12, 3753. https://doi.org/10.3390/foods12203753
Liu N, Li X, Hu Y, Qin L, Bao A, Qin W, Miao S. Effects of Lentilactobacillus buchneri and Kazachstania bulderi on the Quality and Flavor of Guizhou Fermented Red Sour Soup. Foods. 2023; 12(20):3753. https://doi.org/10.3390/foods12203753
Chicago/Turabian StyleLiu, Na, Xiuli Li, Yue Hu, Likang Qin, Aiming Bao, Weijun Qin, and Song Miao. 2023. "Effects of Lentilactobacillus buchneri and Kazachstania bulderi on the Quality and Flavor of Guizhou Fermented Red Sour Soup" Foods 12, no. 20: 3753. https://doi.org/10.3390/foods12203753
APA StyleLiu, N., Li, X., Hu, Y., Qin, L., Bao, A., Qin, W., & Miao, S. (2023). Effects of Lentilactobacillus buchneri and Kazachstania bulderi on the Quality and Flavor of Guizhou Fermented Red Sour Soup. Foods, 12(20), 3753. https://doi.org/10.3390/foods12203753