
Fabrication and Characterization of Complex Coacervation: The Integration of Sesame Protein Isolate-Polysaccharides
 , ,
, ,
Abstract
:1. Introduction
2. Materials and Methods
2.1. Materials
2.2. Preparation of Sesame Protein Isolate (SPI)
2.3. Solubility of SPI
2.4. Turbidimetric Titration
2.5. ζ-Potential Analysis
2.6. Coacervate Yield of Concentrated Mixtures
2.7. Characterization of the Complex Coacervation Particles
2.8. Preparation of Pickering Emulsions Stabilized by Protein–Polysaccharide Complexes
2.9. Statistical Analysis
3. Results
3.1. Solubility of SPI as a Function of pH
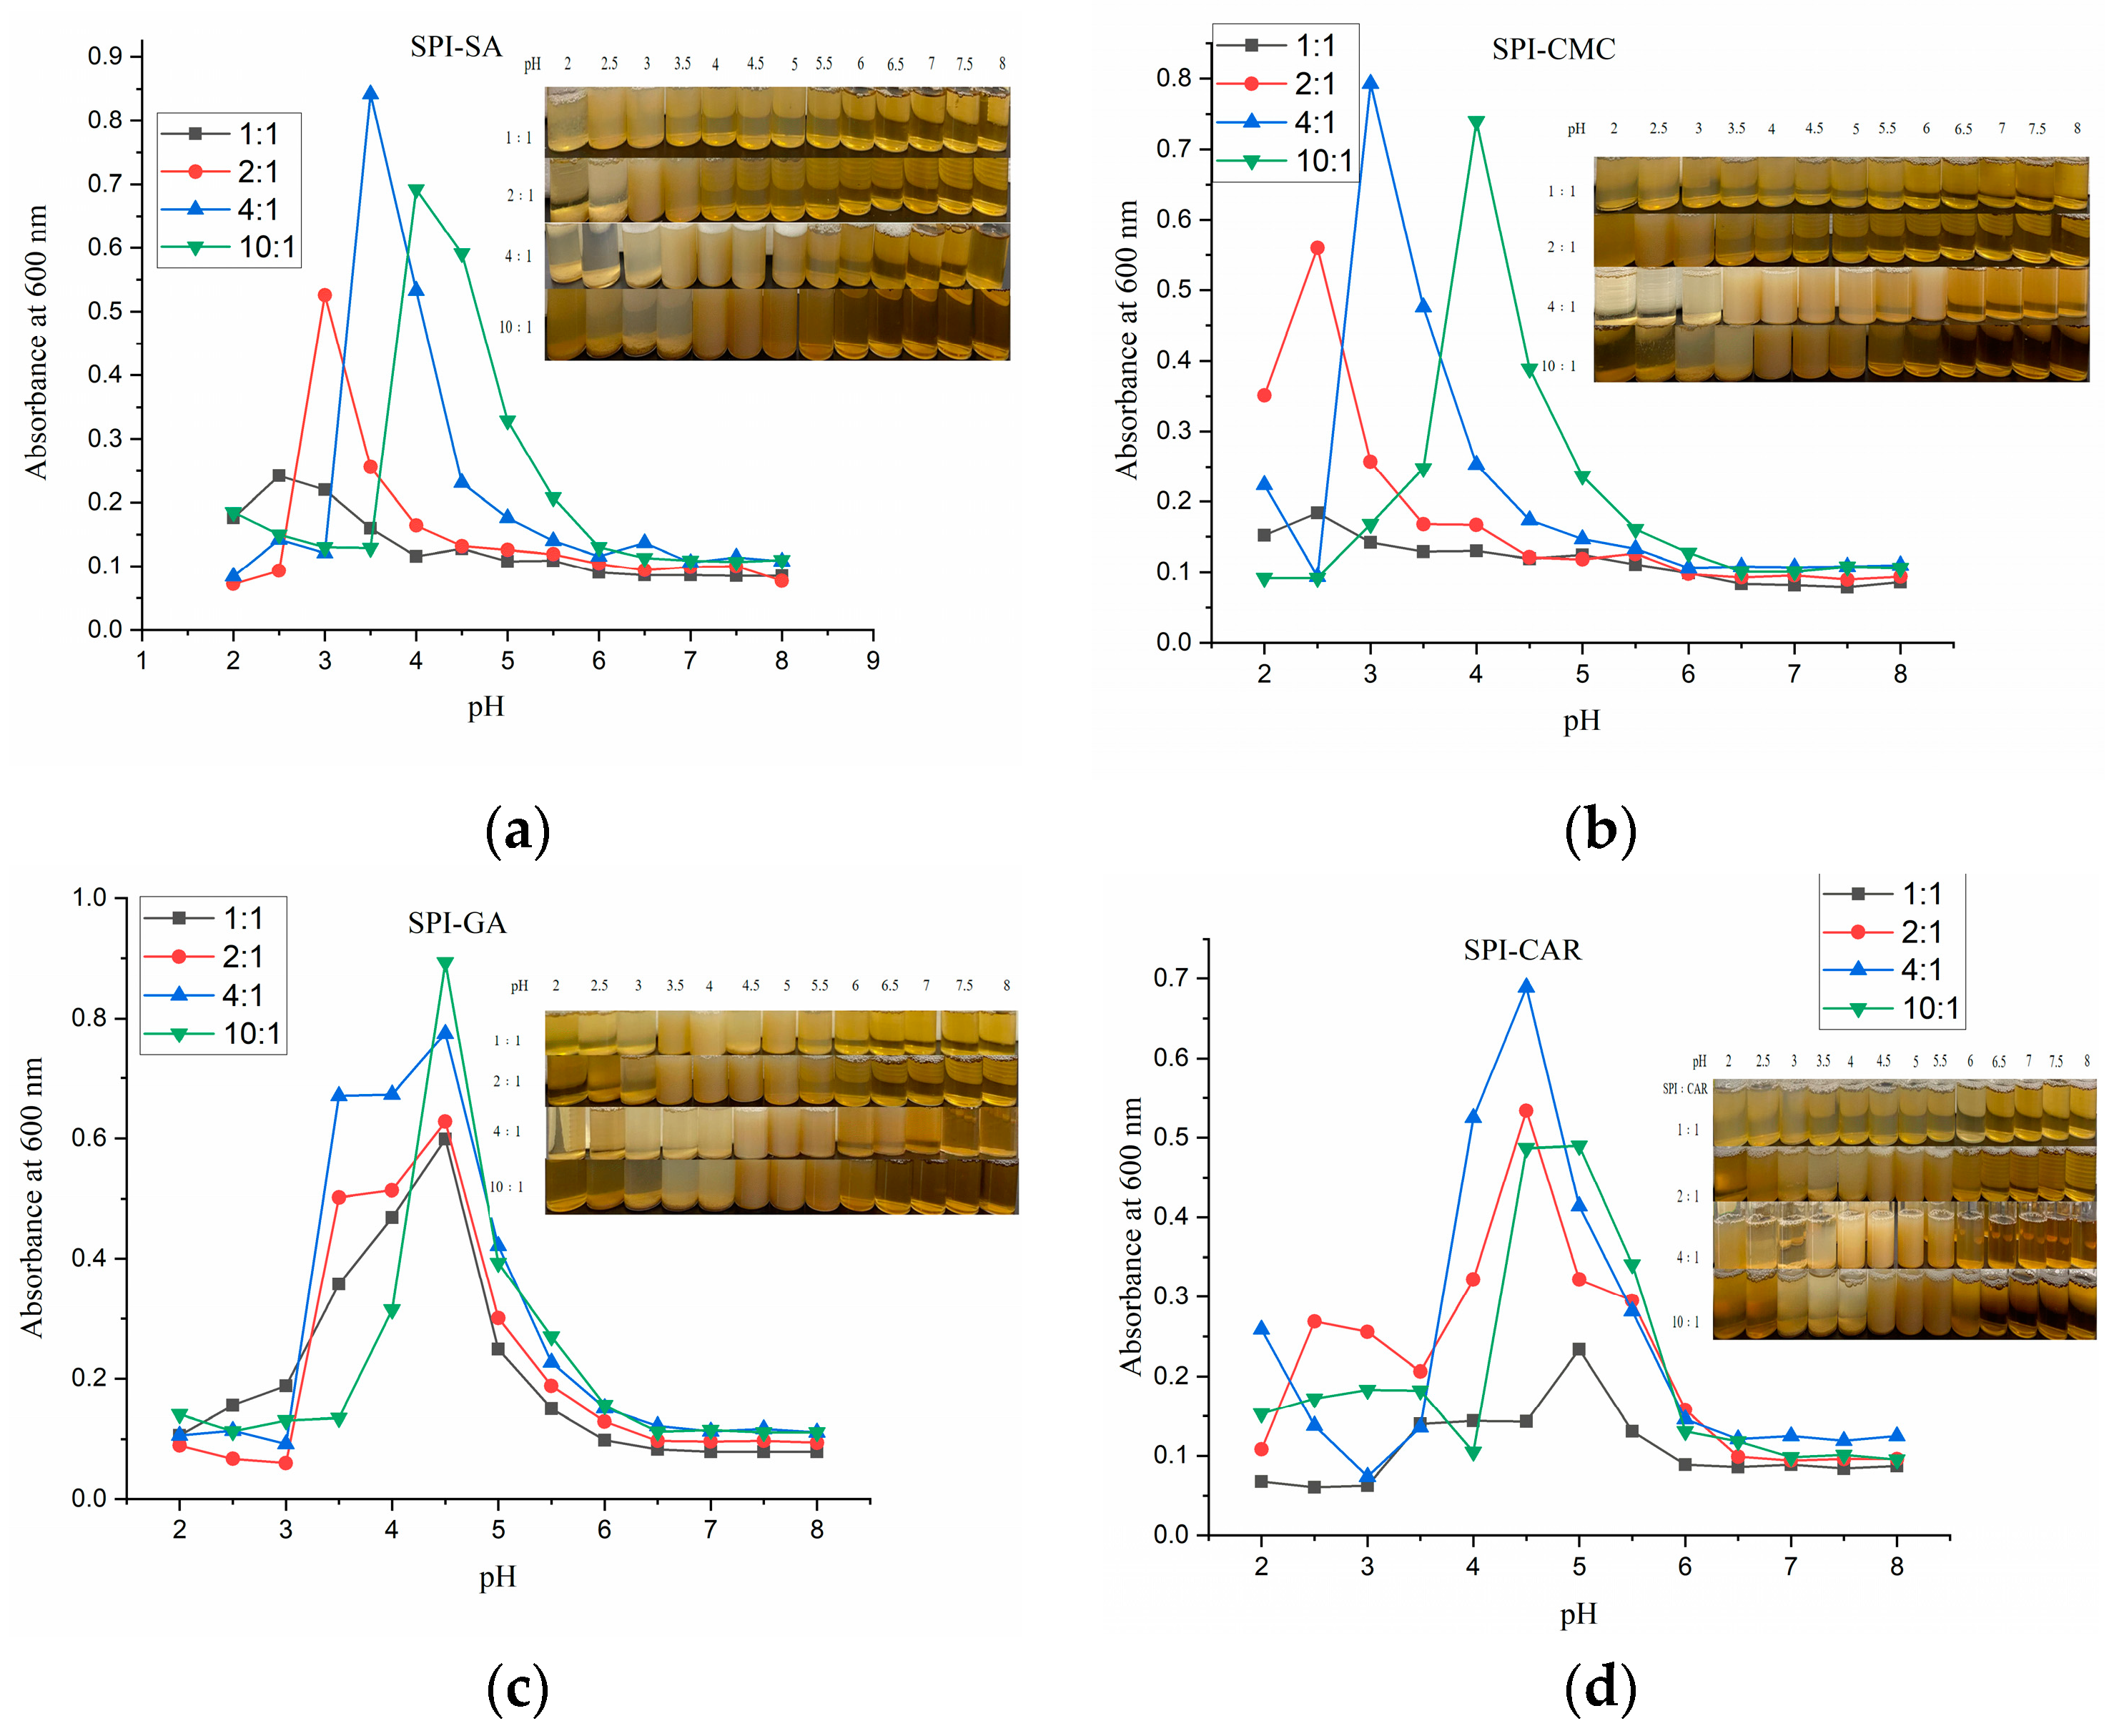
3.2. Turbidimetry of the Protein–Polysaccharide Complex Coacervate
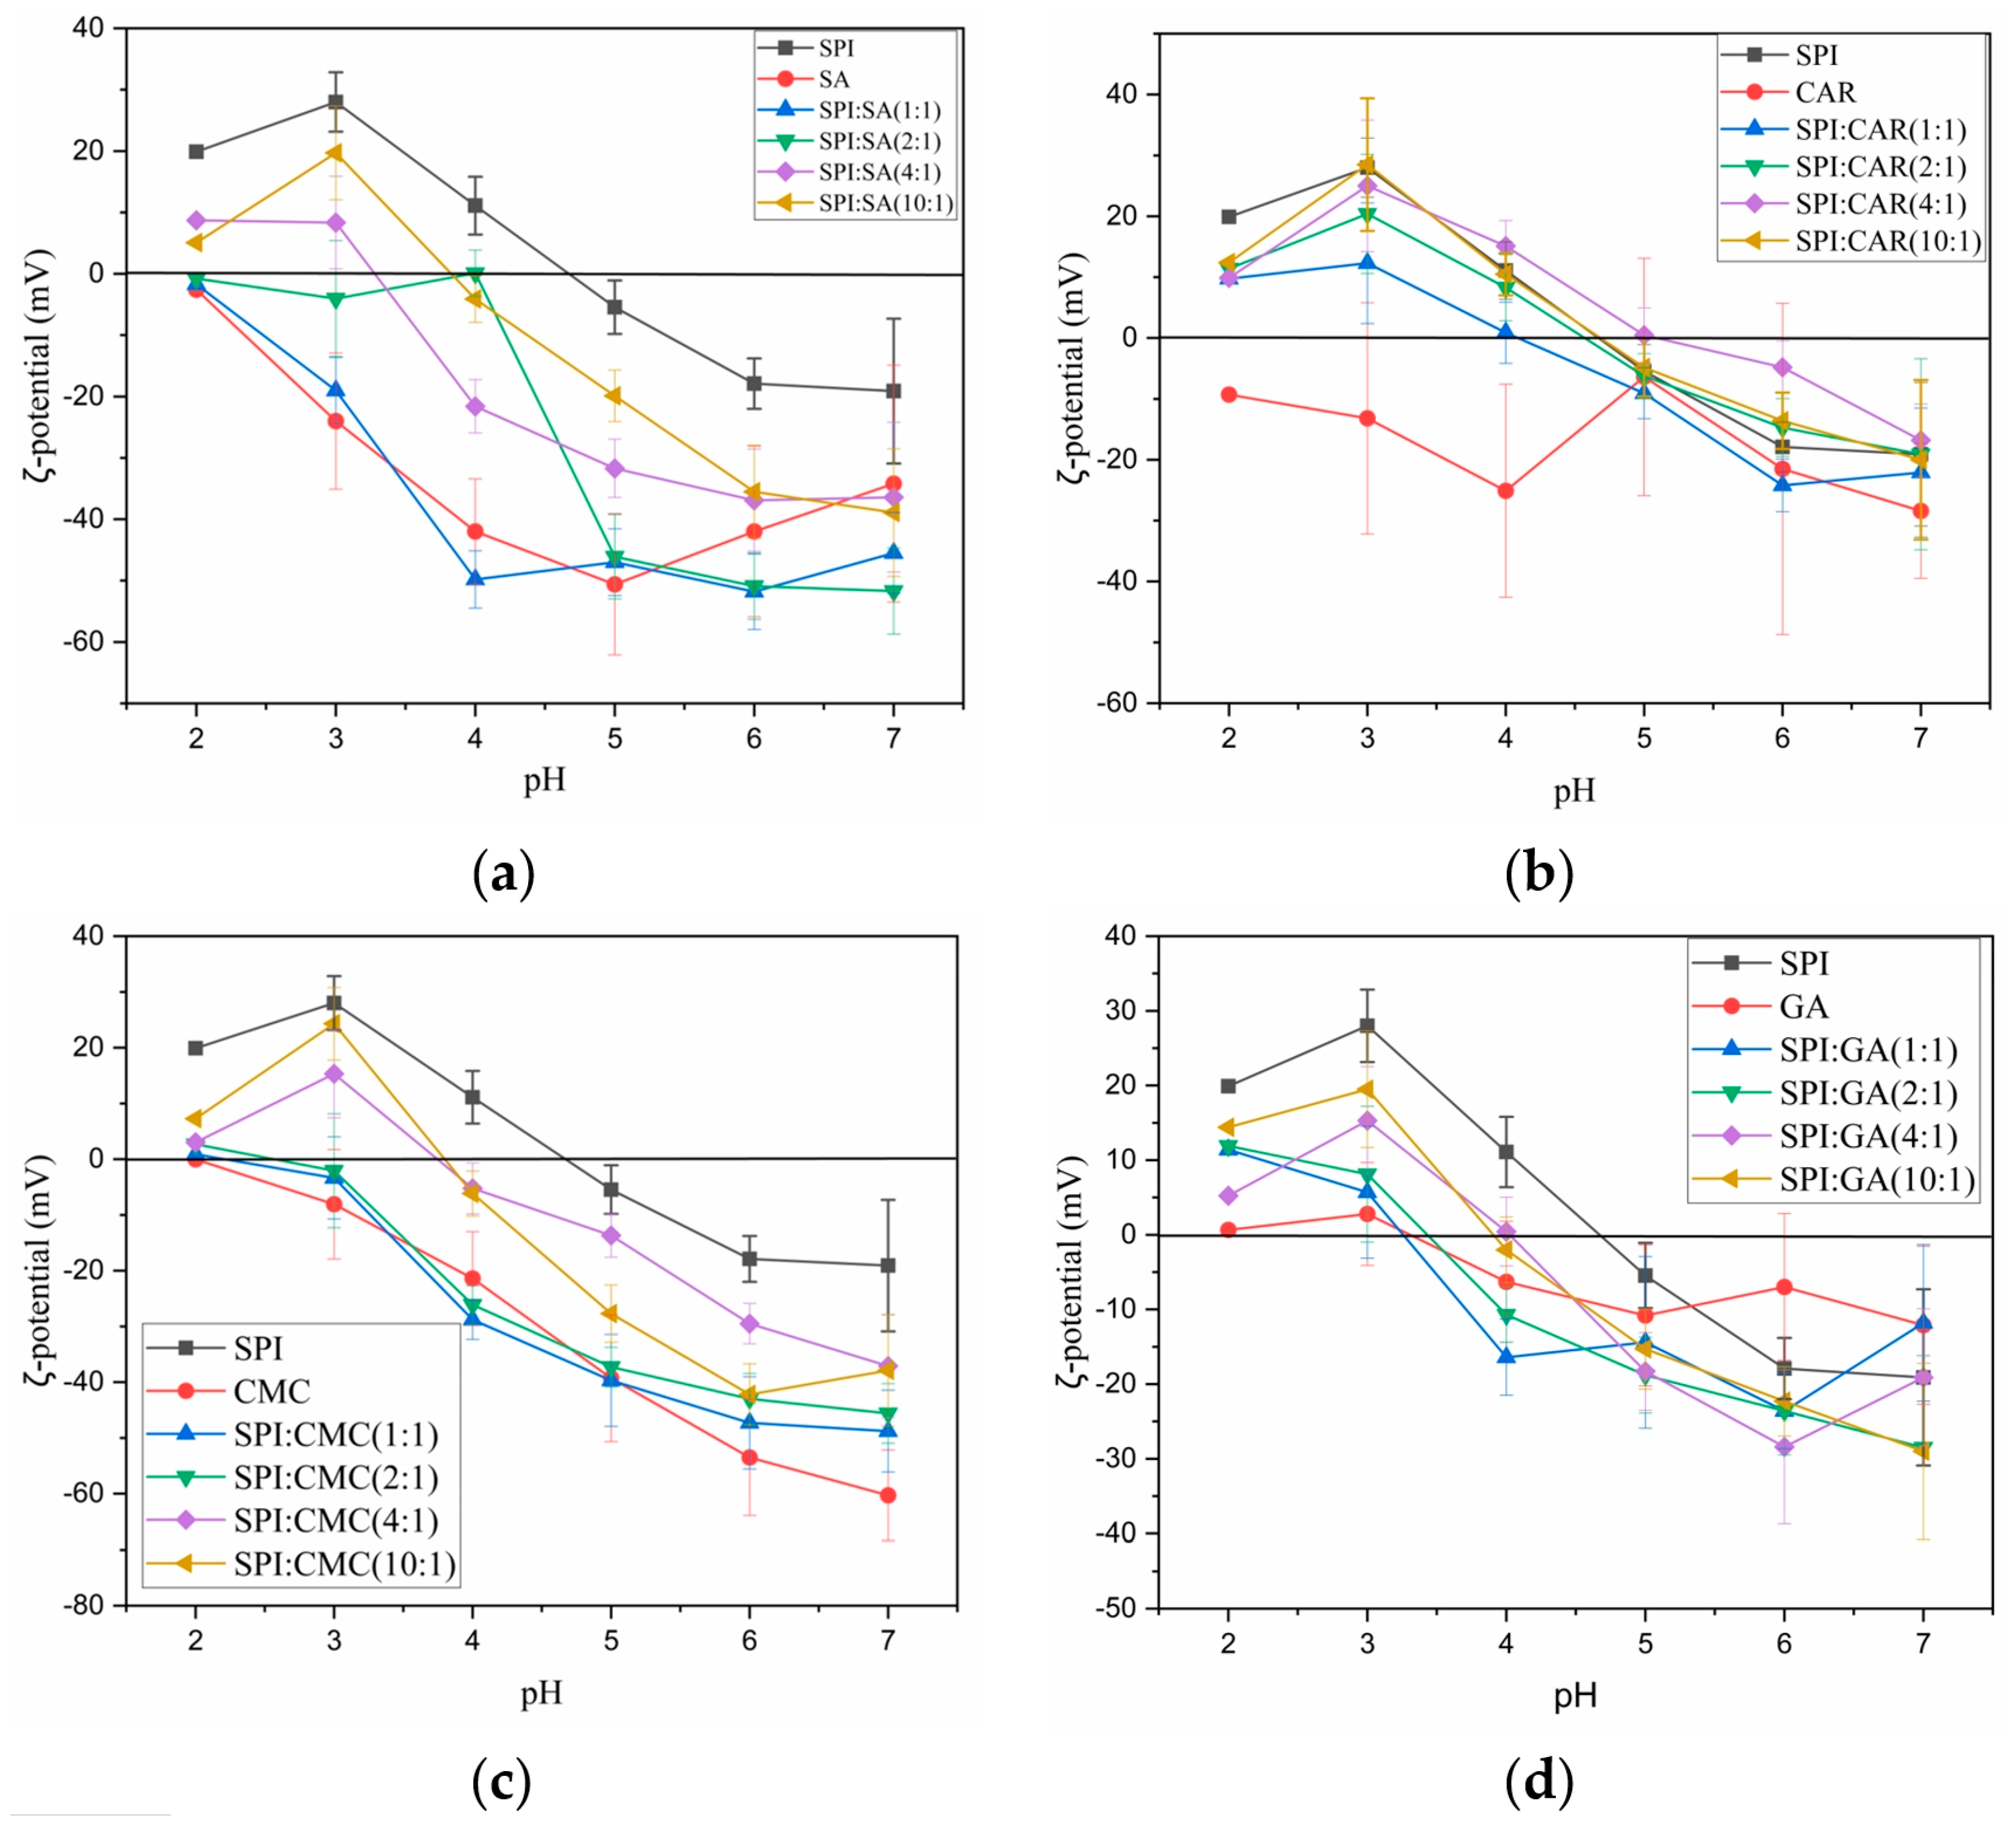
3.3. ζ-Potential of SPI, Polysaccharides, and Their Complex Coacervates
3.4. Coacervate Yield and Mean Particle Size at pHopt of Complexes
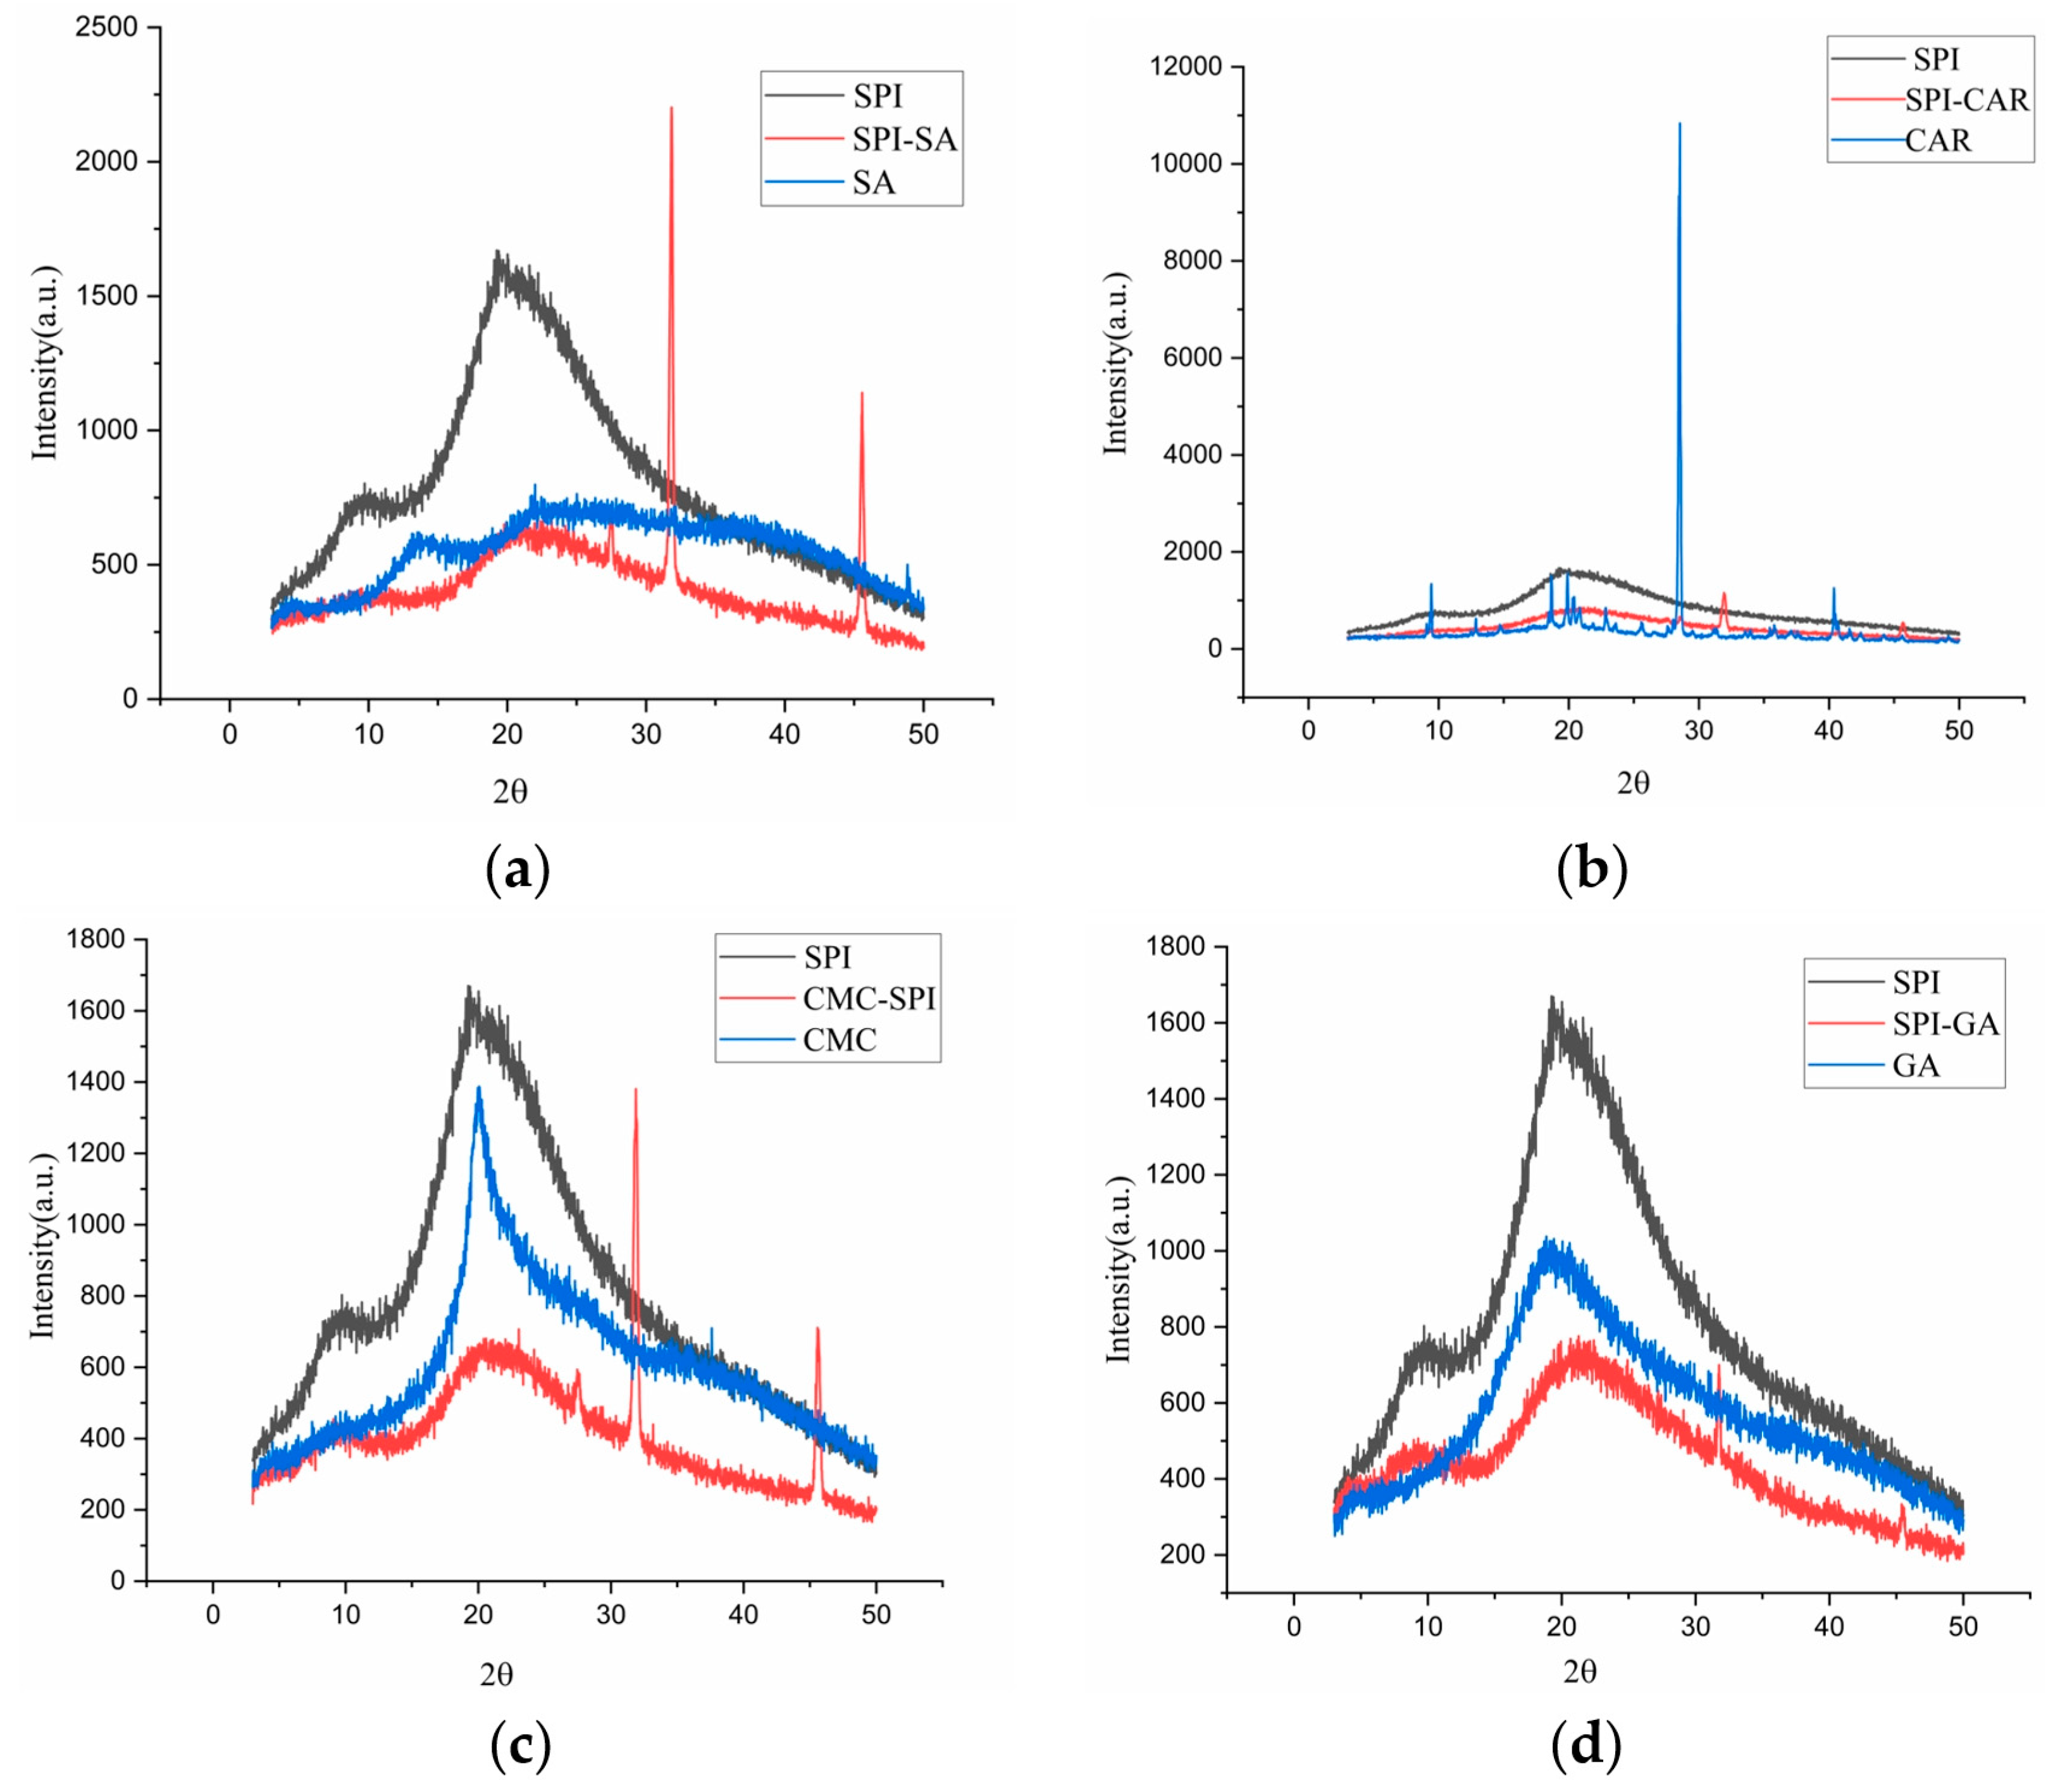
3.5. XRD Analysis
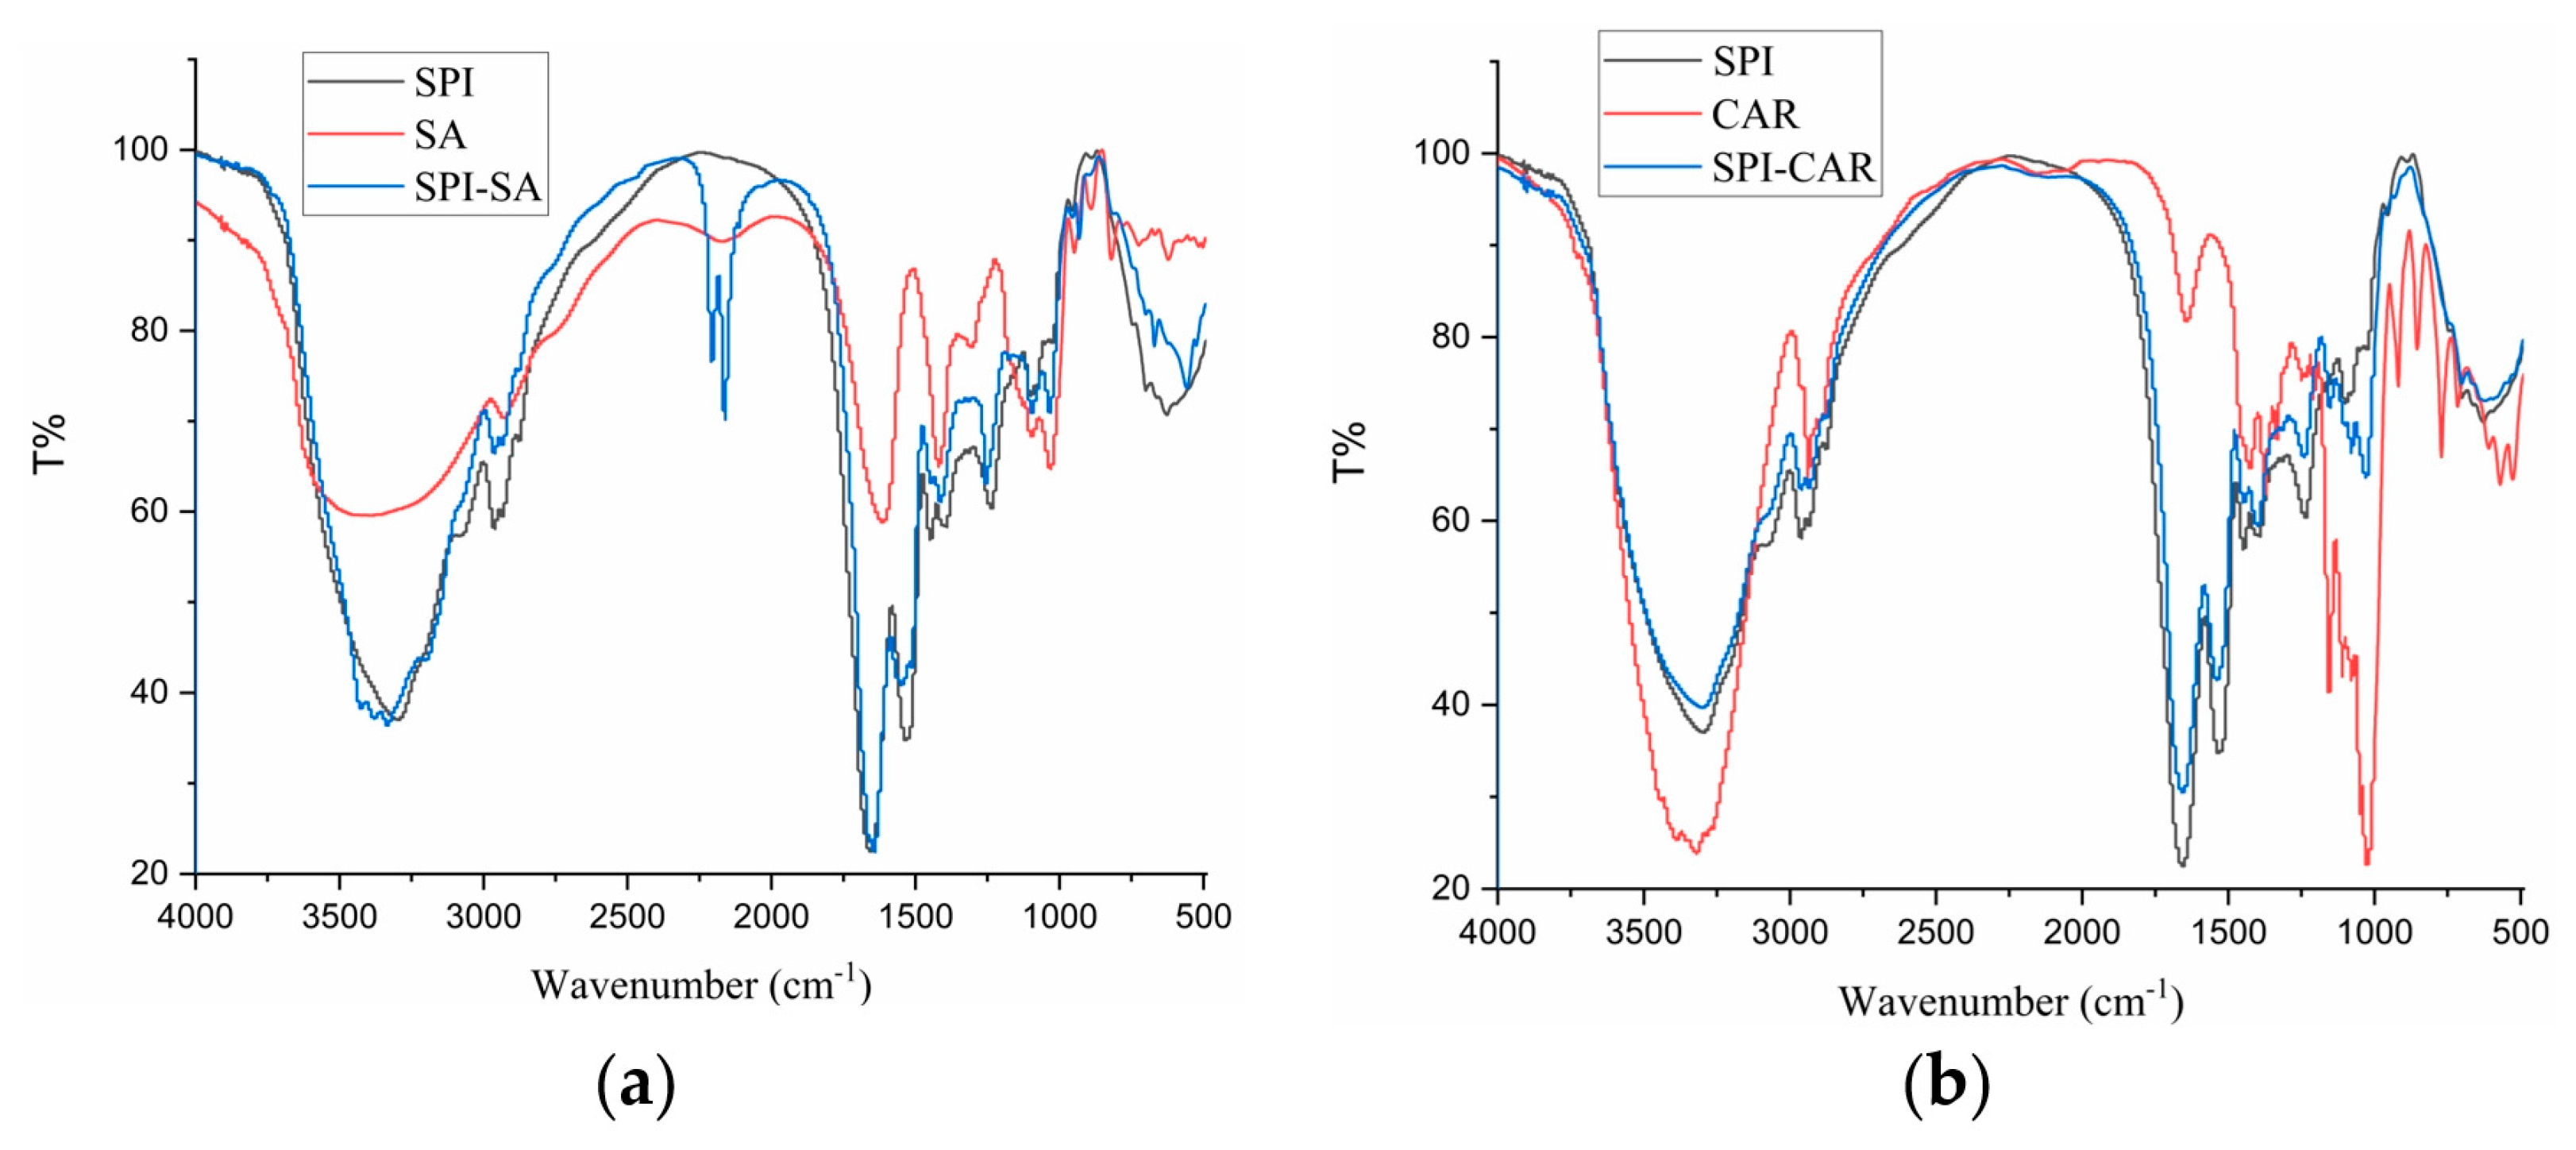
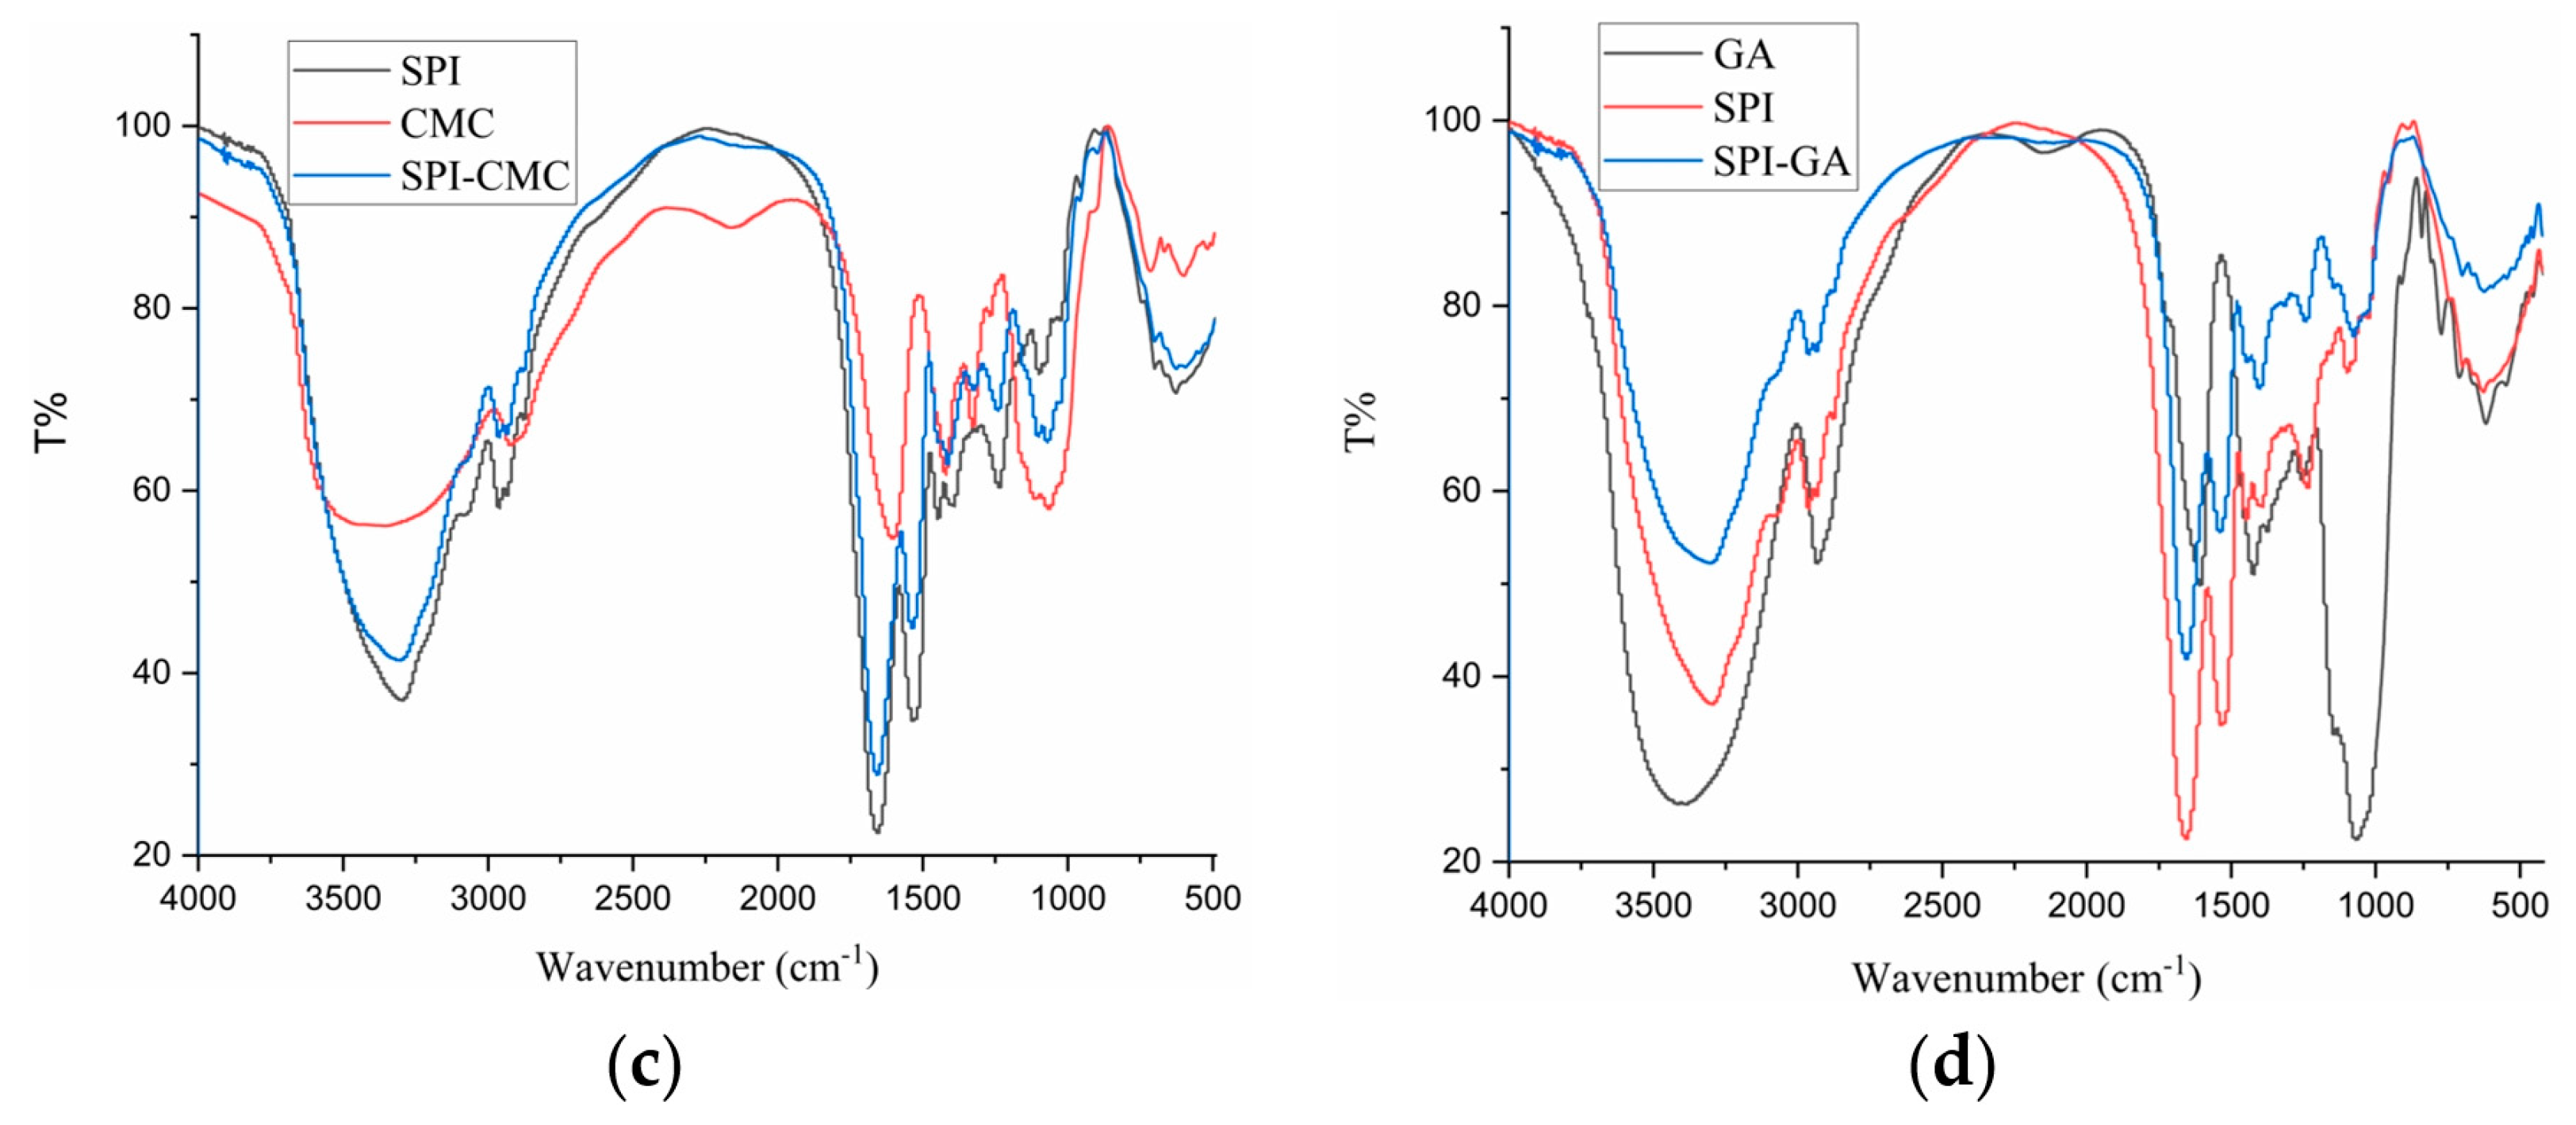
3.6. FTIR Analysis
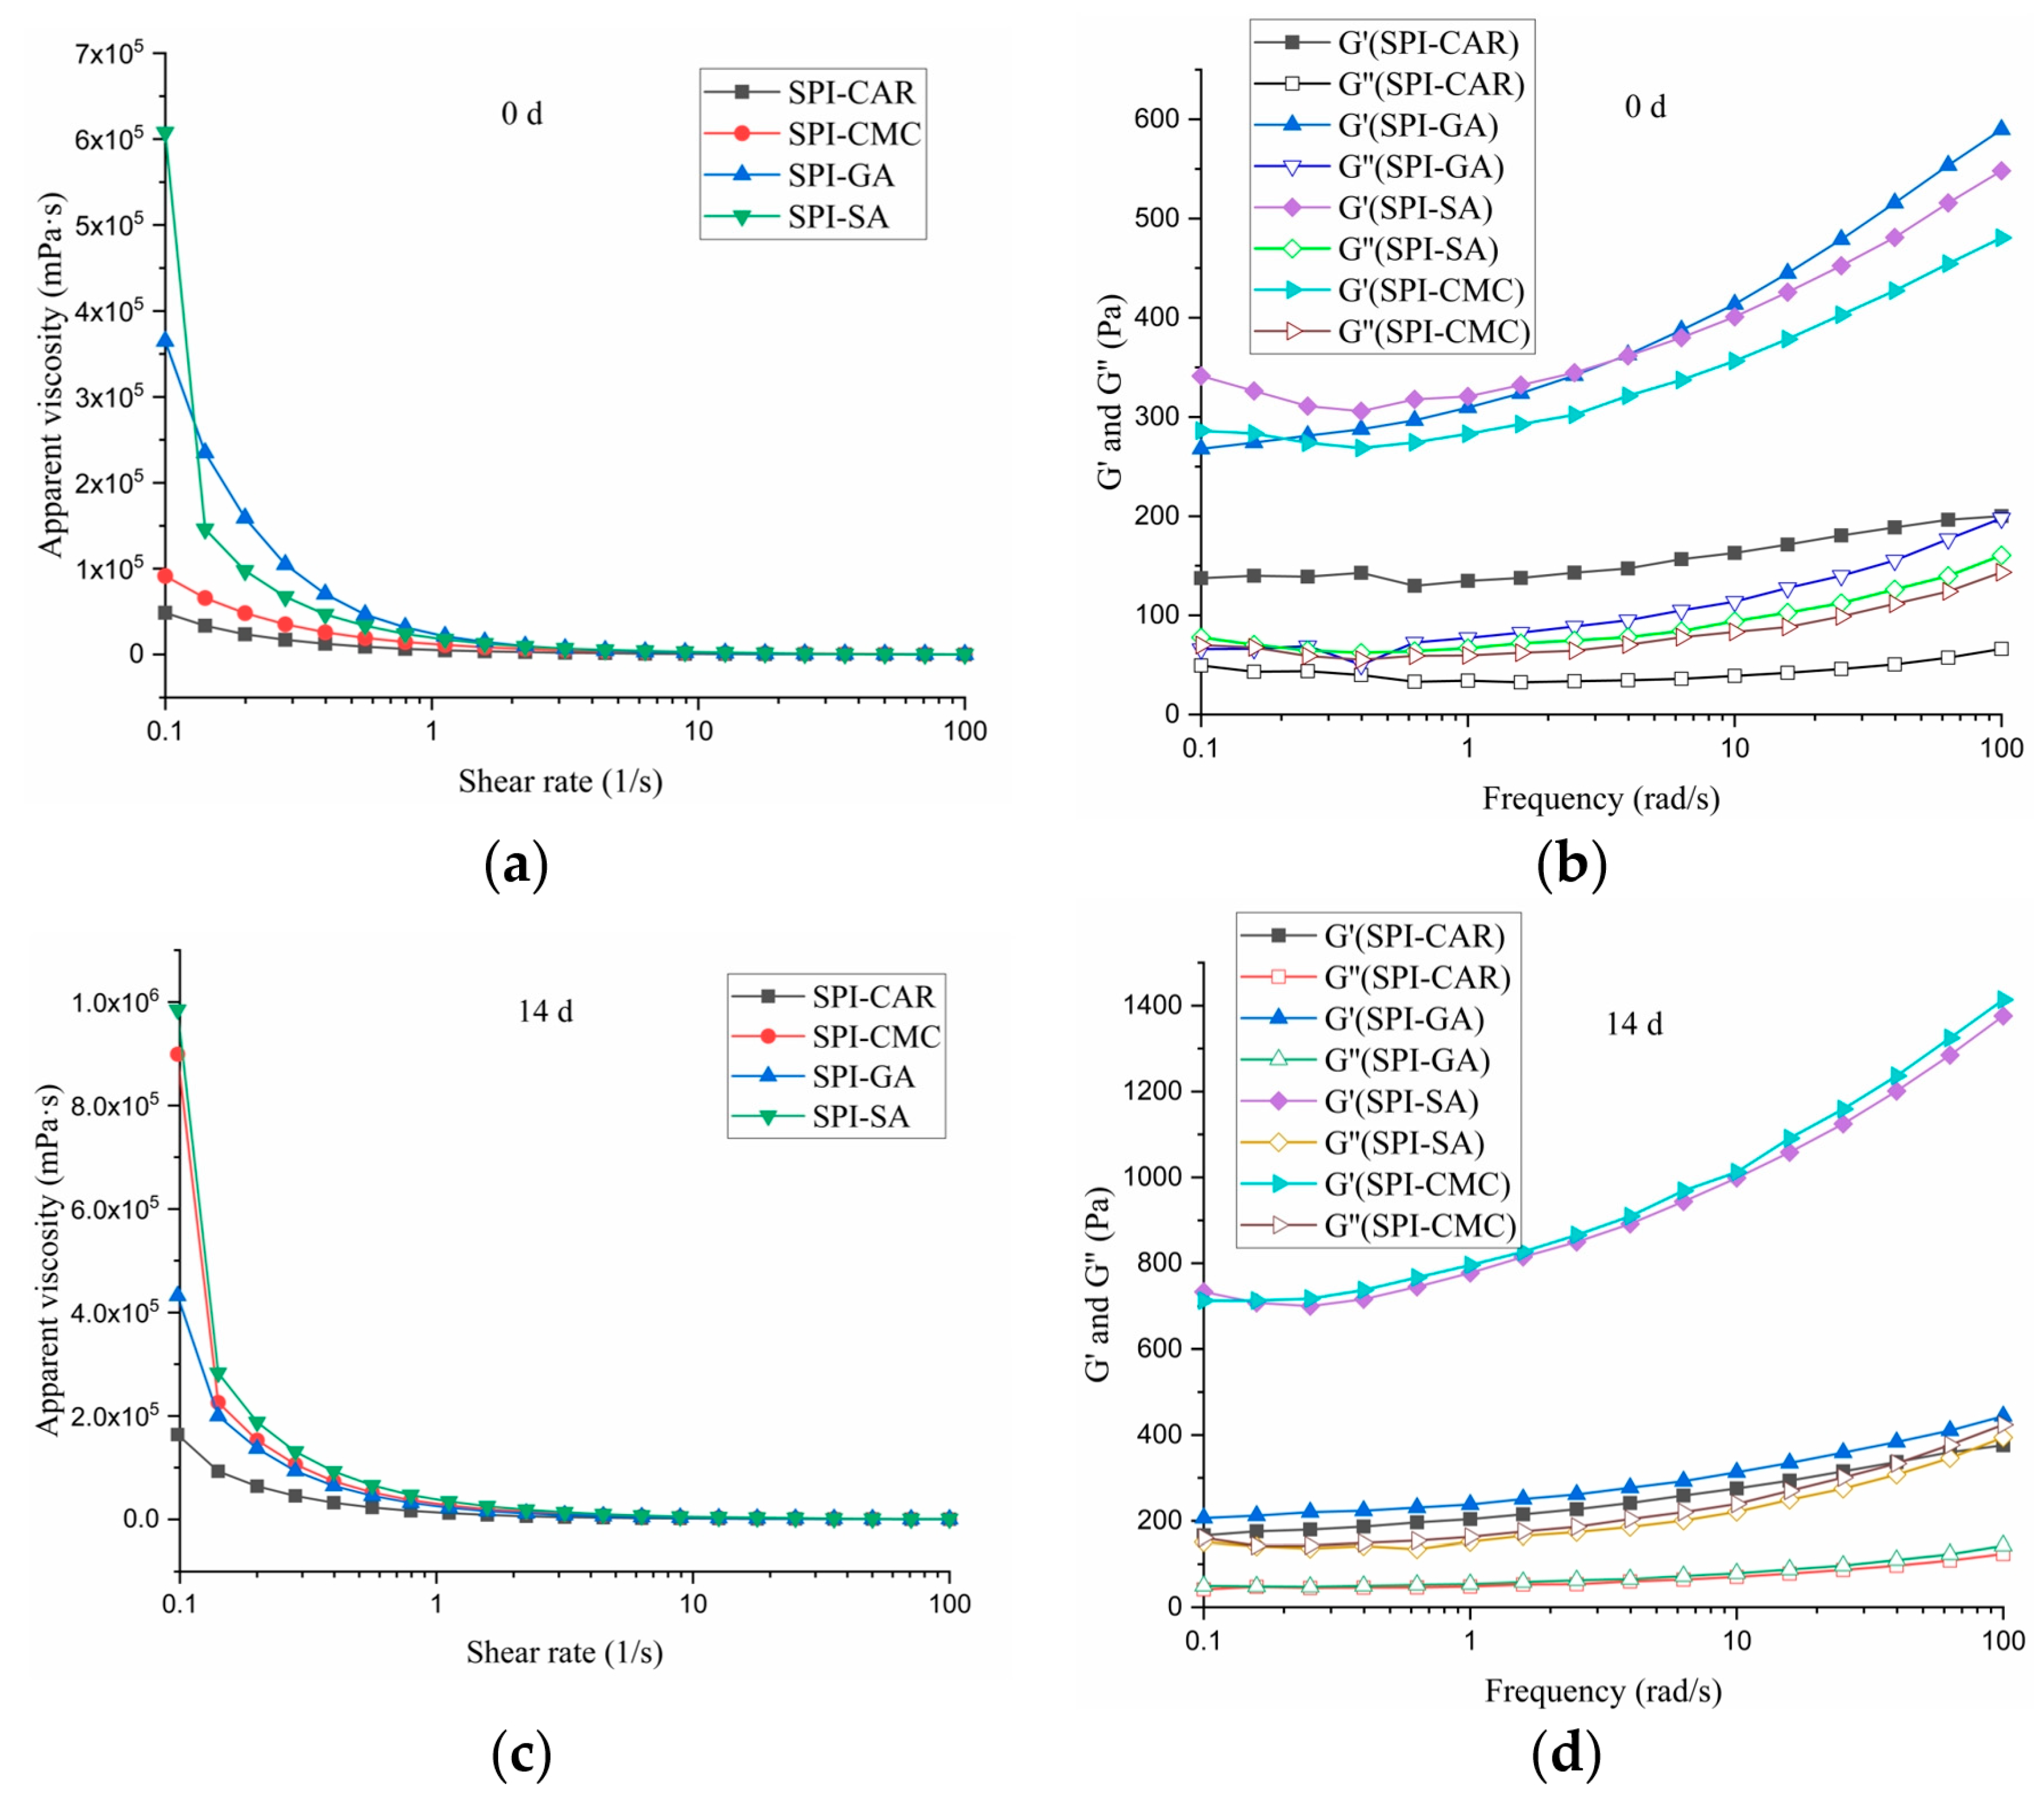
3.7. Rheological Property
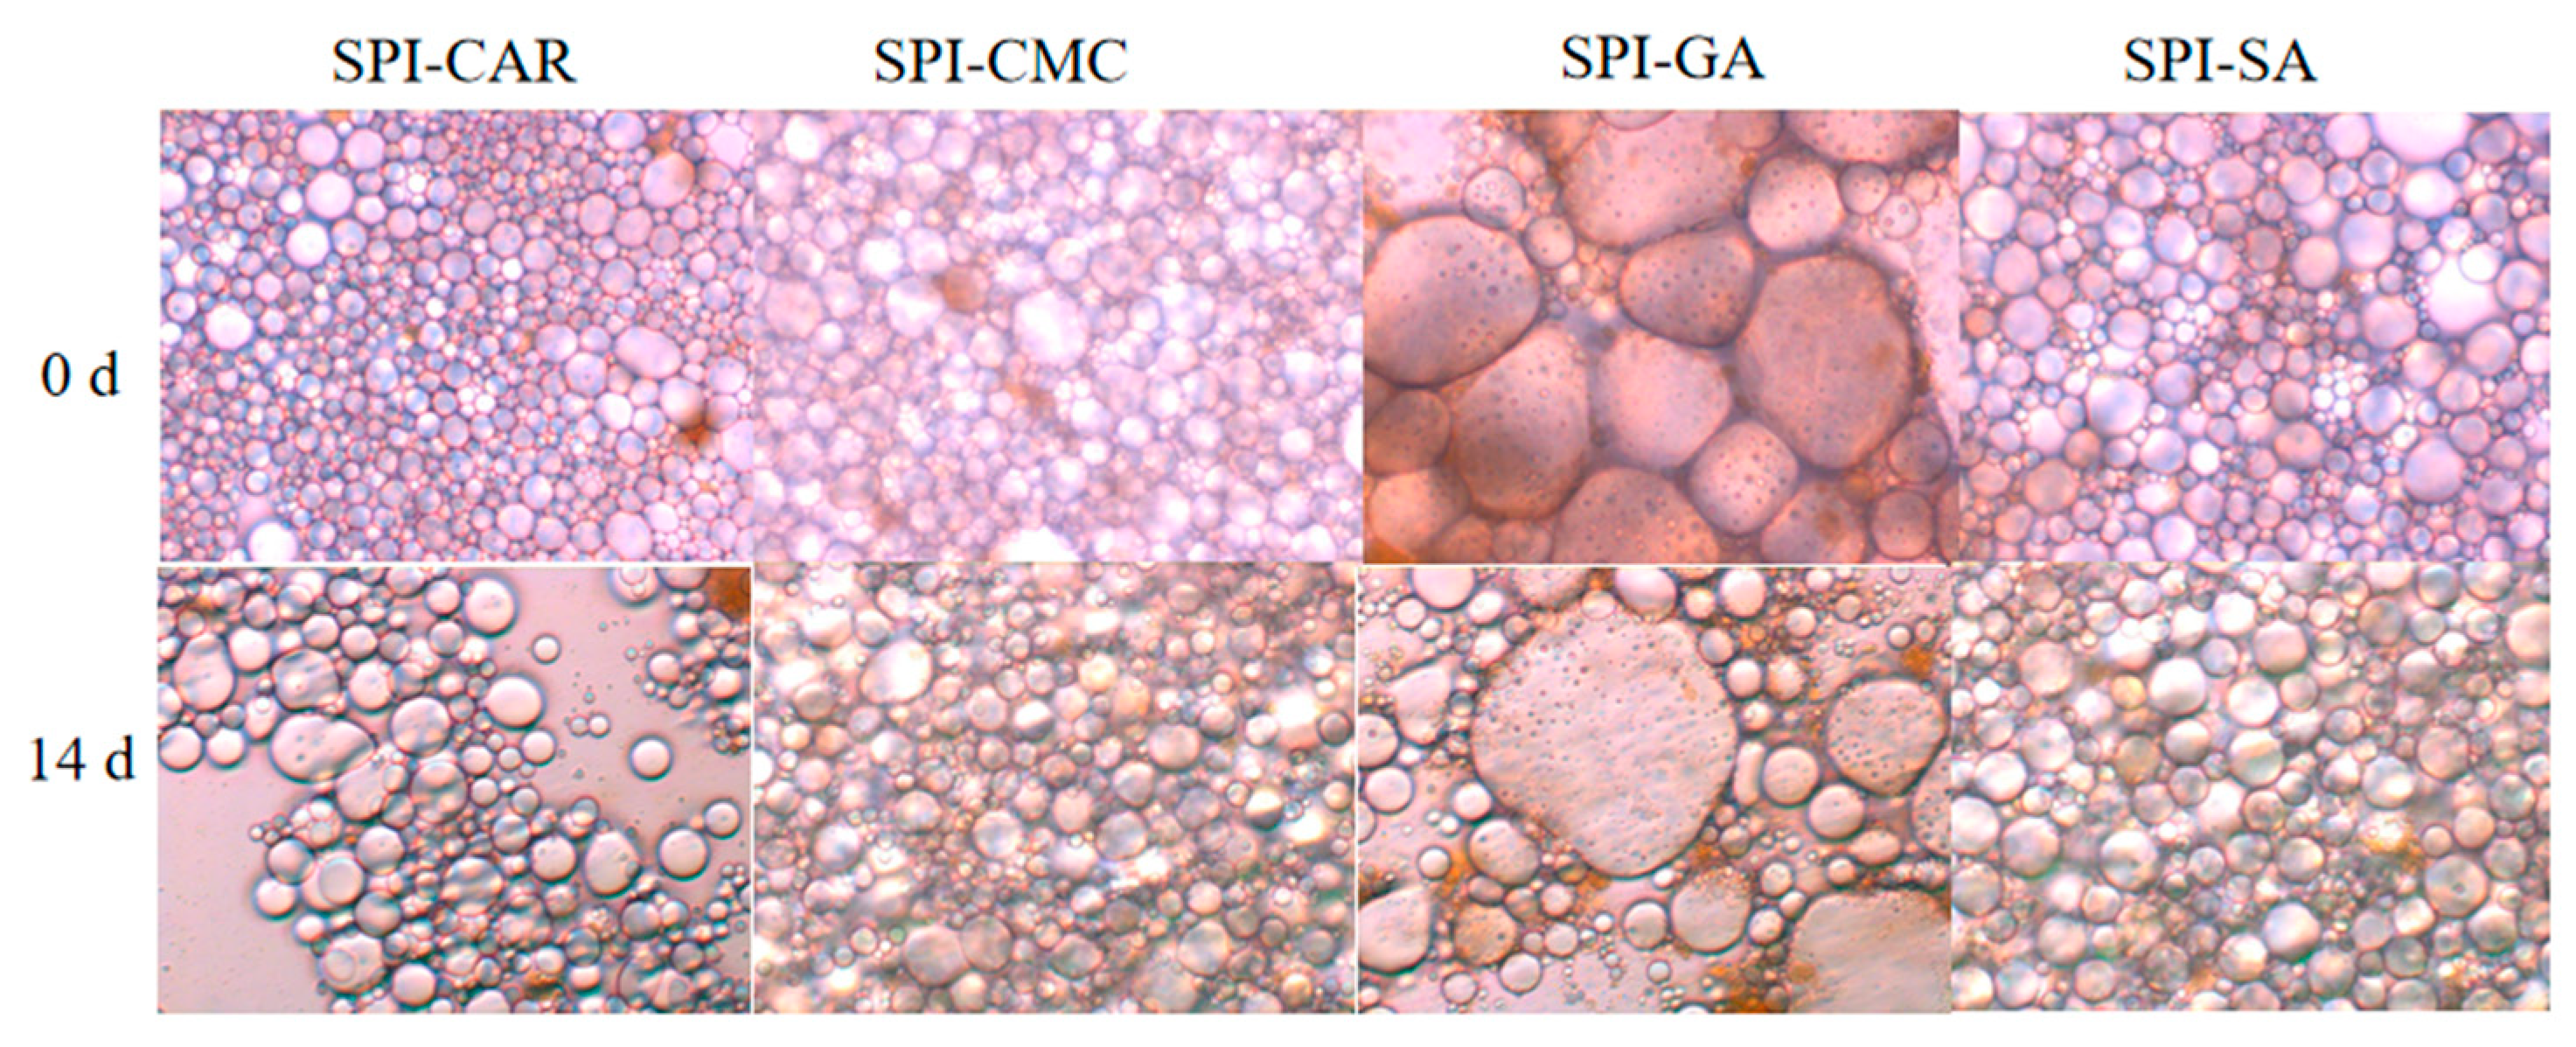
3.8. Morphological Observation by TEM and SEM
4. Conclusions
Author Contributions
Funding
Institutional Review Board Statement
Informed Consent Statement
Data Availability Statement
Conflicts of Interest
References
- Olatunde, O.O.; Owolabi, I.O.; Fadairo, O.S.; Ghosal, A.; Coker, O.J.; Soladoye, O.P.; Aluko, R.E.; Bandara, N. Enzymatic Modification of Plant Proteins for Improved Functional and Bioactive Properties. Food Bioprocess Technol. 2022, 16, 1216–1234. [Google Scholar]
- Wang, D.; Zheng, X.; Fan, Q.; Wang, P.; Zeng, H.; Zhang, Y.; Zheng, B.; Lin, S. The effect of dynamic high-pressure microfluidization on the physicochemical and digestive properties of proteins in insoluble fraction of edible bird’s nest. Food Front. 2022, 3, 339–346. [Google Scholar] [CrossRef]
- Idowu, A.O.; Alashi, A.M.; Nwachukwu, I.D.; Fagbemi, T.N.; Aluko, R.E. Functional properties of sesame (Sesamum indicum L.) seed protein fractions. Food Prod. Process. Nutr. 2021, 3, 4. [Google Scholar] [CrossRef]
- Morris, J.B.; Wang, M.L.; Tonnis, B.D. Variability for oil, protein, lignan, tocopherol, and fatty acid concentrations in eight sesame (Sesamum indicum L.) genotypes. Ind. Crops Prod. 2021, 164, 113355. [Google Scholar] [CrossRef]
- Yang, K.; Xu, T.R.; Fu, Y.H.; Cai, M.; Xia, Q.L.; Guan, R.F.; Zou, X.G.; Sun, P.L. Effects of ultrasonic pre-treatment on physicochemical properties of proteins extracted from cold-pressed sesame cake. Food Res. Int. 2021, 139, 109907. [Google Scholar]
- Stounbjerg, L.; Vestergaard, C.; Andreasen, B.; Ipsen, R. Associative phase separation of potato protein and anionic polysaccharides. Colloids Surf. A Physicochem. Eng. Asp. 2019, 566, 104–112. [Google Scholar] [CrossRef]
- Carpentier, J.; Conforto, E.; Chaigneau, C.; Vendeville, J.E.; Maugard, T. Complex coacervation of pea protein isolate and tragacanth gum: Comparative study with commercial polysaccharides. Innov. Food Sci. Emerg. Technol. 2021, 69, 102641. [Google Scholar] [CrossRef]
- Xiao, J. Recent advances on the stability of dietary polyphenols. eFood 2022, 3, e21. [Google Scholar] [CrossRef]
- Shanmugam, H.; Rengarajan, C.; Nataraj, S.; Sharma, A. Interactions of plant food bioactives-loaded nano delivery systems at the nano-bio interface and its pharmacokinetics: An overview. Food Front. 2022, 3, 256–275. [Google Scholar] [CrossRef]
- Ye, J.; Hua, X.; Zhang, W.; Zhao, W.; Yang, R. Emulsifying capacity of peanut polysaccharide: Improving interfacial property through the co-dissolution of protein during extraction. Carbohydr. Polym. 2021, 273, 118614. [Google Scholar] [CrossRef]
- Cai, Y.; Huang, L.; Tao, X.; Su, J.; Xiao, C.; Zhao, M.; Zhao, Q.; Van der Meeren, P. Enhanced acidic stability of O/W emulsions by synergistic interactions between okara protein and carboxymethyl cellulose. LWT Food Sci. Technol. 2021, 146, 111439. [Google Scholar] [CrossRef]
- Xu, T.; Gu, Z.; Cheng, L.; Li, C.; Li, Z. Stability, oxidizability, and topical delivery of resveratrol encapsulated in octenyl succinic anhydride starch/chitosan complex-stabilized high internal phase Pickering emulsions. Carbohydr. Polym. 2023, 305, 120566. [Google Scholar] [CrossRef]
- Dey, T.K.; Banerjee, P.; Chatterjee, R.; Dhar, P. Designing of ω-3 PUFA enriched biocompatible nanoemulsion with sesame protein isolate as a natural surfactant: Focus on enhanced shelf-life stability and biocompatibility. Colloids Surf. A 2018, 538, 36–44. [Google Scholar] [CrossRef]
- Saatchi, A.; Kiani, H.; Labbafi, M. A new functional protein-polysaccharide conjugate based on protein concentrate from sesame processing by-products: Functional and physico-chemical properties. Int. J. Biol. Macromol. 2019, 122, 659–666. [Google Scholar] [PubMed]
- Rezaei, M.; Nouri, L.; Daneshi, M.; Nafchi, A.M.; Nahidi, F. Effect of salt concentration and drying temperature on functional properties of sesame (Sesamum indicum L.) meal protein isolate. J. Food Meas. Charact. 2022, 16, 4665–4674. [Google Scholar] [CrossRef]
- Emami Bistgani, Z.; Siadat, S.A.; Bakhshandeh, A.; Ghasemi Pirbalouti, A.; Hashemi, M. Interactive effects of drought stress and chitosan application on physiological characteristics and essential oil yield of Thymus daenensis Celak. Crop J. 2017, 5, 407–415. [Google Scholar] [CrossRef]
- Liu, S.H.; Low, N.H.; Nickerson, M.T. Effect of pH, Salt, and Biopolymer Ratio on the Formation of Pea Protein Isolate—Gum Arabic Complexes. J. Agric. Food Chem. 2009, 57, 1521. [Google Scholar] [CrossRef]
- Fan, S.Y.; Fang, F.; Lei, A.L.; Zheng, J.; Zhang, F.S. Effects of Salts on Structural, Physicochemical and Rheological Properties of Low-Methoxyl Pectin/Sodium Caseinate Complex. Foods 2021, 9, 2009. [Google Scholar]
- Liu, B.J.; Lai, L.F.; Muhoza, B.; Xia, S.Q. Complex coacervates based on gelatin and sodium carboxymethyl cellulose as carriers for cinnamaldehyde: Effect of gelatin Bloom values on coacervates formation and interfacial properties. Food Biosci. 2021, 44, 101403. [Google Scholar] [CrossRef]
- Dong, Z.; Du, Z.Q.; Wu, X.Y.; Zhai, K.F.; Wei, Z.J.; Rashed, M.M.A. Fabrication and characterization of ZnO nanofilms using extracted pectin of Premna microphylla Turcz leaves and carboxymethyl cellulose. Int. J. Biol. Macromol. 2022, 209, 525–532. [Google Scholar]
- Plati, F.; Ritzoulis, C.; Pavlidou, E.; Paraskevopoulou, A. Complex coacervate formation between hemp protein isolate and gum Arabic: Formulation and characterization. Int. J. Biol. Macromol. 2021, 182, 144–153. [Google Scholar] [PubMed]
- Rousi, Z.; Malhiac, C.; Fatouros, D.G.; Paraskevopoulou, A. Complex coacervates formation between gelatin and gum Arabic with di ff erent arabinogalactan protein fraction content and their characterization. Food Hydrocoll. 2019, 96, 577–588. [Google Scholar]
- Raoufi, N.; Kadkhodaee, R.; Fang, Y.; Phillips, G.O. pH-Induced structural transitions in whey protein isolate and ultrasonically solubilized Persian gum mixture. Food Hydrocoll. 2020, 68, 105190. [Google Scholar]
- Li, H.M.; Gou, R.; Liao, J.Y.; Wang, Y.; Qu, R.; Tang, Q.; Gan, J.Y.; Zou, L.; Shi, S.J. Recent advances in nano-targeting drug delivery systems for rheumatoid arthritis treatment. Acta Materia Medica. 2023, 2, 23–41. [Google Scholar]
- Gorji, E.G.; Waheed, A.; Ludwig, R.; Toca-herrera, J.L.; Schleining, G.; Gorji, S.G. Complex Coacervation of Milk Proteins with Sodium Alginate. J. Agric. Food Chem. 2018, 66, 3210–3220. [Google Scholar] [CrossRef]
- Ghobadi, M.; Koocheki, A.; Varidi, M.J.; Varidi, M. Fabrication and characterization of Grass pea (Lathyrus sativus) protein isolate-Alyssum homolocarpum seed gum complex coacervate. Polym. Test. 2020, 89, 106636. [Google Scholar]
- Igartúa, D.E.; Cabezas, D.M.; Palazolo, G.G. Effects of pH, protein: Polysaccharide ratio, and NaCl-added concentration on whey protein isolate and soluble soybean polysaccharides electrostatic-complexes formation. Food Chem. Adv. 2022, 1, 100123. [Google Scholar]
- Chen, K.; Zhang, M.; Mujumdar, A.S.; Wang, H. Quinoa protein-gum Arabic complex coacervates as a novel carrier for eugenol: Preparation, characterization and application for minced pork preservation. Food Hydrocoll. 2021, 120, 106915. [Google Scholar]
- Wan, Y.; Lin, C.; Li, Y.; Wang, R.; Feng, W.; Chen, Z.; Wang, T.; Luo, X.; Wu, X. Tuning the electrostatic interaction between rice protein and carboxymethyl cellulose toward hydrophilic composites with enhanced functional properties. Int. J. Biol. Macromol. 2023, 235, 123918. [Google Scholar]
- Mohammadian, M.; Moghaddam, A.D.; Sharifan, A.; Dabaghi, P.; Hadi, S. Structural, physico-mechanical, and bio-functional properties of whey protein isolate-based edible films as affected by enriching with nettle (Urtica dioica L.) leaf extract. J. Food Meas. Charact. 2021, 15, 4051–4060. [Google Scholar]
- Hamedi, F.; Mohammad, S.; Razavi, A.; Sharif, A. Structural, morphological and rheological characterisation of bovine serum albumin–cress seed gum complex coacervate. Int. J. Food Sci. Technol. 2022, 57, 4432–4440. [Google Scholar] [CrossRef]
- Niu, F.; Kou, M.; Fan, J.; Pan, W.; Feng, Z.J.; Su, Y.; Yang, Y.; Zhou, W. Structural characteristics and rheological properties of ovalbumin-gum arabic complex coacervates. Food Chem. 2018, 260, 1–6. [Google Scholar] [CrossRef] [PubMed]
- Timilsena, Y.P.; Wang, B.; Adhikari, R.; Adhikari, B. Preparation and characterization of chia seed protein isolate-chia seed gum complex coacervates. Food Hydrocoll. 2015, 52, 554–563. [Google Scholar] [CrossRef]
- Ran, X.; Yang, H. Promoted strain-hardening and crystallinity of a soy protein-konjac glucomannan complex gel by konjac glucomannan. Food Hydrocoll. 2022, 133, 107959. [Google Scholar]
- Li, F.; Wang, H.; Mei, X. Preparation and characterization of phytosterol-loaded microcapsules based on the complex coacervation. J. Food Eng. 2021, 311, 110728. [Google Scholar] [CrossRef]
- Eratte, D.; McKnight, S.; Gengenbach, T.R.; Dowling, K.; Barrow, C.J.; Adhikari, B.P. Co-encapsulation and characterisation of omega-3 fatty acids and probiotic bacteria in whey protein isolate-gum Arabic complex coacervates. J. Funct. Foods 2015, 19, 882–892. [Google Scholar]
- Ashe, S.; Behera, S.; Dash, P.; Nayak, D.; Nayak, B. Gelatin carrageenan sericin hydrogel composites improves cell viability of cryopreserved SaOS-2 cells. Int. J. Biol. Macromol. 2020, 154, 606–620. [Google Scholar]
- Raei, M.; Rafe, A.; Shahidi, F. Rheological and structural characteristics of whey protein-pectin complex coacervates. J. Food Eng. 2018, 228, 25–31. [Google Scholar] [CrossRef]
- Jiang, S.; Ma, Y.; Wang, Y.; Wang, R.; Zeng, M. Effect of κ-carrageenan on the gelation properties of oyster protein. Food Chem. 2022, 382, 132329. [Google Scholar] [CrossRef] [PubMed]
- Lu, Z.; Wang, L.; Xie, H.; Lei, Q.; Fang, W.; Lu, X. Structural transitions of ovalbumin/κ-carrageenan complexes under the effects of pH and composition. Chem. Phys. 2020, 533, 110733. [Google Scholar] [CrossRef]
- Wang, X.; Wang, S.; Yang, J.; Yang, Z.; Dang, L.; Wang, Z. Microemulsions based on peony (Paeonia suffruticosa Andr.) seed oil and its fatty acids: Product development and stability enhancement. Ind. Crops Prod. 2022, 183, 114987. [Google Scholar] [CrossRef]
- Huang, M.; Wang, Y.; Ahmad, M.; Ying, R.; Wang, Y.; Tan, C. Fabrication of pickering high internal phase emulsions stabilized by pecan protein/xanthan gum for enhanced stability and bioaccessibility of quercetin. Food Chem. 2021, 357, 129732. [Google Scholar] [CrossRef]
- Zhao, Q.L.; Gu, Q.; Hong, X.; Liu, Y.F.; Li, J.W. Novel protein-based nanoparticles from perilla oilseed residues as sole Pickering stabilizers for high internal phase emulsions. LWT Food Sci. Technol. 2021, 145, 111340. [Google Scholar] [CrossRef]
- Tang, M.; Zhu, Y.; Li, D.; Adhikari, B.; Wang, L. Rheological, thermal and microstructural properties of casein/κ-carrageenan mixed systems. LWT Food Sci. Technol. 2019, 113, 108296. [Google Scholar] [CrossRef]
- Li, X.; Liu, Y.; Li, N.; Xie, D.; Yu, J.; Wang, F.; Wang, J. Studies of phase separation in soluble rice protein/different polysaccharides mixed systems. LWT Food Sci. Technol. 2016, 65, 676–682. [Google Scholar]


| Coacervation Yield/% | Mean Particle Size/nm | |||||||
|---|---|---|---|---|---|---|---|---|
| 1:1 | 2:1 | 4:1 | 10:1 | 1:1 | 2:1 | 4:1 | 10:1 | |
| SPI–GA | 9.15 ± 0.78 D,b | 11.20 ± 0.14 C,c | 16.25 ± 0.64 B,d | 48.93 ± 2.12 A,a | 185.4 D,d | 196.8 C,c | 231.7 B,d | 265.6 A,d |
| SPI–SA | 10.70 ± 1.84 C,b | 22.75 ± 0.07 B,b | 51.64 ± 1.92 A,c | 10.25 ± 0.35 C,d | 297.0 C,b | 297.2 C,a | 397.6 B,a | 664.6 A,a |
| SPI–CMC | 7.85 ± 0.49 D,c | 58.90 ± 0.85 B,a | 69.75 ± 0.49 A,a | 36.57 ± 2.42 C,b | 311.0 C,a | 134.0 D,d | 365.6 B,c | 479.9 A,b |
| SPI–CAR | 17.30 ± 1.41 D,a | 57.05 ± 0.92 B,a | 62.93 ± 1.11 A,b | 30.40 ± 0.14 C,c | 253.2 C,c | 208.9 D,b | 376.0 B,b | 419.0 A,c |
Disclaimer/Publisher’s Note: The statements, opinions and data contained in all publications are solely those of the individual author(s) and contributor(s) and not of MDPI and/or the editor(s). MDPI and/or the editor(s) disclaim responsibility for any injury to people or property resulting from any ideas, methods, instructions or products referred to in the content. |
© 2023 by the authors. Licensee MDPI, Basel, Switzerland. This article is an open access article distributed under the terms and conditions of the Creative Commons Attribution (CC BY) license (https://creativecommons.org/licenses/by/4.0/).
Share and Cite
Dong, Z.; Yu, S.; Zhai, K.; Bao, N.; Rashed, M.M.A.; Wu, X. Fabrication and Characterization of Complex Coacervation: The Integration of Sesame Protein Isolate-Polysaccharides. Foods 2023, 12, 3696. https://doi.org/10.3390/foods12193696
Dong Z, Yu S, Zhai K, Bao N, Rashed MMA, Wu X. Fabrication and Characterization of Complex Coacervation: The Integration of Sesame Protein Isolate-Polysaccharides. Foods. 2023; 12(19):3696. https://doi.org/10.3390/foods12193696
Chicago/Turabian StyleDong, Zeng, Shirong Yu, Kefeng Zhai, Nina Bao, Marwan M. A. Rashed, and Xiao Wu. 2023. "Fabrication and Characterization of Complex Coacervation: The Integration of Sesame Protein Isolate-Polysaccharides" Foods 12, no. 19: 3696. https://doi.org/10.3390/foods12193696
APA StyleDong, Z., Yu, S., Zhai, K., Bao, N., Rashed, M. M. A., & Wu, X. (2023). Fabrication and Characterization of Complex Coacervation: The Integration of Sesame Protein Isolate-Polysaccharides. Foods, 12(19), 3696. https://doi.org/10.3390/foods12193696