

Investigation of Spectroscopic Peculiarities of Ergot-Infected Winter Wheat Grains
 , , ,
, , , 
Abstract
:1. Introduction
2. Materials and Methods
2.1. Plant Materials
2.2. Grain Selection
2.3. FTIR Spectroscopy
2.4. UV-vis-NIR Reflectance Spectroscopy
2.5. Luminescence Spectroscopy
2.6. Data Analysis
2.6.1. Chemometric Analysis
2.6.2. Model Evaluation
3. Results and Discussion
3.1. MIR Absorption Spectroscopy
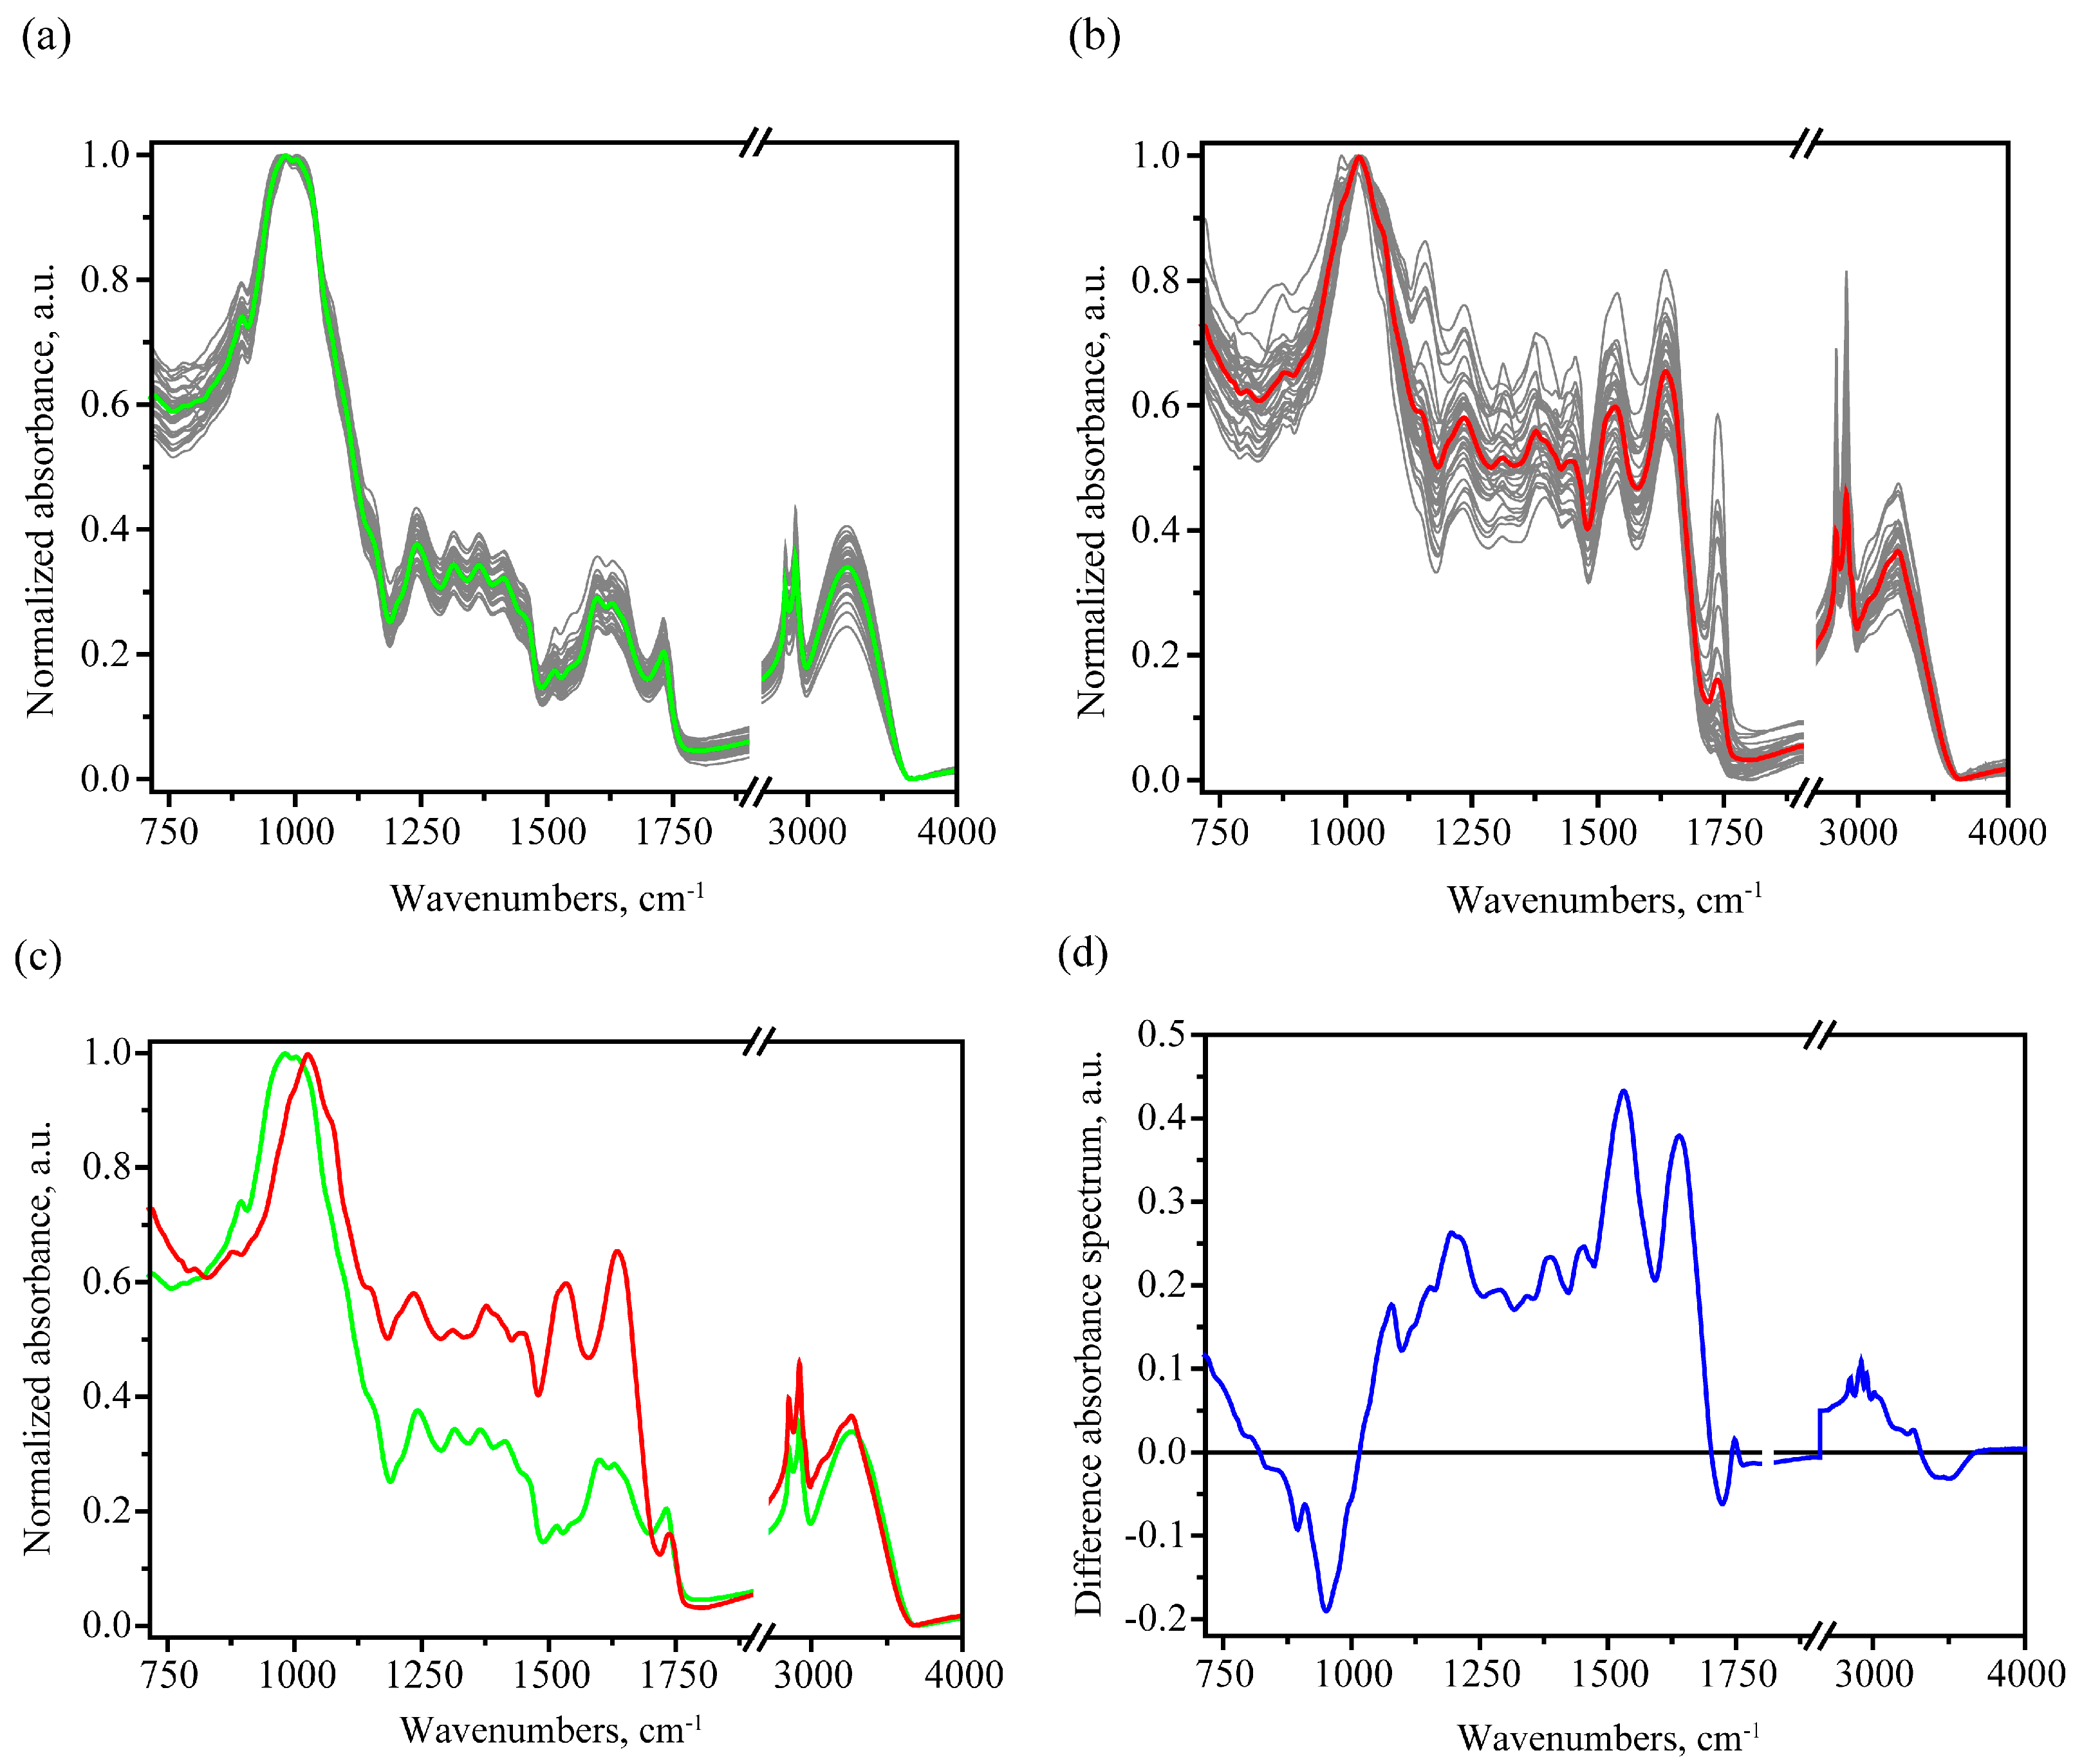
3.1.1. FTIR Spectral Trends and Features
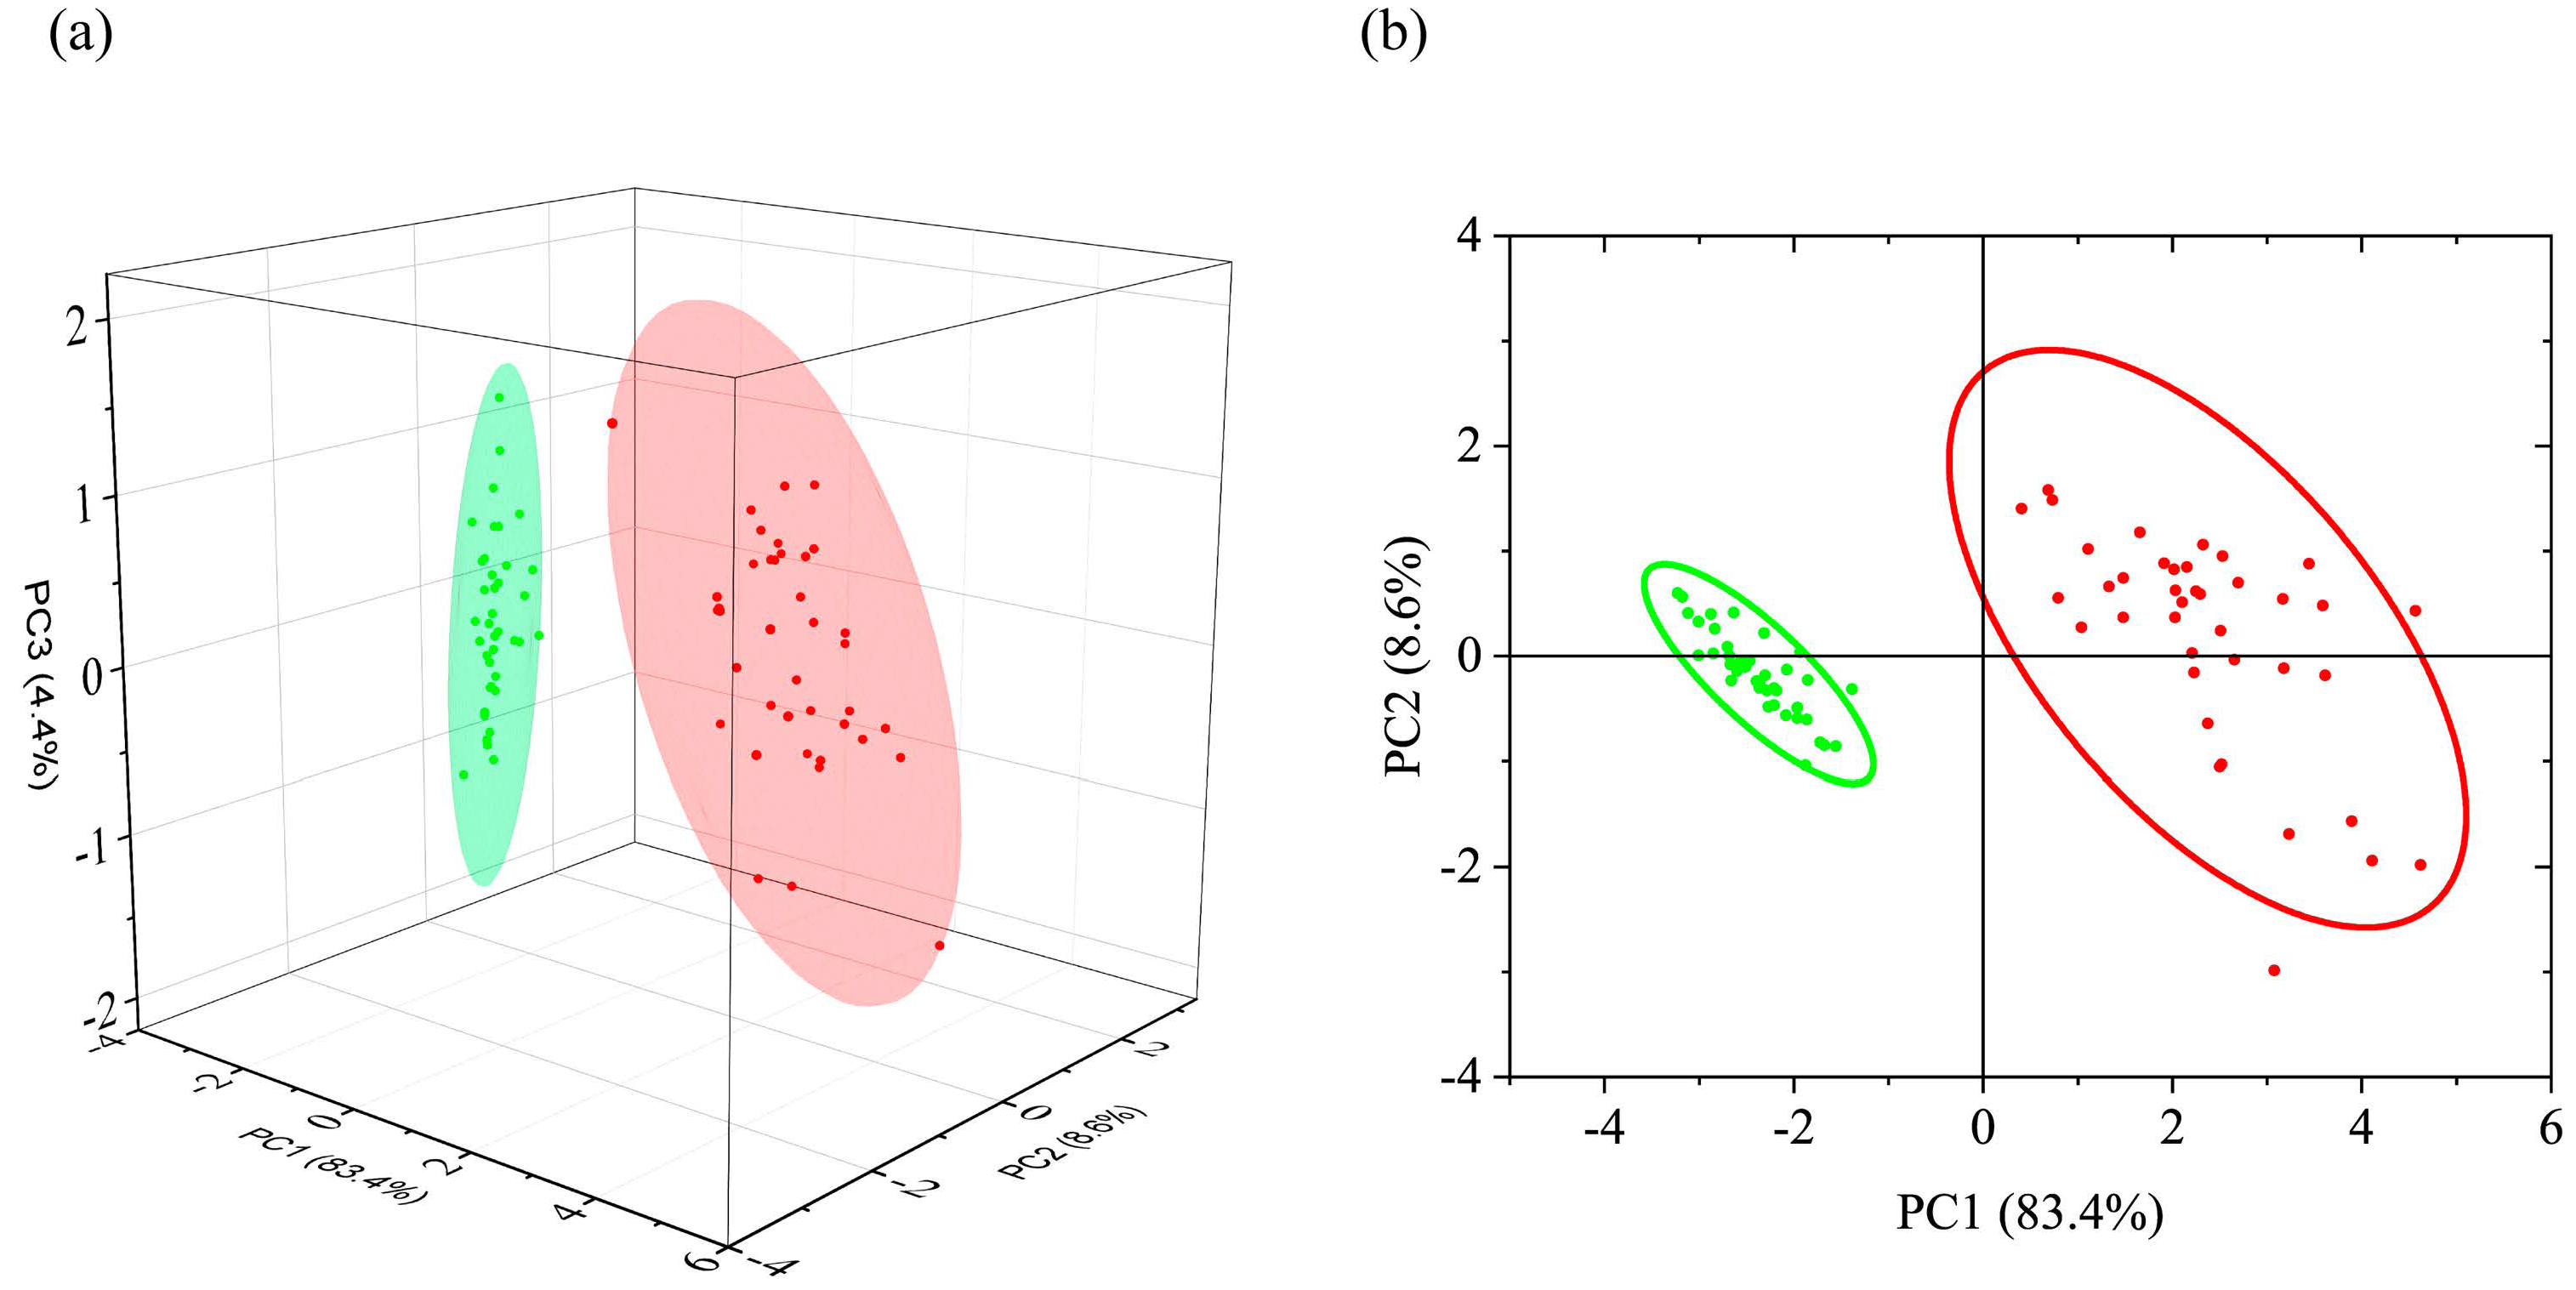
3.1.2. PCA of FTIR Absorption Spectra
3.1.3. LDA and SVM Classification
3.2. UV-Vis-NIR Spectroscopy
3.2.1. UV-Vis-NIR Spectral Trends and Features
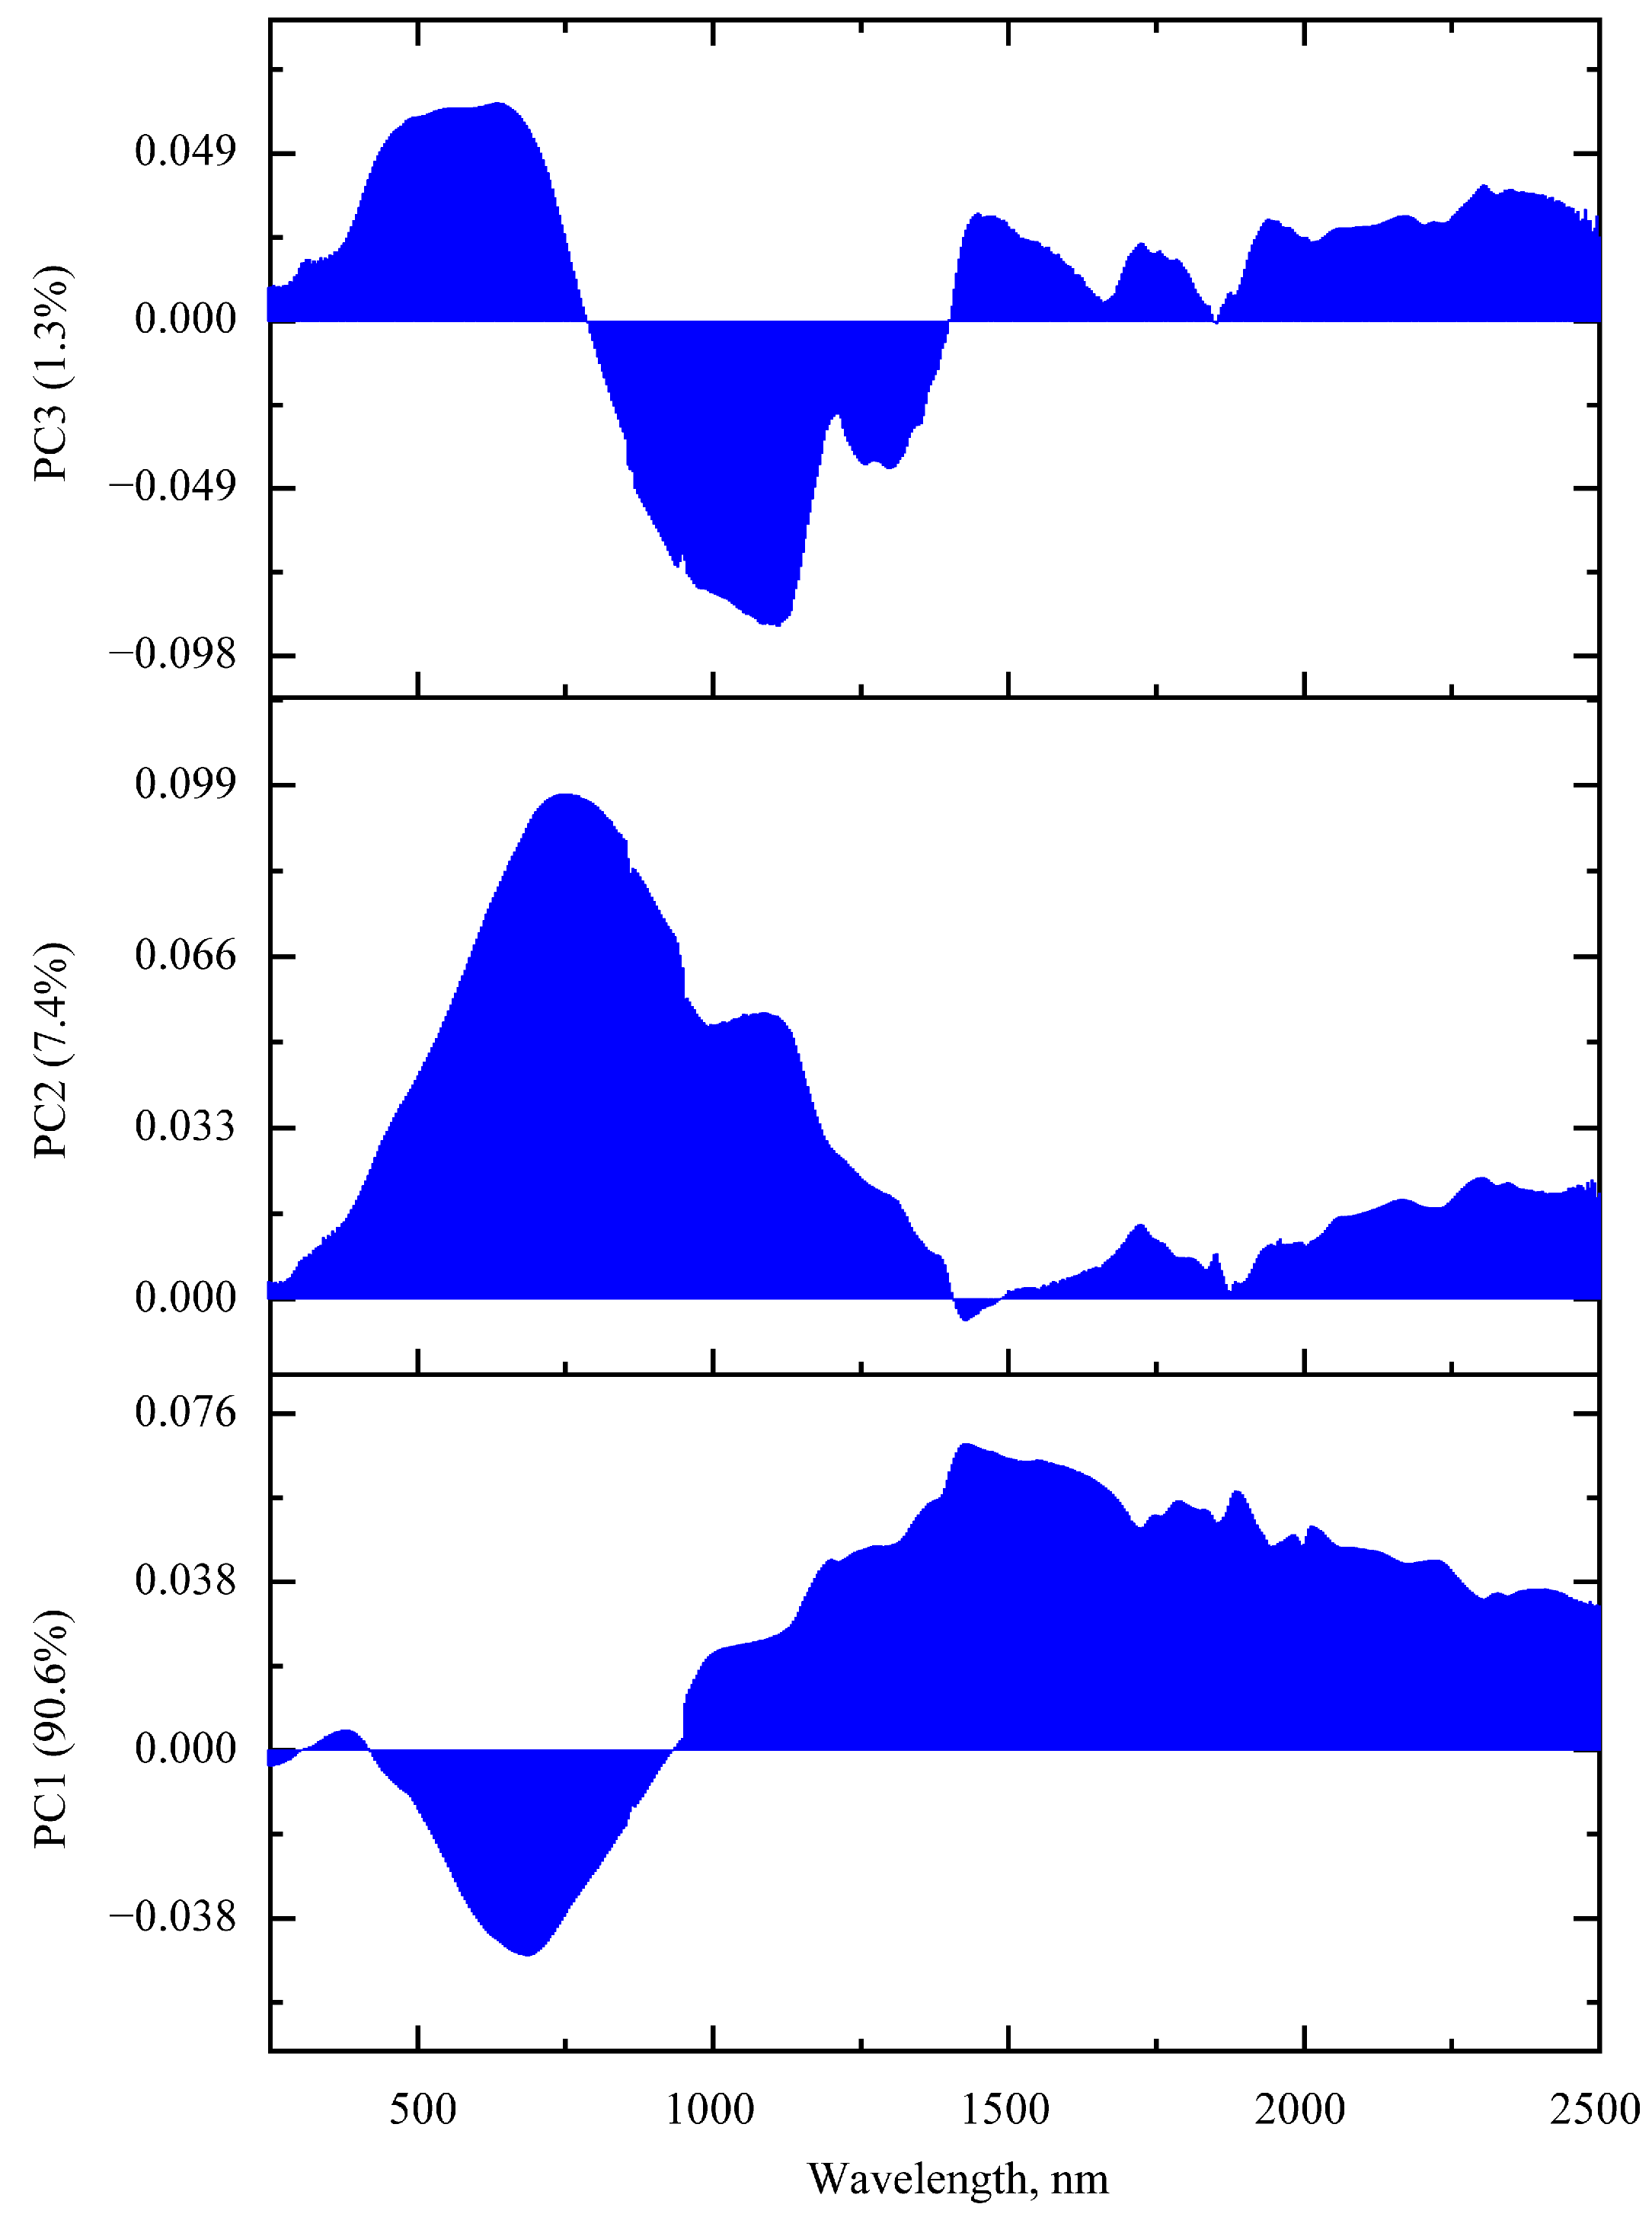
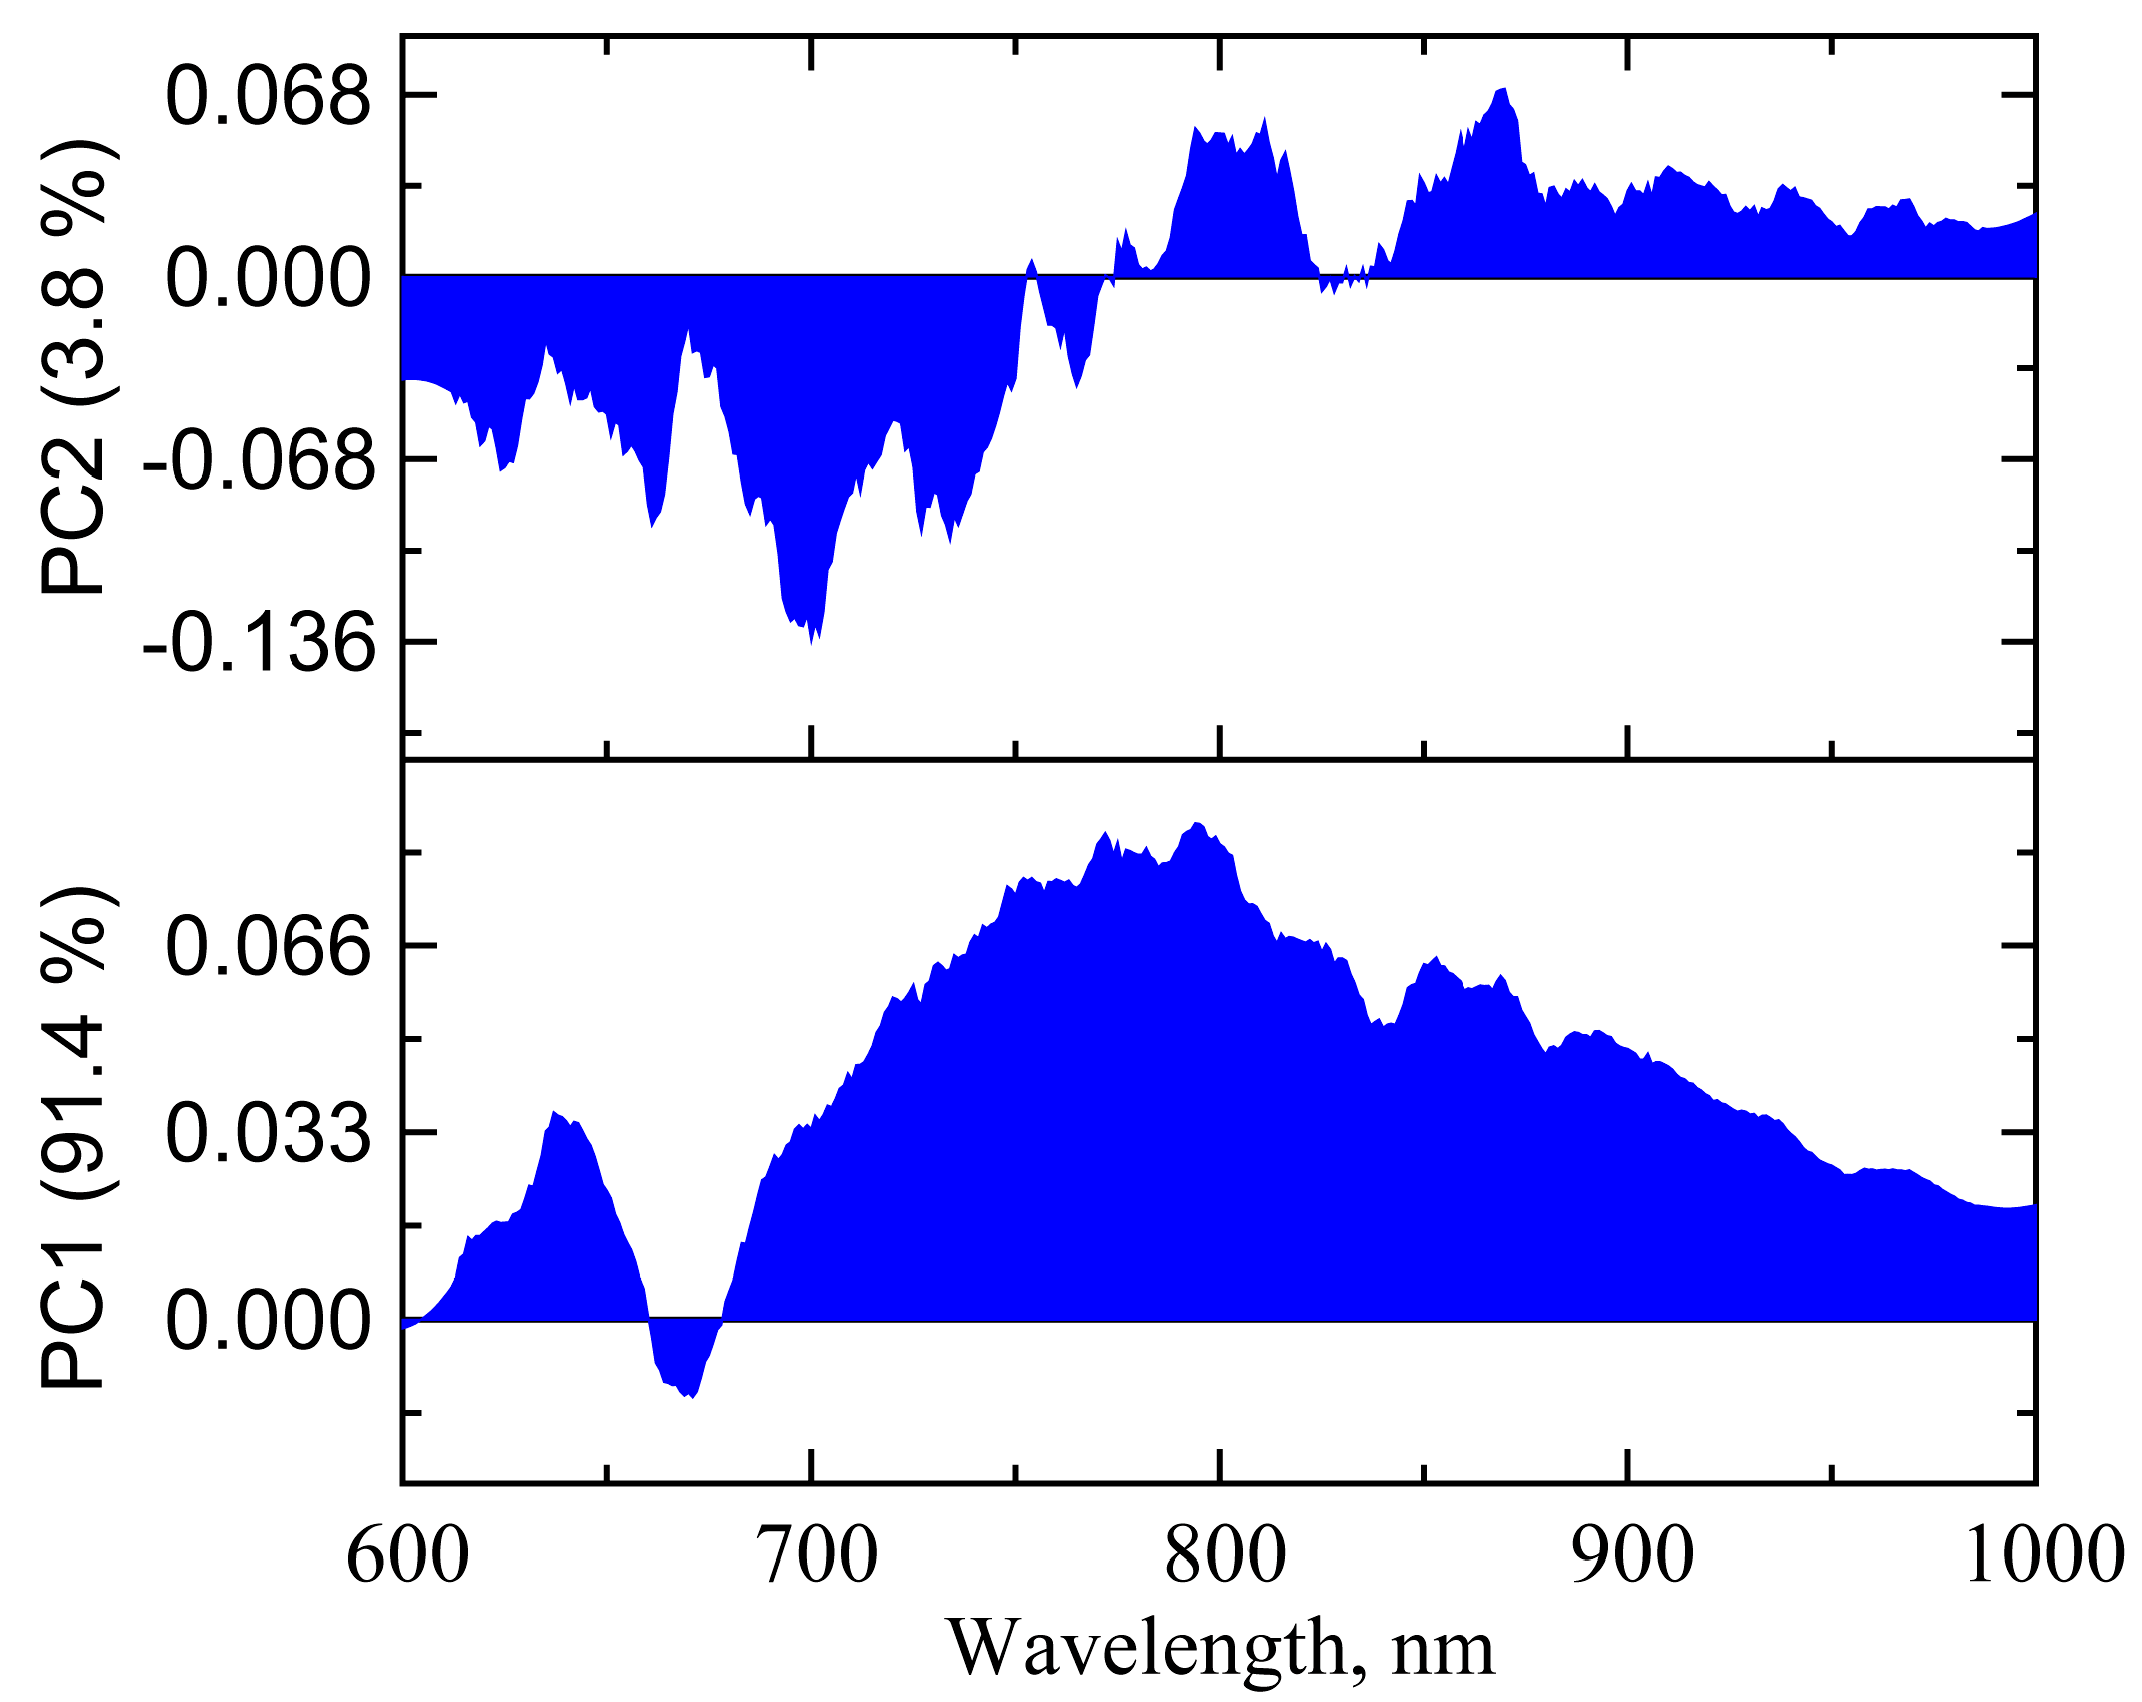
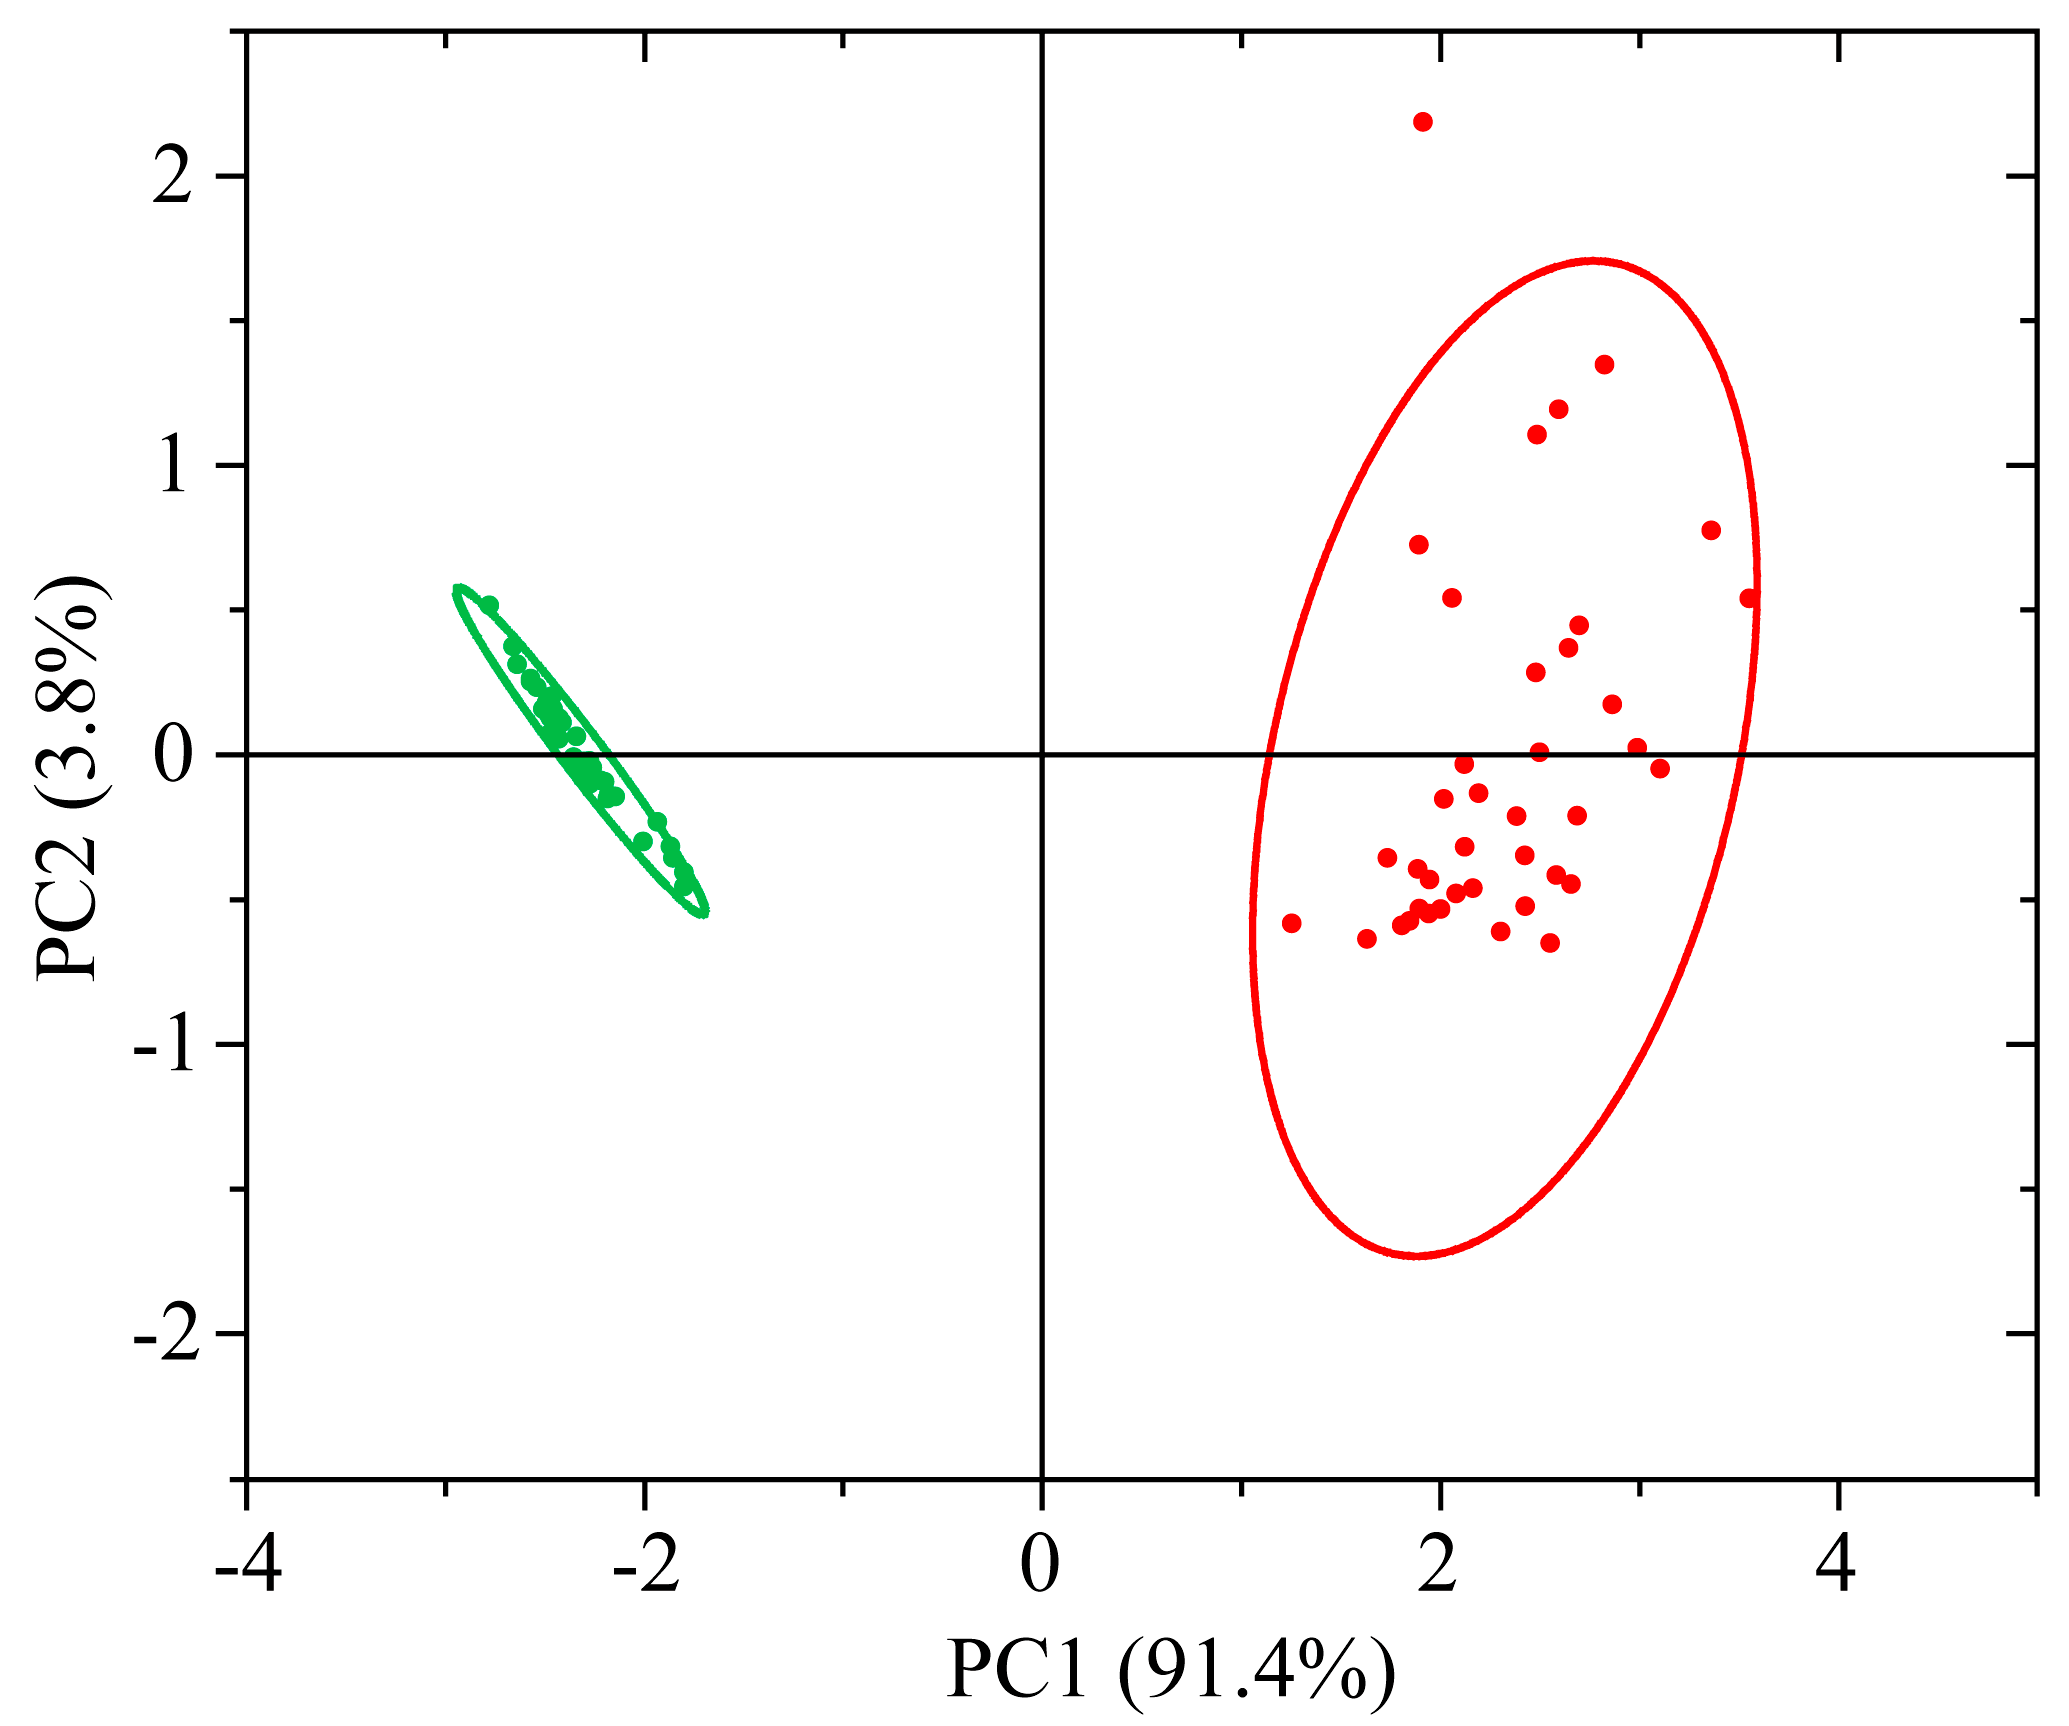
3.2.2. PCA of UV-vis-NIR Absorption Spectra
3.2.3. LDA and SVM Classification
3.3. Luminescence Spectroscopy
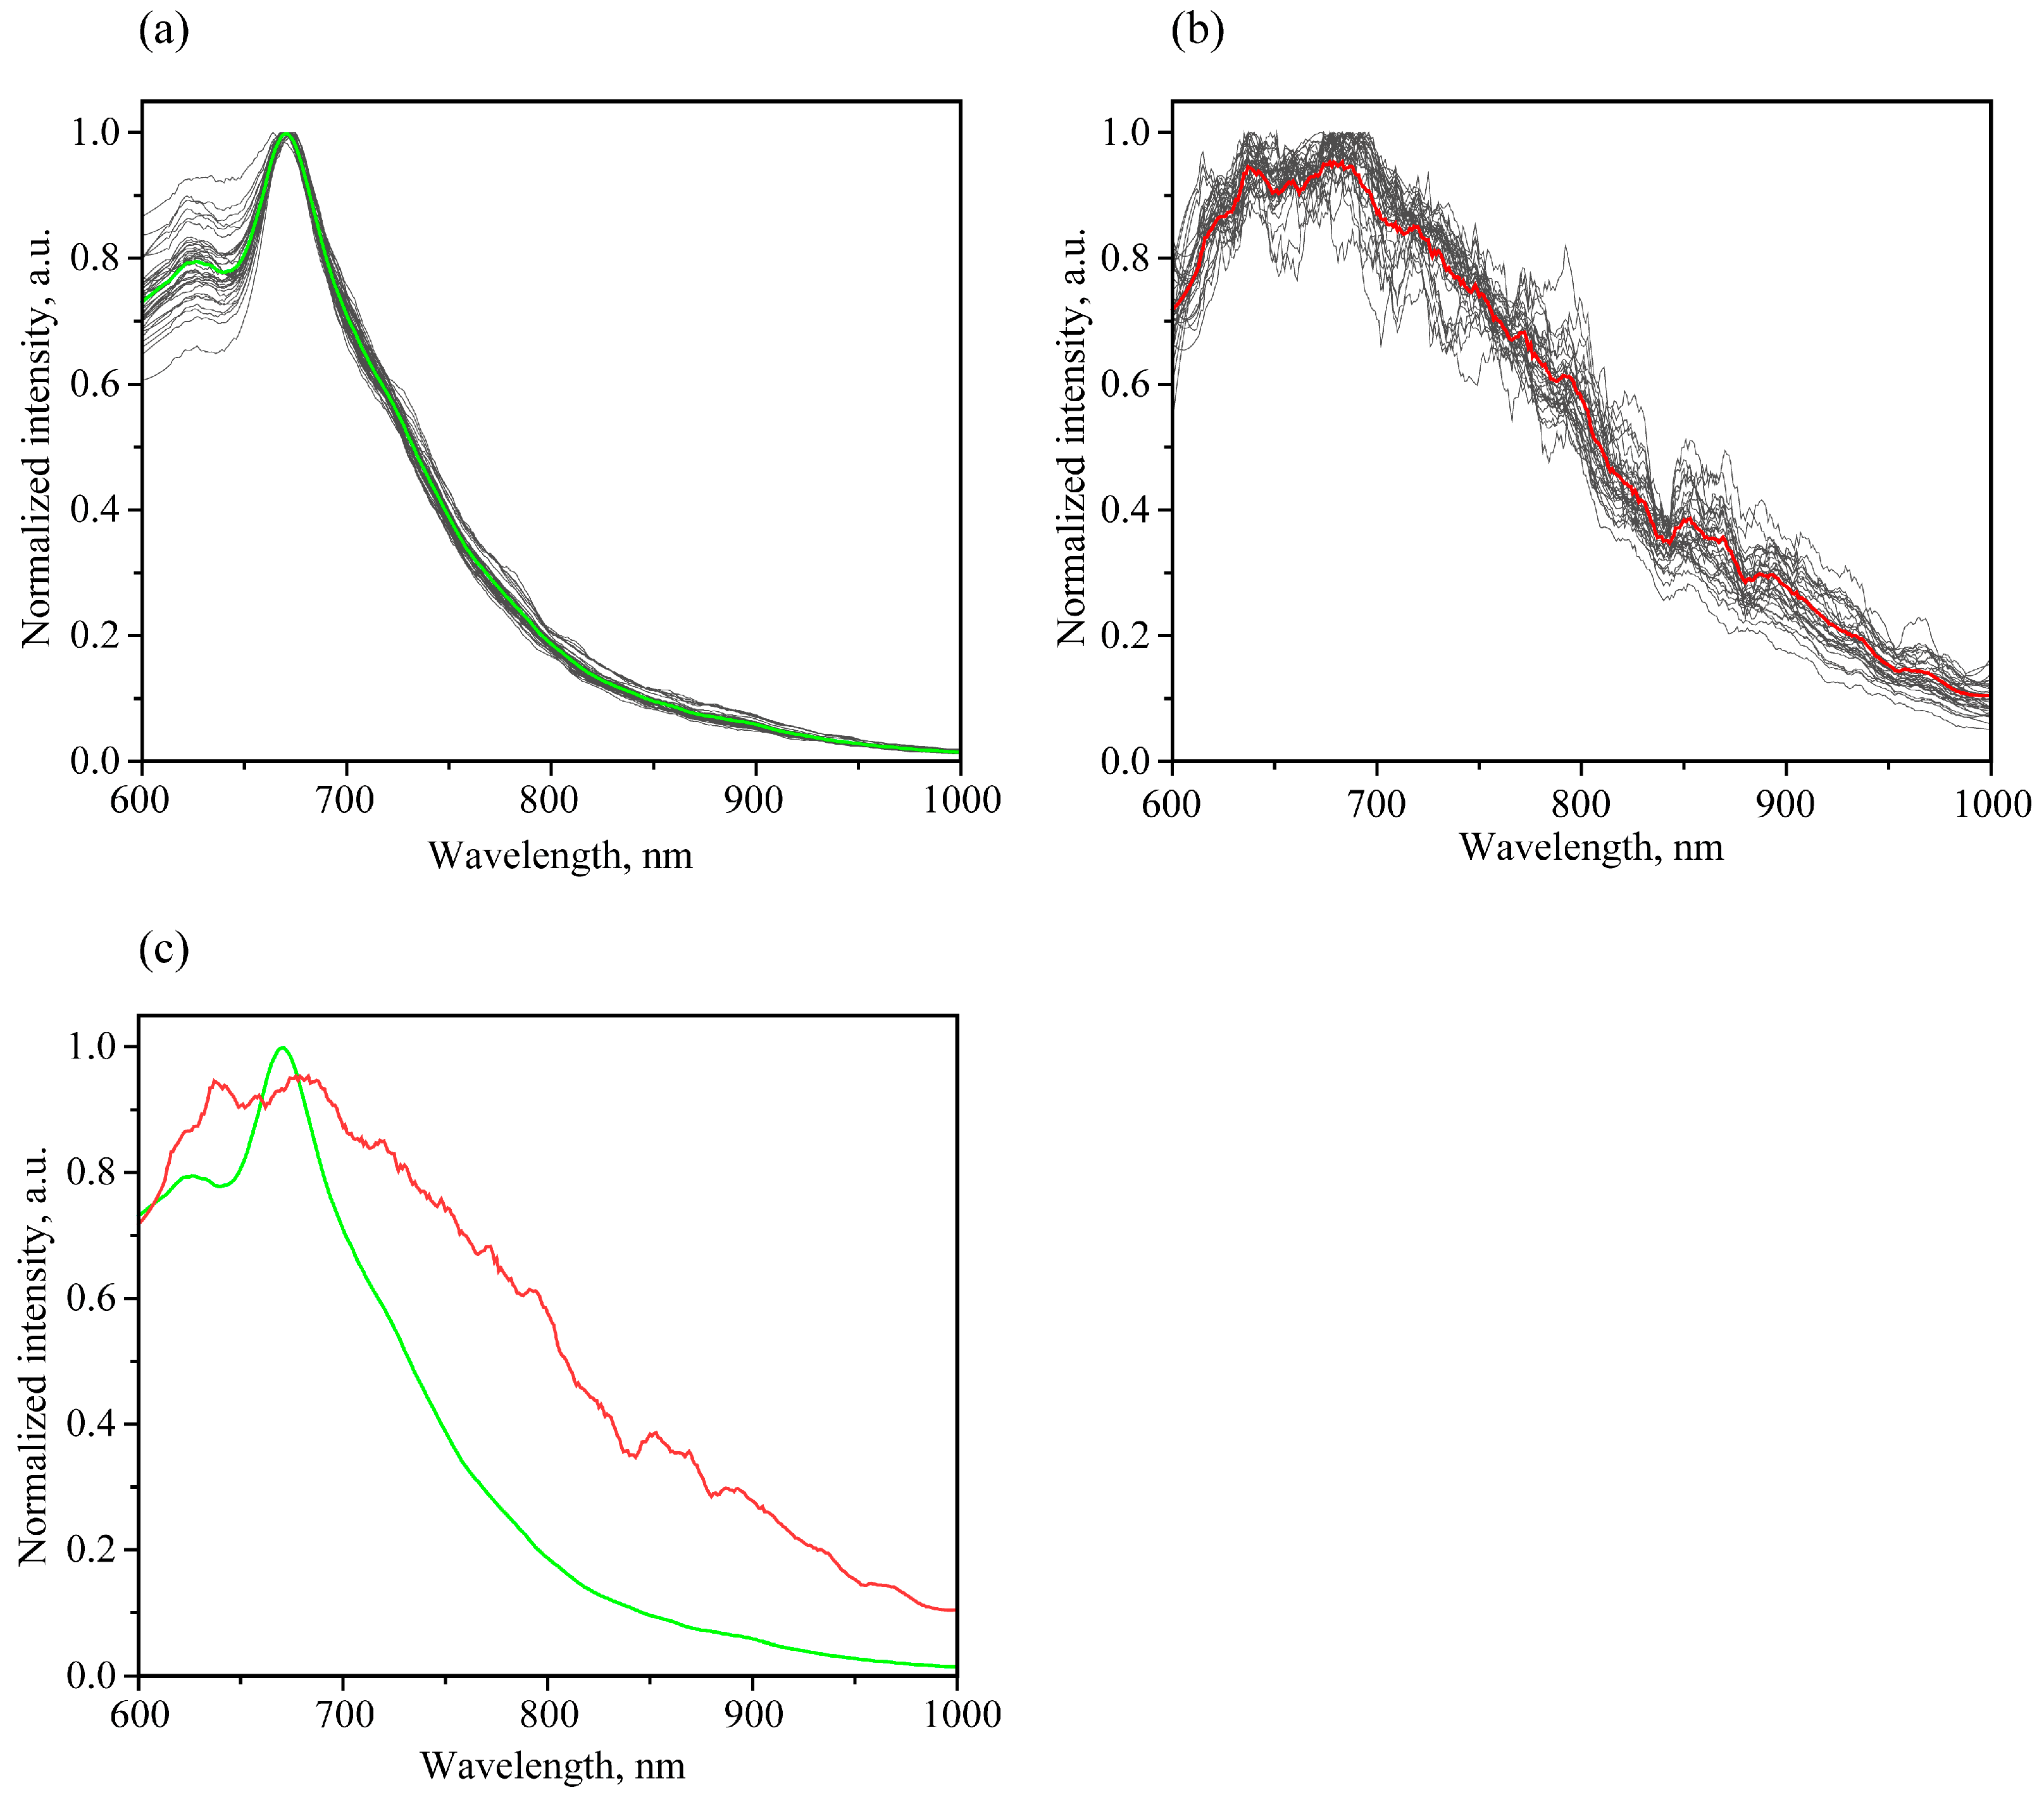
3.3.1. Luminescent Spectral Trends and Features
3.3.2. PCA of Luminescent Spectra
3.3.3. LDA and SVM Classification
4. Conclusions
Supplementary Materials
Author Contributions
Funding
Data Availability Statement
Conflicts of Interest
References
- Agriopoulou, S.; Stamatelopoulou, E.; Varzakas, T. Advances in Occurrence, Importance, and Mycotoxin Control Strategies: Prevention and Detoxification in Foods. Foods 2020, 9, 137. [Google Scholar] [CrossRef] [PubMed]
- Inamdar, A.A.; Suresh, D.S. Application of Color Sorter in Wheat Milling. Int. Food Res. J. 2014, 21, 2083–2089. [Google Scholar]
- Schumann, G.L. Ergot. The Plant Health Instructor; University of Massachusetts: Boston, MA, USA, 2000. [Google Scholar] [CrossRef]
- Coufal-Majewski, S.; Stanford, K.; McAllister, T.; Blakley, B.; McKinnon, J.; Chaves, A.V.; Wang, Y. Impacts of Cereal Ergot in Food Animal Production. Front Vet. Sci. 2016, 3, 15. [Google Scholar] [CrossRef] [PubMed]
- Haarmann, T.; Rolke, Y.; Giesbert, S.; Tudzynski, P. Ergot: From Witchcraft to Biotechnology. Mol. Plant Pathol. 2009, 10, 563–577. [Google Scholar] [CrossRef] [PubMed]
- Vermeulen, P.; Pierna, J.A.F.; van Egmond, H.P.; Dardenne, P.; Baeten, V. Online Detection and Quantification of Ergot Bodies in Cereals Using near Infrared Hyperspectral Imaging. Food Addit. Contam. Part A 2012, 29, 232–240. [Google Scholar] [CrossRef]
- Dung, J.K.S.; Kaur, N.; Walenta, D.L.; Alderman, S.C.; Frost, K.E.; Hamm, P.B. Reducing Claviceps Purpurea Sclerotia Germination with Soil-Applied Fungicides. Crop Prot. 2018, 106, 146–149. [Google Scholar] [CrossRef]
- Rottinghaus, G.E.; Schultz, L.M.; Ross, P.F.; Hill, N.S. An HPLC Method for the Detection of Ergot in Ground and Pelleted Feeds. J. Vet. Diagn. Investig. 1993, 5, 242–247. [Google Scholar] [CrossRef]
- Shi, H.; Yu, P. Exploring the Potential of Applying Infrared Vibrational (Micro)Spectroscopy in Ergot Alkaloids Determination: Techniques, Current Status, and Challenges. Appl. Spectrosc. Rev. 2018, 53, 395–419. [Google Scholar] [CrossRef]
- Chung, S.W.C. A Critical Review of Analytical Methods for Ergot Alkaloids in Cereals and Feed and in Particular Suitability of Method Performance for Regulatory Monitoring and Epimer-Specific Quantification. Food Addit. Contam. Part A 2021, 38, 997–1012. [Google Scholar] [CrossRef]
- Weng, S.; Hu, X.; Wang, J.; Tang, L.; Li, P.; Zheng, S.; Zheng, L.; Huang, L.; Xin, Z. Advanced Application of Raman Spectroscopy and Surface-Enhanced Raman Spectroscopy in Plant Disease Diagnostics: A Review. J. Agric. Food Chem. 2021, 69, 2950–2964. [Google Scholar] [CrossRef]
- Egging, V.; Nguyen, J.; Kurouski, D. Detection and Identification of Fungal Infections in Intact Wheat and Sorghum Grain Using a Hand-Held Raman Spectrometer. Anal. Chem. 2018, 90, 8616–8621. [Google Scholar] [CrossRef] [PubMed]
- Vermeulen, P.; Fernández Pierna, J.A.; van Egmond, H.P.; Zegers, J.; Dardenne, P.; Baeten, V. Validation and Transferability Study of a Method Based on Near-Infrared Hyperspectral Imaging for the Detection and Quantification of Ergot Bodies in Cereals. Anal. Bioanal. Chem. 2013, 405, 7765–7772. [Google Scholar] [CrossRef] [PubMed]
- Lattanzio, V.M.T.; Pascale, M.; Visconti, A. Current Analytical Methods for Trichothecene Mycotoxins in Cereals. TrAC Trends Anal. Chem. 2009, 28, 758–768. [Google Scholar] [CrossRef]
- Saccon, F.A.M.; Parcey, D.; Paliwal, J.; Sherif, S.S. Assessment of Fusarium and Deoxynivalenol Using Optical Methods. Food Bioproc. Tech. 2017, 10, 34–50. [Google Scholar] [CrossRef]
- Li, L.; Chen, S.; Deng, M.; Gao, Z. Optical Techniques in Non-Destructive Detection of Wheat Quality: A Review. Grain Oil Sci. Technol. 2022, 5, 44–57. [Google Scholar] [CrossRef]
- Pankin, D.; Martynova, N.; Smirnov, M.; Manshina, A. Spectral Properties of Triphenyltin Chloride Toxin and Its Detectivity by SERS: Theory and Experiment. Spectrochim. Acta A Mol. Biomol. Spectrosc. 2021, 245, 118933. [Google Scholar] [CrossRef]
- Pankin, D.; Povolotckaia, A.; Borisov, E.; Belyakov, M.; Borzenko, S.; Gulyaev, A.; Moskovskiy, M. Theoretical Modelling of Structure, Vibrational and UV–Vis Absorbance Spectra of Rubrofusarin Molecule. Spectrochim. Acta A Mol. Biomol. Spectrosc. 2023, 293, 122469. [Google Scholar] [CrossRef]
- Pankin, D.; Smirnov, M.; Povolotckaia, A.; Povolotskiy, A.; Borisov, E.; Moskovskiy, M.; Gulyaev, A.; Gerasimenko, S.; Aksenov, A.; Litvinov, M.; et al. DFT Modelling of Molecular Structure, Vibrational and UV-Vis Absorption Spectra of T-2 Toxin and 3-Deacetylcalonectrin. Materials 2022, 15, 649. [Google Scholar] [CrossRef]
- Vermeulen, P.; Ebene, M.B.; Orlando, B.; Fernández Pierna, J.A.; Baeten, V. Online Detection and Quantification of Particles of Ergot Bodies in Cereal Flour Using Near-Infrared Hyperspectral Imaging. Food Addit. Contam. Part A 2017, 34, 1312–1319. [Google Scholar] [CrossRef]
- Shi, H.; Schwab, W.; Liu, N.; Yu, P. Major Ergot Alkaloids in Naturally Contaminated Cool-Season Barley Grain Grown under a Cold Climate Condition in Western Canada, Explored with near-Infrared (NIR) and Fourier Transform Mid-Infrared (ATR-FT/MIR) Spectroscopy. Food Control 2019, 102, 221–230. [Google Scholar] [CrossRef]
- Shi, H.; Yu, P. Using Molecular Spectroscopic Techniques (NIR and ATR-FT/MIR) Coupling with Various Chemometrics to Test Possibility to Reveal Chemical and Molecular Response of Cool-Season Adapted Wheat Grain to Ergot Alkaloids. Toxins 2023, 15, 151. [Google Scholar] [CrossRef]
- Hossain, M.Z.; Goto, T. Near- and Mid-Infrared Spectroscopy as Efficient Tools for Detection of Fungal and Mycotoxin Contamination in Agricultural Commodities. World Mycotoxin J. 2014, 7, 507–515. [Google Scholar] [CrossRef]
- Dorokhov, A.; Moskovskiy, M.; Belyakov, M.; Lavrov, A.; Khamuev, V. Detection of Fusarium Infected Seeds of Cereal Plants by the Fluorescence Method. PLoS ONE 2022, 17, e0267912. [Google Scholar] [CrossRef]
- Moskovskiy, M.N.; Belyakov, M.V.; Dorokhov, A.S.; Boyko, A.A.; Belousov, S.V.; Noy, O.V.; Gulyaev, A.A.; Akulov, S.I.; Povolotskaya, A.; Efremenkov, I.Y. Design of Device for Optical Luminescent Diagnostic of the Seeds Infected by Fusarium. Agriculture 2023, 13, 619. [Google Scholar] [CrossRef]
- Pankin, D.; Povolotckaia, A.; Kalinichev, A.; Povolotskiy, A.; Borisov, E.; Moskovskiy, M.; Gulyaev, A.; Lavrov, A.; Izmailov, A. Complex Spectroscopic Study for Fusarium Genus Fungi Infection Diagnostics of “Zalp” Cultivar Oat. Agronomy 2021, 11, 2402. [Google Scholar] [CrossRef]
- Mertz, L. Auxiliary Computation for Fourier Spectrometry. Infrared Phys. 1967, 7, 17–23. [Google Scholar] [CrossRef]
- Porter, C.D.; Tanner, D.B. Correction of Phase Errors in Fourier Spectroscopy. Int. J. Infrared Millim. Waves 1983, 4, 273–298. [Google Scholar] [CrossRef]
- Harris, F.J. On the Use of Windows for Harmonic Analysis with the Discrete Fourier Transform. Proc. IEEE 1978, 66, 51–83. [Google Scholar] [CrossRef]
- Prabhu, K.M.M. Window Functions and Their Applications in Signal Processing; CRC Press: Boca Raton, FL, USA, 2018; ISBN 9781315216386. [Google Scholar]
- Moskovskiy, M.; Litvinov, M.; Boiko, A.; Maklakov, S. Research of the Spectral Characteristics of Healthy and Fusarium-Infected Wheat Seeds Variety Moskovskaya 56 by Hyperspectral Spectroscopy. E3S Web Conf. 2021, 285, 02016. [Google Scholar] [CrossRef]
- do Vale Madeiro, J.P.; Cortez, P.C.; Monteiro Filho, J.M.D.S.; Brayner, A.R.A. Developments and Applications for ECG Signal Processing: Modeling, Segmentation, and Pattern Recognition; Elsevier: Amsterdam, The Netherlands, 2018. [Google Scholar] [CrossRef]
- Chang, Y.W.; Hsieh, C.J.; Chang, K.W.; Ringgaard, M.; Lin, C.J. Training and Testing Low-Degree Polynomial Data Mappings via Linear SVM. J. Mach. Learn. Res. 2010, 11, 1471–1490. [Google Scholar]
- Nazeer, S.S.; Sreedevi, T.P.; Jayasree, R.S. Autofluorescence Spectroscopy and Multivariate Analysis for Predicting the Induced Damages to Other Organs Due to Liver Fibrosis. Spectrochim. Acta A Mol. Biomol. Spectrosc. 2021, 257, 119741. [Google Scholar] [CrossRef] [PubMed]
- Porto, N.d.A.; Roque, J.V.; Wartha, C.A.; Cardoso, W.; Peternelli, L.A.; Barbosa, M.H.P.; Teófilo, R.F. Early Prediction of Sugarcane Genotypes Susceptible and Resistant to Diatraea Saccharalis Using Spectroscopies and Classification Techniques. Spectrochim. Acta A Mol. Biomol. Spectrosc. 2019, 218, 69–75. [Google Scholar] [CrossRef] [PubMed]
- Huang, F.; Song, H.; Guo, L.; Guang, P.; Yang, X.; Li, L.; Zhao, H.; Yang, M. Detection of Adulteration in Chinese Honey Using NIR and ATR-FTIR Spectral Data Fusion. Spectrochim. Acta A Mol. Biomol. Spectrosc. 2020, 235, 118297. [Google Scholar] [CrossRef] [PubMed]
- Bledzki, A.K.; Mamun, A.A.; Volk, J. Physical, Chemical and Surface Properties of Wheat Husk, Rye Husk and Soft Wood and Their Polypropylene Composites. Compos. Part A Appl. Sci. Manuf. 2010, 41, 480–488. [Google Scholar] [CrossRef]
- Grundas, S.T. WHEAT|Grain Structure of Wheat and Wheat-Based Products. In Encyclopedia of Food Sciences and Nutrition; Elsevier: Amsterdam, The Netherlands, 2003; pp. 6137–6146. [Google Scholar]
- Povolotckaia, A.V.; Pankin, D.V.; Sazanova, K.V.; Petrov, Y.V.; Kurganov, N.S.; Mikhailova, A.A.; Povolotckiy, A.V.; Kurochkin, A.V.; Vlasov, A.D.; Gonobobleva, S.L.; et al. Biodamage to Paper by Micromycetes under Experimental Conditions: A Study by Vibrational Spectroscopy Methods. Opt. Spectrosc. 2019, 126, 354–359. [Google Scholar] [CrossRef]
- Mayo, D.W.; Miller, F.A.; Hannah, R.W. Course Notes on the Interpretation of Infrared and Raman Spectra; Wiley: Hoboken, NJ, USA, 2004. [Google Scholar] [CrossRef]
- Lisperguer, J.; Perez, P.; Urizar, S. Structure and thermal properties of lignins: Characterization by infrared spectroscopy and differential scanning calorimetry. J. Chil. Chem. Soc. 2009, 54, 460–463. [Google Scholar] [CrossRef]
- Barbieri, V.; Lassinantti Gualtieri, M.; Siligardi, C. Wheat Husk: A Renewable Resource for Bio-Based Building Materials. Constr. Build Mater. 2020, 251, 118909. [Google Scholar] [CrossRef]
- Kavkler, K.; Demšar, A. Application of FTIR and Raman Spectroscopy to Qualitative Analysis of Structural Changes in Cellulosic Fibres. Tekstilec 2012, 55, 19–44. [Google Scholar]
- Vongsvivut, J.; Miller, M.R.; McNaughton, D.; Heraud, P.; Barrow, C.J. Rapid Discrimination and Determination of Polyunsaturated Fatty Acid Composition in Marine Oils by FTIR Spectroscopy and Multivariate Data Analysis. Food Bioproc. Tech. 2014, 7, 2410–2422. [Google Scholar] [CrossRef]
- Lucejko, J.J.; La Nasa, J.; Porta, F.; Vanzetti, A.; Tanda, G.; Mangiaracina, C.F.; Corretti, A.; Colombini, M.P.; Ribechini, E. Long-Lasting Ergot Lipids as New Biomarkers for Assessing the Presence of Cereals and Cereal Products in Archaeological Vessels. Sci. Rep. 2018, 8, 3935. [Google Scholar] [CrossRef]
- Neubauer, L.; Dopstadt, J.; Humpf, H.-U.; Tudzynski, P. Identification and Characterization of the Ergochrome Gene Cluster in the Plant Pathogenic Fungus Claviceps Purpurea. Fungal. Biol. Biotechnol. 2016, 3, 2. [Google Scholar] [CrossRef]
- Siesler, H.W. Handbook of Near-Infrared Analysis; Burns, D.A., Ciurczak, E.W., Eds.; CRC Press: Boca Raton, FL, USA, 2007; ISBN 9780429123016. [Google Scholar]
- Badr, A. Near Infra Red Spectroscopy. In Wide Spectra of Quality Control; InTech: Rijeka, Croatia, 2011. [Google Scholar]
- De Girolamo, A.; Cortese, M.; Cervellieri, S.; Lippolis, V.; Pascale, M.; Logrieco, A.F.; Suman, M. Tracing the Geographical Origin of Durum Wheat by FT-NIR Spectroscopy. Foods 2019, 8, 450. [Google Scholar] [CrossRef]
- Klug, C.; Baltes, W.; Kronert, W.; Weber, R. Methode Zur Bestimmung von Mutterkornalkaloiden in Lebensmitteln. Z. Lebensm. Unters. Forsch. 1988, 186, 108–113. [Google Scholar] [CrossRef] [PubMed]
- Lehner, A.F.; Craig, M.; Fannin, N.; Bush, L.; Tobin, T. Electrospray[+] Tandem Quadrupole Mass Spectrometry in the Elucidation of Ergot Alkaloids Chromatographed by HPLC: Screening of Grass or Forage Samples for Novel Toxic Compounds. J. Mass Spectrom. 2005, 40, 1484–1502. [Google Scholar] [CrossRef] [PubMed]
- Pedrós, R.; Moya, I.; Goulas, Y.; Jacquemoud, S. Chlorophyll Fluorescence Emission Spectrum inside a Leaf. Photochem. Photobiol. Sci. 2008, 7, 498. [Google Scholar] [CrossRef] [PubMed]
- Menke, W.; Schmid, G.H. Fluorescence and Photochemical Properties of Plants with Defective Photosystem II. Zeitschrift für Naturforschung C 1980, 35, 461–466. [Google Scholar] [CrossRef]
- Bashilov, A.M.; Efremenkov, I.Y.; Belyakov, M.V.; Lavrov, A.V.; Gulyaev, A.A.; Gerasimenko, S.A.; Borzenko, S.I.; Boyko, A.A. Determination of Main Spectral and Luminescent Characteristics of Winter Wheat Seeds Infected with Pathogenic Microflora. Photonics 2021, 8, 494. [Google Scholar] [CrossRef]
- Kalaji, H.M.; Jajoo, A.; Oukarroum, A.; Brestic, M.; Zivcak, M.; Samborska, I.A.; Cetner, M.D.; Łukasik, I.; Goltsev, V.; Ladle, R.J. Chlorophyll a Fluorescence as a Tool to Monitor Physiological Status of Plants under Abiotic Stress Conditions. Acta Physiol. Plant 2016, 38, 102. [Google Scholar] [CrossRef]
- Ribeiro, P.A.; Raposo, M. (Eds.) Optics, Photonics and Laser Technology; Springer International Publishing: Cham, Switzerland, 2018; Volume 218, ISBN 978-3-319-98547-3. [Google Scholar]
- Rogalski, A.; Bielecki, Z. Detection of Optical Signals; Optics and Optoelectronics; CRC Press: Boca Raton, FL, USA, 2022; ISBN 9781032069227. [Google Scholar]


| Peak Frequency, cm−1 | Assignment 1 on The Basis of [26,39,40,41,42,43] |
|---|---|
| 893 | stretching vibrations in glyosidic bonds |
| 983 | v(C-O) |
| 1003 | v(C-O) |
| 1156 | vas(COC) |
| 1241 | v(C-O) |
| 1314 | δ(HCC), δ(COH) |
| 1365 | δ(HCC), δ(COH) |
| 1414 | δ(XCH) |
| 1453 | δ(HCH) |
| 1512 | v(C=C), δ(XCH) |
| 1598 | v(C=C) |
| 1629 | δ(OHO) |
| 1730 | v(C=O) |
| 2850 | vs(CH2) |
| 2918 | vas(CH2) |
| 3268 | v(OH) in water and intra- and inter-molecular hydrogen bonding |
| Peak Frequency, cm−1 | Assignment 1 on The Basis of [26,39,40,41,42,43] |
|---|---|
| 880 | stretching vibrations in glyosidic bonds |
| 1027 | v(CO) |
| 1151 | vas(COC) |
| 1233 | amide III |
| 1310 | δ(HCC), δ(COH) |
| 1378 | δ(HCC), δ(COH) |
| 1447 | δ(HCH) |
| 1534 | amide II |
| 1633 | amide I, δ(OHO) |
| 1738 | v(C=O) |
| 2850 | vs(CH2) |
| 2920 | vas(CH2) |
| 3056 | v(=C-H) |
| 3181 | v(NH) |
| 3266 | v(OH) in water and intra- and inter-molecular hydrogen bonding |
| Model | Scores Data | Data Set | Accuracy | Sensitivity | Specificity | Positive Predictive Value | Negative Predictive Value |
|---|---|---|---|---|---|---|---|
| PCA-LDA | PC1, PC2 | Training Set | 1.00 | 1.00 | 1.00 | 1.00 | 1.00 |
| Prediction Set | 1.00 | 1.00 | 1.00 | 1.00 | 1.00 | ||
| Total Set | 1.00 | 1.00 | 1.00 | 1.00 | 1.00 | ||
| PC1, PC3 | Training Set | 1.00 | 1.00 | 1.00 | 1.00 | 1.00 | |
| Prediction Set | 1.00 | 1.00 | 1.00 | 1.00 | 1.00 | ||
| Total Set | 1.00 | 1.00 | 1.00 | 1.00 | 1.00 | ||
| PC2, PC3 | Training Set | 0.60 | 0.65 | 0.54 | 0.59 | 0.61 | |
| Prediction Set | 0.73 | 0.62 | 0.85 | 0.80 | 0.69 | ||
| Total Set | 0.62 | 0.62 | 0.64 | 0.62 | 0.64 | ||
| PC1, PC2, PC3 | Training Set | 1.00 | 1.00 | 1.00 | 1.00 | 1.00 | |
| Prediction Set | 1.00 | 1.00 | 1.00 | 1.00 | 1.00 | ||
| Total Set | 1.00 | 1.00 | 1.00 | 1.00 | 1.00 | ||
| PCA-SVM | PC1, PC2 | Training Set | 1.00 | 1.00 | 1.00 | 1.00 | 1.00 |
| Prediction Set | 1.00 | 1.00 | 1.00 | 1.00 | 1.00 | ||
| Total Set | 1.00 | 1.00 | 1.00 | 1.00 | 1.00 | ||
| PC1, PC3 | Training Set | 1.00 | 1.00 | 1.00 | 1.00 | 1.00 | |
| Prediction Set | 1.00 | 1.00 | 1.00 | 1.00 | 1.00 | ||
| Total Set | 1.00 | 1.00 | 1.00 | 1.00 | 1.00 | ||
| PC2, PC3 | Training Set | 0.83 | 0.77 | 0.88 | 0.87 | 0.79 | |
| Prediction Set | 0.92 | 0.85 | 1.00 | 1.00 | 0.87 | ||
| Total Set | 0.86 | 0.79 | 0.92 | 0.91 | 0.82 | ||
| PC1, PC2, PC3 | Training Set | 1.00 | 1.00 | 1.00 | 1.00 | 1.00 | |
| Prediction Set | 1.00 | 1.00 | 1.00 | 1.00 | 1.00 | ||
| Total Set | 1.00 | 1.00 | 1.00 | 1.00 | 1.00 |
| Model | Score Data | Data Set | Accuracy | Sensitivity | Specificity | Positive Predicted Value | Negative Predicted Value |
|---|---|---|---|---|---|---|---|
| PCA-LDA | PC1, PC2 | Training Set | 1.00 | 1.00 | 1.00 | 1.00 | 1.00 |
| Prediction Set | 1.00 | 1.00 | 1.00 | 1.00 | 1.00 | ||
| Total Set | 1.00 | 1.00 | 1.00 | 1.00 | 1.00 | ||
| PC1, PC3 | Training Set | 1.00 | 1.00 | 1.00 | 1.00 | 1.00 | |
| Prediction Set | 1.00 | 1.00 | 1.00 | 1.00 | 1.00 | ||
| Total Set | 1.00 | 1.00 | 1.00 | 1.00 | 1.00 | ||
| PC2, PC3 | Training Set | 0.54 | 0.43 | 0.64 | 0.55 | 0.53 | |
| Prediction Set | 0.43 | 0.43 | 0.43 | 0.43 | 0.43 | ||
| Total Set | 0.50 | 0.43 | 0.57 | 0.50 | 0.50 | ||
| PC1, PC2, PC3 | Training Set | 1.00 | 1.00 | 1.00 | 1.00 | 1.00 | |
| Prediction Set | 1.00 | 1.00 | 1.00 | 1.00 | 1.00 | ||
| Total Set | 1.00 | 1.00 | 1.00 | 1.00 | 1.00 | ||
| PCA-SVM | PC1, PC2 | Training Set | 1.00 | 1.00 | 1.00 | 1.00 | 1.00 |
| Prediction Set | 1.00 | 1.00 | 1.00 | 1.00 | 1.00 | ||
| Total Set | 1.00 | 1.00 | 1.00 | 1.00 | 1.00 | ||
| PC1, PC3 | Training Set | 1.00 | 1.00 | 1.00 | 1.00 | 1.00 | |
| Prediction Set | 1.00 | 1.00 | 1.00 | 1.00 | 1.00 | ||
| Total Set | 1.00 | 1.00 | 1.00 | 1.00 | 1.00 | ||
| PC2, PC3 | Training Set | 0.96 | 1.00 | 0.93 | 0.93 | 1.00 | |
| Prediction Set | 0.93 | 1.00 | 0.86 | 0.88 | 1.00 | ||
| Total Set | 0.95 | 1.00 | 0.90 | 0.91 | 1.00 | ||
| PC1, PC2, PC3 | Training Set | 1.00 | 1.00 | 1.00 | 1.00 | 1.00 | |
| Prediction Set | 1.00 | 1.00 | 1.00 | 1.00 | 1.00 | ||
| Total Set | 1.00 | 1.00 | 1.00 | 1.00 | 1.00 |
| Model | Scores Data | Data Set | Accuracy | Sensitivity | Specificity | Positive Predicted Value | Negative Predicted Value |
|---|---|---|---|---|---|---|---|
| PCA-LDA | PC1, PC2 | Training Set | 1.00 | 1.00 | 1.00 | 1.00 | 1.00 |
| Prediction Set | 1.00 | 1.00 | 1.00 | 1.00 | 1.00 | ||
| Total Set | 1.00 | 1.00 | 1.00 | 1.00 | 1.00 | ||
| PCA-SVM | PC1, PC2 | Training Set | 1.00 | 1.00 | 1.00 | 1.00 | 1.00 |
| Prediction Set | 1.00 | 1.00 | 1.00 | 1.00 | 1.00 | ||
| Total Set | 1.00 | 1.00 | 1.00 | 1.00 | 1.00 |
Disclaimer/Publisher’s Note: The statements, opinions and data contained in all publications are solely those of the individual author(s) and contributor(s) and not of MDPI and/or the editor(s). MDPI and/or the editor(s) disclaim responsibility for any injury to people or property resulting from any ideas, methods, instructions or products referred to in the content. |
© 2023 by the authors. Licensee MDPI, Basel, Switzerland. This article is an open access article distributed under the terms and conditions of the Creative Commons Attribution (CC BY) license (https://creativecommons.org/licenses/by/4.0/).
Share and Cite
Pankin, D.; Povolotckaia, A.; Borisov, E.; Povolotskiy, A.; Borzenko, S.; Gulyaev, A.; Gerasimenko, S.; Dorochov, A.; Khamuev, V.; Moskovskiy, M. Investigation of Spectroscopic Peculiarities of Ergot-Infected Winter Wheat Grains. Foods 2023, 12, 3426. https://doi.org/10.3390/foods12183426
Pankin D, Povolotckaia A, Borisov E, Povolotskiy A, Borzenko S, Gulyaev A, Gerasimenko S, Dorochov A, Khamuev V, Moskovskiy M. Investigation of Spectroscopic Peculiarities of Ergot-Infected Winter Wheat Grains. Foods. 2023; 12(18):3426. https://doi.org/10.3390/foods12183426
Chicago/Turabian StylePankin, Dmitrii, Anastasia Povolotckaia, Eugene Borisov, Alexey Povolotskiy, Sergey Borzenko, Anatoly Gulyaev, Stanislav Gerasimenko, Alexey Dorochov, Viktor Khamuev, and Maksim Moskovskiy. 2023. "Investigation of Spectroscopic Peculiarities of Ergot-Infected Winter Wheat Grains" Foods 12, no. 18: 3426. https://doi.org/10.3390/foods12183426
APA StylePankin, D., Povolotckaia, A., Borisov, E., Povolotskiy, A., Borzenko, S., Gulyaev, A., Gerasimenko, S., Dorochov, A., Khamuev, V., & Moskovskiy, M. (2023). Investigation of Spectroscopic Peculiarities of Ergot-Infected Winter Wheat Grains. Foods, 12(18), 3426. https://doi.org/10.3390/foods12183426