
Applications of Solution NMR Spectroscopy in Quality Assessment and Authentication of Bovine Milk
 , ,
, ,  and
and
Abstract
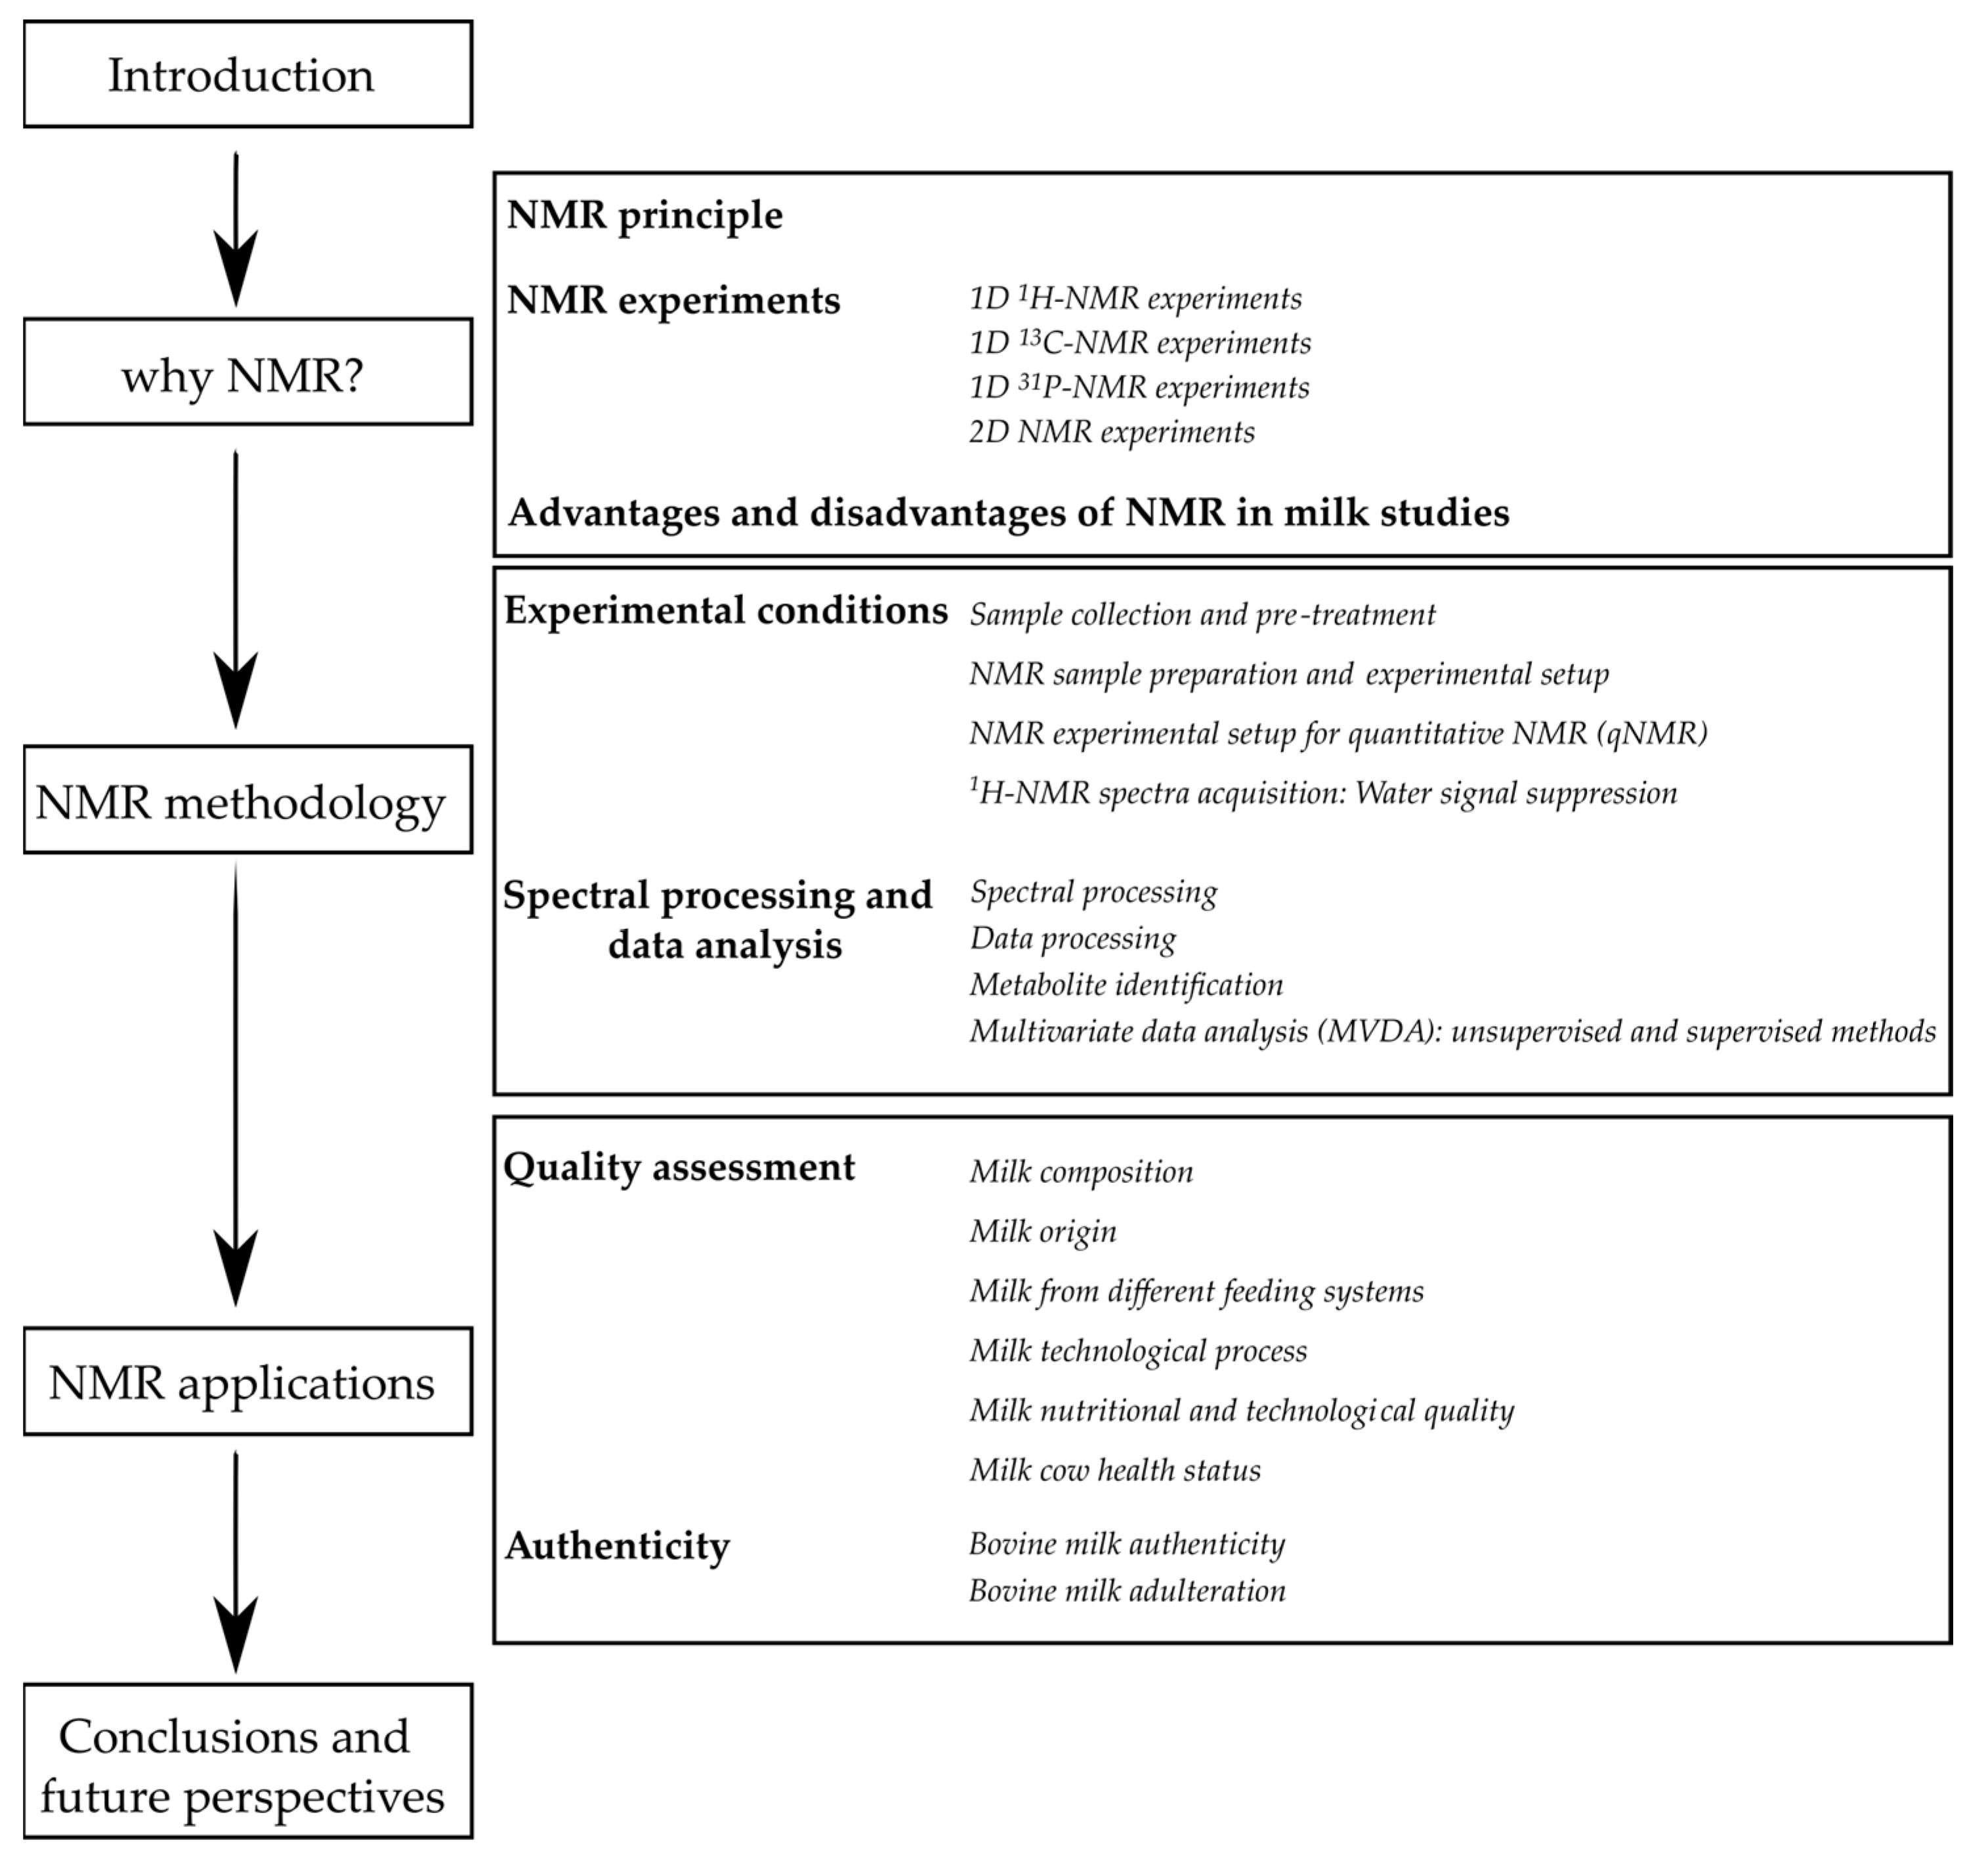
:1. Introduction
2. NMR Principle
3. NMR Experiments on Milk
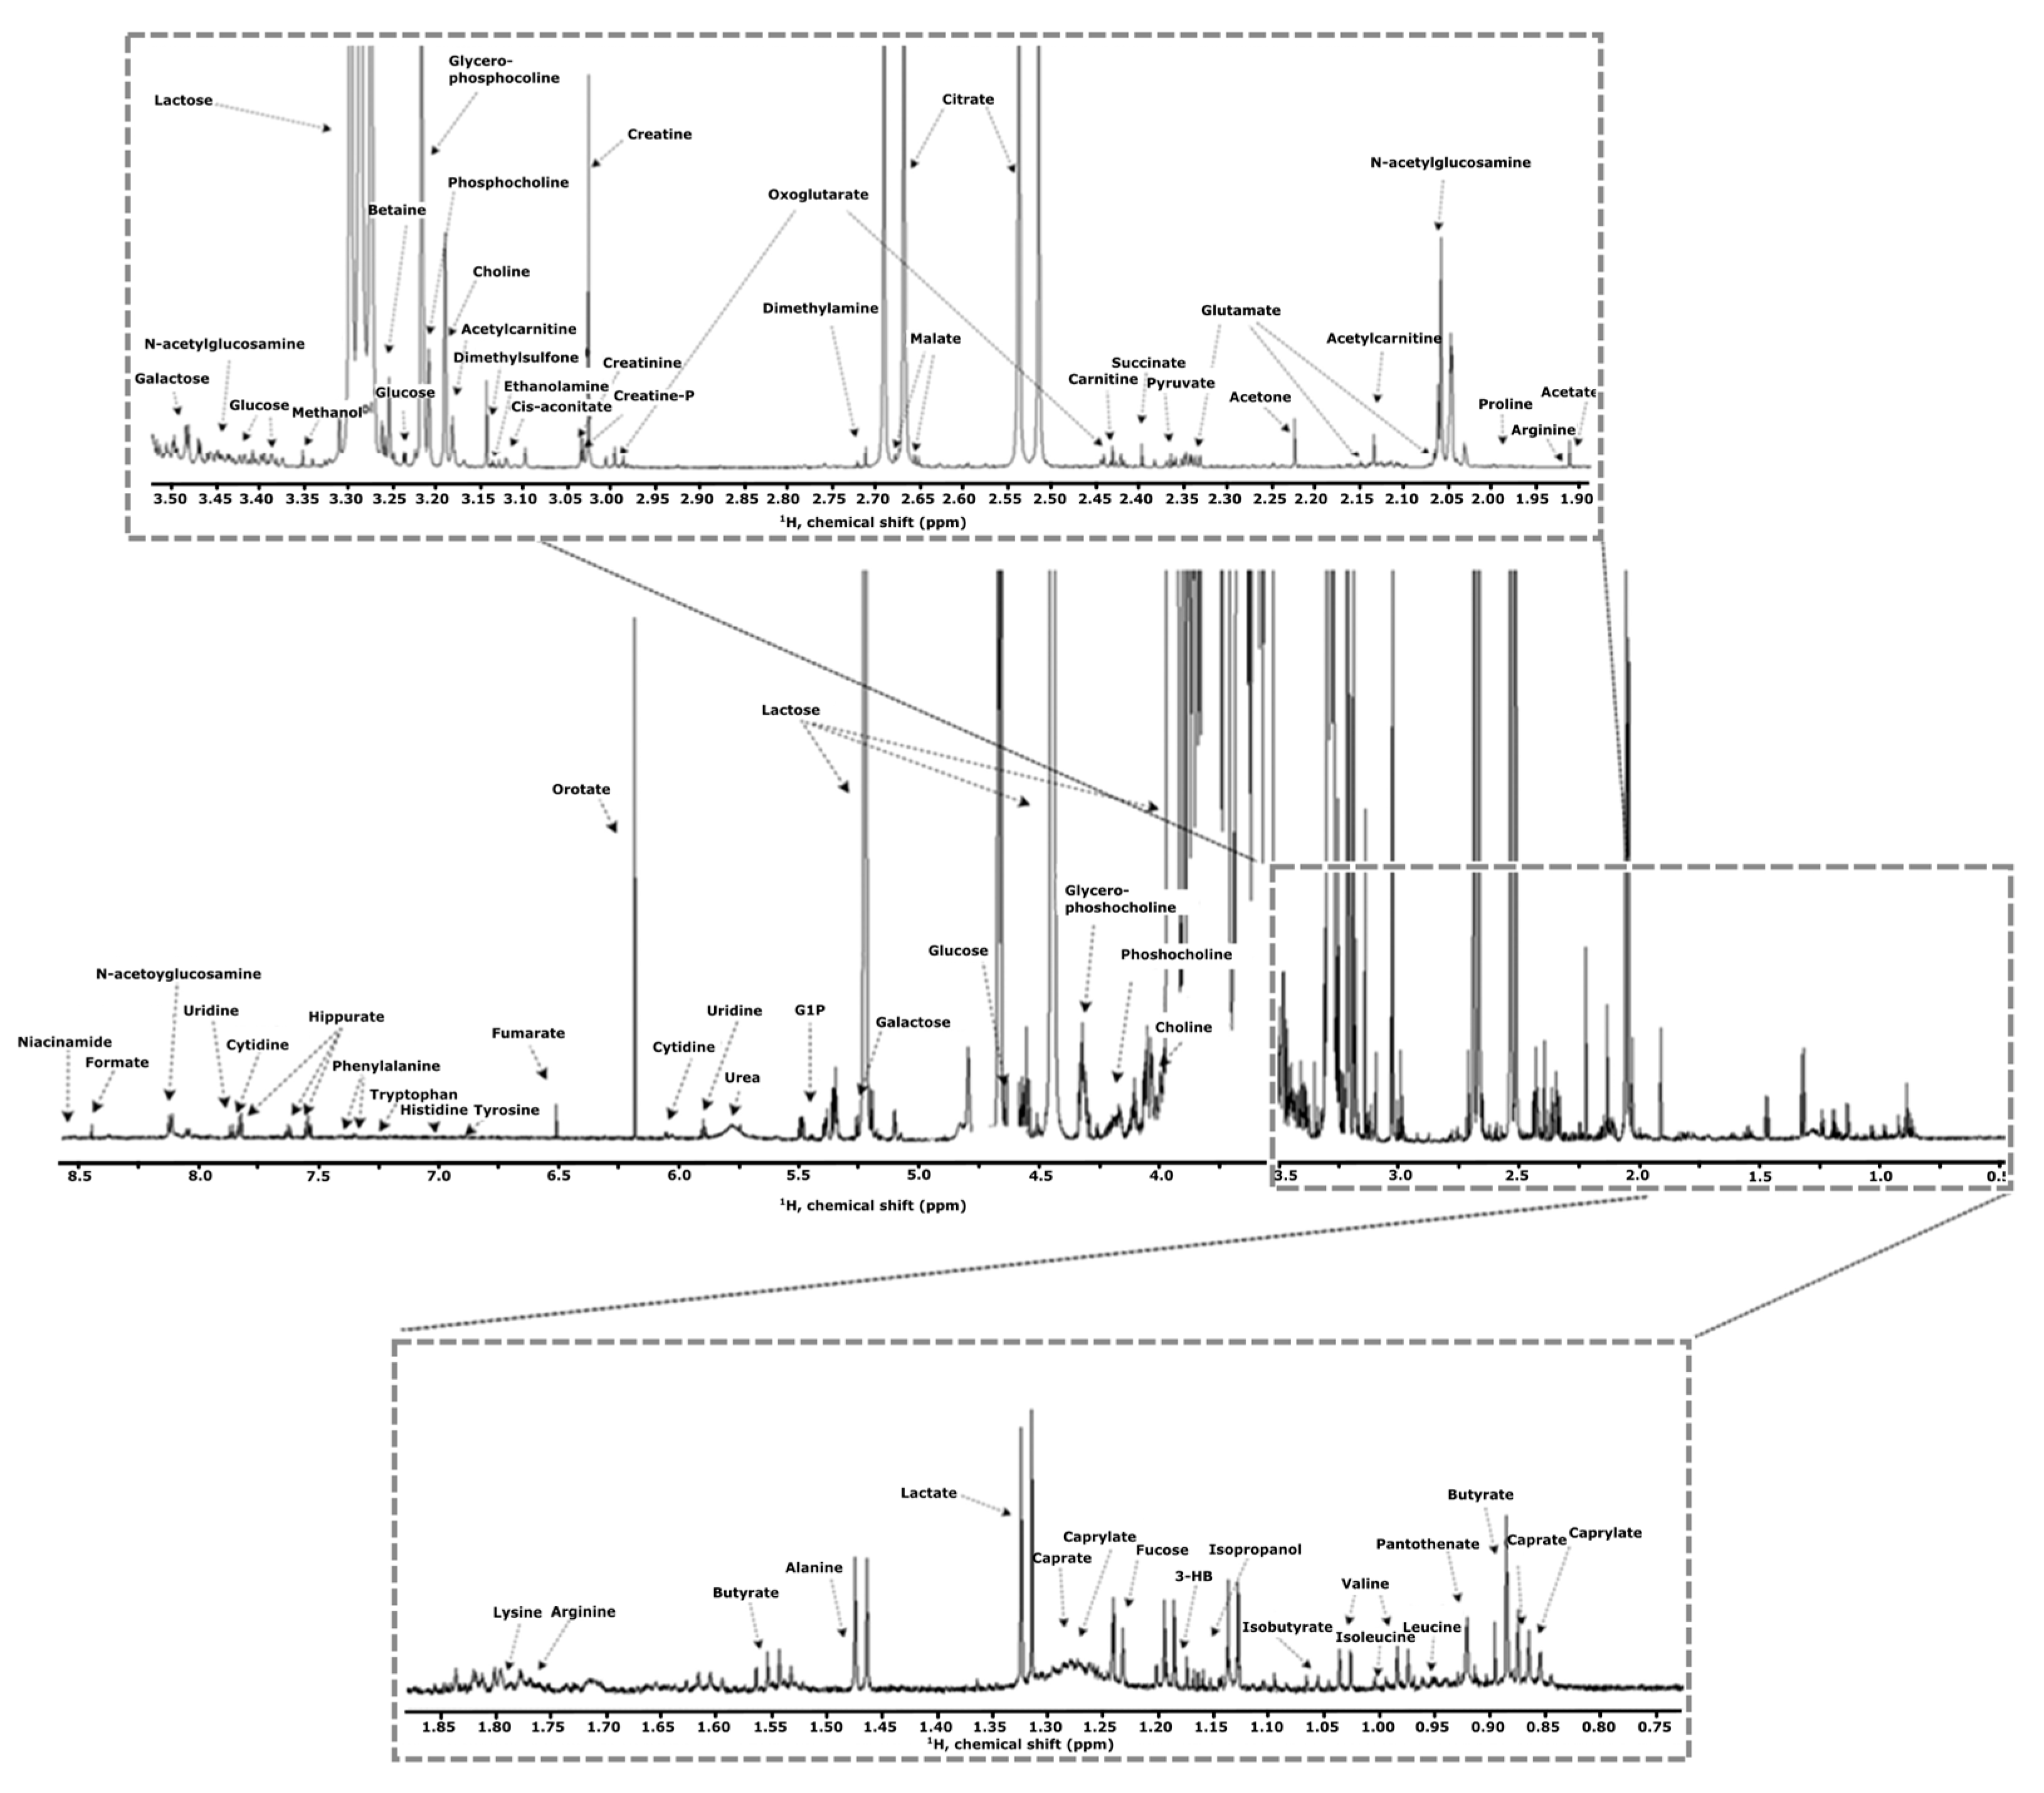
3.1. 1D 1H-NMR Experiments
3.2. 1D 13C-NMR Experiments
3.3. 1D 31P-NMR Experiments
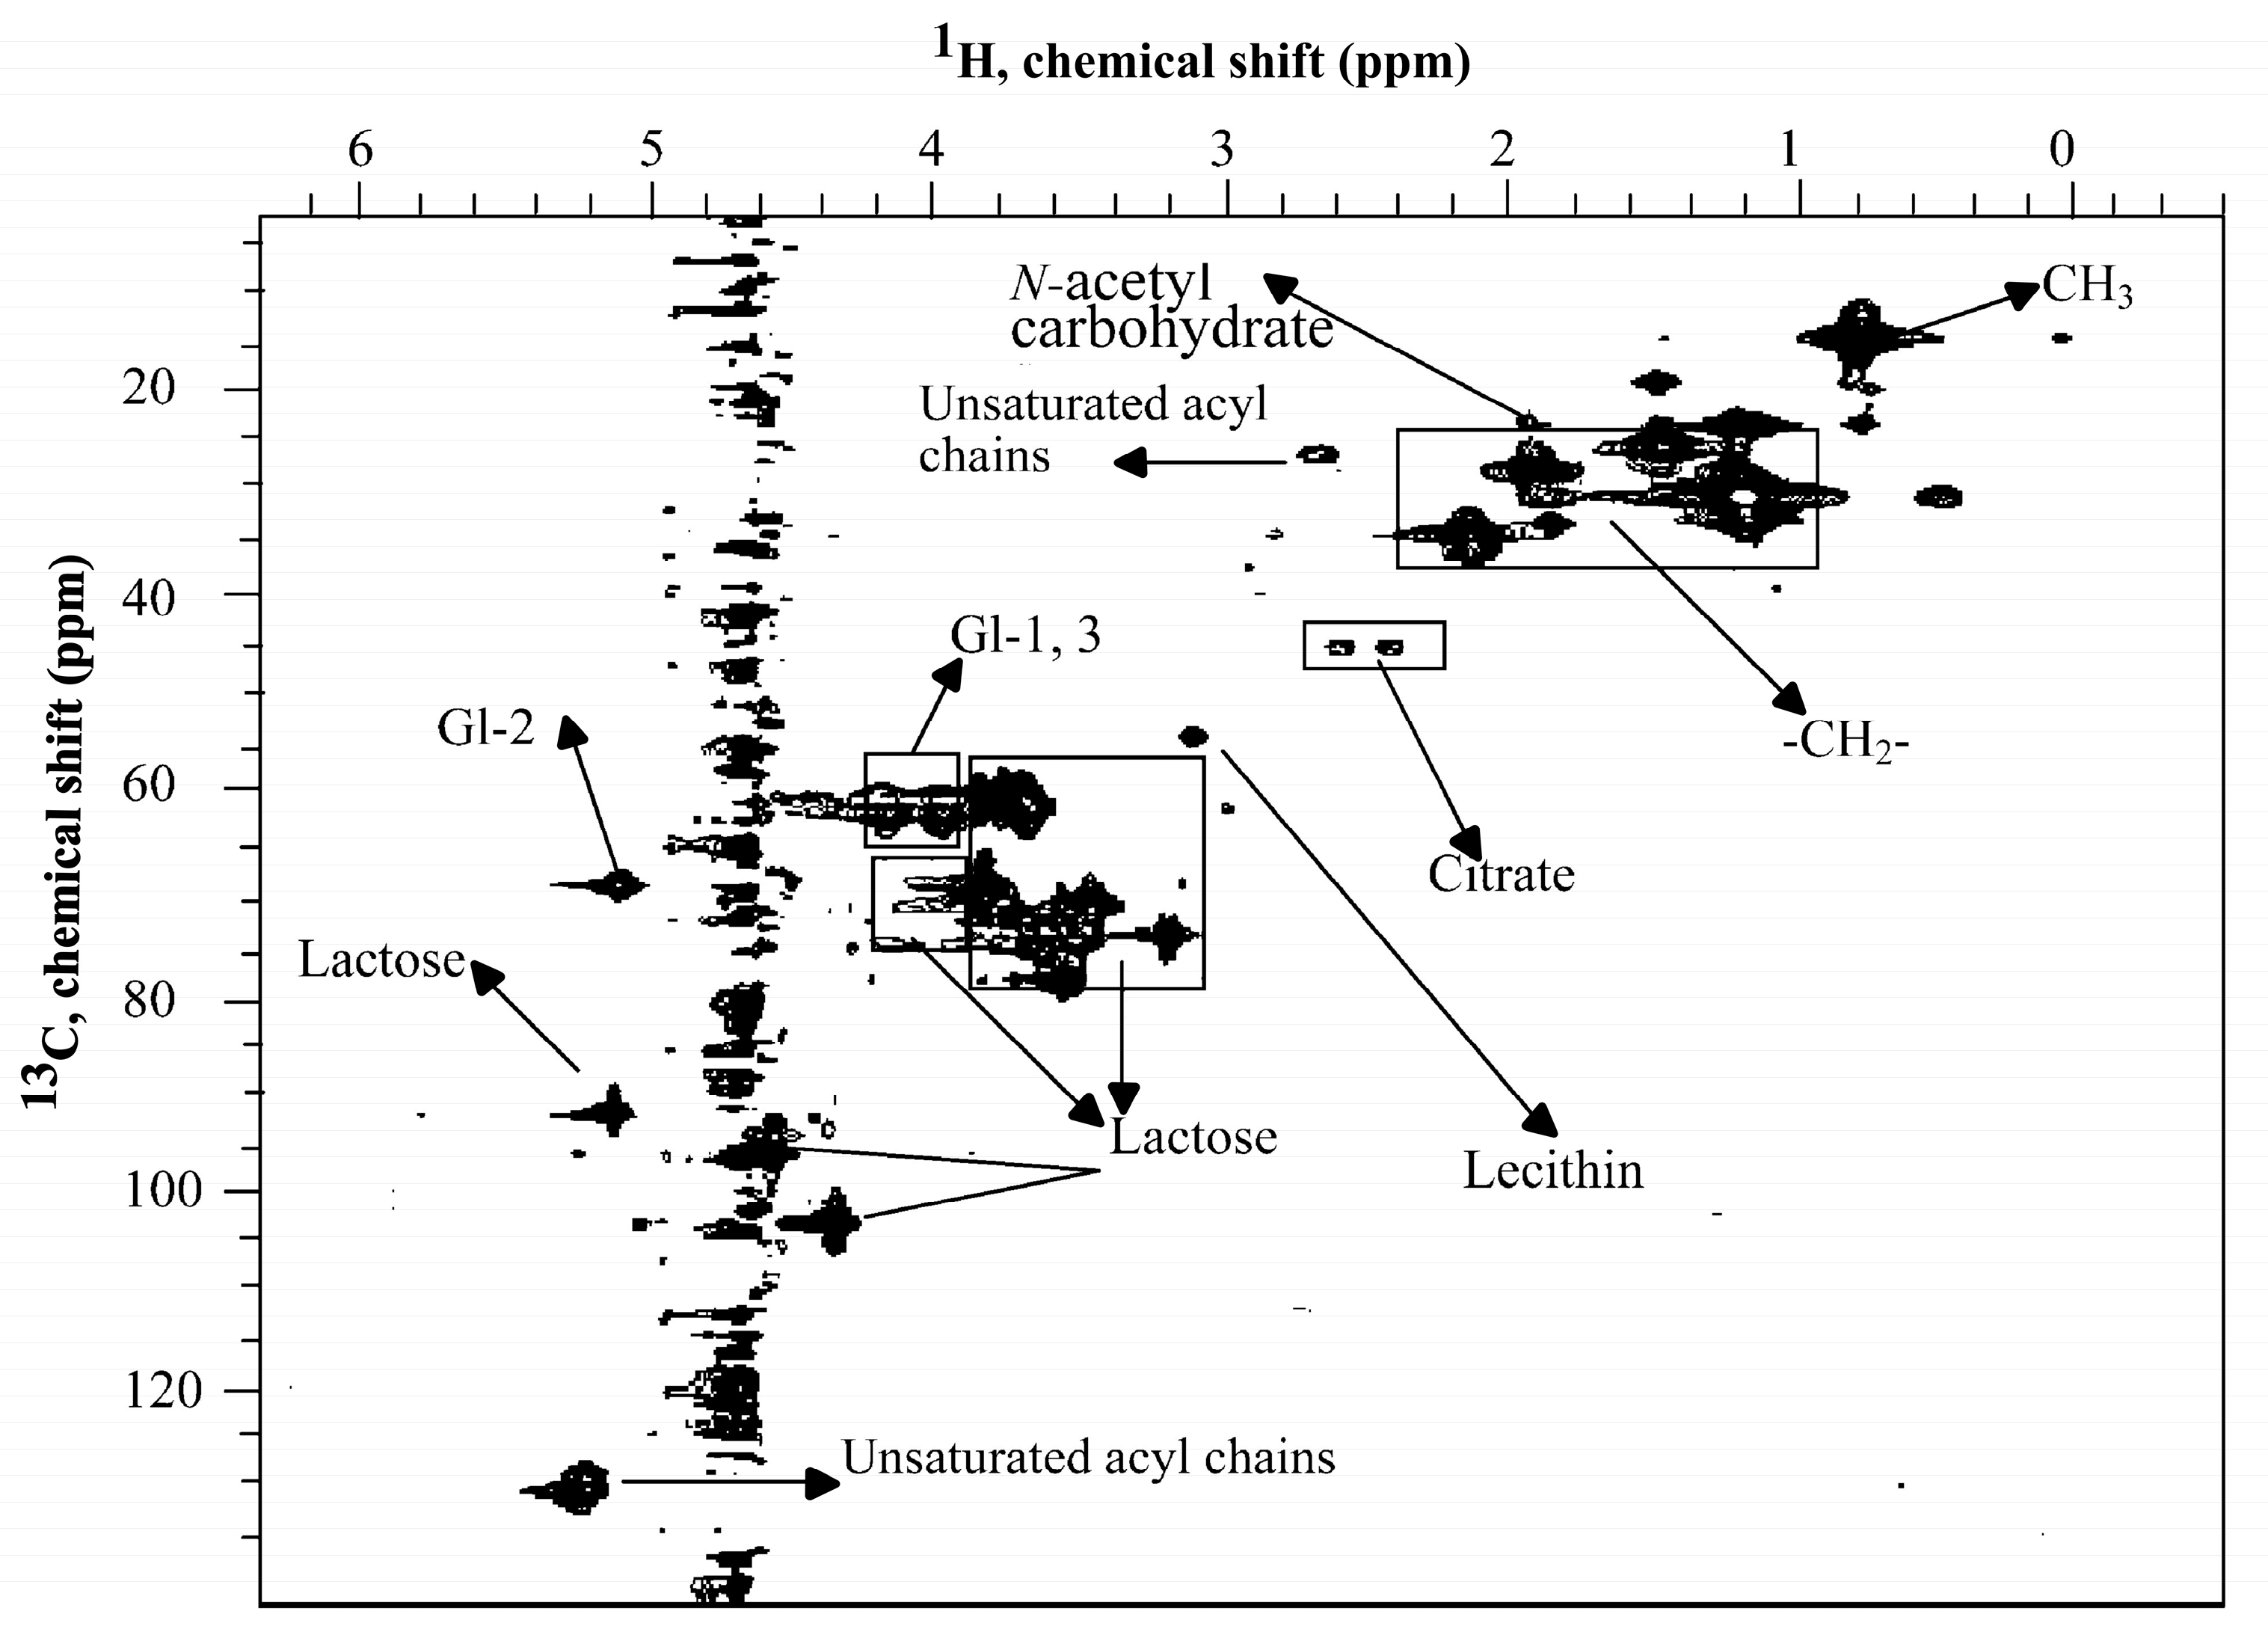
3.4. Two-Dimensional (2D) NMR Experiments
4. Advantages and Disadvantages of NMR in Milk Studies
5. Experimental Conditions
5.1. Sample Collection and Pre-Treatment
5.2. NMR Sample Preparation and Experimental Setup
NMR Experimental Setup for Quantitative NMR (qNMR)
5.3. 1H-NMR Spectra Acquisition: Water Signal Suppression
6. Spectral Processing and Data Analysis
6.1. Spectral Processing
6.2. Data Processing
6.3. Metabolite Identification
6.4. Multivariate Data Analysis (MVDA): Unsupervised and Supervised Methods
7. NMR Applications on Bovine Milk: Quality Assessment
7.1. Milk Composition
7.2. Milk Origin
7.3. Milk from Different Feeding Systems
7.4. Milk Technological Process
7.5. Milk Nutritional and Technological Quality
7.6. Milk Cow Health Status
8. NMR Applications on Bovine Milk: Authenticity
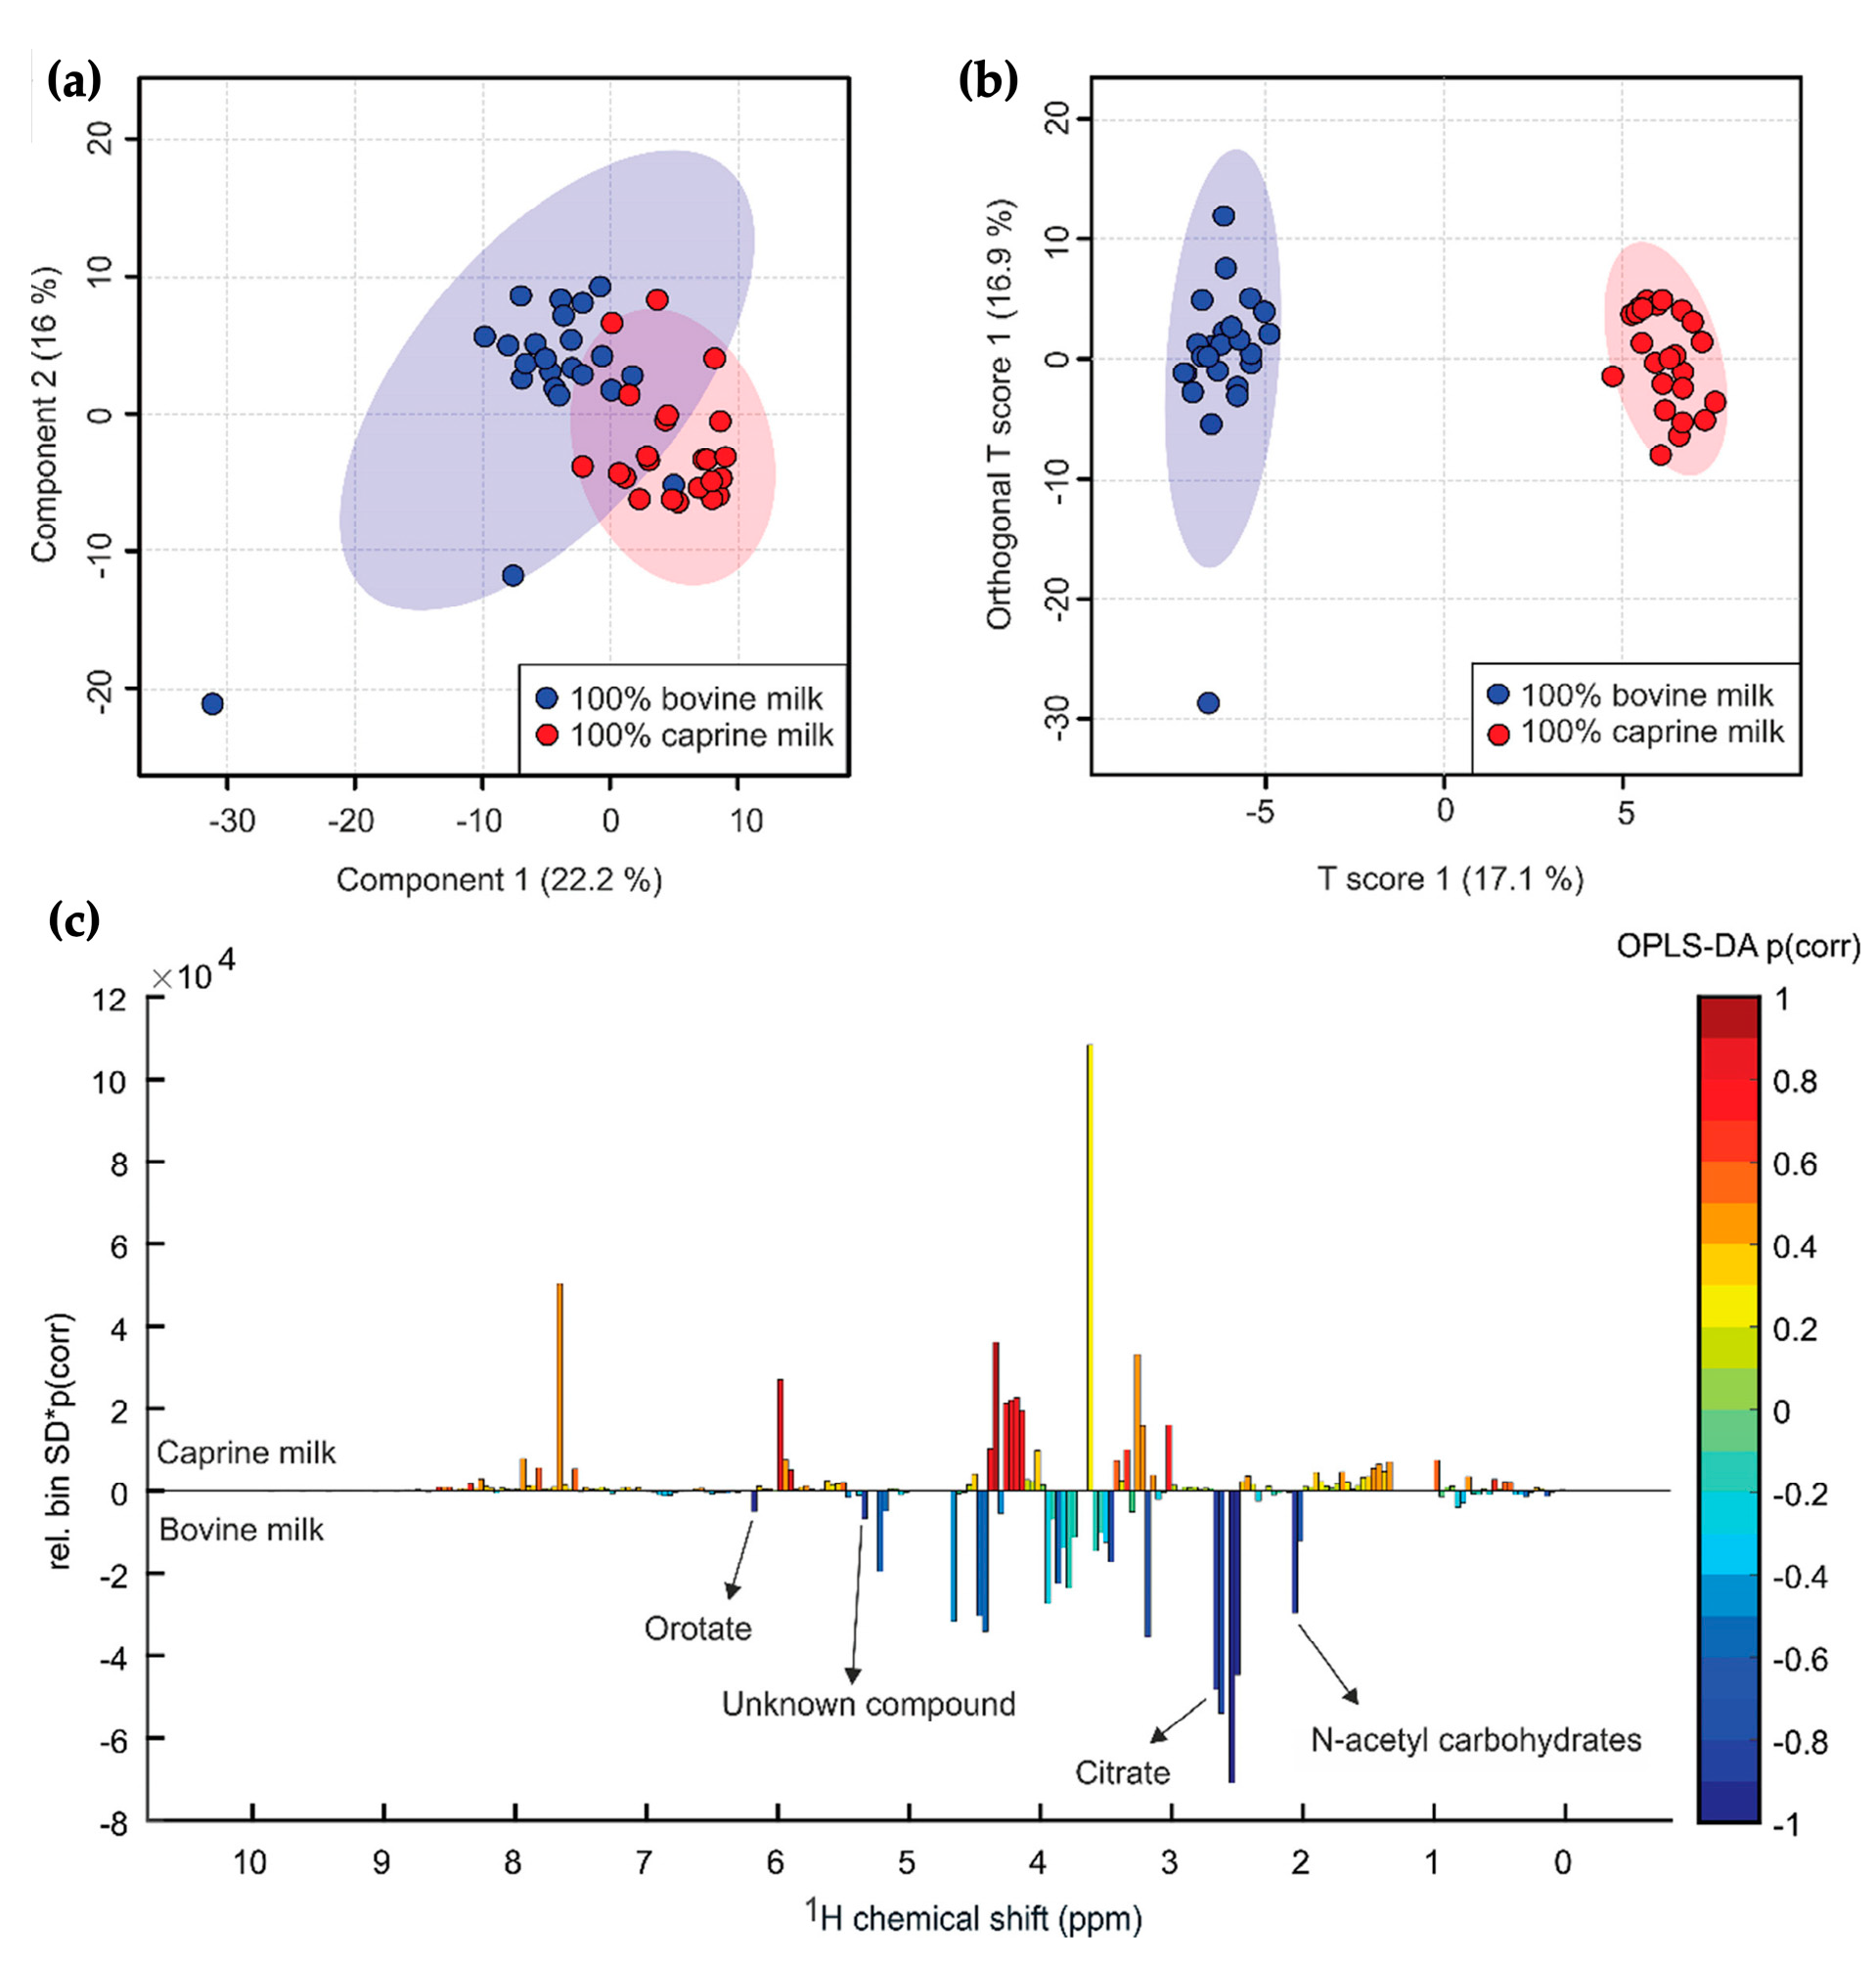
8.1. Bovine Milk Authenticity
8.2. Bovine Milk Adulteration
9. Conclusions and Future Perspectives
Author Contributions
Funding
Acknowledgments
Conflicts of Interest
References
- Emwas, A.-H.; Roy, R.; McKay, R.T.; Tenori, L.; Saccenti, E.; Gowda, G.A.N.; Raftery, D.; Alahmari, F.; Jaremko, L.; Jaremko, M.; et al. NMR Spectroscopy for Metabolomics Research. Metabolites 2019, 9, 123. [Google Scholar] [CrossRef]
- Odeblad, E.; Westin, B. Proton Magnetic Resonance of Human Milk. Acta Radiol. 1958, 49, 389–392. [Google Scholar] [CrossRef]
- Chaudhary, V.; Kajla, P.; Dewan, A.; Pandiselvam, R.; Socol, C.T.; Maerescu, C.M. Spectroscopic Techniques for Authentication of Animal Origin Foods. Front. Nutr. 2022, 9, 979205. [Google Scholar] [CrossRef]
- Maher, A.; Rochfort, S. Applications of NMR in Dairy Research. Metabolites 2014, 4, 131–141. [Google Scholar] [CrossRef]
- Suh, J.H. Critical Review: Metabolomics in Dairy Science—Evaluation of Milk and Milk Product Quality. Food Res. Int. 2022, 154, 110984. [Google Scholar] [CrossRef]
- Sundekilde, U.; Larsen, L.; Bertram, H. NMR-Based Milk Metabolomics. Metabolites 2013, 3, 204–222. [Google Scholar] [CrossRef]
- Scano, P.; Cusano, E.; Caboni, P.; Consonni, R. NMR Metabolite Profiles of Dairy: A Review. Int. Dairy J. 2019, 90, 56–67. [Google Scholar] [CrossRef]
- Qin, C.; Liu, L.; Wang, Y.; Leng, T.; Zhu, M.; Gan, B.; Xie, J.; Yu, Q.; Chen, Y. Advancement of Omics Techniques for Chemical Profile Analysis and Authentication of Milk. Trends Food Sci. Technol. 2022, 127, 114–128. [Google Scholar] [CrossRef]
- Belloque, J. Application of NMR Spectroscopy to Milk and Dairy Products. Trends Food Sci. Technol. 1999, 10, 313–320. [Google Scholar] [CrossRef]
- Kamal, M.; Karoui, R. Analytical Methods Coupled with Chemometric Tools for Determining the Authenticity and Detecting the Adulteration of Dairy Products: A Review. Trends Food Sci. Technol. 2015, 46, 27–48. [Google Scholar] [CrossRef]
- Karoui, R.; Debaerdemaeker, J. A Review of the Analytical Methods Coupled with Chemometric Tools for the Determination of the Quality and Identity of Dairy Products. Food Chem. 2007, 102, 621–640. [Google Scholar] [CrossRef]
- Hatzakis, E. Nuclear Magnetic Resonance (NMR) Spectroscopy in Food Science: A Comprehensive Review: NMR Spectroscopy in Food Science. Compr. Rev. Food Sci. Food Saf. 2019, 18, 189–220. [Google Scholar] [CrossRef]
- Snytnikova, O.A.; Khlichkina, A.A.; Sagdeev, R.Z.; Tsentalovich, Y.P. Evaluation of Sample Preparation Protocols for Quantitative NMR-Based Metabolomics. Metabolomics 2019, 15. [Google Scholar] [CrossRef]
- Foroutan, A.; Guo, A.C.; Vazquez-Fresno, R.; Lipfert, M.; Zhang, L.; Zheng, J.; Badran, H.; Budinski, Z.; Mandal, R.; Ametaj, B.N.; et al. Chemical Composition of Commercial Cow’s Milk. J. Agric. Food Chem. 2019, 67, 4897–4914. [Google Scholar] [CrossRef]
- Luangwilai, M.; Duangmal, K.; Chantaprasarn, N.; Settachaimongkon, S. Comparative Metabolite Profiling of Raw Milk from Subclinical and Clinical Mastitis Cows Using 1H-NMR Combined with Chemometric Analysis. Int. J. Food Sci. Technol. 2021, 56, 493–503. [Google Scholar] [CrossRef]
- Zhu, C.; Tang, K.; Lu, X.; Tang, J.; Laghi, L. An Untargeted Metabolomics Investigation of Milk from Dairy Cows with Clinical Mastitis by 1H-NMR. Foods 2021, 10. [Google Scholar] [CrossRef]
- Lanza, I.; Lolli, V.; Segato, S.; Caligiani, A.; Contiero, B.; Lotto, A.; Galaverna, G.; Magrin, L.; Cozzi, G. Use of GC–MS and 1H NMR Low-Level Data Fusion as an Advanced and Comprehensive Metabolomic Approach to Discriminate Milk from Dairy Chains Based on Different Types of Forage. Int. Dairy J. 2021, 123, 105174. [Google Scholar] [CrossRef]
- Lamanna, R.; Braca, A.; Paolo, E.D.; Imparato, G. Identification of Milk Mixtures by 1H NMR Profiling. Magn. Reson. Chem. 2011, 49. [Google Scholar] [CrossRef]
- Zhu, D.; Kebede, B.; Chen, G.; McComb, K.; Frew, R. Impact of Freeze-Drying and Subsequent Storage on Milk Metabolites Based on 1H NMR and UHPLC-QToF/MS. Food Control 2020, 116. [Google Scholar] [CrossRef]
- Lemos, Á.T.; Goodfellow, B.J.; Delgadillo, I.; Saraiva, J.A. NMR Metabolic Composition Profiling of High Pressure Pasteurized Milk Preserved by Hyperbaric Storage at Room Temperature. Food Control 2022, 134, 108660. [Google Scholar] [CrossRef]
- Yang, S.; Liu, G.; Munk, D.M.E.; Qin, Z.; Petersen, M.A.; Cardoso, D.R.; Otte, J.; Ahrné, L. Cycled High Hydrostatic Pressure Processing of Whole and Skimmed Milk: Effects on Physicochemical Properties. Innov. Food Sci. Emerg. Technol. 2020, 63. [Google Scholar] [CrossRef]
- Bergana, M.M.; Adams, K.M.; Harnly, J.; Moore, J.C.; Xie, Z. Non-Targeted Detection of Milk Powder Adulteration by 1H NMR Spectroscopy and Conformity Index Analysis. J. Food Compos. Anal. 2019, 78, 49–58. [Google Scholar] [CrossRef]
- Zhao, Y.; Chen, H.; Feng, J.; Chen, Z.; Cai, S. 1H NMR-Based Compositional Identification of Different Powdered Infant Formulas. Food Chem. 2017, 230, 164–173. [Google Scholar] [CrossRef]
- Koskela, H. Chapter 1 Quantitative 2D NMR Studies. In Annual Reports on NMR Spectroscopy; Elsevier: Amsterdam, The Netherlands, 2009; Volume 66, pp. 1–31. ISBN 978-0-12-374737-2. [Google Scholar]
- Tang, F.; Vasas, M.; Hatzakis, E.; Spyros, A. Magnetic Resonance Applications in Food Analysis. In Annual Reports on NMR Spectroscopy; Elsevier, Amsterdam, The Netherlands, 2019; Volume 98, pp. 239–306, ISBN 978-0-08-102910-7.
- Andreotti, G.; Lamanna, R.; Trivellone, E.; Motta, A. 13C NMR Spectra of TAG: An Easy Way to Distinguish Milks from Different Animal Species. JAOCS J. Am. Oil Chem. Soc. 2002, 79, 123–127. [Google Scholar] [CrossRef]
- Phuenpong, T.; Kongboonkird, M.; Duangmal, K.; Lerdvorasap, W.; Suksawwawimon, M.; Mekboonsonglarp, W.; Nuamchit, J.; Chantaprasarn, N.; Settachaimongkon, S. Molecular Discrimination between Organic and Conventional Liquid Milk Products in Thailand Using 1H-NMR Metabolomics Approach. Trop. Anim. Sci. J. 2021, 44, 478–488. [Google Scholar] [CrossRef]
- Erich, S.; Schill, S.; Annweiler, E.; Waiblinger, H.U.; Kuballa, T.; Lachenmeier, D.W.; Monakhova, Y.B. Combined Chemometric Analysis of 1H NMR, 13C NMR and Stable Isotope Data to Differentiate Organic and Conventional Milk. Food Chem. 2015, 188, 1–7. [Google Scholar] [CrossRef] [PubMed]
- Tsiafoulis, C.; Papaemmanouil, C.; Alivertis, D.; Tzamaloukas, O.; Miltiadou, D.; Balayssac, S.; Malet-Martino, M.; Gerothanassis, I. NMR-Based Μetabolomics of the Lipid Fraction of Organic and Conventional Bovine Milk. Molecules 2019, 24, 1067. [Google Scholar] [CrossRef]
- Renou, J.P.; Deponge, C.; Gachon, P.; Bonnefoy, J.C.; Coulon, J.B.; Garel, J.P.; Vérité, R.; Ritz, P. Characterization of Animal Products According to Geographic Origin and Feeding Diet Using Nuclear Magnetic Resonance and Isotope Ratio Mass Spectrometry: Cow Milk. Food Chem. 2004, 85, 63–66. [Google Scholar] [CrossRef]
- Bruschetta, G.; Notti, A.; Lando, G.; Ferlazzo, A. A Promising 31P NMR-Multivariate Analysis Approach for the Identification of Milk Phosphorylated Metabolites and for Rapid Authentication of Milk Samples. Biochem. Biophys. Rep. 2021, 27. [Google Scholar] [CrossRef]
- Belloque, J. High-Resolution NMR of Milk and Milk Proteins. In Modern Magnetic Resonance; Webb, G.A., Ed.; Springer: Dordrecht, The Netherlands, 2006; pp. 1631–1635. ISBN 978-1-4020-3894-5. [Google Scholar]
- Garcia, C.; Lutz, N.W.; Confort-Gouny, S.; Cozzone, P.J.; Armand, M.; Bernard, M. Phospholipid Fingerprints of Milk from Different Mammalians Determined by 31P NMR: Towards Specific Interest in Human Health. Food Chem. 2012, 135, 1777–1783. [Google Scholar] [CrossRef]
- Wei, W.; Li, D.; Jiang, C.; Zhang, X.; Zhang, X.; Jin, Q.; Zhang, X.; Wang, X. Phospholipid Composition and Fat Globule Structure II: Comparison of Mammalian Milk from Five Different Species. Food Chem. 2022, 388. [Google Scholar] [CrossRef] [PubMed]
- Boiani, M.; Fenelon, M.; FitzGerald, R.J.; Kelly, P.M. Use of 31P NMR and FTIR to Investigate Key Milk Mineral Equilibria and Their Interactions with Micellar Casein during Heat Treatment. Int. Dairy J. 2018, 81, 12–18. [Google Scholar] [CrossRef]
- Hu, F.; Furihata, K.; Ito-Ishida, M.; Kaminogawa, S.; Tanokura, M. Nondestructive Observation of Bovine Milk by NMR Spectroscopy: Analysis of Existing States of Compounds and Detection of New Compounds. J. Agric. Food Chem. 2004, 52, 4969–4974. [Google Scholar] [CrossRef]
- Andreotti, G.; Trivellone, E.; Motta, A. Characterization of Buffalo Milk by 31P-Nuclear Magnetic Resonance Spectroscopy. J. Food Compos. Anal. 2006, 19, 843–849. [Google Scholar] [CrossRef]
- Hu, F.; Furihata, K.; Kato, Y.; Tanokura, M. Nondestructive Quantification of Organic Compounds in Whole Milk without Pretreatment by Two-Dimensional NMR Spectroscopy. J. Agric. Food Chem. 2007, 55, 4307–4311. [Google Scholar] [CrossRef] [PubMed]
- Cui, J.; Zhu, D.; Su, M.; Tan, D.; Zhang, X.; Jia, M.; Chen, G. The Combined Use of 1H and 2D NMR-Based Metabolomics and Chemometrics for Non-Targeted Screening of Biomarkers and Identification of Reconstituted Milk. J. Sci. Food Agric. 2019, 99, 6455–6461. [Google Scholar] [CrossRef]
- Wishart, D.S.; Knox, C.; Guo, A.C.; Eisner, R.; Young, N.; Gautam, B.; Hau, D.D.; Psychogios, N.; Dong, E.; Bouatra, S.; et al. HMDB: A Knowledgebase for the Human Metabolome. Nucleic Acids Res. 2009, 37, D603–D610. [Google Scholar] [CrossRef]
- Atta-ur-Rahman; Choudhary, M.; Atia-tul-Wahab. Solving Problems with NMR Spectroscopy; Elsevier: Amsterdam, The Netherlands, 1996; ISBN 978-0-12-066320-0. [Google Scholar]
- Li, Q.; Yu, Z.; Zhu, D.; Meng, X.; Pang, X.; Liu, Y.; Frew, R.; Chen, H.; Chen, G. The Application of NMR-Based Milk Metabolite Analysis in Milk Authenticity Identification. J. Sci. Food Agric. 2017, 97, 2875–2882. [Google Scholar] [CrossRef] [PubMed]
- Sacco, D.; Brescia, M.A.; Sgaramella, A.; Casiello, G.; Buccolieri, A.; Ogrinc, N.; Sacco, A. Discrimination between Southern Italy and Foreign Milk Samples Using Spectroscopic and Analytical Data. Food Chem. 2009, 114, 1559–1563. [Google Scholar] [CrossRef]
- Tenori, L.; Santucci, C.; Meoni, G.; Morrocchi, V.; Matteucci, G.; Luchinat, C. NMR Metabolomic Fingerprinting Distinguishes Milk from Different Farms. Food Res. Int. 2018, 113, 131–139. [Google Scholar] [CrossRef]
- Sundekilde, U.K.; Gustavsson, F.; Poulsen, N.A.; Glantz, M.; Paulsson, M.; Larsen, L.B.; Bertram, H.C. Association between the Bovine Milk Metabolome and Rennet-Induced Coagulation Properties of Milk. J. Dairy Sci. 2014, 97, 6076–6084. [Google Scholar] [CrossRef]
- Sundekilde, U.K.; Frederiksen, P.D.; Clausen, M.R.; Larsen, L.B.; Bertram, H.C. Relationship between the Metabolite Profile and Technological Properties of Bovine Milk from Two Dairy Breeds Elucidated by NMR-Based Metabolomics. J. Agric. Food Chem. 2011, 59, 7360–7367. [Google Scholar] [CrossRef]
- Consonni, R.; Cagliani, L.R. The Potentiality of NMR-Based Metabolomics in Food Science and Food Authentication Assessment. Magn Reson. Chem. 2019, 57, 558–578. [Google Scholar] [CrossRef]
- Simmler, C.; Napolitano, J.G.; McAlpine, J.B.; Chen, S.-N.; Pauli, G.F. Universal Quantitative NMR Analysis of Complex Natural Samples. Curr. Opin. Biotechnol. 2014, 25, 51–59. [Google Scholar] [CrossRef]
- Rocchetti, G.; O’Callaghan, T.F. Application of Metabolomics to Assess Milk Quality and Traceability. Curr. Opin. Food Sci. 2021, 40, 168–178. [Google Scholar] [CrossRef]
- Sobolev, A.P.; Thomas, F.; Donarski, J.; Ingallina, C.; Circi, S.; Cesare Marincola, F.; Capitani, D.; Mannina, L. Use of NMR Applications to Tackle Future Food Fraud Issues. Trends Food Sci. Technol. 2019, 91, 347–353. [Google Scholar] [CrossRef]
- O’Callaghan, T.F.; Vázquez-Fresno, R.; Serra-Cayuela, A.; Dong, E.; Mandal, R.; Hennessy, D.; McAuliffe, S.; Dillon, P.; Wishart, D.S.; Stanton, C.; et al. Pasture Feeding Changes the Bovine Rumen and Milk Metabolome. Metabolites 2018, 8. [Google Scholar] [CrossRef] [PubMed]
- Sunds, A.V.; Sundekilde, U.K.; Poulsen, N.A.; Larsen, L.B. Association between Udder Inflammation and Glycosidase Activities and Free Sugar Levels in Bovine Milk. Int. Dairy J. 2021, 120. [Google Scholar] [CrossRef]
- Xu, W.; Knegsel, A.V.; Saccenti, E.; Hoeij, R.V.; Kemp, B.; Vervoort, J. Metabolomics of Milk Reflects a Negative Energy Balance in Cows. J. Proteome Res. 2020, 19, 2942–2949. [Google Scholar] [CrossRef]
- Zhu, D.; Kebede, B.; Chen, G.; McComb, K.; Frew, R. Effects of the Vat Pasteurization Process and Refrigerated Storage on the Bovine Milk Metabolome. J. Dairy Sci. 2020, 103, 2077–2088. [Google Scholar] [CrossRef]
- Rysova, L.; Legarova, V.; Pacakova, Z.; Hanus, O.; Nemeckova, I.; Klimesova, M.; Havlik, J. Detection of Bovine Milk Adulteration in Caprine Milk with N-Acetyl Carbohydrate Biomarkers by Using 1H Nuclear Magnetic Resonance Spectroscopy. J. Dairy Sci. 2021, 104, 9583–9595. [Google Scholar] [CrossRef]
- Lachenmeier, D.W.; Eberhard, H.; Fang, F.; Birk, S.; Peter, D.; Constanze, S.; Manfred, S. NMR-Spectroscopy for Nontargeted Screening and Simultaneous Quantification of Health-Relevant Compounds in Foods: The Example of Melamine. J. Agric. Food Chem. 2009, 57, 7194–7199. [Google Scholar] [CrossRef]
- Soyler, A.; Cikrikci, S.; Cavdaroglu, C.; Bouillaud, D.; Farjon, J.; Giraudeau, P.; Oztop, M.H. Multi-Scale Benchtop 1H NMR Spectroscopy for Milk Analysis. LWT 2021, 139. [Google Scholar] [CrossRef]
- Santos, P.M.; Pereira-Filho, E.R.; Colnago, L.A. Detection and Quantification of Milk Adulteration Using Time Domain Nuclear Magnetic Resonance (TD-NMR). Microchem. J. 2016, 124, 15–19. [Google Scholar] [CrossRef]
- Coimbra, P.T.; Bathazar, C.F.; Guimarães, J.T.; Coutinho, N.M.; Pimentel, T.C.; Neto, R.P.C.; Esmerino, E.A.; Freitas, M.Q.; Silva, M.C.; Tavares, M.I.B.; et al. Detection of Formaldehyde in Raw Milk by Time Domain Nuclear Magnetic Resonance and Chemometrics. Food Control 2020, 110, 107006. [Google Scholar] [CrossRef]
- Yamazaki, T.; Nakamura, S.; Saito, T. Optimization of Sample Preparation for Accurate Results in Quantitative NMR Spectroscopy. Metrologia 2017, 54, 224–228. [Google Scholar] [CrossRef]
- Nagana Gowda, G.A.; Raftery, D. NMR-Based Metabolomics. In Cancer Metabolomics; Hu, S., Ed.; Advances in Experimental Medicine and Biology; Springer International Publishing: Cham, Switzerland, 2021; Volume 1280, pp. 19–37. ISBN 978-3-030-51651-2. [Google Scholar]
- Yanibada, B.E.E.; Boudra, H.; Debrauwer, L.; Martin, E.; Morgavi, D.P.; Canlet, E.; Boudra, H. Evaluation of Sample Preparation Methods for NMR-Based Metabolomics of Cow Milk. Heliyon 2018, 4, e00856. [Google Scholar] [CrossRef]
- Dais, P.; Hatzakis, E. Quality Assessment and Authentication of Virgin Olive Oil by NMR Spectroscopy: A Critical Review. Anal. Chim. Acta 2013, 765, 1–27. [Google Scholar] [CrossRef]
- Zhu, D.; Kebede, B.; McComb, K.; Hayman, A.; Chen, G.; Frew, R. Milk Biomarkers in Relation to Inherent and External Factors Based on Metabolomics. Trends Food Sci. Technol. 2021, 109, 51–64. [Google Scholar] [CrossRef]
- Hanson, J.E. NMR Spectroscopy in Nondeuterated Solvents (No-D NMR): Applications in the Undergraduate Organic Laboratory. In ACS Symposium Series; Soulsby, D., Anna, L.J., Wallner, A.S., Eds.; American Chemical Society: Washington, DC, USA, 2013; ISBN 978-0-8412-2794-1. [Google Scholar]
- Cao, R.; Liu, X.; Liu, Y.; Zhai, X.; Cao, T.; Wang, A.; Qiu, J. Applications of Nuclear Magnetic Resonance Spectroscopy to the Evaluation of Complex Food Constituents. Food Chem. 2021, 342, 128258. [Google Scholar] [CrossRef]
- Bharti, S.K.; Roy, R. Quantitative 1H NMR Spectroscopy. TrAC Trends Anal. Chem. 2012, 35, 5–26. [Google Scholar] [CrossRef]
- Emwas, A.-H.; Saccenti, E.; Gao, X.; McKay, R.T.; Dos Santos, V.A.P.M.; Roy, R.; Wishart, D.S. Recommended Strategies for Spectral Processing and Post-Processing of 1D 1H-NMR Data of Biofluids with a Particular Focus on Urine. Metabolomics 2018, 14, 31. [Google Scholar] [CrossRef] [PubMed]
- Eads, T.M.; Bryant, R.G. High-Resolution Proton NMR Spectroscopy of Milk, Orange Juice, and Apple Juice with Efficient Suppression of the Water Peak. J. Agric. Food Chem. 1986, 34, 834–837. [Google Scholar] [CrossRef]
- Buda, S.; Nawój, M.; Mlynarski, J. Recent Advances in NMR Studies of Carbohydrates. In Annual Reports on NMR Spectroscopy; Elsevier: Amsterdam, The Netherlands, 2016; Volume 89, pp. 185–223. ISBN 978-0-12-804712-5. [Google Scholar]
- Piotto, M.; Saudek, V.; Sklen, V. Gradient-Tailored Excitation for Single-Quantum NMR Spectroscopy of Aqueous Solutions. J. Biomol. NMR 1992, 2, 661–665. [Google Scholar] [CrossRef] [PubMed]
- Beckonert, O.; Keun, H.C.; Ebbels, T.M.D.; Bundy, J.; Holmes, E.; Lindon, J.C.; Nicholson, J.K. Metabolic Profiling, Metabolomic and Metabonomic Procedures for NMR Spectroscopy of Urine, Plasma, Serum and Tissue Extracts. Nat. Protoc. 2007, 2, 2692–2703. [Google Scholar] [CrossRef] [PubMed]
- Mckay, R.T. How the 1D-NOESY Suppresses Solvent Signal in Metabonomics NMR Spectroscopy: An Examination of the Pulse Sequence Components and Evolution. Concepts Magn. Reson. 2011, 38A, 197–220. [Google Scholar] [CrossRef]
- Laref, N. Efficiency of different bioinformatics tools in metabolite profiling of whole cow’s milk using synthetically water-removed 1h NMR spectra: A comparative study. J. Microbiol. Biotechnol. Food Sci. 2020, 10, 241–244. [Google Scholar] [CrossRef]
- Niklasson, M.; Otten, R.; Ahlner, A.; Andresen, C.; Schlagnitweit, J.; Petzold, K.; Lundström, P. Comprehensive Analysis of NMR Data Using Advanced Line Shape Fitting. J. Biomol. NMR 2017, 69, 93–99. [Google Scholar] [CrossRef]
- Izquierdo-García, J.L.; Villa, P.; Kyriazis, A.; Del Puerto-Nevado, L.; Pérez-Rial, S.; Rodriguez, I.; Hernandez, N.; Ruiz-Cabello, J. Descriptive Review of Current NMR-Based Metabolomic Data Analysis Packages. Prog. Nucl. Magn. Reson. Spectrosc. 2011, 59, 263–270. [Google Scholar] [CrossRef]
- Kohl, S.M.; Klein, M.S.; Hochrein, J.; Oefner, P.J.; Spang, R.; Gronwald, W. State-of-the Art Data Normalization Methods Improve NMR-Based Metabolomic Analysis. Metabolomics 2012, 8, 146–160. [Google Scholar] [CrossRef]
- Guitton, Y.; Tremblay-Franco, M.; Le Corguillé, G.; Martin, J.-F.; Pétéra, M.; Roger-Mele, P.; Delabrière, A.; Goulitquer, S.; Monsoor, M.; Duperier, C.; et al. Create, Run, Share, Publish, and Reference Your LC–MS, FIA–MS, GC–MS, and NMR Data Analysis Workflows with the Workflow4Metabolomics 3.0 Galaxy Online Infrastructure for Metabolomics. Int. J. Biochem. Cell Biol. 2017, 93, 89–101. [Google Scholar] [CrossRef] [PubMed]
- Xi, Y.; Rocke, D.M. Baseline Correction for NMR Spectroscopic Metabolomics Data Analysis. BMC Bioinform. 2008, 9, 324. [Google Scholar] [CrossRef] [PubMed]
- Tomasi, G.; Van Den Berg, F.; Andersson, C. Correlation Optimized Warping and Dynamic Time Warping as Preprocessing Methods for Chromatographic Data. J. Chemom. 2004, 18, 231–241. [Google Scholar] [CrossRef]
- Steimers, E.; Sawall, M.; Behrens, R.; Meinhardt, D.; Simoneau, J.; Münnemann, K.; Neymeyr, K.; Von Harbou, E. Application of a New Method for Simultaneous Phase and Baseline Correction of NMR Signals (SINC). Magn. Reson. Chem. 2020, 58, 260–270. [Google Scholar] [CrossRef] [PubMed]
- Klein, M.S.; Buttchereit, N.; Miemczyk, S.P.; Immervoll, A.K.; Louis, C.; Wiedemann, S.; Junge, W.; Thaller, G.; Oefner, P.J.; Gronwald, W. NMR Metabolomic Analysis of Dairy Cows Reveals Milk Glycerophosphocholine to Phosphocholine Ratio as Prognostic Biomarker for Risk of Ketosis. J. Proteome Res. 2012, 11, 1373–1381. [Google Scholar] [CrossRef]
- Li, X.; Hu, K. Quantitative NMR Studies of Multiple Compound Mixtures. In Annual Reports on NMR Spectroscopy; Elsevier: Amsterdam, The Netherlands, 2017; Volume 90, pp. 85–143. ISBN 978-0-12-812009-5. [Google Scholar]
- Savorani, F.; Tomasi, G.; Engelsen, S.B. Icoshift: A Versatile Tool for the Rapid Alignment of 1D NMR Spectra. J. Magn. Reson. 2010, 202, 190–202. [Google Scholar] [CrossRef]
- Mannina, L.; Sobolev, A.P.; Aru, V.; Bellomaria, A.; Bertocchi, F.; Botta, B.; Cagliani, L.R.; Caligiani, A.; Capozzi, F.; Çela, D.; et al. NMR Methodologies in Food Analysis. In Analytical Chemistry—Developments, Applications, and Challenges in Food Analysis; Nova Science Publishers Inc.: Hauppauge, NY, USA, 2017. [Google Scholar]
- Nielsen, N.-P.V.; Carstensen, J.M.; Smedsgaard, J. Aligning of Single and Multiple Wavelength Chromatographic Profiles for Chemometric Data Analysis Using Correlation Optimised Warping. J. Chromatogr. A 1998, 805, 17–35. [Google Scholar] [CrossRef]
- Giraudeau, P.; Tea, I.; Remaud, G.S.; Akoka, S. Reference and Normalization Methods: Essential Tools for the Intercomparison of NMR Spectra. J. Pharm. Biomed. Anal. 2014, 93, 3–16. [Google Scholar] [CrossRef]
- Brennan, L. NMR-Based Metabolomics: From Sample Preparation to Applications in Nutrition Research. Prog. Nucl. Magn. Reson. Spectrosc. 2014, 83, 42–49. [Google Scholar] [CrossRef]
- van den Berg, R.A.; Hoefsloot, H.C.J.; Westerhuis, J.A.; Smilde, A.K.; van der Werf, M.J. Centering, Scaling, and Transformations: Improving the Biological Information Content of Metabolomics Data. BMC Genom. 2006, 7, 142. [Google Scholar] [CrossRef]
- Liu, X.; Fang, Y.; Ma, H.; Zhang, N.; Li, C. Performance Comparison of Three Scaling Algorithms in NMR-Based Metabolomics Analysis. Open Life Sci. 2023, 18, 20220556. [Google Scholar] [CrossRef] [PubMed]
- Ulrich, E.L.; Akutsu, H.; Doreleijers, J.F.; Harano, Y.; Ioannidis, Y.E.; Lin, J.; Livny, M.; Mading, S.; Maziuk, D.; Miller, Z.; et al. BioMagResBank. Nucleic Acids Res. 2008, 36, D402–D408. [Google Scholar] [CrossRef] [PubMed]
- Wishart, D.S. NMR Metabolomics: A Look Ahead. J. Magn. Reson. 2019, 306, 155–161. [Google Scholar] [CrossRef] [PubMed]
- Cui, Q.; Lewis, I.A.; Hegeman, A.D.; Anderson, M.E.; Li, J.; Schulte, C.F.; Westler, W.M.; Eghbalnia, H.R.; Sussman, M.R.; Markley, J.L. Metabolite Identification via the Madison Metabolomics Consortium Database. Nat. Biotechnol. 2008, 26, 162–164. [Google Scholar] [CrossRef] [PubMed]
- Kuhn, S.; Schlörer, N.E. Facilitating Quality Control for Spectra Assignments of Small Organic Molecules: Nmrshiftdb2--a Free in-House NMR Database with Integrated LIMS for Academic Service Laboratories. Magn. Reson. Chem. 2015, 53, 582–589. [Google Scholar] [CrossRef]
- O’Callaghan, T.F.; Hennessy, D.; McAuliffe, S.; Kilcawley, K.N.; O’Donovan, M.; Dillon, P.; Ross, R.P.; Stanton, C. Effect of Pasture versus Indoor Feeding Systems on Raw Milk Composition and Quality over an Entire Lactation. J. Dairy Sci. 2016, 99, 9424–9440. [Google Scholar] [CrossRef]
- Le Gall, G. Sample Collection and Preparation of Biofluids and Extracts for NMR Spectroscopy. Methods Mol. Biol. 2015, 1277, 15–28. [Google Scholar] [CrossRef]
- Van Duynhoven, J.; Voda, A.; Witek, M.; Van As, H. Time-Domain NMR Applied to Food Products. In Annual Reports on NMR Spectroscopy; Elsevier: Amsterdam, The Netherlands, 2010; Volume 69, pp. 145–197. ISBN 978-0-12-381355-8. [Google Scholar]


| 1D 1H-NMR | 1D 13C-NMR | 1D 31P-NMR | 2D-NMR | ||||
|---|---|---|---|---|---|---|---|
| Advantages | Disadvantages | Advantages | Disadvantages | Advantages | Disadvantages | Advantages | Disadvantages |
| High sensitivity | Narrow spectral window | Relatively broader spectral window | Low sensitivity | High sensitivity and broad spectral window | Higher sensitivity than 1D 13C experiments | ||
| Short relaxation time | Low resolution | High resolution | Long relaxation time | High resolution | Long relaxation time | high resolution, more detailed metabolite assignment, | |
| Short experimental time | Overcrowded spectra | Promising in milk fatty acid analysis | Long experimental time | Promising in milk phospholipid analysis | Long experimental time | Identification of unknown metabolites | Long experimental time |
| Suitable for metabolic fingerprinting | Suitable for metabolic profiling | Suitable for metabolic profiling | Suitable for structural elucidation | Usually not used for metabolic profiling | |||
| Application Field | Sample Preparation | pH | NMR Experiment | Data Pre-Processing | Other Analysis | MVA | Reference |
|---|---|---|---|---|---|---|---|
| Chemical composition characterization | Whole and extract | na | 1H, 13C-NMR, HSQC, HMBC | _ | _ | [36] | |
| Extract | 7.0 | 1H-NMR | _ | LC-RMS, LC-MS/MS ICP-MS | _ | [14] | |
| Feeding regime | Extract | na | 1H-NMR | Integration | FT-IR | HCA, PLS-DA | [51] |
| Extract | 7.0 | 1H-NMR, TOCSY | Binning, integration | GC-MS | CDA | [17] | |
| Milk quality and animal health | Extract | 6.0. | 1H-NMR | Binning | FT-IR | PCA, PLS-DA | [15] |
| Extract | na | 1H-NMR | Alignment, binning | Flow cytometry, MIR, microbiological analysis | PCA | [52] | |
| Extract | 7.0 | 1H-NMR | Alignment, binning, integration | LC-MS | _ | [53] | |
| Extract | 7.0 | 1H-NMR | integration, normalization | _ | rPCA | [16] | |
| Technological process and shelf life | Extract of lyophilized milk | na | 1H-NMR | _ | UPLC-QToF/MS, GC-MS | PCA, PLS-DA, PLSR | [54] |
| extract of lyophilized milk | 7.4 | 1H, 13C-NMR | Integration | UPLC-QToF/MS | PCA, PLS-DA, PLSR | [19] | |
| Extract | 7.0 | 1H-NMR | Normalization, alignment | _ | PCA, PLS-DA | [20] | |
| Whole | na | 1H, 13C-NMR | _ | FT-IR, GC-MS, SDS-PAGE, microbiological analysis | _ | [21] | |
| Milk technological properties | Extract | na | 1H-NMR | Alignment, binning | FT-IR, flow cytometry, rheometry | PCA, PLS, OPLS-DA | [45] |
| Skimmed milk | na | 1H, 13CNMR, 1H-13C HSQC | Alignment, binning | FT-IR, flow cytometry, rheometry | PCA | [46] | |
| Infant formula quality assessment | Extract of infant formula | na | 1H-NMR | Integration, normalization, binning | _ | PCA, PLS-DA, OPLS-DA | [23] |
| Animal species origin | Extract | na | 13C-NMR | Integration, normalization | _ | Fuzzy logic analysis | [26] |
| Extract | na | 31P-NMR | _ | _ | _ | [33] | |
| Extract | na | 31P-NMR | Integration, normalization | _ | PCA, UNEQ, SIMCA, K-NN | [31] | |
| Extract | na | 31P-NMR | _ | GC, LC-MS | _ | [34] | |
| Geographical origin | Extract | na | 13C-NMR | _ | IRMS | DA, SDA | [30] |
| extract of lyophilized milk | na | 1H-NMR, COSY, TOCSY | _ | IRMS, HPIC, ICP-AES, FT-IR | PCA, DA | [43] | |
| Extract | 7.4 | 1H-NMR, 1H-1H COSY, 1H-13C HSQC | Binning, integration, normalization | _ | PCA, PLS-CA | [44] | |
| Organic milk authentication | Extract | na | 1H, 13C-NMR | Alignment, binning, integration | IRMS | PCA, LDA, FDA, PLSDA | [28] |
| Extract of lyophilized milk | na | 1H-NMR, 1D, 2D TOCSY, 1H-13C HSQC, HMBC | Binning, integration, normalization | _ | PCA, PLS-DA | [29] | |
| Bovine milk adulteration | Extract | na | 1H-NMR, 1H-13C HSQC, HMBC | Binning | _ | PCA, LDA, ANN | [18] |
| Extract | na | 1H, 13C-NMR, 1H-13C HSQC, HMBC | Integration, normalization | _ | PCA | [42] | |
| Extract of reconstituted milk | 7.4 | 1H-NMR, 1H-13C HSQC, HMBC | Integration, normalization | _ | PCA, PLS-DA | [39] | |
| Extract | 7.4 | 1H-NMR | Binning, integration, normalization | IR, flow cytometry, microbiological analysis | PCA, OPLS-DA | [55] | |
| Infant formula fraud with melamine | Infant powder | 7.0 | 1H-NMR, 1H HRMAS NMR | _ | LC/MS/MS | _ | [56] |
| Milk powder adulteration | Extract of milk powder | na | 1H-NMR | Binning, normalization | _ | _ | [22] |
| Online quality and adulteration control | Whole and skimmed | na | Benchtop 1H-NMR | Integration, normalization | _ | ANN | [57] |
| Whole milk | na | 1H TD-NMR | _ | _ | PCA, SIMCA, k-NN, PLSR | [58] | |
| Whole milk | na | 1H TD-NMR | _ | Colorimeter | PCA, PLS, SIMCA | [59] |
Disclaimer/Publisher’s Note: The statements, opinions and data contained in all publications are solely those of the individual author(s) and contributor(s) and not of MDPI and/or the editor(s). MDPI and/or the editor(s) disclaim responsibility for any injury to people or property resulting from any ideas, methods, instructions or products referred to in the content. |
© 2023 by the authors. Licensee MDPI, Basel, Switzerland. This article is an open access article distributed under the terms and conditions of the Creative Commons Attribution (CC BY) license (https://creativecommons.org/licenses/by/4.0/).
Share and Cite
Eltemur, D.; Robatscher, P.; Oberhuber, M.; Scampicchio, M.; Ceccon, A. Applications of Solution NMR Spectroscopy in Quality Assessment and Authentication of Bovine Milk. Foods 2023, 12, 3240. https://doi.org/10.3390/foods12173240
Eltemur D, Robatscher P, Oberhuber M, Scampicchio M, Ceccon A. Applications of Solution NMR Spectroscopy in Quality Assessment and Authentication of Bovine Milk. Foods. 2023; 12(17):3240. https://doi.org/10.3390/foods12173240
Chicago/Turabian StyleEltemur, Dilek, Peter Robatscher, Michael Oberhuber, Matteo Scampicchio, and Alberto Ceccon. 2023. "Applications of Solution NMR Spectroscopy in Quality Assessment and Authentication of Bovine Milk" Foods 12, no. 17: 3240. https://doi.org/10.3390/foods12173240
APA StyleEltemur, D., Robatscher, P., Oberhuber, M., Scampicchio, M., & Ceccon, A. (2023). Applications of Solution NMR Spectroscopy in Quality Assessment and Authentication of Bovine Milk. Foods, 12(17), 3240. https://doi.org/10.3390/foods12173240