
Compositional Differences of Greek Cheeses of Limited Production
 ,
,  ,
,  ,
,  ,
,  , , ,
, , ,  and
and
Abstract
1. Introduction
2. Materials and Methods
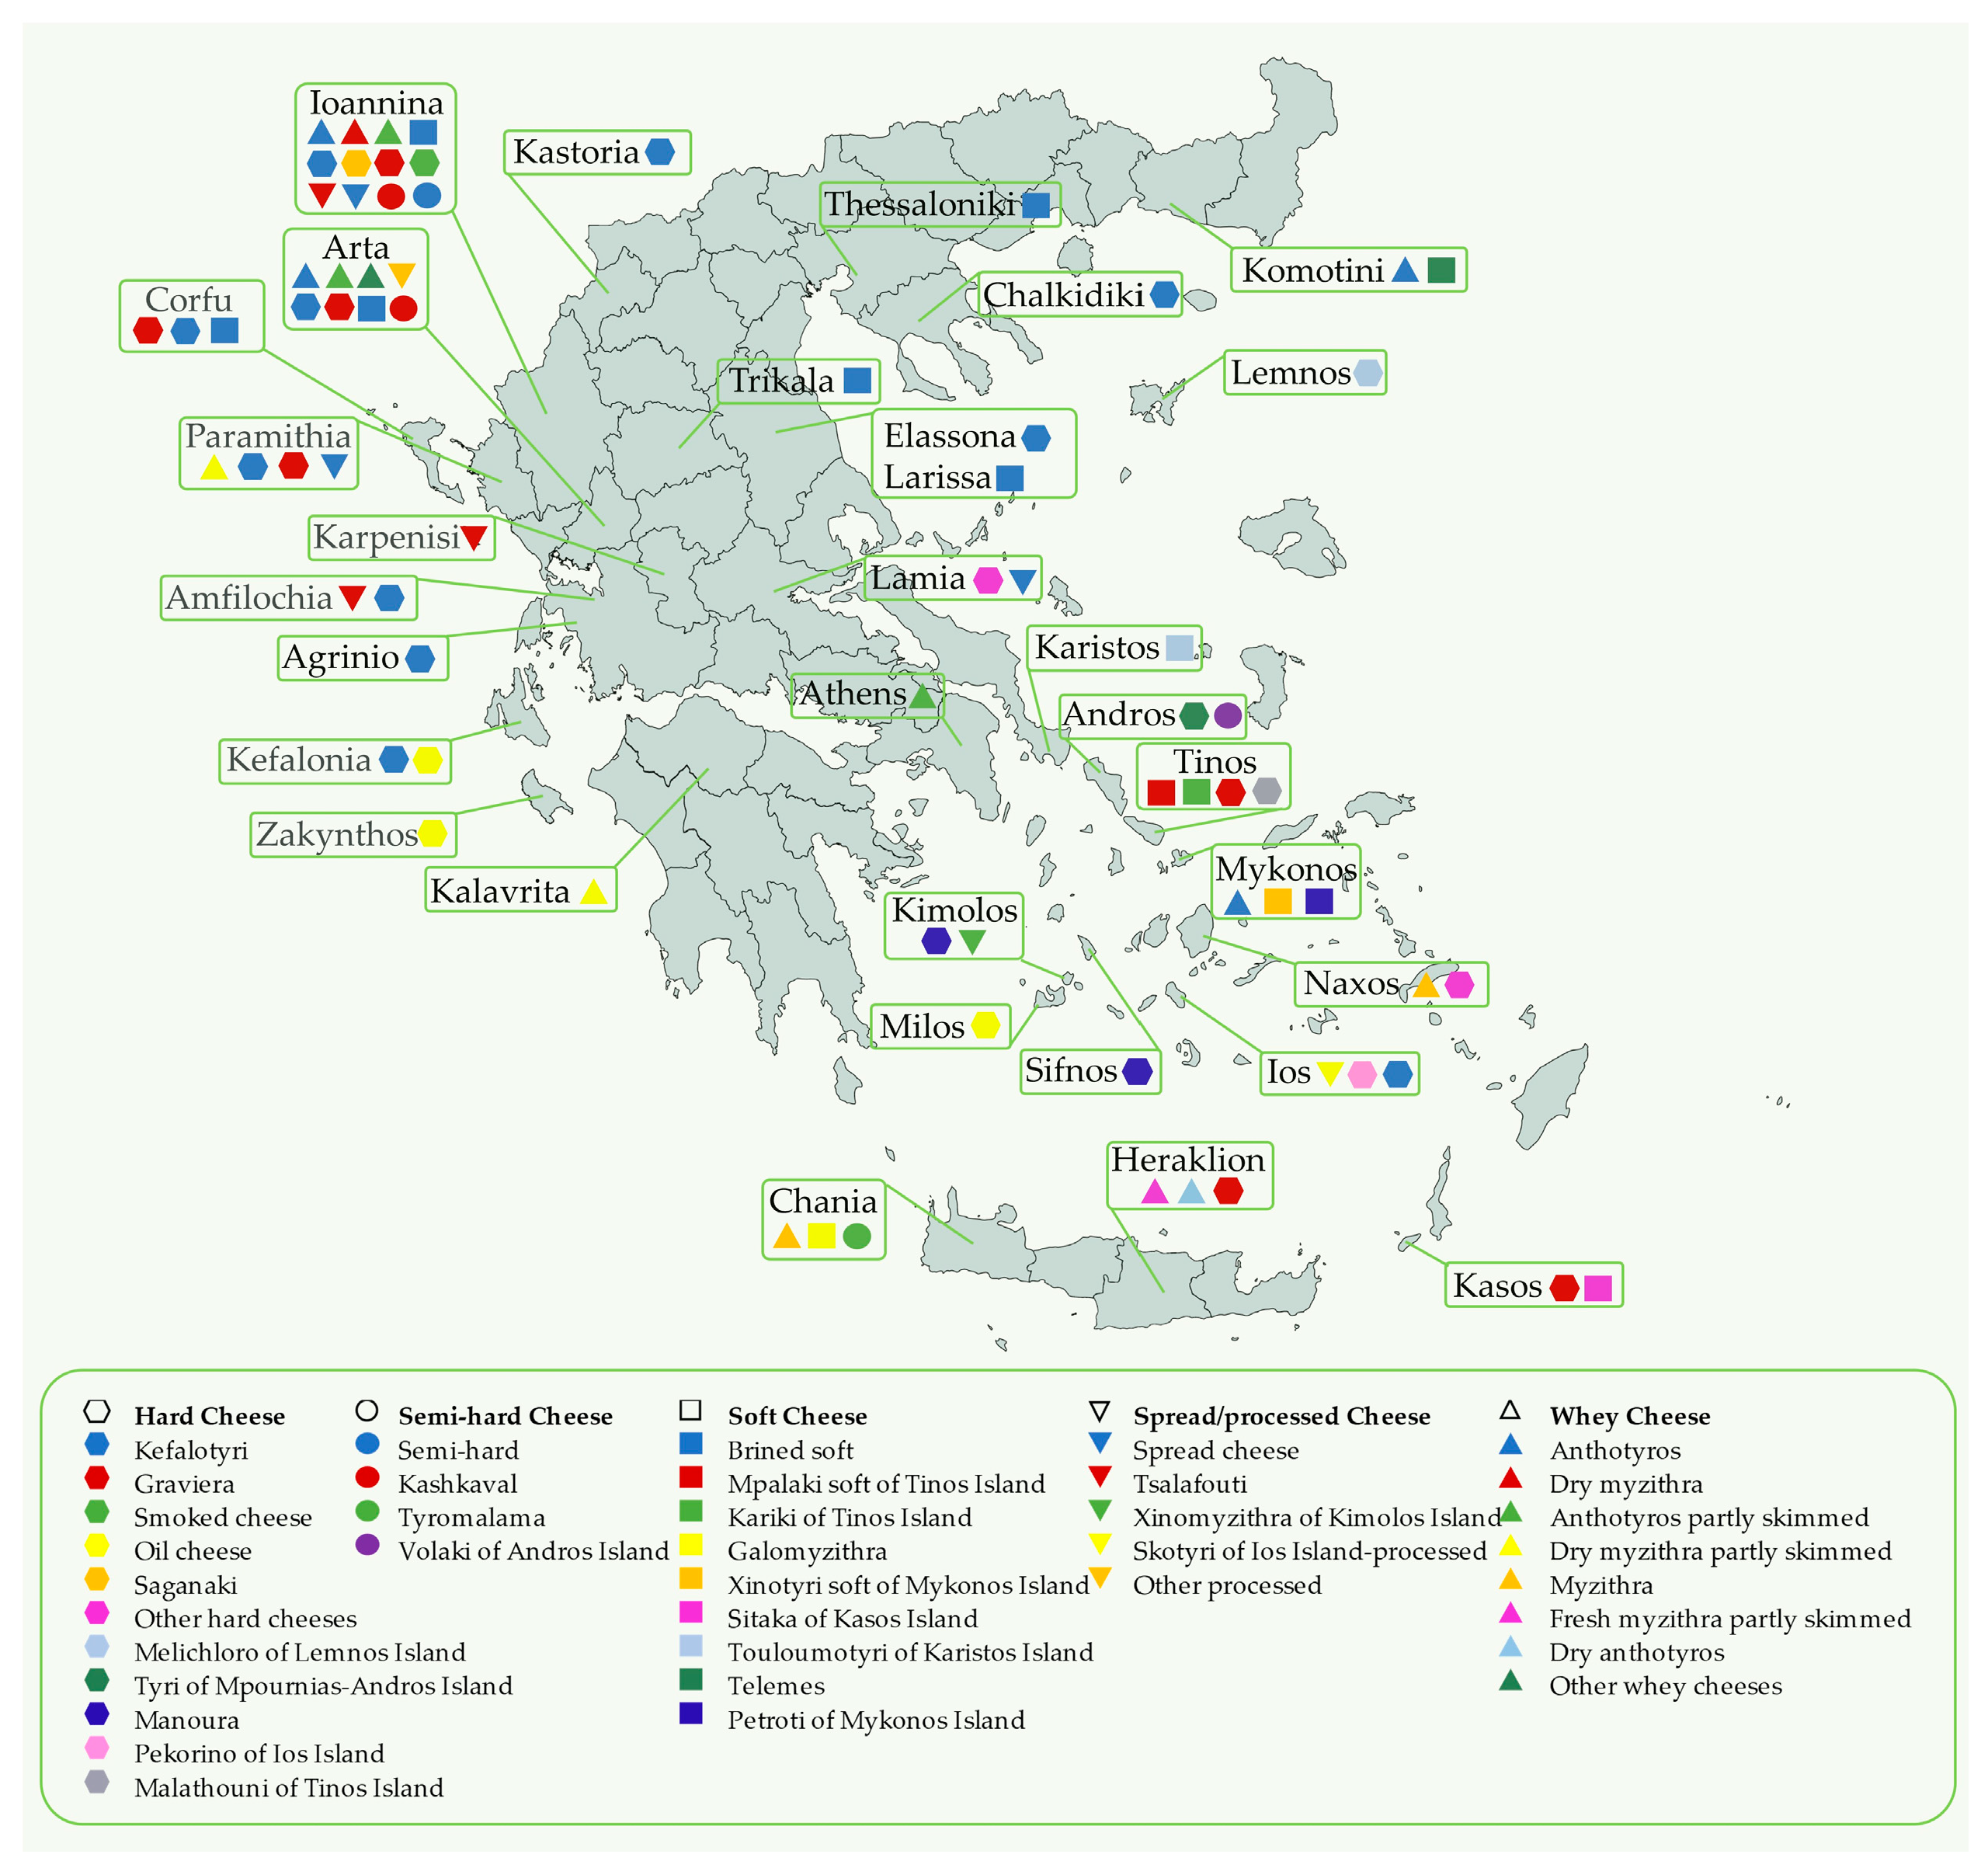
2.1. Sample Collection
2.2. Composition and Physicochemical Characteristics
2.3. Statistical Analysis
3. Results and Discussion
3.1. Composition and Physicochemical Characteristics
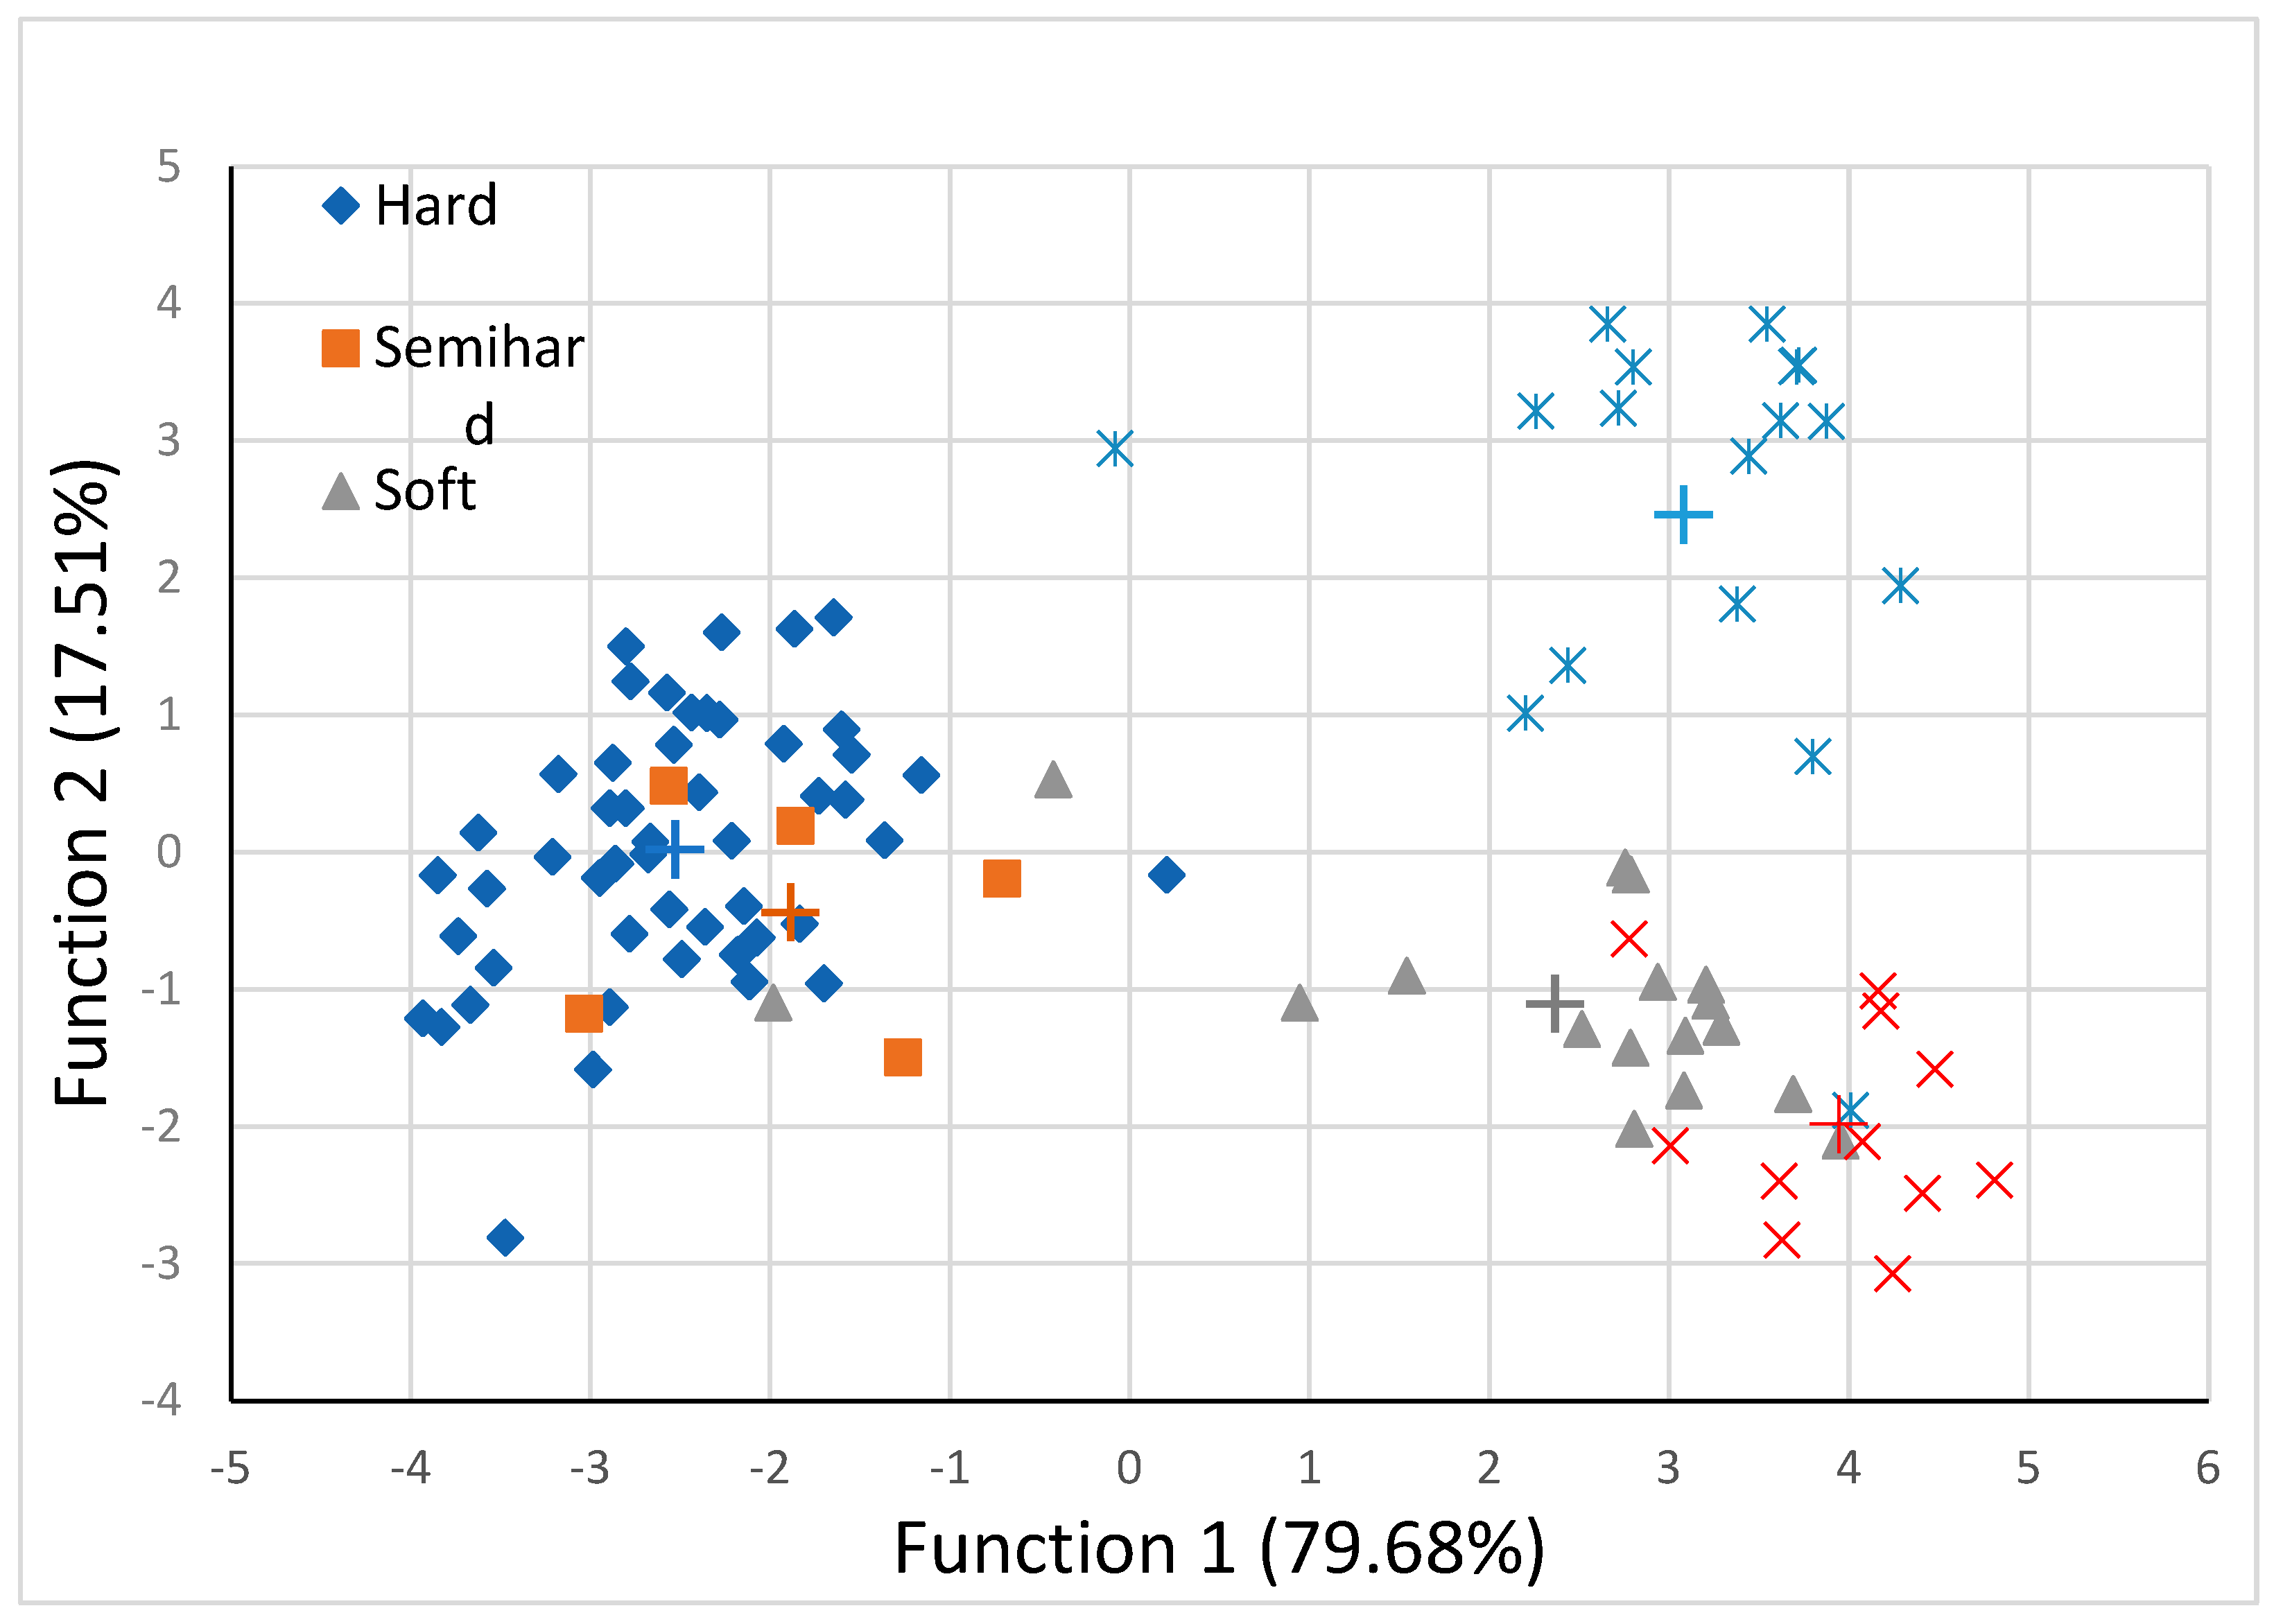
3.2. Discriminant Analysis
4. Conclusions
Author Contributions
Funding
Data Availability Statement
Conflicts of Interest
References
- European Commission Quality Products Registers. European Union, eAmbrosia—The EU Geographical Indications Register. eAmbrosia-Geographical Indications-Search. Available online: https://ec.europa.eu/info/food-farming-fisheries/food-safety-and-quality/certification/quality-labels/geographical-indications-register/ (accessed on 6 February 2023).
- European Council Regulation (EC). No 510/2006 of 20 March 2006 on the protection of geographical indications and designations of origin for agricultural products and foodstuffs. Off. J. Eur. Commun. 2006, L93, 12–25. [Google Scholar]
- Pappa, E.C.; Kondyli, E. Descriptive characteristics and cheesemaking technology of Greek cheeses not listed in the EU Geographical Indications Registers. Dairy 2023, 4, 43–67. [Google Scholar] [CrossRef]
- Kamber, U. Traditional Turkey cheeses and their classification. Van. Vet. J. 2015, 26, 161–171. [Google Scholar]
- Licitra, G. Worldwide traditional cheeses: Banned or business? Dairy Sci. Technol. 2010, 90, 357–374. [Google Scholar] [CrossRef]
- Litopoulou-Tzanetaki, E.; Tzanetakis, N. The Microfloras of traditional Greek cheeses. Microbiol. Spectr. 2014, 2, CM-0009-2012. [Google Scholar] [CrossRef]
- Donelly, C. The Oxford Companion to Cheese; Oxford University Press: New York, NY, USA, 2016. [Google Scholar]
- EU Rural Review. A Publication from the European Network for Rural Development. Local Food and Short Supply Chains. No 12. 2012. Available online: https://ec.europa.eu/enrd/publications/eu-rural-review-12-local-food-and-short-supply-chains_en.html (accessed on 3 May 2023).
- Danezis, G.; Tsiplakou, E.; Pappa, E.C.; Pappas, A.C.; Mavrommatis, A.; Sotirakoglou, K.; Georgiou, C.A.; Zervas, G. Fatty acid profile and physicochemical properties of Greek protected designation of origin cheeses, implications for authentication. Eur. Food Res. Technol. 2020, 246, 1741–1753. [Google Scholar] [CrossRef]
- Danezis, G.P.; Pappas, A.C.; Tsiplakou, E.; Pappa, E.C.; Zacharioudaki, M.; Tsagkaris, A.S.; Papachristidis, C.A.; Sotirakoglou, K.; Zervas, G.; Georgiou, C.A. Authentication of Greek Protected Designation of Origin cheeses through elemental metabolomics. Int. Dairy J. 2020, 104, 104599. [Google Scholar] [CrossRef]
- Mortensen, G.; Sørensen, J.; Stapelfeldt, H. Comparison of peroxide value methods used for semihard cheeses. J. Agric. Food Chem. 2002, 50, 5007–5011. [Google Scholar] [CrossRef]
- AOAC. Official Methods of Analysis, 15th ed.; Association Official Analysis Chemical: Washington, DC, USA, 1995. [Google Scholar]
- Botsoglou, N.A.; Fletouris, D.J.; Papageorgiou, G.E.; Vassilopoulos, V.N.; Mantis, A.J.; Trakatellis, A.G. A rapid, sensitive and specific thiobarbituric acid method for measuring lipid peroxidation in animal tissues, food and feedstuff samples. J. Agric. Food Chem. 1994, 42, 1931–1937. [Google Scholar] [CrossRef]
- SAS (Statistical Analysis Software) Institute. Statistical Analysis Systems, Version 9.1.3; SAS Institute Inc.: Cary, NC, USA, 2005. [Google Scholar]
- Kasapian, M.; Dicakova, Z.; Dudrikova, E. Determination of physical and physico-chemical parameters in Greek cheeses. Bulg. Chem. Commun. 2014, 46, 68–72. [Google Scholar]
- Kovacova, M.; Vyrostkova, J.; Dudrikova, E.; Zigo, F.; Semjon, B.; Regecova, I. Assessment of quality and safety of farm level produced cheeses from sheep and goat milk. Appl. Sci. 2021, 11, 3196. [Google Scholar] [CrossRef]
- Lawrence, R.C.; Heap, H.A.; Gilles, J. A controlled approach to cheese technology. J. Dairy Sci. 1984, 67, 1632–1645. [Google Scholar] [CrossRef]
- Lawrence, R.C.; Gilles, J.; Creamer, L.K.; Crow, V.L.; Heap, H.A.; Honore, C.G.; Johnston, K.A.; Samal, P.K. Cheddar cheese and related dry-salted cheese varieties. In Cheese: Chemistry, Physics and Microbiology, 3rd ed.; Fox, P.F., McSweeney, P.L.H., Cogan, T.M., Guinee, T.P., Eds.; Elsevier Academic Press: Amsterdam, The Netherlands, 2004; Volume 2, pp. 71–102. [Google Scholar]
- McSweeney, P.L.H.; Ottogalli, G.; Fox, P.F. Diversity of cheese varieties. An overview. In Cheese: Chemistry, Physics and Microbiology, 3rd ed.; Fox, P.F., McSweeney, P.L.H., Cogan, T.M., Guinee, T.P., Eds.; Elsevier Academic Press: Amsterdam, The Netherlands, 2004; Volume 2, pp. 1–22. [Google Scholar]
- National Printing Office. Greek Codex Alimentarius. Off. J. Hell. Repub. 2009, B, 83. [Google Scholar]
- Anifantakis, E. Greek Cheeses: A Tradition of Centuries; National Dairy Committee of Greece: Athens, Greece, 1991. [Google Scholar]
- Anifantakis, E.M.; Moatsou, G. Feta and other Balkan cheeses. In Brined Cheeses; Tamime, A.Y., Ed.; Blackwell Publishing: Oxford, UK, 2006; pp. 43–76. [Google Scholar]
- Alichanidis, E.; Polychroniadou, A. Characteristics of major traditional regional cheese varieties of East-Mediterranean countries: A review. Dairy Sci. Technol. 2008, 88, 495–510. [Google Scholar] [CrossRef]
- Moatsou, G.; Govaris, A. White brined cheeses: A diachronic exploitation of small ruminants milk in Greece. Small Rumin. Res. 2011, 101, 113–121. [Google Scholar] [CrossRef]
- Moschopoulou, E.; Moatsou, G. Greek dairy products: Composition and Processing. In Mediterranean Foods: Composition and Processing; Cruz, R.M.S., Vieira, M.C., Eds.; CRC Press: Boca Raton, FL, USA, 2016; pp. 268–321. [Google Scholar]
- Kalogridou-Vassiliadou, D.; Tzanetakis, N.; Litopoulou-Tzanetaki, E. Microbiological and physicochemical characteristics of ‘Anthotyro’ a Greek traditional whey cheese. Food Microbiol. 1994, 11, 15–19. [Google Scholar] [CrossRef]
- Kandarakis, I.; Massouras, T.; Stamati, E.; Anifantakis, E. Mineral content and trace elements in some Greek dairy products. In Proceedings of the 26th IDF World Dairy Congress (CONGRILAIT 2002)-Science and Technology Session, Paris, France, 24–27 September 2002. [Google Scholar]
- Andrikopoulos, N.; Kalogeropoulos, N.; Zerva, U.; Zerva, M.; Hassapidou, M.; Kapoulas, V.M. Evaluation of cholesterol and other nutrient parameters of Greek cheese varieties. J. Food Compost. Anal. 2003, 16, 155–167. [Google Scholar] [CrossRef]
- Vatavali, K.A.; Kosma, I.S.; Louppis, A.P.; Badeka, A.V.; Kontominas, M.G. Physicochemical, spectroscopic, and chromatographic analyses in combination with chemometrics for the discrimination of the geographical origin of Greek Graviera cheeses. Molecules 2020, 25, 3507. [Google Scholar] [CrossRef]
- Vatavali, K.; Kosma, I.; Louppis, A.; Gatzias, I.; Badeka, A.V.; Kontominas, M.G. Characterization and differentiation of geographical origin of Graviera cheeses produced in Greece based on physico-chemical, chromatographic and spectroscopic analyses, in combination with chemometrics. Int. Dairy J. 2020, 110, 104799. [Google Scholar] [CrossRef]
- Zerfiridis, G.K.; Vafopoulou-Mastrogiannaki, A.; Litipoulou-Tzanetaki, E. Changes during ripening of commercial Gruyere cheese. J. Dairy Sci. 1984, 67, 1397–1405. [Google Scholar] [CrossRef]
- Gobbetti, M.; Di Cagno, R. Hard Italian cheeses. In Encyclopedia of Dairy Sciences; Roginski, H., Fuquay, J.W., Fox, P.F., Eds.; Academic Press (An Imprint of Elsevier Science): London, UK, 2003; pp. 378–385. [Google Scholar]
- Kindstedt, P.; Caric, M.; Milanovic, S. Pasta-filata cheeses. In Major Cheese Groups: Cheese: Chemistry, Physics and Microbiology, 3rd ed.; Fox, P.F., McSweeney, P.L.H., Cogan, T.M., Guinee, T.P., Eds.; Elsevier Ltd.: London, UK, 2004; Volume 2, pp. 251–277. [Google Scholar]
- EEC. No 1225/90 as regards the description of Kashkaval cheese. Off J. Eur. Commun. 1990, 33, 56. [Google Scholar]
- Ministry of Rural Development and Food. Available online: http://www.minagric.gr/index.php/el/for-farmer-2/2012-02-02-07-52-07/enstaseis/5466-enstaseis-gia-proionta-pop-pge (accessed on 1 February 2023). (In Greek).
- Kavas, N.; Kavas, G. Some properties of traditional whey cheese (Mud cheese) produced in Turkey. J. Food Sci. Eng. 2011, 1, 221–225. [Google Scholar]
- Nunez, M.; Medina, M.; Gaya, P. Ewes’ milk cheese: Technology, microbiology and chemistry. A review article. J. Dairy Res. 1989, 56, 303–321. [Google Scholar] [CrossRef] [PubMed]
- Park, Y.W.; Juárez, M.; Ramos, M.; Haenlein, G.F.W. Physico-chemical characteristics of goat and sheep milk. Small Rumin. Res. 2007, 68, 88–113. [Google Scholar] [CrossRef]
- Food Agricultural Organization. Crops and Livestock Products. Available online: https://www.fao.org/faostat/en/#data/QCL (accessed on 19 January 2023).
- Milovanovic, B.; Djekic, I.; Miocinovic, J.; Djordjevic, V.; Lorenzo, J.M.; Barba, F.J.; Mörlein, D.; Tomasevic, I. What Is the Color of Milk and Dairy Products and How Is It Measured? Foods 2020, 9, 1629. [Google Scholar] [CrossRef]
- Verruck, S.; Dantas, A.; Prudencio, E.S. Functionality of the components from goat’s milk, recent advances for functional dairy products development and its implications on human health. J. Funct. Foods 2019, 52, 243–257. [Google Scholar] [CrossRef]
- Solah, V.A.; Staines, V.; Honda, S.; Limley, H.A. Measurement of milk color and composition: Effect of dietary intervention on Western Australian Holstein-Friesian cow’s milk quality. J. Food Sci. 2007, 72, S560–S566. [Google Scholar] [CrossRef]
- Nozière, P.; Graulet, B.; Lucas, A.; Martin, B.; Grolier, P.; Doreau, M. Carotenoids for ruminants: From forages to dairy products. Anim. Feed Sci. Technol. 2006, 131, 418–450. [Google Scholar] [CrossRef]
- Lucas, A.; Rock, E.; Agabriel, C.; Chilliard, Y.; Coulon, J.B. Relationships between animal species (cow versus goat) and some nutritional constituents in raw milk farmhouse cheeses. Small Rumin. Res. 2008, 74, 243–248. [Google Scholar] [CrossRef]
- Saravani, M.; Ehsani, A.; Aliakbarlu, J.; Ghasempour, Z. Gouda cheese spoilage prevention: Biodegradable coating induced by Bunium persicum essential oil and lactoperoxidase system. Food Sci. Nutr. 2019, 7, 959–968. [Google Scholar] [CrossRef]
- Semeniuc, C.A.; Mandrioli, M.; Socaci, B.S.; Socaciu, M.I.; Fogarasi, M.; Podar, A.S.; Michiu, D.; Jimborean, A.M.; Muresan, V.; Ionescu, S.R.; et al. Changes in lipid composition and oxidative status during ripening of Gouda-type cheese as influenced by addition of lavender flower powder. Int. Dairy J. 2022, 133, 105427. [Google Scholar] [CrossRef]
- Gupta, A.; Mann, B.; Kumar, R.; Sangwan, R.B. Antioxidant activity of Cheddar cheeses at different stages of ripening. Int. J. Dairy Technol. 2009, 62, 339–347. [Google Scholar] [CrossRef]
- Kocak, A.; Sanli, T.; Anli, E.A.; Hayaloglu, A.A. Role of using adjunct cultures in release of bioactive peptides in white-brined goat-milk cheese. LWT 2020, 123, 109127. [Google Scholar] [CrossRef]
- Oancea, A.-G.; Untea, A.E.; Dragomir, C.; Radu, G.L. Determination of optimum TBARS conditions for evaluation of cow and sheep milk oxidative stability. Appl. Sci. 2022, 12, 6508. [Google Scholar] [CrossRef]
- Zulueta, A.; Maurizi, A.; Frigola, A.; Esteve, M.J.; Coli, R.; Burini, G. Antioxidant capacity of cow milk, whey and deproteinized milk. Int. Dairy J. 2009, 19, 380–385. [Google Scholar] [CrossRef]
- Chen, J.; Lindmark-Mansson, H.; Gorton, L.; Akesson, B. Antioxidant capacity of cow milk as assayed by spectrophotometric and amperometric methods. Int. Dairy J. 2003, 13, 927–935. [Google Scholar] [CrossRef]
- EEC. No 1151/2012 on quality schemes for agricultural products and foodstuffs. Off. J. Eur. Commun. 2012, L343, 1–29. [Google Scholar]


| Cheese | n | pH | Moisture % | Fat % | Salt % | Protein % | Ash % | MNFS % | FDM % | SM % | MDA (ng/g) | L* | a* | b* | |
|---|---|---|---|---|---|---|---|---|---|---|---|---|---|---|---|
| Hard cheeses | |||||||||||||||
| Graviera | 18 | Mean | 5.2 | 35.6 | 32.2 | 2.1 | 25.5 | 4.9 | 52.6 | 50 | 5.9 | 38 | 82.5 | −0.08 | 25.8 |
| S.E. | 0.1 | 0.6 | 0.7 | 0.1 | 0.8 | 0.2 | 0.7 | 1 | 0.3 | 6 | 0.8 | 0.41 | 0.7 | ||
| Kefalotyri | 17 | Mean | 5.3 | 36.8 | 31.1 | 3.1 | 24.8 | 5.7 | 53.5 | 49.2 | 8.3 | 55 | 84.1 | −1.0 | 24.2 |
| S.E. | 0.1 | 0.5 | 0.6 | 0.1 | 0.7 | 0.2 | 0.6 | 0.8 | 0.5 | 6 | 0.6 | 0.4 | 0.5 | ||
| Manoura | 3 | Mean | 5.1 | 35 | 31 | 2.8 | 25 | 5 | 50 | 47.4 | 9 | 9 | 86.5 | 1 | 21.7 |
| S.E. | 0.1 | 4 | 2 | 0.9 | 1 | 1 | 4 | 0.7 | 2 | 2 | 0.9 | 0.5 | 0.7 | ||
| Oil cheese 1 | 3 | Mean | 5.4 | 34 | 36 | 2.0 | 23 | 4.7 | 52 | 53.4 | 6.1 | 5 × 10 | 83.2 | 25 | |
| S.E. | 0.3 | 3 | 2 | 0.2 | 1 | 0.1 | 4 | 0.6 | 0.4 | 3 × 10 | 0.9 | 1 | |||
| Melichloro of Lemnos Island | 2 | Mean | 4.9 | 35 | 35 | 1.6 | 21 | 3.8 | 53 | 53 | 4.60 | 7 × 10 | 88 | 0 | 22 |
| S.E. | 0.1 | 1 | 5 | 0.1 | 3 | 0.3 | 1 | 6 | 0.01 | 6 × 10 | 2 | - | 2 | ||
| Malathouni of Tinos Island | 1 | 4.2 | 22.1 | 15.0 | 1.4 | 24.3 | 1.9 | 26 | 19.3 | 6.5 | 26.1 | 85.9 | −0.06 | 25.7 | |
| Pekorino of Ios Island | 1 | 5.4 | 28.9 | 37.8 | 1.7 | 25.9 | 4.2 | 46.4 | 53.1 | 5.7 | 175.0 | 81.9 | 0.27 | 26.7 | |
| Saganaki | 1 | 5.2 | 36.0 | 35.3 | 2.7 | 23.5 | 5.4 | 55.5 | 55.0 | 7.5 | 131.2 | 83.6 | −0.32 | 24.1 | |
| Smoked cheese 2 | 1 | 3.3 | 34.5 | 31.5 | 2.7 | 27 | 5.2 | 50.4 | 48.1 | 7.7 | 8.6 | 83.1 | −0.38 | 28.8 | |
| Tyri of Mpournias-Andros Island | 1 | 5.3 | 25.3 | 42.0 | 2.2 | 28.4 | 3.2 | 43.7 | 56.3 | 8.6 | 4.6 | 75.5 | 6.1 | 32.3 | |
| Other hard cheeses 3 | 2 | Mean | 5.5 | 32 | 32 | 2.7 | 3 | 5.3 | 48.3 | 47 | 8.2 | 15 | 85 | 0 | 24 |
| S.E. | 0.2 | 2 | 5 | 0.4 | 1 | 0.4 | 0.9 | 6 | 0.8 | 6 | 2 | - | 3 | ||
| Cheese | n | pH | Moisture % | Fat % | Salt % | Protein % | Ash % | MNFS % | FDM % | SM % | MDA (ng/g) | L* | a* | b* | |
|---|---|---|---|---|---|---|---|---|---|---|---|---|---|---|---|
| Semihard | |||||||||||||||
| Semihard | 2 | Mean | 4.9 | 41.9 | 32 | 1.7 | 24.3 | 4.4 | 62 | 56 | 4.1 | 29 | 85 | 1.2 | 27.0 |
| S.E. | 0.1 | 0.3 | 5 | 0.3 | 0.1 | 0.4 | 5 | 9 | 0.7 | 4 | 1 | 0.1 | 0.5 | ||
| Kashkaval | 2 | Mean | 4.9 | 39 | 30 | 1.9 | 25 | 4.4 | 56 | 49 | 5 | 2 | 84 | −1.3 | 24.7 |
| S.E. | 0.1 | 4 | 3 | 0.6 | 2 | 0.5 | 4 | 1 | 2 | 1 | 1 | 0.2 | 0.5 | ||
| Tyromalama | 1 | 5.4 | 39.9 | 31.3 | 0.0 | 24.5 | 3.1 | 58.1 | 52.0 | 0.0 | 25.6 | 80.9 | −2.1 | 25.1 | |
| Volaki of Andros Island | 1 | 5.1 | 43.6 | 30.3 | 1.7 | 21.5 | 3.1 | 62.5 | 53.6 | 3.8 | 15.1 | 89.9 | 1.8 | 25.5 | |
| Soft | |||||||||||||||
| Brined soft 1 | 10 | Mean | 4.3 | 55 | 27 | 2.2 | 14.8 | 3.2 | 75 | 60 | 4.0 | 9 | 91.5 | −1.0 | 12.4 |
| S.E. | 0.1 | 1 | 1 | 0.2 | 0.4 | 0.3 | 2 | 3 | 0.3 | 2 | 0.7 | 0.1 | 0.5 | ||
| Mpalaki soft of Tinos Island | 1 | 4.9 | 36.9 | 33.0 | 1.5 | 25.3 | 2.1 | 55.1 | 52.3 | 3.9 | 43.9 | 86.2 | 1.1 | 26.1 | |
| Kariki of Tinos Island | 1 | 5.6 | 37.4 | 40.8 | 2.4 | 19.3 | 2.3 | 63.2 | 65.2 | 6.42 | 11.1 | 72.0 | 1.0 | 21.1 | |
| Galomyzithra | 1 | 4.5 | 58.1 | 31.5 | 1.0 | 8.0 | 1.6 | 84.8 | 75.1 | 1.8 | 33.2 | 91.3 | −0.93 | 14.4 | |
| Xinotyri soft of Mykonos Island | 1 | 4.7 | 52.4 | 25.0 | 2.2 | 17.7 | 2.6 | 69.9 | 52.5 | 4.2 | 20.3 | 91.7 | −1.24 | 17.1 | |
| Petroti of Mykonos Island | 1 | 4.8 | 62.9 | 17.8 | 1.5 | 13.7 | 1.9 | 76.4 | 47.9 | 2.3 | 9.9 | 95.9 | −1.4 | 15.2 | |
| Sitaka of Kasos Island | 1 | 5.4 | 58.1 | 33.0 | 0.1 | 14.0 | 2.0 | 86.7 | 78.8 | 0.17 | 4.6 | 73.3 | 9.2 | 34.2 | |
| Telemes | 1 | 4.5 | 52.8 | 25.3 | 1.5 | 16.9 | 2.5 | 70.6 | 53.5 | 2.7 | 44.3 | 89.1 | 0.16 | 20.6 | |
| Touloumotyri of Karistos Island | 1 | 5.1 | 53.6 | 31.3 | 3.2 | 16.5 | 5.0 | 78.0 | 67.4 | 6.0 | 38.1 | 88.0 | −0.50 | 15.2 | |
| Cheese | n | pH | Moisture % | Fat % | Salt % | Protein % | Ash % | MNFS % | FDM % | SM % | MDA (ng/g) | L* | a* | b* | |
|---|---|---|---|---|---|---|---|---|---|---|---|---|---|---|---|
| Spread/processed | |||||||||||||||
| Spread cheese 1 | 4 | Mean | 4.5 | 71 | 13 | 1.1 | 11 | 1.6 | 81 | 43 | 1.5 | 16 × 10 | 93.7 | −1.1 | 15.2 |
| S.E. | 0.2 | 5 | 4 | 0.2 | 2 | 0.1 | 2 | 5 | 0.2 | 5 × 10 | 0.7 | 0.2 | 0.4 | ||
| Tsalafouti | 3 | Mean | 4.1 | 71 | 14 | 1.2 | 10 | 1.6 | 82.4 | 47 | 1.6 | 8 × 10 | 94.3 | −0.97 | 12.0 |
| S.E. | 0.1 | 2 | 2 | 0.1 | 1 | 0.1 | 0.8 | 3 | 0.1 | 3 × 10 | 0.5 | 0.08 | 0.7 | ||
| Skotyri of Ios Island-processed | 2 | Mean | 4.0 | 59 | 30 | 1.9 | 11.6 | 2.6 | 84 | 72 | 3.2 | 21 | 83.8 | 0.3 | 14.3 |
| S.E. | 0.1 | 2 | 6 | 0.1 | 0.3 | 0.1 | 5 | 1 | 0.3 | 2 | 0.6 | 0.1 | 0.2 | ||
| Xinomyzithra of Kimolos Island | 1 | 4.1 | 61.5 | 21.8 | 0.4 | 14.2 | 0.8 | 78.6 | 56.5 | 0.57 | 23.3 | 88.2 | −0.46 | 15.6 | |
| Other processed 2 | 1 | 4.6 | 66.7 | 15.5 | 1.6 | 11.0 | 1.9 | 79.0 | 46.6 | 2.3 | 54.1 | 86.9 | −1.53 | 11.6 | |
| Whey cheeses | |||||||||||||||
| Anthotyros | 4 | Mean | 6.1 | 71 | 13 | 0.6 | 12 | 1.3 | 81.7 | 44 | 0.8 | 9 | 87.9 | −1.4 | 16.5 |
| S.E. | 0.3 | 2 | 2 | 0.2 | 1 | 0.3 | 0.8 | 5 | 0.2 | 3 | 0.9 | 0.3 | 0.8 | ||
| Anthotyros partly skimmed | 3 | Mean | 6.7 | 71 | 12 | 0.4 | 12 | 1.4 | 81.7 | 44 | 0.5 | 6.7 | 88.8 | −1.7 | 17.2 |
| S.E. | 0.1 | 3 | 3 | 0.2 | 1 | 0.9 | 0.8 | 7 | 0.1 | 0.5 | 0.6 | 0.3 | 0.6 | ||
| Dry myzithra partly skimmed | 3 | Mean | 5.4 | 5 | 13 | 4 | 26 | 7 | 57 | 2 × 10 | 8 | 14 × 10 | 91.4 | −0.4 | 13.2 |
| S.E. | 0.1 | 1 | 5 | 1 | 7 | 1 | 4 | 1 × 10 | 2 | 5 × 10 | 0.2 | 0.2 | 0.5 | ||
| Fresh myzithra partly skimmed | 2 | Mean | 5.8 | 66 | 17 | 0.90 | 11.8 | 1.7 | 80 | 50.1 | 1.3 | 4 × 10 | 89.3 | −1.6 | 1.6 × 10 |
| S.E. | 0.2 | 3 | 2 | 0.04 | 0.1 | 0.0 | 2 | 0.1 | 0.0 | 2 × 10 | 0.6 | 0.1 | 0.1 × 10 | ||
| Myzithra | 2 | Mean | 5 | 71 | 14 | 0 | 15 | 1.7 | 82 | 47 | 0 | 28 | 90 | −1.1 | 14 |
| S.E. | 1 | 4 | 3 | − | 5 | 0.6 | 2 | 4 | − | 1 | 2 | 0.0 | 2 | ||
| Dry anthotyros | 1 | 6.4 | 37.5 | 38.6 | 2.6 | 17.3 | 3.8 | 61.0 | 61.6 | 6.7 | 205.9 | 88.5 | −0.51 | 17.2 | |
| Dry myzithra | 1 | 6.0 | 50.8 | 13.3 | 4.7 | 20.5 | 9.2 | 58.5 | 26.9 | 9.2 | 30.4 | 90.1 | −0.49 | 13.6 | |
| Other whey cheeses 3 | 1 | 6.0 | 45.9 | 50.5 | 0.9 | 8.0 | 1.3 | 92.6 | 93.3 | 1.8 | 114.8 | 92.3 | −1.4 | 14.6 | |
| p-value | <0.001 | <0.001 | <0.001 | <0.001 | <0.001 | <0.001 | <0.001 | <0.001 | <0.001 | <0.001 | <0.001 | <0.001 | <0.001 | ||
| Factor | n | pH | Moisture % | Fat % | Salt % | Protein % | Ash % | MNFS % | FDM % | SM % | MDA (ng/g) | L* | a* | b* | |
|---|---|---|---|---|---|---|---|---|---|---|---|---|---|---|---|
| Location | Mainland | 58 | 5.0 | 51.8 | 24.5 | 1.8 | 18.2 | 3.4 | 67.8 | 49.8 | 3.9 | 52.7 | 88.1 | −0.63 | 19.4 |
| Island | 44 | 4.8 | 49.2 | 27.3 | 1.4 | 17.8 | 2.8 | 67.0 | 54.4 | 3.2 | 52.5 | 87.4 | −0.04 | 18.9 | |
| S.E. | 0.1 | 1.6 | 1.5 | 0.2 | 1.0 | 0.3 | 1.7 | 2.4 | 0.6 | 12.8 | 0.9 | 0.39 | 0.8 | ||
| p-value | 0.099 | 0.096 | 0.068 | 0.13 | 0.648 | 0.084 | 0.594 | 0.05 | 0.22 | 0.989 | 0.386 | 0.117 | 0.485 | ||
| Milk type | Sheep and goat | 37 | 4.9 | 50.9 | 27.1 | 2.1 | 18.4 | 3.5 | 69.4 | 54.7 | 4.5 | 67.8 | 88.0 | −0.61 | 18.8 ab |
| Goat | 11 | 4.9 | 50.7 | 25.8 | 1.5 | 18.3 | 3.0 | 67.8 | 53.0 | 3.0 | 39.9 | 90.2 | −0.75 | 15.4 b | |
| Sheep, goat, and cow | 9 | 5.2 | 53.0 | 26.5 | 1.6 | 17.7 | 3.3 | 71.5 | 56.3 | 3.5 | 22.9 | 85.8 | −0.03 | 20.1 ab | |
| Cow | 9 | 5.0 | 48.1 | 27.1 | 1.5 | 29.8 | 2.6 | 64.5 | 50.9 | 3.8 | 24.5 | 85.4 | 0.77 | 22.5 a | |
| Sheep | 8 | 4.8 | 53.8 | 24.9 | 1.5 | 15.9 | 3.3 | 70.0 | 53.2 | 3.0 | 91.8 | 85.3 | −1.4 | 19.0 ab | |
| Sheep and cow | 1 | 4.8 | 51.7 | 23.0 | 1.4 | 17.5 | 3.0 | 66.7 | 48.1 | 3.0 | 70.3 | 87.0 | 1.40 | 20.7 ab | |
| Buffalo | 1 | 4.5 | 43.0 | 30.7 | 1.4 | 18.0 | 2.9 | 61.7 | 53.9 | 3.5 | 44.6 | 92.2 | −1.61 | 17.2 ab | |
| Not defined | 26 | 5.1 | 52.7 | 22.1 | 1.7 | 18.4 | 3.5 | 66.6 | 45.9 | 4.1 | 59.0 | 88.2 | −0.48 | 19.4 ab | |
| S.E. | 0.1 | 3.3 | 3.1 | 0.5 | 2.0 | 0.7 | 3.4 | 4.9 | 1.1 | 25.6 | 1.8 | 0.79 | 1.5 | ||
| p-value | 0.602 | 0.613 | 0.196 | 0.667 | 0.858 | 0.869 | 0.333 | 0.083 | 0.677 | 0.13 | 0.069 | 0.243 | 0.005 | ||
| Cheese type | Hard | 50 | 5.2 a | 33.8 a | 32.7 a | 2.2 a | 24.9 a | 4.7 a | 50.5 a | 49.9 a | 6.5 a | 38.0 | 83.7 a | 0.05 | 25.0 a |
| Soft | 18 | 4.6 bc | 53.9 b | 27.5 a | 1.9 ab | 14.9 b | 3.0 bc | 74.4 b | 59.8 b | 3.6 b | 67.2 | 88.5 b | −0.15 | 16.6 b | |
| Whey | 17 | 5.8 d | 60.5 bc | 18.3 b | 1.4 b | 14.8 b | 2.7 bc | 74.2 b | 45.6 a | 2.5 b | 52.7 | 89.5 b | −1.0 | 15.1 b | |
| Spread | 11 | 4.1 c | 65.2 c | 19.1 b | 1.0 b | 10.9 b | 1.4 c | 80.2 b | 52.6 ab | 1.5 b | 90.5 | 90.7 b | −0.4 | 14.3 b | |
| Semihard | 6 | 5.0 ab | 39.1 a | 31.8 a | 1.4 ab | 24.5 a | 3.9 ab | 57.7 a | 52.5 ab | 3.7 ab | 14.6 | 86.3 ab | −0.15 | 24.7 a | |
| S.E. | 0.1 | 2.4 | 2.2 | 0.3 | 1.4 | 0.5 | 2.5 | 3.5 | 0.8 | 18.4 | 1.3 | 0.57 | 1.1 | ||
| p-value | <0.001 | <0.001 | <0.001 | 0.002 | <0.001 | <0.001 | <0.001 | 0.012 | <0.001 | 0.026 | <0.001 | 0.293 | <0.001 |
| Predicted Milk Type | |||||||
|---|---|---|---|---|---|---|---|
| Actual Milk Type | Group Size | Cow | Goat | Sheep | Sheep & Goat | Sheep, Goat & Cow | Not Defined |
| Sheep and Goat | 37 | 4 | 3 | 4 | 19 | 3 | 4 |
| (10.8%) | (8.11%) | (10.81%) | (51.4%) | (8.11%) | (10.8%) | ||
| Goat | 11 | 1 | 9 | 1 | 0 | 0 | 0 |
| (9.1%) | (81.8%) | (9.1%) | (0.0%) | (0.0%) | (0.0%) | ||
| Sheep, Goat, and Cow | 9 | 1 | 1 | 2 | 0 | 4 | 1 |
| (11.1%) | (11.1%) | (22.2%) | (0.0%) | (44.4%) | (11.1%) | ||
| Cow | 9 | 6 | 1 | 0 | 0 | 2 | 0 |
| (66.7%) | (11.1%) | (0.0%) | (0.0%) | (22.2%) | (0.0%) | ||
| Sheep | 8 | 0 | 0 | 6 | 1 | 0 | 1 |
| (0.0%) | (0.0%) | (75%) | (12.5) | (0.0%) | (12.5%) | ||
| Not defined | 26 | 2 | 3 | 2 | 3 | 1 | 15 |
| (7.7%) | (11.5%) | (7.8%) | (11.5%) | (3.9%) | (57.7%) | ||
| Predicted Cheese Type | ||||||
|---|---|---|---|---|---|---|
| Actual Cheese Type | Group Size | Hard | Semi-Hard | Soft | Spread | Whey |
| Hard | 50 | 42 | 7 | 1 | 0 | 0 |
| (84.0%) | (14.0%) | (2.0%) | (0.0%) | (0.0%) | ||
| Soft | 17 | 2 | 0 | 13 | 2 | 0 |
| (11.8%) | (0.0%) | (76.5%) | (11.8%) | (0.0%) | ||
| Whey | 17 | 0 | 0 | 1 | 1 | 15 |
| (0.0%) | (0.0%) | (5.9%) | (5.9%) | (88.2%) | ||
| Spread | 11 | 0 | 0 | 2 | 9 | 0 |
| (0.0%) | (0.0%) | (18.2%) | (81.8%) | (0.0%) | ||
| Semihard | 5 | 1 | 4 | 0 | 0 | 0 |
| (20.0%) | (80.0%) | (0.0%) | (0.0%) | (0.0%) | ||
Disclaimer/Publisher’s Note: The statements, opinions and data contained in all publications are solely those of the individual author(s) and contributor(s) and not of MDPI and/or the editor(s). MDPI and/or the editor(s) disclaim responsibility for any injury to people or property resulting from any ideas, methods, instructions or products referred to in the content. |
© 2023 by the authors. Licensee MDPI, Basel, Switzerland. This article is an open access article distributed under the terms and conditions of the Creative Commons Attribution (CC BY) license (https://creativecommons.org/licenses/by/4.0/).
Share and Cite
Pappa, E.C.; Kondyli, E.; Pappas, A.C.; Giamouri, E.; Sarri, A.; Mavrommatis, A.; Zoidis, E.; Papalamprou, L.; Simitzis, P.; Goliomytis, M.; et al. Compositional Differences of Greek Cheeses of Limited Production. Foods 2023, 12, 2426. https://doi.org/10.3390/foods12122426
Pappa EC, Kondyli E, Pappas AC, Giamouri E, Sarri A, Mavrommatis A, Zoidis E, Papalamprou L, Simitzis P, Goliomytis M, et al. Compositional Differences of Greek Cheeses of Limited Production. Foods. 2023; 12(12):2426. https://doi.org/10.3390/foods12122426
Chicago/Turabian StylePappa, Eleni C., Efthymia Kondyli, Athanasios C. Pappas, Elisavet Giamouri, Aikaterini Sarri, Alexandros Mavrommatis, Evangelos Zoidis, Lida Papalamprou, Panagiotis Simitzis, Michael Goliomytis, and et al. 2023. "Compositional Differences of Greek Cheeses of Limited Production" Foods 12, no. 12: 2426. https://doi.org/10.3390/foods12122426
APA StylePappa, E. C., Kondyli, E., Pappas, A. C., Giamouri, E., Sarri, A., Mavrommatis, A., Zoidis, E., Papalamprou, L., Simitzis, P., Goliomytis, M., Tsiplakou, E., & Georgiou, C. A. (2023). Compositional Differences of Greek Cheeses of Limited Production. Foods, 12(12), 2426. https://doi.org/10.3390/foods12122426