
Impact of Processing Method on AQF Functionality in Bakery Items


Abstract
1. Introduction
2. Materials and Methods
2.1. Materials
2.2. Preparation of Aquafaba
2.2.1. Extraction and Concentration of Aquafaba
2.2.2. Drying of Aquafaba
2.3. Composition and Functionality
2.3.1. Aquafaba Composition
2.3.2. Functionality
2.4. Application of Aquafaba in Foam, Cakes, and Cookies
2.4.1. AQF Foam
2.4.2. Cake Production
2.4.3. Cookie Production
2.4.4. Sensory Evaluation
2.4.5. Statistical Methods
3. Results and Discussion
3.1. Aquafaba Composition
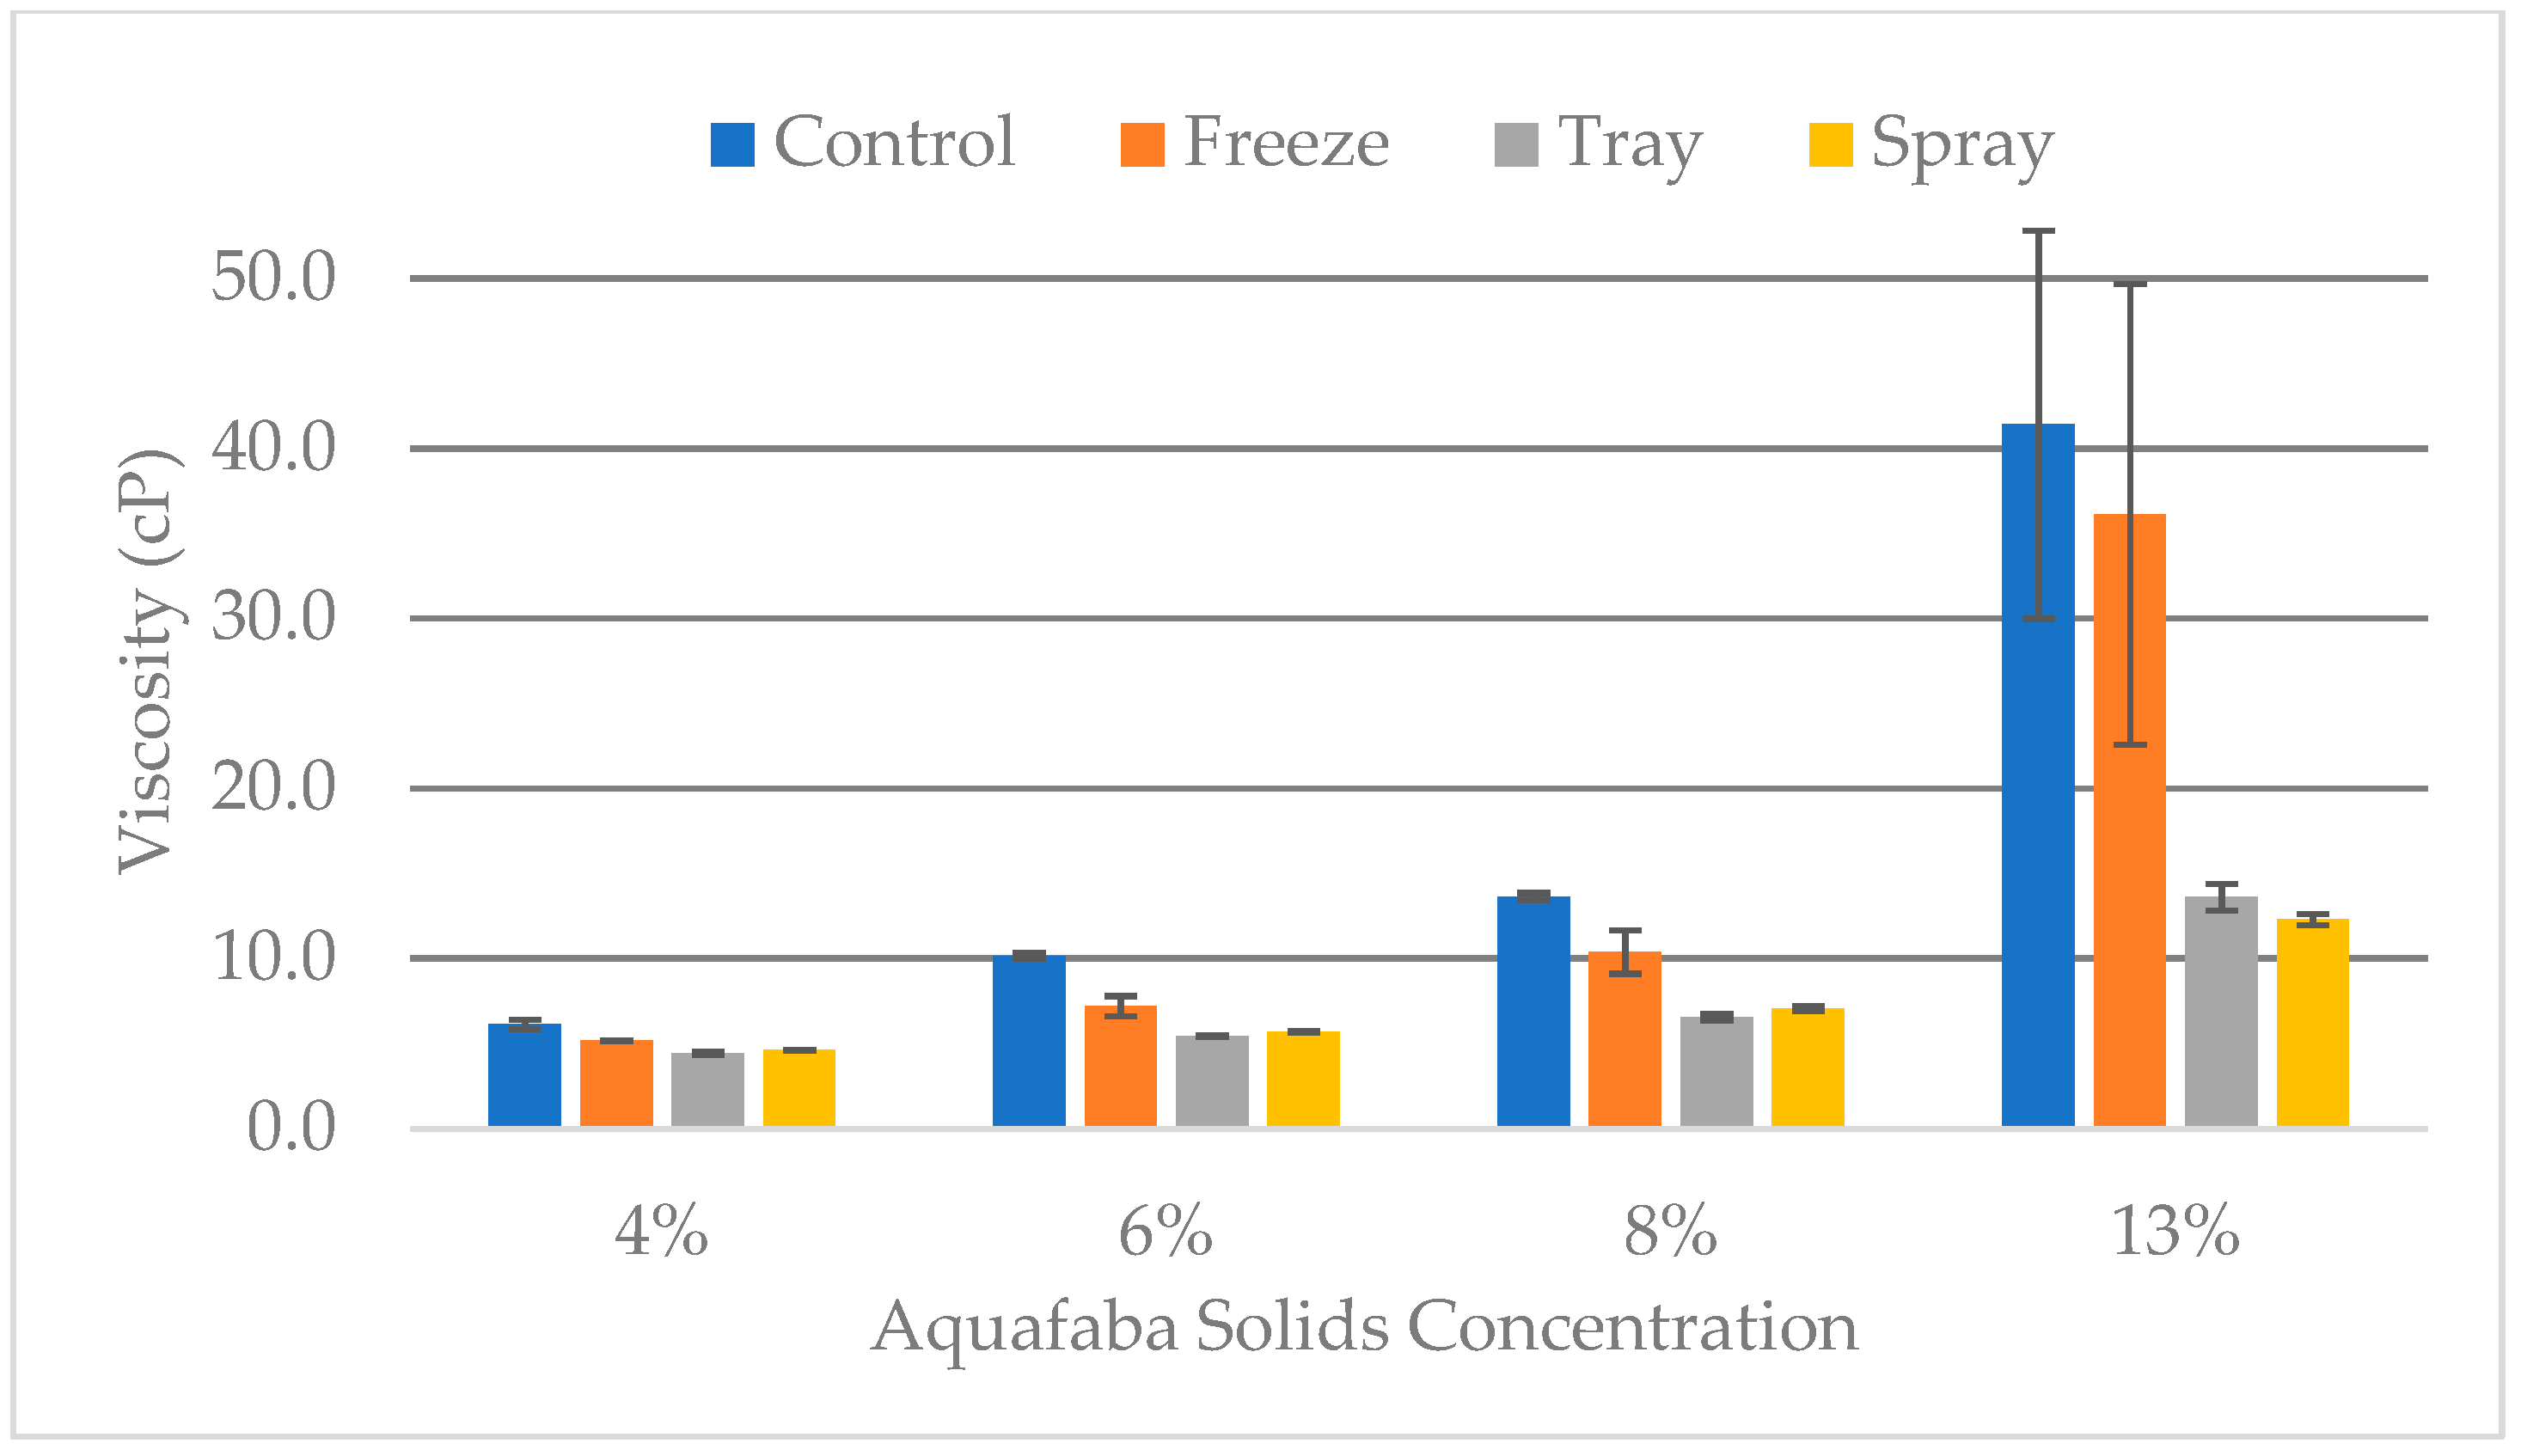
3.2. Functionality
3.3. Model Applications
3.3.1. AQF Foam
3.3.2. Cakes
3.3.3. Cookies
4. Conclusions
Author Contributions
Funding
Institutional Review Board Statement
Data Availability Statement
Acknowledgments
Conflicts of Interest
References
- Dever, Z. Aquafaba: Sweet and Savory Vegan Recipes Made Egg-Free with the Magic of Bean Water; Vegan Heritage Press, LLC: Woodstock, VA, USA, 2016. [Google Scholar]
- Hedayati, S.; Jafari, S.M.; Babajafari, S.; Niakousari, M.; Mazloomi, S.M. Different Food Hydrocolloids and Biopolymers as Egg Replacers: A Review of Their Influences on the Batter and Cake Quality. Food Hydrocoll. 2022, 128, 107611. [Google Scholar] [CrossRef]
- Wilderjans, E.; Luyts, A.; Brijs, K.; Delcour, J. Ingredient functionality in batter type cake making. Trends Food Sci. Technol. 2013, 30, 6–15. [Google Scholar] [CrossRef]
- Mine, Y. Recent advances in the understanding of egg white protein functionality. Trends Food Sci. Technol. 1995, 6, 225–232. [Google Scholar] [CrossRef]
- Weijers, M.; van de Velde, F.; Stijnman, A.; van de Pijpekamp, A.; Visschers, R. Structure and rheological properties of acid-induced egg white protein gels. Food Hydrocoll. 2006, 20, 146–159. [Google Scholar] [CrossRef]
- Shim, Y.Y.; Mustafa, R.; Shen, J.; Ratanapariyanuch, K.; Reaney, M.J.T. Composition and Properties of Aquafaba: Water Recovered from Commercially Canned Chickpeas. J. Vis. Exp. 2018, 132, e56305. [Google Scholar] [CrossRef]
- Mustafa, R.; He, Y.; Shim, Y.Y.; Reaney, M.J.T. Aquafaba, Wastewater from Chickpea Canning, Functions as an Egg Replacer in Sponge Cake. Int. J. Food Sci. Technol. 2018, 53, 2247–2255. [Google Scholar] [CrossRef]
- Stantiall, S.; Dale, K.; Calizo, F.; Serventi, L. Application of Pulses Cooking Water as Functional Ingredients: The Foaming and Gelling Ability. Eur. Food Res. Technol. 2018, 244, 97–104. [Google Scholar] [CrossRef]
- Nguyen, T.M.N.; Nguyen, T.P.; Tran, G.B.; Le, P.T.Q. Effect of Processing Methods on Foam Properties and Application of Lima Bean (Phaseolus Lunatus L.) Aquafaba in Eggless Cupcakes. J. Food Process. Preserv. 2020, 44, e14886. [Google Scholar] [CrossRef]
- Chen, W.; Chiu, H.T.; Feng, Z.; Maes, E.; Serventi, L. Effect of Spray-Drying and Freeze-Drying on the Composition, Physical Properties, and Sensory Quality of Pea Processing Water (Liluva). Foods 2021, 10, 1401. [Google Scholar] [CrossRef]
- Shim, Y.Y.; He, Y.; Kim, J.H.; Cho, J.Y.; Meda, V.; Hong, W.S.; Shin, W.-S.; Kang, S.J.; Reaney, M.J.T. Aquafaba from Korean Soybean I: A Functional Vegan Food Additive. Foods 2021, 10, 2433. [Google Scholar] [CrossRef]
- Echeverria-Jaramillo, E.; Kim, Y.; Nam, Y.; Zheng, Y.; Cho, J.Y.; Hong, W.S.; Kang, S.J.; Kim, J.H.; Shim, Y.Y.; Shin, W.-S. Revalorization of the Cooking Water (Aquafaba) from Soybean Varieties Generated as a By-Product of Food Manufacturing in Korea. Foods 2021, 10, 2287. [Google Scholar] [CrossRef] [PubMed]
- He, Y.; Shim, Y.Y.; Mustafa, R.; Meda, V.; Reaney, M.J.T. Chickpea Cultivar Selection to Produce Aquafaba with Superior Emulsion Properties. Foods 2019, 8, 685. [Google Scholar] [CrossRef] [PubMed]
- Lafarga, T.; Villaró, S.; Bobo, G.; Aguiló-Aguayo, I. Optimisation of the PH and Boiling Conditions Needed to Obtain Improved Foaming and Emulsifying Properties of Chickpea Aquafaba Using a Response Surface Methodology. Int. J. Gastron. Food Sci. 2019, 18, 100177. [Google Scholar] [CrossRef]
- Alsalman, F.B.; Tulbek, M.; Nickerson, M.; Ramaswamy, H.S. Evaluation of Factors Affecting Aquafaba Rheological and Thermal Properties. LWT 2020, 132, 109831. [Google Scholar] [CrossRef]
- Meurer, M.C.; de Souza, D.; Ferreira Marczak, L.D. Effects of Ultrasound on Technological Properties of Chickpea Cooking Water (Aquafaba). J. Food Eng. 2020, 265, 109688. [Google Scholar] [CrossRef]
- Buhl, T.F.; Christensen, C.H.; Hammershøj, M. Aquafaba as an Egg White Substitute in Food Foams and Emulsions: Protein Composition and Functional Behavior. Food Hydrocoll. 2019, 96, 354–364. [Google Scholar] [CrossRef]
- He, Y.; Purdy, S.K.; Tse, T.J.; Tar’an, B.; Meda, V.; Reaney, M.J.T.; Mustafa, R. Standardization of Aquafaba Production and Application in Vegan Mayonnaise Analogs. Foods 2021, 10, 1978. [Google Scholar] [CrossRef]
- Ozcan, I.; Ozyigit, E.; Erkoc, S.; Tavman, S.; Kumcuoglu, S. Investigating the Physical and Quality Characteristics and Rheology of Mayonnaise Containing Aquafaba as an Egg Substitute. J. Food Eng. 2023, 344, 111388. [Google Scholar] [CrossRef]
- Włodarczyk, K.; Zienkiewicz, A.; Szydłowska-Czerniak, A. Radical Scavenging Activity and Physicochemical Properties of Aquafaba-Based Mayonnaises and Their Functional Ingredients. Foods 2022, 11, 1129. [Google Scholar] [CrossRef]
- Karatay, G.G.B.; Galvão, A.M.M.T.; Hubinger, M.D. Storage Stability of Conventional and High Internal Phase Emulsions Stabilized Solely by Chickpea Aquafaba. Foods 2022, 11, 1588. [Google Scholar] [CrossRef]
- Raikos, V.; Hayes, H.; Ni, H. Aquafaba from Commercially Canned Chickpeas as Potential Egg Replacer for the Development of Vegan Mayonnaise: Recipe Optimisation and Storage Stability. Int. J. Food Sci. Technol. 2020, 55, 1935–1942. [Google Scholar] [CrossRef]
- Tufaro, D.; Cappa, C. Chickpea Cooking Water (Aquafaba): Technological Properties and Application in a Model Confectionery Product. Food Hydrocoll. 2023, 136, 108231. [Google Scholar] [CrossRef]
- Kiosseoglou, V.; Paraskevopoulou, A. Eggs. In Bakery Products: Science and Technology; Hui, Y.H., Corke, H., De Leyn, I., Nip, W., Cross, N., Eds.; Blackwell Publishing: Oxford, UK, 2006; pp. 161–172. [Google Scholar]
- Deleu, L.; Wilderjans, E.; Van Haesendonck, I.; Brijs, K.; Delcour, J. Protein network formation during pound cake making: The role of egg white proteins and wheat flour gliadins. Food Hydrocoll. 2016, 61, 409–414. [Google Scholar] [CrossRef]
- Wilderjans, E.; Luyts, A.; Goesaert, H.; Brijs, K.; Delcour, J. A model approach to starch and protein functionality in a pound cake system. Food Chem. 2012, 120, 44–51. [Google Scholar] [CrossRef]
- Grossi Bovi Karatay, G.; Rebellato, A.P.; Joy Steel, C.; Dupas Hubinger, M. Chickpea Aquafaba-Based Emulsions as a Fat Replacer in Pound Cake: Impact on Cake Properties and Sensory Analysis. Foods 2022, 11, 2484. [Google Scholar] [CrossRef]
- Roozen, M.; Serventi, L. Ingredients from Climate Resilient Crops to Enhance the Nutritional Quality of Gluten-Free Bread. Foods 2022, 11, 1628. [Google Scholar] [CrossRef] [PubMed]
- Cabrita, M.; Simões, S.; Álvarez-Castillo, E.; Castelo-Branco, D.; Tasso, A.; Figueira, D.; Guerrero, A.; Raymundo, A. Development of Innovative Clean Label Emulsions Stabilized by Vegetable Proteins. Int. J. Food Sci. Technol. 2023, 58, 406–422. [Google Scholar] [CrossRef]
- Cereals and Grains Association. Total Starch Assay Procedure (Megazyme Amyloglucosidase/alpha-Amylase Method). In AACC Approved Methods of Analysis, 11th ed.; Method 76-13.01; Cereals and Grains Association: St. Paul, MN, USA, 2016. [Google Scholar]
- Cereals and Grains Association. Moisture—Air Oven Methods. In AACC Approved Methods of Analysis, 11th ed.; Method 44-15.02; Cereals and Grains Association: St. Paul, MN, USA, 2016. [Google Scholar]
- Cereals and Grains Association. Ash—Basic Method. In AACC Approved Methods of Analysis, 11th ed.; Method 08-01.01; Cereals and Grains Association: St. Paul, MN, USA, 2016. [Google Scholar]
- American Oil Chemists Society. Oil in Seed Meals and Cakes. In Official Methods and Recommended Practices of the AOCS, 7th ed.; AOCS Official Method Ba 3-38; American Oil Chemists Society: Urbana, IL, USA, 2022. [Google Scholar]
- Cereals and Grains Association. Crude Protein—Combustion Method. In AACC Approved Methods of Analysis, 11th ed.; Method 46-30.01; Cereals and Grains Association: St. Paul, MN, USA, 2016. [Google Scholar]
- AOAC International. Total Dietary Fiber in Foods, Enzymatic-Gravimetric Method. In Official Methods of Analysis, 18th ed.; Method 985.29; AOAC International: Gaithersburg, MD, USA, 2010. [Google Scholar]
- Stone, A.K.; Karalash, A.; Tyler, R.T.; Warkentin, T.D.; Nickerson, M.T. Functional attributes of pea protein isolates prepared using different extraction methods and cultivars. Food Res. Int. 2015, 76, 31–38. [Google Scholar] [CrossRef]
- Yasumatsu, K.; Sawada, K.; Moritaka, S.; Misaki, M.; Toda, J.; Wada, T.; Ishii, K. Whipping and Emulsifying Properties of Soybean Products. Agric. Biol. Chem. 1972, 36, 719–727. [Google Scholar] [CrossRef]
- Cereals and Grains Association. Use of Layer Cake Measuring Template. In AACC Approved Methods of Analysis, 11th ed.; Method 10-91.01; Cereals and Grains Association: St. Paul, MN, USA, 2016. [Google Scholar]
- Gohl, M.T. Flavor Modification of Pea Flour Using Ethanol-Based Deodorization. Master’s Thesis, North Dakota State University, Fargo, ND, USA, 2019. Available online: https://library.ndsu.edu/ir/handle/10365/31568 (accessed on 28 April 2023).
- Cereals and Grains Association. Baking Quality of Cookie Flour—Micro Wire-Cut Formulation. In AACC Approved Methods of Analysis, 11th ed.; Method 10-54.01; Cereals and Grains Association: St. Paul, MN, USA, 2016. [Google Scholar]
- Damian, J.J.; Huo, S.; Serventi, L. Phytochemical Content and Emulsifying Ability of Pulses Cooking Water. Eur. Food Res. Technol. 2018, 244, 1647–1655. [Google Scholar] [CrossRef]
- Ruiz, R.; Price, K.; Arthur, A.E.; Rose, M.; Rhodes, M.; Fenwick, R. Effect of Soaking and Cooking on the Saponin Content and Composition of Chickpeas (Cicer arietinum) and Lentils (Lens culinaris). J. Agric. Food Chem. 1996, 44, 1526–1530. [Google Scholar] [CrossRef]
- El-Adawy, T.A. Nutritional composition and antinutritional factors of chickpeas (Cicer arietinum L.) undergoing different cooking methods and germination. Plant Foods Hum. Nutr. 2002, 57, 83–97. [Google Scholar] [CrossRef] [PubMed]
- Can Karaca, A.; Nickerson, M.T. Developing Value-Added Protein Ingredients from Wastes and Byproducts of Pulses: Challenges and Opportunities. ACS Omega 2022, 7, 18192–18196. [Google Scholar] [CrossRef] [PubMed]
- He, Y.; Meda, V.; Reaney, M.J.T.; Mustafa, R. Aquafaba, a New Plant-Based Rheological Additive for Food Applications. Trends Food Sci. Technol. 2021, 111, 27–42. [Google Scholar] [CrossRef]
- Alsalman, F.B.; Al-Ruwaih, N.; Al-Attar, H.; Mulla, M.Z. Effect of High Pressure Processing on Structural and Functional Properties of Canned Aquafaba. Food Sci. Biotechnol. 2022, 31, 1157–1167. [Google Scholar] [CrossRef] [PubMed]
- Bird, L.G.; Pilkington, C.L.; Saputra, A.; Serventi, L. Products of chickpea processing as texture improvers in gluten-free bread. Food Sci. Technol. Int. 2017, 23, 690–698. [Google Scholar] [CrossRef] [PubMed]
- Zhang, Z.; Fan, X.; Yang, X.; Li, C.; Gilbert, R.; Enpeng, L. Effects of amylose and amylopectin fine structure on sugar-snap cookie dough rheology and cookie quality. Carbohydr. Polym. 2020, 241, 116371. [Google Scholar] [CrossRef]


| Ingredient | Egg Formula (%) | Dried Aquafaba Formula (%) | Reverse Osmosis Aquafaba Formula (%) 1 |
|---|---|---|---|
| Cake Mix | 247.5 g (60.7) | 255 g (62.6) | 255 g (62.6) |
| Water | 115 g (28.2) | 143.5 g (35.2) | 79.7 g (19.6) |
| Egg | 45.25 (11.1) | 0 | 0 |
| Aquafaba | 0 | 9.2 g (2.2) | 73.0 g (17.9) |
| Ingredient | Egg Formula (%) | Dried Aquafaba Formula (%) 1 | Concentrated Aquafaba Formula (%) 2 |
|---|---|---|---|
| Flour | 209.5 g (41.9) | 209.5 g (41.9) | 209.5 g (41.9) |
| Butter | 131 g (26.2) | 131 g (26.2) | 131 g (26.2) |
| Sugar | 125.5 g (25.1) | 125.5 g (25.1) | 125.5 g (25.1) |
| Egg | 28.5 g (5.7) | 0 | 0 |
| Aquafaba | 0 | 7.41 g (1.5) | 28.5 g (5.7) |
| Water | 0 | 21.09 g (4.2) | 0 |
| Vanilla | 3.0 g (0.6) | 3.0 g (0.6) | 3.0 g (0.6) |
| Baking Soda | 1.5 g (0.3) | 1.5 g (0.3) | 1.5 g (0.3) |
| Baking Powder | 1.0 g (0.2) | 1.0 g (0.2) | 1.0 g (0.2) |
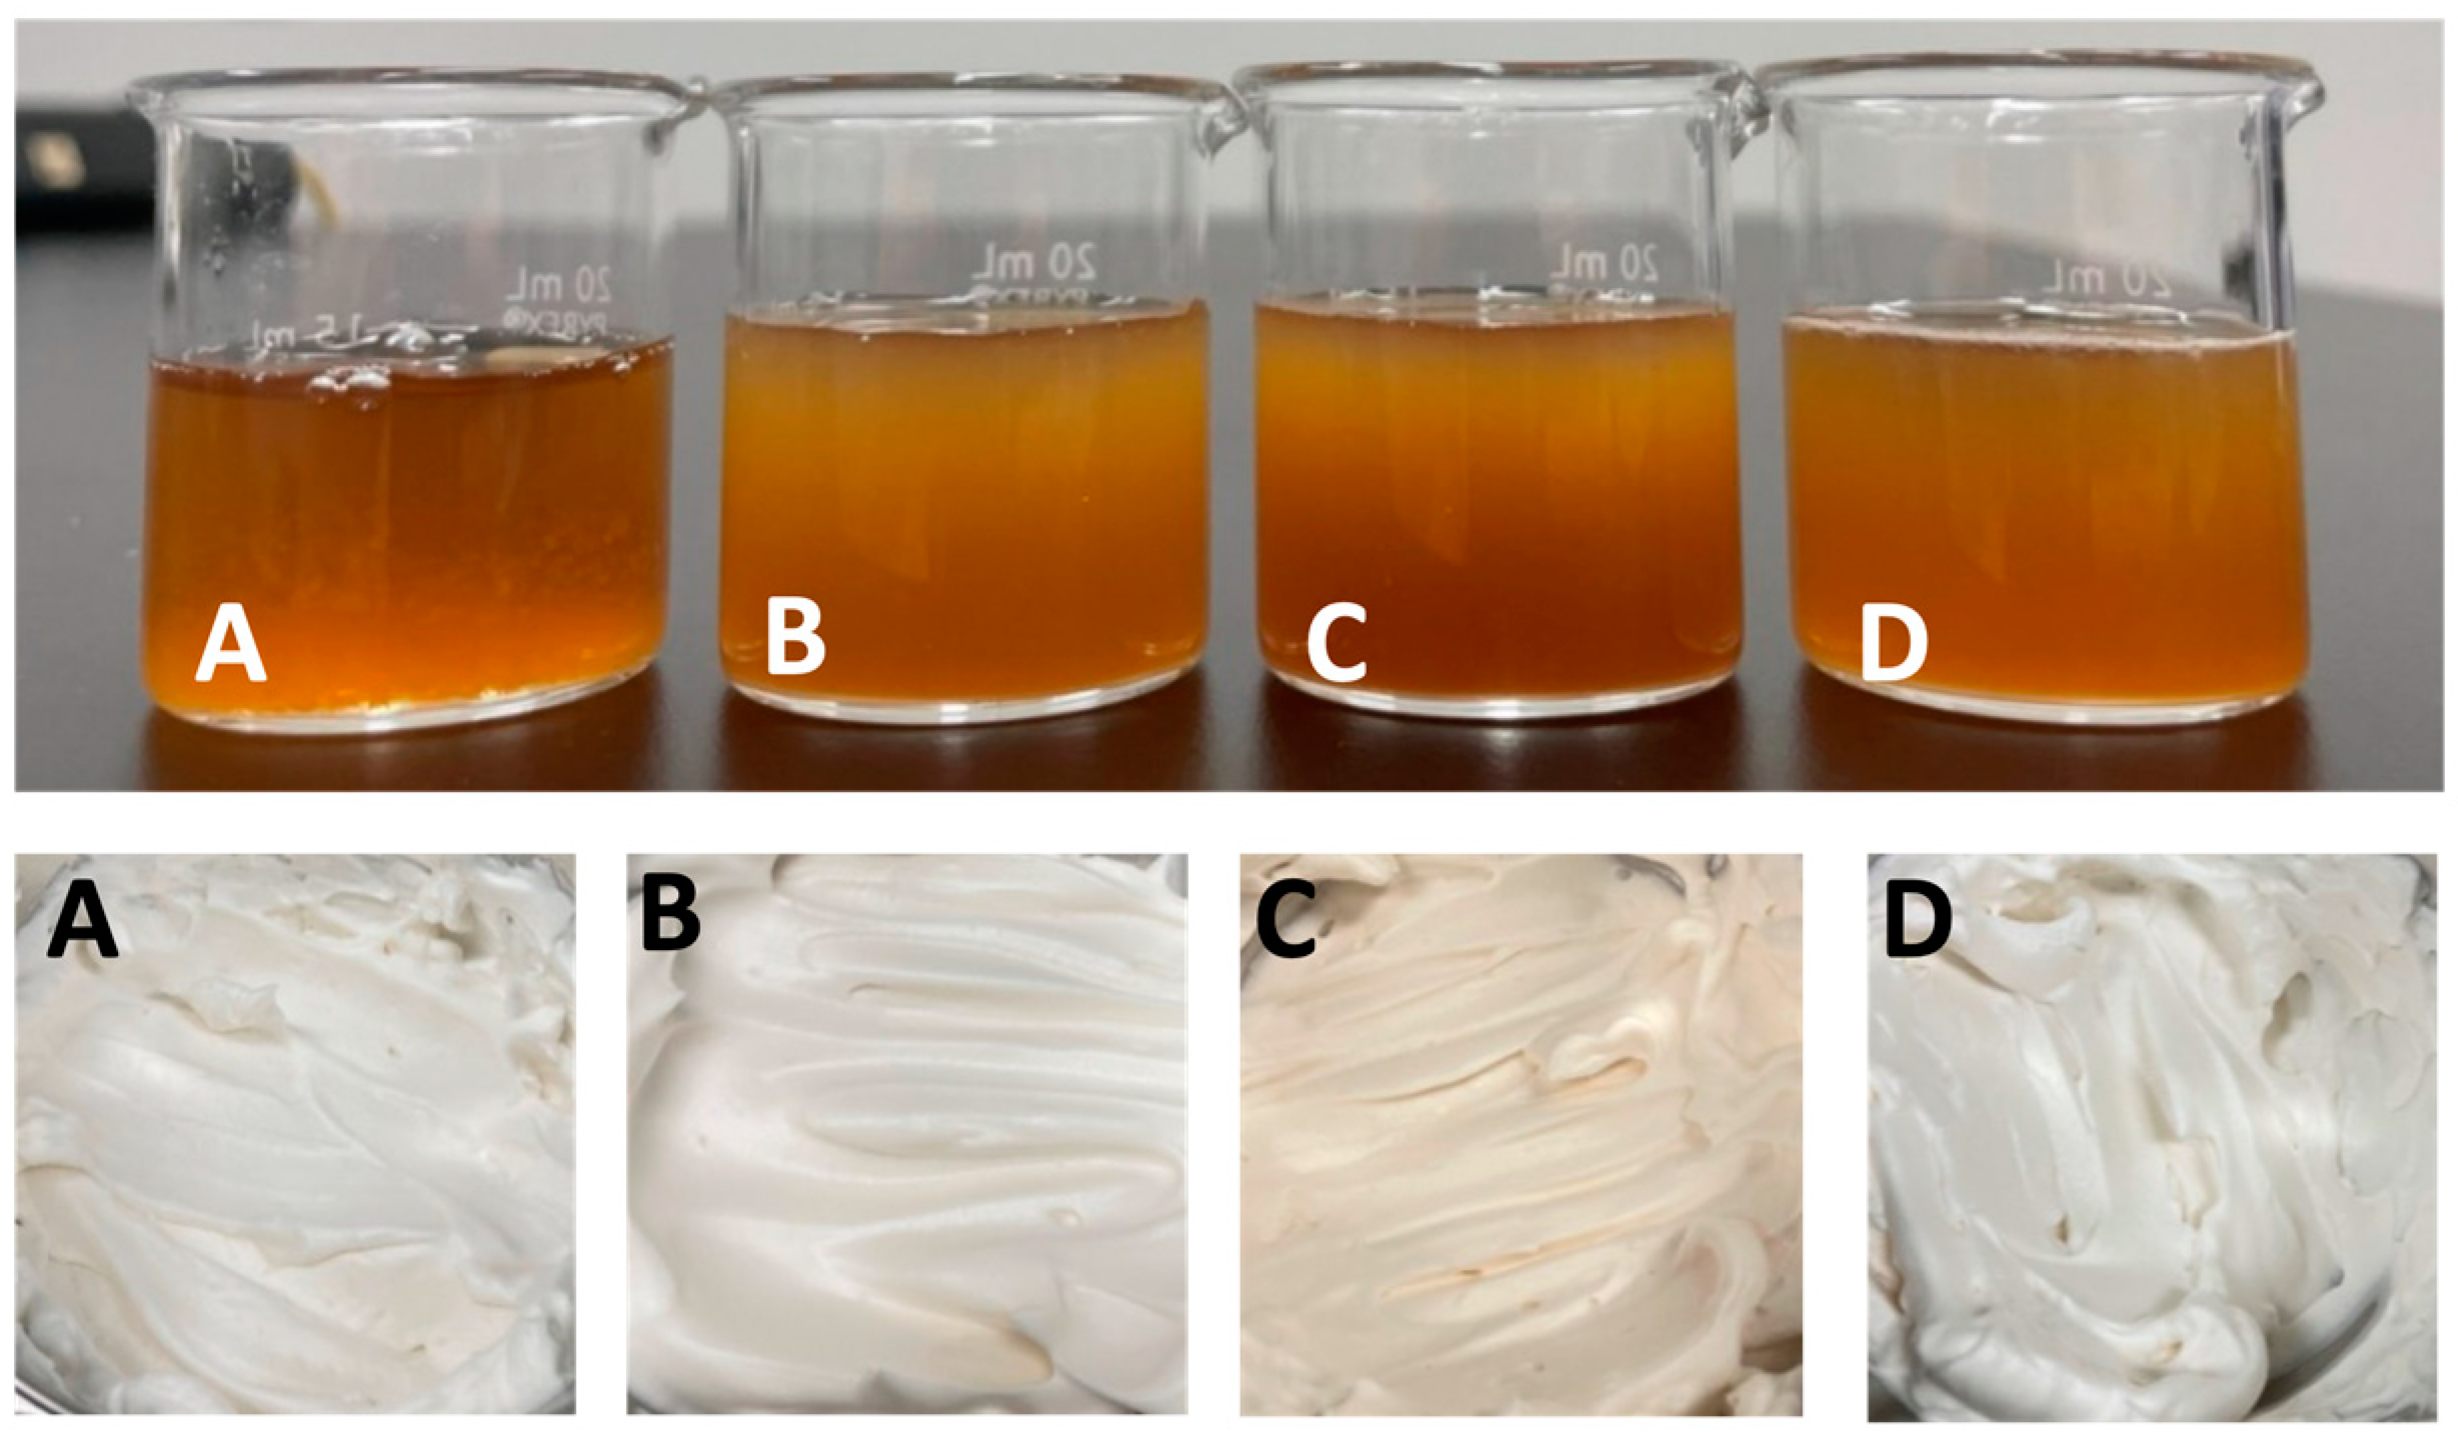
| Sample | L* | a* | b* |
|---|---|---|---|
| Spray-Dried | 86.39 ± 0.08 A | −0.31 ± 0.01 C | 14.68 ± 0.56 B |
| Freeze-Dried | 82.69 ± 0.02 A | 0.71 ± 0.01 B | 15.54 ± 0.42 B |
| Tray-Dried | 65.52 ± 21.20 A | 1.70 ± 0.03 A | 23.10 ± 0.19 A |
| Sample | Starch (%) 1 | Protein (%) | Lipid (%) | Ash (%) | TDF (%) 3 |
|---|---|---|---|---|---|
| Freeze | 0.3 ± 0.2 | 21.7 ± 1.0 | 0.1 ± 0.01 | 13.2 ± 0.4 | 6.0 ± 1.5 |
| Spray | 0.3 ± 0.2 | 22.6 ± 0.2 | 0.0 ± 0.00 | 13.1 ± 0.4 | 8.7 ± 0.4 |
| Tray | 0.3 ± 0.2 | 21.9 ± 0.9 | 0.0 ± 0.00 | 13.4 ± 0.3 | 7.0 ± 1.0 |
| cAQF 2 | 0.041 ± 0.02 | 3.0 ± 0.01 | 0.0 ± 0.00 | 1.8 ± 0.14 | 0.8 ± 0.25 |
| Sample | Glucose (%) 1 | Sucrose (%) | Fructose (%) | Stachyose (%) | Raffinose (%) |
|---|---|---|---|---|---|
| Freeze | 0.3 ± 0.1 | 14.2 ± 0.2 | 0.2 ± 0.0 | 10.0 ± 0.1 | 4.0 ± 0.0 |
| Spray | 0.3 ± 0.1 | 14.2 ± 0.1 | 0.2 ± 0.0 | 10.3 ± 0.4 | 4.0 ± 0.2 |
| Tray | 0.1 ± 0.1 | 12.7 ± 0.5 | 0.1 ± 0.1 | 9.7 ± 0.1 | 3.9 ± 0.1 |
| cAQF 2 | 0.01 ± 0.01 | 2.0 ± 0.12 | 0.00 ± 0.00 | 1.4 ± 0.09 | 0.5 ± 0.03 |
| Aquafaba | Emulsion Activity (%) 1 | Emulsion Stability (%) | Foaming Capacity (%) | Foaming Stability (%) |
|---|---|---|---|---|
| cAQF | 54.1 ± 1.2 A | 55.8 ± 1.7 A | 181.0 ± 40.4 B | 33.4 ± 11.1 B |
| Spray-Dried | 42.0 ± 1.6 B | 43.8 ± 7.3 B | 205.0 ± 12.6 A,B | 74.8 ± 6.7 A |
| Freeze-Dried | 41.3 ± 1.3 B | 44.1 ± 4.1 B | 201.7 ± 12.6 B | 74.7 ± 7.6 A |
| Tray-Dried | 40.5 ± 2.4 B | 44.1 ± 4.9 B | 231.7 ± 18.4 A | 70.3 ± 3.5 A |
| Foam | L* | a* | b* |
|---|---|---|---|
| cAQF | 86.97 ± 0.10 A | −0.45 ± 0.01 D | 9.56 ± 0.11 D |
| Freeze-Dried | 85.83 ± 0.18 B | −0.37 ± 0.01 C | 10.71 ± 0.18 C |
| Spray-Dried | 84.89 ± 0.02 C | −0.26 ± 0.02 B | 11.94 ± 0.13 B |
| Tray-Dried | 83.54 ± 0.16 D | 0.14 ± 0.01 A | 14.25 ± 0.11 A |
| Aquafaba | 4% | 6% | 8% | 13% |
|---|---|---|---|---|
| cAQF | 1000 ± 0 A,a | 1000 ± 0 A,a | 1000 ± 0 A,a | 1000 ± 0 A,a |
| Spray-Dried | 790 ± 30 C,b | 898 ± 42 B,a | 950 ± 11 B,a | 743 ± 95 B,b |
| Freeze-Dried | 973 ± 12 B,a | 983 ± 13 A,a | 1000 ± 0 A,a | 1000 ± 0 A,a |
| Tray-Dried | 963 ± 12 B,b | 1000 ± 0 A,a | 1000 ± 0 A,a | 1000 ± 0 A,a |
| Aquafaba | 4% 1 | 6% | 8% | 13% |
|---|---|---|---|---|
| cAQF | 99.8 ± 0.1 A,a | 99.9 ± 0.1 A,a | 100 ± 0 A,a | 100 ± 0 A,a |
| Spray-Dried | 99.2 ± 0.3 B,b | 99.9 ± 0.2 A,a | 100 ± 0 A,a | 100 ± 0 A,a |
| Freeze-Dried | 99.8 ± 0.1 A,b | 100 ± 0 A,a | 100 ± 0 A,a | 99.6 ± 0.1 B,b |
| Tray-Dried | 99.9 ± 0.1 A,b | 100 ± 0 A,a | 100 ± 0 A,a | 100 ± 0 A,a |
| Formula | Firmness (g) 1 | Chewiness (g) | Gumminess (g) | Springiness | Cohesiveness | Resilience |
|---|---|---|---|---|---|---|
| Egg | 415 ± 18 A | 425 ± 12 A | 285 ± 5 A | 1.51 ± 0.02 A | 0.69 ± 0.02 A | 0.41 ± 0.01 A |
| cAQF | 290 ± 22 B | 183 ± 27 B | 183 ± 19 B | 1.00 ± 0.06 B | 0.63 ± 0.02 A,B | 0.34 ± 0.02 B |
| Spray-Dried | 266 ± 2 B | 153 ± 3 B | 157 ± 3 B | 0.97 ± 0.02 B | 0.59 ± 0.01 B | 0.32 ± 0.01 B |
| Freeze-Dried | 283 ± 4 B | 231 ± 51 B | 178 ± 10 B | 1.29 ± 0.22 A, B | 0.63 ± 0.2 A,B | 0.34 ± 0.02 B |
| Tray-Dried | 275 ± 3 B | 152 ± 6 B | 163 ± 3 B | 0.93 ± 0.02 B | 0.59 ± 0.01 B | 0.32 ± 0.01 B |
| Formula | Appearance 1 | Flavor | Texture | Overall |
|---|---|---|---|---|
| Egg | 7.7 ± 1.0 A | 6.9 ± 1.6 A | 6.9 ± 1.6 A | 7.1 ± 1.3 A |
| cAQF | 7.5 ± 1.2 A,B,C | 7.0 ± 1.4 A | 6.9 ± 1.6 A | 7.0 ± 1.4 A |
| Spray-Dried | 7.6 ± 1.1 A,B | 7.1 ± 1.4 A | 6.9 ± 1.6 A | 7.1 ± 1.3 A |
| Freeze-Dried | 7.2 ± 1.3 B,C | 7.0 ± 1.5 A | 6.70 ± 1.6 A,B | 7.0 ± 1.5 A |
| Tray-Dried | 7.0 ± 1.5 C | 5.9 ± 2.1 B | 6.2 ± 1.8 B | 6.1 ± 1.8 B |
| Formula | Day 1 1 | Day 4 | Day 8 | Day 14 |
|---|---|---|---|---|
| Egg | 2.75 ± 0.35 B,a,b | 2.68 ± 0.48 B,b | 3.17 ± 0.38 B,a,c | 3.50 ± 0.46 C,c |
| cAQF | 3.56 ± 0.34 A, a | 4.17 ± 0.38 A,b | 3.64 ± 0.27 A,a | 4.30 ± 0.42 A,B,b |
| Spray-Dried | 2.30 ± 0.37 C,a | 2.37 ± 0.29 C,a | 2.78 ± 0.22 C,b | 4.03 ± 0.41 B,C,c |
| Freeze-Dried | 2.84 ± 0.27 B,a | 2.94 ± 0.36 B,a | 3.26 ± 0.12 B,b | 4.19 ± 0.32 A,B,c |
| Tray-Dried | 2.67 ± 0.40 B,C,a | 2.90 ± 0.25 B,a,b | 3.35 ± 0.20 B,b | 4.61 ± 0.70 A,c |
| Formulation | Diameter (mm) 1 | Thickness (mm) | Spread Factor (D/T) | Hardness (g) | Fracturability (mm) |
|---|---|---|---|---|---|
| Egg | 67.3 ± 0.17 A | 8.2 ± 0.31 A | 8.2 ± 0.24 B | 1808 ± 388 A | 45.35 ± 0.52 A |
| cAQF | 65.1 ± 0.69 A | 7.0 ± 0.06 B | 9.4 ± 0.02 A | 1274 ± 323 B | 42.91 ± 0.45 C |
| Spray-Dried | 67.3 ± 0.92 A | 7.5 ± 0.37 B | 9.0 ± 0.32 A,B | 1621 ± 157 A,B | 44.28 ± 0.54 B |
| Freeze-Dried | 65.7 ± 0.23 A | 7.6 ± 0.18 A,B | 8.7 ± 0.24 A,B | 1687 ± 285 A,B | 44.45 ± 0.27 B |
| Tray-Dried | 66.5 ± 1.09 A | 7.2 ± 0.12 B | 9.3 ± 0.01 A | 1834 ± 101 A | 44.52 ± 0.36 B |
| Ingredient | Day 1 1 | Day 4 | Day 8 | Day 14 |
|---|---|---|---|---|
| Egg | 1808 ± 388 A | 1876 ± 253 A | 1705 ± 233 A,B | 1779 ± 321 A |
| cAQF | 1274 ± 323 B | 1350 ± 325 B | 1224 ± 227 B | 1603 ± 403 A |
| Spray-Dried | 1621 ± 157 A,B | 1790 ± 172 A | 1320 ± 533 A,B | 1718 ± 82 A |
| Freeze-Dried | 1687 ± 285 A,B | 1796 ± 185 A | 1774 ± 220 A | 1967 ± 215 A |
| Tray-Dried | 1834 ± 101 A | 1700 ± 202 A | 1638 ± 109 A,B | 1630 ± 149 A |
| Ingredient | Day 1 1 | Day 4 | Day 8 | Day 14 |
|---|---|---|---|---|
| Egg | 45.35 ± 0.52 A,a | 45.37 ± 0.32 A,a | 45.05 ± 0.31 A,a | 45.16 ± 0.41 A,a |
| cAQF | 42.91 ± 0.45 C, b | 43.64 ± 0.34 C,a,b | 42.88 ± 0.55 C,b | 44.18 ± 0.93 A,B,a |
| Spray-Dried | 44.28 ± 0.54 B,a | 43.99 ± 0.51 B,C,a | 43.40 ± 1.28 B,C,a | 44.00 ± 0.57 B,a |
| Freeze-Dried | 44.45 ± 0.27 B,a | 44.48 ± 0.29 B,a | 44.42 ± 0.37 A,B,a | 44.36 ± 0.33 A,B,a |
| Tray-Dried | 44.52 ± 0.36 B,a | 43.74 ± 0.58 C,b | 43.77 ± 0.43 B,C,b | 43.53 ± 0.14 B,b |
| Formula | Appearance 1 | Flavor | Texture | Overall |
|---|---|---|---|---|
| Egg | 7.0 ± 1.3 A | 6.3 ± 1.7 B | 6.9 ± 1.5 B | 6.6 ± 1.6 C |
| cAQF | 7.4 ± 1.1 A | 7.3 ± 1.4 A | 7.5 ± 1.2 A | 7.4 ± 1.2 A |
| Spray-Dried | 7.4 ± 1.2 A | 7.3 ± 1.2 A | 7.4 ± 1.3 A | 7.5 ± 1.1 A |
| Freeze-Dried | 7.2 ± 1.2 A | 7.2 ± 1.5 A | 7.2 ± 1.4 A,B | 7.2 ± 1.5 A,B |
| Tray-Dried | 7.3 ± 1.2 A | 6.8 ± 1.6 A,B | 7.2 ± 1.3 A,B | 6.9 ± 1.8 B,C |
Disclaimer/Publisher’s Note: The statements, opinions and data contained in all publications are solely those of the individual author(s) and contributor(s) and not of MDPI and/or the editor(s). MDPI and/or the editor(s) disclaim responsibility for any injury to people or property resulting from any ideas, methods, instructions or products referred to in the content. |
© 2023 by the authors. Licensee MDPI, Basel, Switzerland. This article is an open access article distributed under the terms and conditions of the Creative Commons Attribution (CC BY) license (https://creativecommons.org/licenses/by/4.0/).
Share and Cite
Edleman, D.; Hall, C. Impact of Processing Method on AQF Functionality in Bakery Items. Foods 2023, 12, 2210. https://doi.org/10.3390/foods12112210
Edleman D, Hall C. Impact of Processing Method on AQF Functionality in Bakery Items. Foods. 2023; 12(11):2210. https://doi.org/10.3390/foods12112210
Chicago/Turabian StyleEdleman, Dana, and Clifford Hall. 2023. "Impact of Processing Method on AQF Functionality in Bakery Items" Foods 12, no. 11: 2210. https://doi.org/10.3390/foods12112210
APA StyleEdleman, D., & Hall, C. (2023). Impact of Processing Method on AQF Functionality in Bakery Items. Foods, 12(11), 2210. https://doi.org/10.3390/foods12112210