
Prospective Associations between Dietary Patterns and Abdominal Obesity in Middle-Aged and Older Korean Adults

 , ,
, ,
Abstract
:1. Introduction
2. Materials and Methods
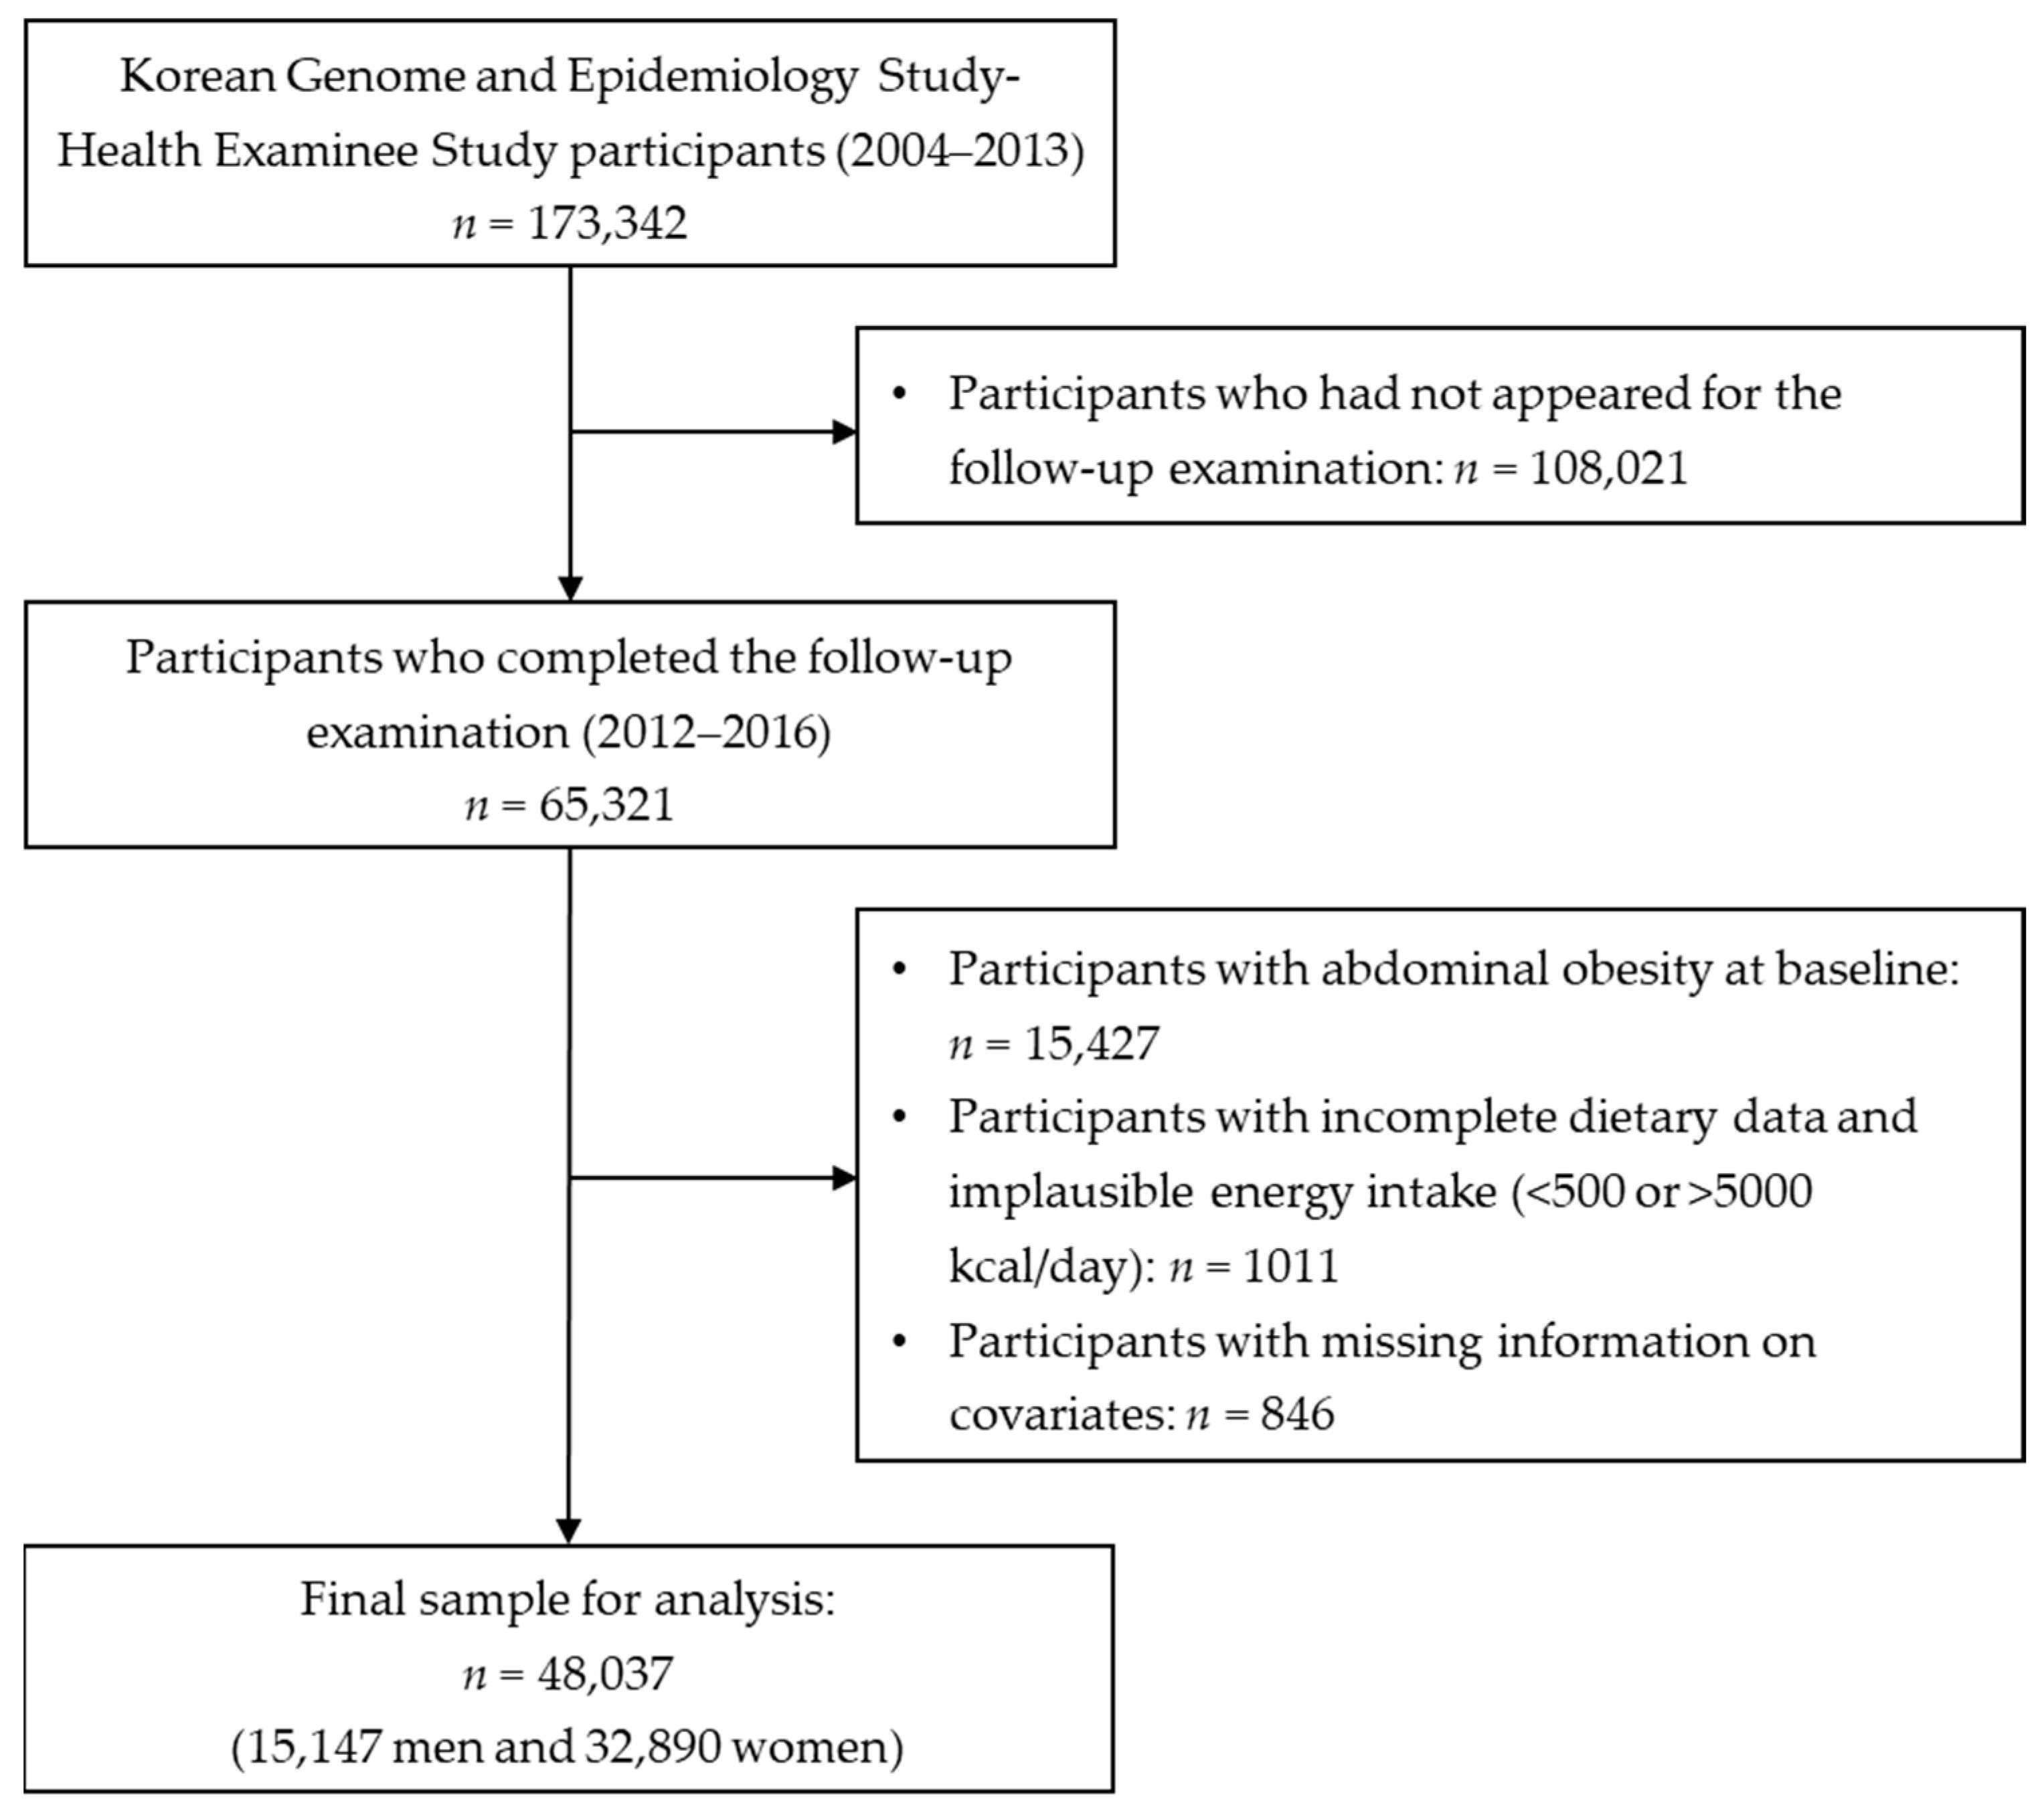
2.1. Data Source and Study Participants
2.2. Dietary Pattern Analysis
2.3. Definition of Abdominal Obesity
2.4. Statistical Analyses
3. Results
3.1. Factor Analysis and Dietary Patterns
3.2. General Characteristics of Study Participants with Dietary Patterns at Baseline
3.3. Energy and Nutrient Intake of Study Participants Based on Dietary Patterns at Baseline
3.4. Association of Dietary Patterns with the Incidence of Abdominal Obesity
4. Discussion
5. Conclusions
Author Contributions
Funding
Institutional Review Board Statement
Informed Consent Statement
Data Availability Statement
Acknowledgments
Conflicts of Interest
References
- Fang, H.; Berg, E.; Cheng, X.; Shen, W. How to best assess abdominal obesity. Curr. Opin. Clin. Nutr. Metab. Care 2018, 21, 360–365. [Google Scholar] [CrossRef] [PubMed]
- Korean Society for the Study of Obesity. Obesity Fact Sheet 2021. Available online: https://www.kosso.or.kr/popup/obesity_fact_sheet.html (accessed on 26 October 2022).
- Ritchie, S.; Connell, J.M.C. The link between abdominal obesity, metabolic syndrome and cardiovascular disease. Nutr. Metab. Cardiovasc. Dis. 2007, 17, 319–326. [Google Scholar] [CrossRef] [PubMed]
- Zhang, C.; Rexrode, K.M.; Van Dam, R.M.; Li, T.Y.; Hu, F.B. Abdominal obesity and the risk of all-cause, cardiovascular, and cancer mortality: Sixteen years of follow-up in US women. Circulation 2008, 117, 1658–1667. [Google Scholar] [CrossRef]
- Hajhashemy, Z.; Shahdadian, F.; Ziaei, R.; Saneei, P. Serum vitamin D levels in relation to abdominal obesity: A systematic review and dose–response meta-analysis of epidemiologic studies. Obes. Rev. 2021, 22, e13134. [Google Scholar] [CrossRef] [PubMed]
- Sandoval-Insausti, H.; Jiménez-Onsurbe, M.; Donat-Vargas, C.; Rey-García, J.; Banegas, J.R.; Rodríguez-Artalejo, F.; Guallar-Castillón, P. Ultra-processed food consumption is associated with abdominal obesity: A prospective cohort study in older adults. Nutrients 2020, 12, 2368. [Google Scholar] [CrossRef] [PubMed]
- Nam, J. Effect of weight control program on obesity degree and blood lipid levels among middle-aged obese women. Korean J. Food Nutr. 2006, 19, 70–78. [Google Scholar]
- Lim, M.; Kim, J. Association between fruit and vegetable consumption and risk of metabolic syndrome determined using the Korean Genome and Epidemiology Study (KoGES). Eur. J. Nutr. 2020, 59, 1667–1678. [Google Scholar] [CrossRef]
- Lee, K.W.; Cho, W. The consumption of dairy products is associated with reduced risks of obesity and metabolic syndrome in Korean women but not in men. Nutrients 2017, 9, 630. [Google Scholar] [CrossRef]
- Bahadoran, Z.; Golzarand, M.; Mirmiran, P.; Saadati, N.; Azizi, F. The association of dietary phytochemical index and cardiometabolic risk factors in adults: Tehran Lipid and Glucose Study. J. Hum. Nutr. Diet. 2013, 26 (Suppl. S1), 145–153. [Google Scholar] [CrossRef]
- Im, J.; Kim, M.; Park, K. Association between the phytochemical index and lower prevalence of obesity/abdominal obesity in Korean adults. Nutrients 2020, 12, 2312. [Google Scholar] [CrossRef]
- Ahn, Y.-J.; Park, Y.-J.; Park, S.-J.; Min, H.-S.; Kwak, H.-K.; Oh, K.-S.; Park, C. Dietary patterns and prevalence odds ratio in middle-aged adults of rural and mid-size city in Korean Genome Epidemiology Study. J. Nutr. Health 2007, 40, 259–269. [Google Scholar]
- Wirfält, A.E.; Jeffery, R.W. Using cluster analysis to examine dietary patterns: Nutrient intakes, gender, and weight status differ across food pattern clusters. J. Am. Diet. Assoc. 1997, 97, 272–279. [Google Scholar] [CrossRef]
- Frank, M.S.; Eva, O.; Marlene, M.W.; Laura, P.S.; William, M.V.; Marjorie, M.; Njeri, K.; Pao-Hwa, L.; Priscilla, S.; Michael, A.P.; et al. Rationale and design of the dietary approaches to stop hypertension trial (DASH). Ann. Epidemiol. 1995, 5, 108–118. [Google Scholar]
- Schwerin, H.S.; Stanton, J.L.; Riley, A.M., Jr.; Schaefer, A.E.; Leveille, G.A.; Elliott, J.G.; Warwick, K.M.; Brett, B.E. Food eating patterns and health: A reexamination of the Ten-State and HANES I surveys. Am. J. Clin. Nutr. 1981, 34, 568–580. [Google Scholar] [CrossRef]
- Newby, P.K.; Muller, D.; Hallfrisch, J.; Qiao, N.; Andres, R.; Tucker, K.L. Dietary patterns and changes in body mass index and waist circumference in adults. Am. J. Clin. Nutr. 2003, 77, 1417–1425. [Google Scholar] [CrossRef] [PubMed]
- Le Port, A.; Gueguen, A.; Kesse-Guyot, E.; Melchior, M.; Lemogne, C.; Nabi, H.; Goldberg, M.; Zins, M.; Czernichow, S. Association between dietary patterns and depressive symptoms over time: A 10-year follow-up study of the GAZEL cohort. PLoS ONE 2012, 7, e51593. [Google Scholar] [CrossRef] [PubMed]
- Hu, F.B. Dietary pattern analysis: A new direction in nutritional epidemiology. Curr. Opin. Lipidol. 2002, 13, 3–9. [Google Scholar] [CrossRef]
- Rodríguez-Ramírez, S.; Martinez-Tapia, B.; González-Castell, D.; Cuevas-Nasu, L.; Shamah-Levy, T. Westernized and diverse dietary patterns are associated with overweight-obesity and abdominal obesity in Mexican adult men. Front. Nutr. 2022, 9, 891609. [Google Scholar] [CrossRef] [PubMed]
- Kim, J.-H.; Lee, J.E.; Jung, I.-K. Dietary pattern classifications and the association with general obesity and abdominal obesity in Korean women. J. Acad. Nutr. Diet. 2012, 112, 1550–1559. [Google Scholar] [CrossRef] [PubMed]
- Ito, T.; Kawakami, R.; Tanisawa, K.; Miyawaki, R.; Ishii, K.; Torii, S.; Suzuki, K.; Sakamoto, S.; Muraoka, I.; Oka, K.; et al. Dietary patterns and abdominal obesity in middle-aged and elderly Japanese adults: Waseda alumni’s sports, exercise, daily activity, sedentariness and health study (WASEDA’S health study). Nutrition 2019, 58, 149–155. [Google Scholar] [CrossRef] [PubMed]
- Xue, Y.; Liu, C.; Pang, S.-B.; Mao, Z.-X.; Zhang, D.-D.; Gao, J.-J.; Lin, J.-S.; Wang, C.-J.; Li, X.; Li, W.-J. The association between the dietary pattern in abdominal obesity based on visceral fat index and dyslipidaemia in the Henan Rural Cohort Study. Br. J. Nutr. 2022, 128, 762–769. [Google Scholar] [CrossRef]
- Kim, Y.; Han, B.; KoGES group. Cohort profile: The Korean genome and epidemiology study (KoGES) Consortium. Int. J. Epidemiol. 2016, 46, e20. [Google Scholar] [CrossRef]
- Ahn, Y.; Kwon, E.; Shim, J.; Park, M.; Joo, Y.; Kimm, K.; Park, C.; Kim, D. Validation and reproducibility of food frequency questionnaire for Korean genome epidemiologic study. Eur. J. Clin. Nutr. 2007, 61, 1435–1441. [Google Scholar] [CrossRef] [PubMed]
- Kim, J.; Yu, A.; Choi, B.Y.; Nam, J.H.; Kim, M.K.; Oh, D.H.; Yang, Y. Dietary patterns derived by cluster analysis are associated with cognitive function among Korean older adults. Nutrients 2015, 7, 4154–4169. [Google Scholar] [CrossRef]
- Lee, K.W.; Woo, H.D.; Cho, M.J.; Park, J.K.; Kim, S.S. Identification of dietary patterns associated with incidence of hyperglycemia in middle-aged and older Korean adults. Nutrients 2019, 11, 1801. [Google Scholar] [CrossRef] [PubMed]
- Song, S.; Kim, J.; Kim, J. Gender differences in the association between dietary pattern and the incidence of hypertension in middle-aged and older adults. Nutrients 2018, 10, 252. [Google Scholar] [CrossRef]
- Lee, H.A.; Son, N.; Lee, W.K.; Park, H. A diabetes-related dietary pattern is associated with incident diabetes in obese men in the Korean Genome Epidemiology Study. J. Nutr. 2019, 149, 323–329. [Google Scholar] [CrossRef]
- Willett, W.; Stampfer, M.J. Total energy intake: Implications for epidemiologic analyses. Am. J. Epidemiol. 1986, 124, 17–27. [Google Scholar] [CrossRef] [PubMed]
- Kim, B.Y.; Kang, S.M.; Kang, J.H.; Kang, S.Y.; Kim, K.K.; Kim, K.B.; Kim, B.; Kim, S.J.; Kim, Y.H.; Kim, J.H.; et al. 2020 Korean Society for the study of obesity guidelines for the management of obesity in Korea. J. Obes. Metab. Syndr. 2021, 30, 81–92. [Google Scholar] [CrossRef]
- Moreira, P.L.; Corrente, J.E.; Villas Boas, P.J.F.; Ferreira, A.L. Dietary patterns are associated with general and central obesity in elderly living in a Brazilian city. Rev. Assoc. Med. Bras. 2014, 60, 457–464. [Google Scholar] [CrossRef]
- Zhang, Q.; Chen, X.; Liu, Z.; Varma, D.S.; Wan, R.; Wan, Q.; Zhao, S. Dietary patterns in relation to general and central obesity among adults in Southwest China. Int. J. Environ. Res. Public Health 2016, 13, 1080. [Google Scholar] [CrossRef]
- Yin, X.; Chen, Y.; Lu, W.; Jin, T.; Li, L. Association of dietary patterns with the newly diagnosed diabetes mellitus and central obesity: A community based cross-sectional study. Nutr. Diabetes 2020, 10, 16. [Google Scholar] [CrossRef] [PubMed]
- Basiri, M.G.; Sotoudeh, G.; Djalali, M.; Eshraghian, M.R.; Noorshahi, N.; Rafiee, M.; Nikbazm, R.; Karimi, Z.; Koohdani, F. Association of major dietary patterns with general and abdominal obesity in Iranian patients with type 2 diabetes mellitus. Int. J. Vitam. Nutr. Res. 2015, 85, 145–155. [Google Scholar] [CrossRef] [PubMed]
- Rezagholizadeh, F.; Djafarian, K.; Khosravi, S.; Shab-Bidar, S. A posteriori healthy dietary patterns may decrease the risk of central obesity: Findings from a systematic review and meta-analysis. Nutr. Res. 2017, 41, 1–13. [Google Scholar] [CrossRef]
- Asghari, G.; Mirmiran, P.; Yuzbashian, E.; Azizi, F. A systematic review of diet quality indices in relation to obesity. Br. J. Nutr. 2017, 117, 1055–1065. [Google Scholar] [CrossRef] [PubMed]
- Hodge, A.M.; Karim, M.N.; Hébert, J.R.; Shivappa, N.; Milne, R.L.; De Courten, B. Diet scores and prediction of general and abdominal obesity in the Melbourne collaborative cohort study. Public Health Nutr. 2021, 24, 6157–6168. [Google Scholar] [CrossRef]
- Nicklas, T.A.; O’Neil, C.E.; Fulgoni III, V.L. Diet quality is inversely related to cardiovascular risk factors in adults. J. Nutr. 2012, 142, 2112–2118. [Google Scholar] [CrossRef] [PubMed]
- Tande, D.L.; Magel, R.; Strand, B.N. Healthy Eating Index and abdominal obesity. Public Health Nutr. 2010, 13, 208–214. [Google Scholar] [CrossRef]
- Yu, Z.M.; DeClercq, V.; Cui, Y.; Forbes, C.; Grandy, S.; Keats, M.; Parker, L.; Sweeney, E.; Dummer, T.J. Fruit and vegetable intake and body adiposity among populations in Eastern Canada: The Atlantic Partnership for Tomorrow’s Health Study. BMI Open 2018, 8, e018060. [Google Scholar] [CrossRef]
- Brauchla, M.; Juan, W.; Story, J.; Kranz, S. Sources of dietary fiber and the association of fiber intake with childhood obesity risk (in 2–18 year olds) and diabetes risk of adolescents 12–18 year olds: NHANES 2003–2006. J. Nutr. Metab. 2012, 2012, 736258. [Google Scholar] [CrossRef]
- Weickert, M.O.; Pfeiffer, A. Metabolic effects of dietary fiber consumption and prevention of diabetes. J. Nutr. 2008, 138, 439–442. [Google Scholar] [CrossRef]
- Dinh, Q.N.; Drummond, G.R.; Sobey, C.G.; Chrissobolis, S. Roles of inflammation, oxidative stress, and vascular dysfunction in hypertension. Biomed Res. Int. 2014, 2014, 406960. [Google Scholar] [CrossRef] [PubMed]
- Jia, X.-J.; Liu, L.-X.; Tian, Y.-M.; Wang, R.; Lu, Q. The correlation between oxidative stress level and intra-abdominal fat in obese males. Medicine 2019, 98, e14469. [Google Scholar] [CrossRef] [PubMed]
- Couillard, C.; Ruel, G.; Archer, W.R.; Pomerleau, S.; Bergeron, J.; Couture, P.; Lamarche, B.; Bergeron, N. Circulating levels of oxidative stress markers and endothelial adhesion molecules in men with abdominal obesity. J. Clin. Endocrinol. Metab. 2005, 90, 6454–6459. [Google Scholar] [CrossRef] [PubMed]
- Garcia-Diaz, D.F.; Lopez-Legarrea, P.; Quintero, P.; Martinez, J.A. Vitamin C in the treatment and/or prevention of obesity. J. Nutr. Sci. Vitaminol 2014, 60, 367–379. [Google Scholar] [CrossRef]
- Goodwin, K.; Abrahamowicz, M.; Leonard, G.; Perron, M.; Richer, L.; Veillette, S.; Gaudet, D.; Paus, T.; Pausova, Z. Dietary vitamin A and visceral adiposity: A modulating role of the retinol-binding protein 4 gene. Lifestyle Genom. 2015, 8, 164–173. [Google Scholar] [CrossRef]
- Hyundai Research Institute. Five Trends and Prospects in the Coffee Industry. Available online: https://test.hri.co.kr/kor/report/report-view.html?mode=4&uid=30141 (accessed on 8 December 2022).
- Choi, K.P.; Chae, D.J.; Ryoo, J.E. Trends of coffee industry and prospect in Korea. Food Ind. Nutr. 2014, 19, 1–4. [Google Scholar]
- Korea Health Industry Development Institute. Korea National Nutriton Statistics. Available online: https://www.khidi.or.kr/nutristat (accessed on 26 November 2022).
- Suliga, E.; Kozieł, D.; Cieśla, E.; Rębak, D.; Głuszek, S. Coffee consumption and the occurrence and intensity of metabolic syndrome: A cross-sectional study. Int. J. Food Sci. Nutr. 2017, 68, 507–513. [Google Scholar] [CrossRef]
- Larsen, S.; Mikkelsen, M.-L.; Frederiksen, P.; Heitmann, B.L. Habitual coffee consumption and changes in measures of adiposity: A comprehensive study of longitudinal associations. Int. J. Obes. 2018, 42, 880–886. [Google Scholar] [CrossRef]
- Kim, H.-J.; Cho, S.; Jacobs, D.R., Jr.; Park, K. Instant coffee consumption may be associated with higher risk of metabolic syndrome in Korean adults. Diabetes Res. Clin. Pract. 2014, 106, 145–153. [Google Scholar] [CrossRef]
- Kim, S.-A.; Shin, S. The association between coffee consumption pattern and prevalence of metabolic syndrome in Korean adults. Nutrients 2019, 11, 2992. [Google Scholar] [CrossRef] [PubMed]
- Gavrieli, A.; Karfopoulou, E.; Kardatou, E.; Spyreli, E.; Fragopoulou, E.; Mantzoros, C.; Yannakoulia, M. Effect of different amounts of coffee on dietary intake and appetite of normal-weight and overweight/obese individuals. Obesity 2013, 21, 1127–1132. [Google Scholar] [CrossRef] [PubMed]
- Chiva-Blanch, G.; Badimon, L. Effects of polyphenol intake on metabolic syndrome: Current evidences from human trials. Oxid. Med. Cell. Longev. 2017, 2017, 5812401. [Google Scholar] [CrossRef] [PubMed]
- Salinardi, T.C.; Rubin, K.H.; Black, R.M.; St-Onge, M.P. Coffee mannooligosaccharides, consumed as part of a free-living, weight-maintaining diet, increase the proportional reduction in body volume in overweight men. J. Nutr. 2010, 140, 1943–1948. [Google Scholar] [CrossRef]
- Rural Development Administration, National Institute of Agricultural Sciences. Korean Food Composition Database. Available online: http://koreanfood.rda.go.kr/kfi/fct/fctFoodSrch/list?menuId=PS03563 (accessed on 15 October 2022).
- Moeller, S.M.; Reedy, J.; Millen, A.E.; Dixon, L.B.; Newby, P.; Tucker, K.L.; Krebs-Smith, S.M.; Guenther, P.M. Dietary patterns: Challenges and opportunities in dietary patterns research. J. Am. Diet. Assoc. 2007, 107, 1233–1239. [Google Scholar] [CrossRef]

| Food Group | Men | Women | ||||
|---|---|---|---|---|---|---|
| Factor 1 | Factor 2 | Factor 3 | Factor 1 | Factor 2 | Factor 3 | |
| “Healthy” | “Coffee and Sweets” | “Multi-Grain” | “Healthy” | “Coffee and Sweets” | “Multi-Grain” | |
| White and green/yellow vegetables | 0.740 b | 0.733 | ||||
| Fish | 0.603 | 0.566 | ||||
| Seaweed | 0.571 | 0.557 | ||||
| Mushrooms | 0.562 | 0.561 | ||||
| Fruits | 0.442 | 0.408 | ||||
| Tubers | 0.413 | 0.433 | ||||
| Soy products | 0.385 | 0.431 | ||||
| Kimchi and pickled vegetables | 0.333 | 0.337 | ||||
| Milk and yogurt | 0.330 | 0.369 | ||||
| Eggs | 0.313 | 0.353 | ||||
| Nuts | 0.306 | 0.333 | ||||
| Tea | 0.301 | 0.324 | ||||
| Sweets | 0.897 | 0.871 | ||||
| Oils and fats | 0.892 | 0.871 | ||||
| Coffee | 0.850 | 0.785 | ||||
| Multi-grain rice | 0.934 | 0.896 | ||||
| White rice | −0.745 | −0.707 | ||||
| Red meat and high-fat red meat | −0.401 | −0.427 | ||||
| Poultry | −0.359 | −0.324 | ||||
| Flour-based foods | −0.335 | −0.402 | ||||
| Processed meats and red meat by-products | −0.309 | −0.351 | ||||
| Carbonated beverages | −0.309 | −0.302 | ||||
| Dairy products | ||||||
| Other beverages | ||||||
| Variance of intake explained (%) | 11.04 | 9.88 | 8.73 | 10.67 | 9.15 | 8.62 |
| Cumulative variance of intake explained (%) | 11.04 | 20.92 | 29.65 | 10.67 | 19.82 | 28.44 |
| Quartile (Q) of Dietary Pattern Score | p Value b | ||||
|---|---|---|---|---|---|
| Q1 (Lowest) | Q2 | Q3 | Q4 (Highest) | ||
| “Healthy” pattern | |||||
| Age, yrs | 53.9 ± 8.6 a | 54.4 ± 8.5 | 55.1 ± 8.3 | 56.1 ± 8.4 | <0.0001 |
| Education, college or higher, % | 39.7 | 42.5 | 46.1 | 50.5 | <0.0001 |
| Marital status, single, % | 7.8 | 6.1 | 4.3 | 4.7 | <0.0001 |
| Current smokers, % | 30.0 | 27.8 | 26.2 | 22.7 | <0.0001 |
| Alcohol, g/d | 15.7 ± 27.4 | 15.4 ± 26.5 | 15.6 ± 25.4 | 15.2 ± 27.0 | 0.8442 |
| Regular physical activity, % | 51.4 | 59.5 | 63.4 | 68.3 | <0.0001 |
| Body mass index, kg/m2 | 23.3 ± 2.3 | 23.4 ± 2.2 | 23.4 ± 2.3 | 23.5 ± 2.2 | 0.0037 |
| “Coffee and sweets” pattern | |||||
| Age, yrs | 55.4 ± 8.4 | 54.7 ± 8.5 | 55.2 ± 8.5 | 54.3 ± 8.5 | <0.0001 |
| Education, college or higher, % | 25.6 | 28.2 | 24.9 | 21.4 | <0.0001 |
| Marital status, single, % | 7.0 | 5.7 | 4.4 | 5.8 | <0.0001 |
| Current smokers, % | 15.6 | 22.8 | 27.8 | 41.6 | <0.0001 |
| Alcohol, g/d | 15.4 ± 28.1 | 15.3 ± 24.4 | 15.3 ± 25.9 | 16.0 ± 27.8 | 0.6426 |
| Regular physical activity, % | 64.9 | 64.7 | 59.2 | 53.8 | <0.0001 |
| Body mass index, kg/m2 | 23.2 ± 2.3 | 23.5 ± 2.3 | 23.5 ± 2.2 | 23.5 ± 2.3 | <0.0001 |
| “Multi-grain” pattern | |||||
| Age, yrs | 52.6 ± 8.6 | 53.8 ± 8.6 | 55.4 ± 8.2 | 57.7 ± 7.7 | <0.0001 |
| Education, college or higher, % | 44.8 | 50.7 | 46.1 | 37.2 | <0.0001 |
| Marital status, single, % | 9.0 | 5.5 | 3.9 | 4.4 | <0.0001 |
| Current smokers, % | 33.7 | 29.7 | 24.4 | 20.1 | <0.0001 |
| Alcohol, g/d | 19.0 ± 32.1 | 17.4 ± 28.0 | 14.4 ± 22.4 | 11.2 ± 21.8 | <0.0001 |
| Regular physical activity, % | 51.6 | 63.0 | 65.5 | 62.5 | <0.0001 |
| Body mass index, kg/m2 | 23.4 ± 2.3 | 23.6 ± 2.3 | 23.5 ± 2.2 | 23.2 ± 2.2 | <0.0001 |
| Quartile (Q) of Dietary Pattern Score | p Value b | ||||
|---|---|---|---|---|---|
| Q1 (Lowest) | Q2 | Q3 | Q4 (Highest) | ||
| “Healthy” pattern | |||||
| Age, yrs | 51.6 ± 7.8 a | 51.9 ± 7.7 | 52.4 ± 7.3 | 52.7 ± 7.2 | <0.0001 |
| Education, college or higher, % | 23.3 | 26.2 | 28.6 | 28.7 | <0.0001 |
| Marital status, single, % | 13.5 | 11.6 | 11.2 | 10.8 | <0.0001 |
| Current smokers, % | 1.9 | 1.8 | 1.5 | 1.4 | 0.0072 |
| Alcohol, g/d | 1.7 ± 5.9 | 1.6 ± 6.9 | 1.7 ± 6.7 | 1.5 ± 5.7 | 0.3172 |
| Regular physical activity, % | 46.6 | 52.7 | 57.9 | 63.9 | <0.0001 |
| Body mass index, kg/m2 | 22.8 ± 2.4 | 22.8 ± 2.4 | 22.7 ± 2.4 | 22.8 ± 2.4 | 0.0188 |
| “Coffee and sweets” pattern | |||||
| Age, yrs | 53.3 ± 7.5 | 52.7 ± 7.6 | 51.3 ± 7.3 | 51.4 ± 7.4 | <0.0001 |
| Education, college or higher, % | 23.8 | 27.2 | 29.4 | 26.4 | <0.0001 |
| Marital status, single, % | 12.3 | 12.0 | 10.3 | 12.3 | 0.2907 |
| Current smokers, % | 0.9 | 1.1 | 1.5 | 2.9 | <0.0001 |
| Alcohol, g/d | 1.2 ± 5.5 | 1.4 ± 5.2 | 1.9 ± 6.4 | 2.0 ± 7.8 | <0.0001 |
| Regular physical activity, % | 58.3 | 58.2 | 54.9 | 49.6 | <0.0001 |
| Body mass index, kg/m2 | 22.6 ± 2.4 | 22.8 ± 2.4 | 22.9 ± 2.4 | 22.9 ± 2.4 | <0.0001 |
| “Multi-grain” pattern | |||||
| Age, yrs | 50.3 ± 7.4 | 51.1 ± 7.3 | 52.5 ± 7.3 | 54.7 ± 7.3 | <0.0001 |
| Education, college or higher, % | 30.3 | 32.9 | 26.1 | 17.5 | <0.0001 |
| Marital status, single, % | 12.5 | 11.1 | 10.6 | 12.8 | 0.8064 |
| Current smokers, % | 2.8 | 1.4 | 1.2 | 1.1 | <0.0001 |
| Alcohol, g/d | 2.4 ± 8.0 | 1.9 ± 5.9 | 1.2 ± 4.2 | 1.0 ± 6.5 | <0.0001 |
| Regular physical activity, % | 47.2 | 58.4 | 59.1 | 56.3 | <0.0001 |
| Body mass index, kg/m2 | 22.8 ± 2.5 | 22.7 ± 2.4 | 22.8 ± 2.4 | 22.9 ± 2.3 | 0.0507 |
| Quartile (Q) of Dietary Pattern Score | p Value b | ||||
|---|---|---|---|---|---|
| Q1 (Lowest) | Q2 | Q3 | Q4 (Highest) | ||
| “Healthy” pattern | |||||
| Energy, kcal/day | 1717 ± 464 a | 1807 ± 443 | 1884 ± 484 | 1829 ± 609 | <0.0001 |
| %energy from carbohydrates | 76.0 ± 5.4 | 73.4 ± 5.7 | 71.8 ± 6.3 | 68.9 ± 8.1 | <0.0001 |
| %energy from total protein | 10.6 ± 1.5 | 11.8 ± 1.6 | 12.9 ± 1.9 | 14.8 ± 2.9 | <0.0001 |
| %energy from animal protein | 3.3 ± 1.7 | 4.5 ± 2.0 | 5.4 ± 2.2 | 7.0 ± 3.2 | <0.0001 |
| %energy from plant protein | 7.3 ± 0.8 | 7.3 ± 0.9 | 7.4 ± 1.0 | 7.8 ± 1.3 | <0.0001 |
| %energy from fat | 10.8 ± 4.5 | 12.8 ± 4.6 | 13.8 ± 4.8 | 15.8 ± 6.0 | <0.0001 |
| Calcium, mg/day | 306.3 ± 160.1 | 410.1 ± 174.6 | 488.0 ± 202.4 | 602.5 ± 273.4 | <0.0001 |
| Sodium, mg/day | 992 ± 568 | 1297 ± 653 | 1588 ± 838 | 2026 ± 1168 | <0.0001 |
| Dietary fiber, g/day | 7.4 ± 4.0 | 10.1 ± 4.2 | 12.7 ± 5.3 | 16.3 ± 7.7 | <0.0001 |
| “Coffee and sweets” pattern | |||||
| Energy, kcal/day | 1749 ± 489 | 1841 ± 554 | 1866 ± 460 | 1780 ± 514 | <0.0001 |
| %energy from carbohydrates | 73.5 ± 7.1 | 72.1 ± 7.2 | 72.5 ± 6.3 | 72.0 ± 7.2 | <0.0001 |
| %energy from total protein | 12.6 ± 2.6 | 12.9 ± 2.7 | 12.4 ± 2.3 | 12.1 ± 2.6 | <0.0001 |
| %energy from animal protein | 4.9 ± 2.8 | 5.3 ± 2.8 | 5.0 ± 2.4 | 4.9 ± 2.7 | <0.0001 |
| %energy from plant protein | 7.6 ± 1.1 | 7.6 ± 1.1 | 7.4 ± 0.9 | 7.2 ± 1.0 | <0.0001 |
| %energy from fat | 12.1 ± 5.3 | 13.3 ± 5.4 | 13.4 ± 4.7 | 14.3 ± 5.6 | <0.0001 |
| Calcium, mg/day | 421.3 ± 249.0 | 465.5 ± 249.6 | 468.6 ± 220.4 | 451.5 ± 211.1 | <0.0001 |
| Sodium, mg/day | 1363 ± 888 | 1574 ± 1006 | 1509 ± 876 | 1457 ± 898 | <0.0001 |
| Dietary fiber, g/day | 11.1 ± 6.6 | 12.4 ± 6.9 | 11.9 ± 6.2 | 11.0 ± 6.0 | <0.0001 |
| “Multi-grain” pattern | |||||
| Energy, kcal/day | 1769 ± 573 | 1995 ± 598 | 1832 ± 398 | 1640 ± 348 | <0.0001 |
| %energy from carbohydrates | 70.4 ± 8.7 | 68.3 ± 6.1 | 73.2 ± 3.9 | 78.2 ± 3.4 | <0.0001 |
| %energy from total protein | 12.9 ± 3.2 | 13.9 ± 2.5 | 12.4 ± 1.7 | 10.8 ± 1.4 | <0.0001 |
| %energy from animal protein | 5.8 ± 3.4 | 6.6 ± 2.6 | 4.8 ± 1.6 | 3.0 ± 1.3 | <0.0001 |
| %energy from plant protein | 7.1 ± 1.0 | 7.4 ± 1.1 | 7.6 ± 1.0 | 7.8 ± 0.9 | <0.0001 |
| %energy from fat | 14.9 ± 6.8 | 16.6 ± 4.4 | 12.8 ± 2.9 | 8.8 ± 2.6 | <0.0001 |
| Calcium, mg/day | 426.6 ± 223.3 | 564.1 ± 264.8 | 469.0 ± 215.7 | 347.3 ± 166.9 | <0.0001 |
| Sodium, mg/day | 1459 ± 895 | 1858 ± 1059 | 1480 ± 841 | 1107 ± 696 | <0.0001 |
| Dietary fiber, g/day | 9.6 ± 5.8 | 14.7 ± 7.2 | 12.5 ± 6.1 | 9.7 ± 4.9 | <0.0001 |
| Quartile (Q) of Dietary Pattern Score | p Value b | ||||
|---|---|---|---|---|---|
| Q1 (Lowest) | Q2 | Q3 | Q4 (Highest) | ||
| “Healthy” pattern | |||||
| Energy, kcal/day | 1612 ± 469 a | 1702 ± 459 | 1723 ± 518 | 1650 ± 627 | <0.0001 |
| %energy from carbohydrates | 76.5 ± 5.8 | 74.2 ± 6.1 | 72.6 ± 6.4 | 69.5 ± 8.3 | <0.0001 |
| %energy from total protein | 10.8 ± 1.6 | 12.1 ± 1.8 | 13.1 ± 2.0 | 15.1 ± 3.1 | <0.0001 |
| %energy from animal protein | 3.4 ± 1.8 | 4.7 ± 2.1 | 5.6 ± 2.3 | 7.2 ± 3.3 | <0.0001 |
| %energy from plant protein | 7.3 ± 0.9 | 7.4 ± 0.9 | 7.5 ± 1.1 | 7.9 ± 1.5 | <0.0001 |
| %energy from fat | 10.5 ± 4.8 | 12.3 ± 4.8 | 13.5 ± 4.9 | 15.6 ± 5.9 | <0.0001 |
| Calcium, mg/day | 318.4 ± 172.2 | 431.3 ± 187.7 | 519.3 ± 227.9 | 647.0 ± 337.9 | <0.0001 |
| Sodium, mg/day | 912 ± 562 | 1211 ± 610 | 1474 ± 795 | 1868 ± 1127 | <0.0001 |
| Dietary fiber, g/day | 8.2 ± 4.6 | 11.2 ± 4.9 | 13.8 ± 6.1 | 17.6 ± 9.6 | <0.0001 |
| “Coffee and sweets” pattern | |||||
| Energy, kcal/day | 1707 ± 526 | 1630 ± 547 | 1763 ± 538 | 1588 ± 466 | <0.0001 |
| %energy from carbohydrates | 74.0 ± 7.4 | 73.6 ± 7.3 | 72.4 ± 6.9 | 72.7 ± 6.9 | <0.0001 |
| %energy from total protein | 12.8 ± 2.9 | 12.9 ± 2.7 | 12.9 ± 2.6 | 12.4 ± 2.6 | <0.0001 |
| %energy from animal protein | 5.2 ± 3.0 | 5.2 ± 2.8 | 5.4 ± 2.7 | 5.1 ± 2.7 | <0.0001 |
| %energy from plant protein | 7.6 ± 1.2 | 7.8 ± 1.2 | 7.5 ± 1.1 | 7.3 ± 1.0 | <0.0001 |
| %energy from fat | 12.0 ± 5.5 | 12.4 ± 5.5 | 13.6 ± 5.2 | 13.9 ± 5.4 | <0.0001 |
| Calcium, mg/day | 473.9 ± 296.6 | 473.6 ± 275.0 | 516.5 ± 275.5 | 452.0 ± 217.4 | <0.0001 |
| Sodium, mg/day | 1322 ± 866 | 1401 ± 957 | 1470 ± 898 | 1271 ± 767 | <0.0001 |
| Dietary fiber, g/day | 13.0 ± 8.0 | 12.9 ± 7.9 | 13.5 ± 7.6 | 11.3 ± 5.9 | <0.0001 |
| “Multi-grain” pattern | |||||
| Energy, kcal/day | 1678 ± 639 | 1761 ± 585 | 1692 ± 457 | 1556 ± 346 | <0.0001 |
| %energy from carbohydrates | 69.2 ± 9.2 | 70.1 ± 5.3 | 74.5 ± 4.3 | 78.9 ± 3.7 | <0.0001 |
| %energy from total protein | 13.7 ± 3.4 | 13.7 ± 2.4 | 12.5 ± 2.0 | 11.1 ± 1.7 | <0.0001 |
| %energy from animal protein | 6.5 ± 3.6 | 6.3 ± 2.4 | 4.9 ± 1.8 | 3.2 ± 1.5 | <0.0001 |
| %energy from plant protein | 7.2 ± 1.2 | 7.4 ± 1.1 | 7.6 ± 1.0 | 7.9 ± 1.0 | <0.0001 |
| %energy from fat | 16.1 ± 7.1 | 15.5 ± 3.7 | 12.0 ± 3.0 | 8.3 ± 2.7 | <0.0001 |
| Calcium, mg/day | 491.0 ± 282.7 | 549.0 ± 289.4 | 491.8 ± 257.1 | 384.2 ± 212.1 | <0.0001 |
| Sodium, mg/day | 1468 ± 938 | 1526 ± 891 | 1344 ± 830 | 1126 ± 793 | <0.0001 |
| Dietary fiber, g/day | 12.1 ± 7.5 | 14.6 ± 7.9 | 13.3 ± 7.4 | 10.8 ± 6.4 | <0.0001 |
| Quartile (Q) of Dietary Pattern Score | p for Trend b | ||||
|---|---|---|---|---|---|
| Q1 (Lowest) | Q2 | Q3 | Q4 (Highest) | ||
| Men | |||||
| “Healthy” pattern | |||||
| Person years | 19,070 | 18,308 | 17,803 | 18,166 | - |
| Abdominal obesity (cases) | 486 | 487 | 480 | 479 | - |
| Rate per 1000 person years | 25.5 | 26.6 | 27.0 | 26.4 | - |
| Age-adjusted HR (95% CI) a | 1.00 | 1.10 (0.97–1.25) | 1.20 (1.06–1.36) | 1.10 (0.97–1.25) | 0.1286 |
| Multivariate-adjusted HR (95% CI) b | 1.00 | 0.90 (0.80–1.03) | 1.00 (0.88–1.14) | 0.86 (0.75–0.98) | 0.0358 |
| “Coffee and sweets” pattern | |||||
| Person years | 18,641 | 18,494 | 18,209 | 18,003 | - |
| Abdominal obesity (cases) | 413 | 500 | 510 | 509 | - |
| Rate per 1000 person years | 22.2 | 27.0 | 28.0 | 28.3 | - |
| Age-adjusted HR (95% CI) | 1.00 | 1.24 (1.09–1.41) | 1.32 (1.16–1.50) | 1.35 (1.18–1.53) | <0.0001 |
| Multivariate-adjusted HR (95% CI) | 1.00 | 1.10 (0.97–1.26) | 1.12 (0.98–1.28) | 1.23 (1.08–1.40) | 0.0495 |
| “Multi-grain” pattern | |||||
| Person years | 18,731 | 18,242 | 18,146 | 18,228 | - |
| Abdominal obesity (cases) | 495 | 507 | 480 | 450 | - |
| Rate per 1000 person years | 26.4 | 27.8 | 26.5 | 24.7 | - |
| Age-adjusted HR (95% CI) | 1.00 | 1.09 (0.96–1.23) | 1.04 (0.92–1.18) | 0.95 (0.84–1.09) | 0.7467 |
| Multivariate-adjusted HR (95% CI) | 1.00 | 0.94 (0.78–1.14) | 0.98 (0.78–1.22) | 1.05 (0.82–1.34) | 0.6128 |
| Women | |||||
| “Healthy” pattern | |||||
| Person years | 40,175 | 39,901 | 39,904 | 41,522 | - |
| Abdominal obesity (cases) | 1013 | 940 | 990 | 1003 | - |
| Rate per 1000 person years | 25.2 | 23.6 | 24.8 | 24.2 | - |
| Age-adjusted HR (95% CI) | 1.00 | 0.94 (0.86–1.03) | 0.99 (0.90–1.08) | 0.88 (0.81–0.96) | 0.0111 |
| Multivariate-adjusted HR (95% CI) | 1.00 | 0.92 (0.84–1.01) | 0.91 (0.83–0.99) | 0.90 (0.83–0.99) | 0.0188 |
| “Coffee and sweets” pattern | |||||
| Person years | 41,011 | 40,451 | 40,296 | 39,744 | - |
| Abdominal obesity (cases) | 832 | 984 | 1051 | 1079 | - |
| Rate per 1000 person years | 20.3 | 24.3 | 26.1 | 27.1 | - |
| Age-adjusted HR (95% CI) | 1.00 | 1.25 (1.14–1.37) | 1.49 (1.36–1.63) | 1.50 (1.37–1.64) | <0.0001 |
| Multivariate-adjusted HR (95% CI) | 1.00 | 1.06 (0.97–1.16) | 1.11 (1.01–1.22) | 1.14 (1.04–1.25) | 0.0096 |
| “Multi-grain” pattern | |||||
| Person years | 31,203 | 39,838 | 40,046 | 40,415 | - |
| Abdominal obesity (cases) | 958 | 961 | 954 | 1073 | - |
| Rate per 1000 person years | 30.7 | 24.1 | 23.8 | 26.5 | - |
| Age-adjusted HR (95% CI) | 1.00 | 1.07 (0.98–1.17) | 0.99 (0.91–1.09) | 0.99 (0.90–1.08) | 0.7757 |
| Multivariate-adjusted HR (95% CI) | 1.00 | 0.99 (0.89–1.11) | 0.97 (0.86–1.10) | 0.97 (0.86–1.10) | 0.4981 |
Disclaimer/Publisher’s Note: The statements, opinions and data contained in all publications are solely those of the individual author(s) and contributor(s) and not of MDPI and/or the editor(s). MDPI and/or the editor(s) disclaim responsibility for any injury to people or property resulting from any ideas, methods, instructions or products referred to in the content. |
© 2023 by the authors. Licensee MDPI, Basel, Switzerland. This article is an open access article distributed under the terms and conditions of the Creative Commons Attribution (CC BY) license (https://creativecommons.org/licenses/by/4.0/).
Share and Cite
Lee, K.W.; Kang, M.-S.; Lee, S.J.; Kim, H.-R.; Jang, K.-A.; Shin, D. Prospective Associations between Dietary Patterns and Abdominal Obesity in Middle-Aged and Older Korean Adults. Foods 2023, 12, 2148. https://doi.org/10.3390/foods12112148
Lee KW, Kang M-S, Lee SJ, Kim H-R, Jang K-A, Shin D. Prospective Associations between Dietary Patterns and Abdominal Obesity in Middle-Aged and Older Korean Adults. Foods. 2023; 12(11):2148. https://doi.org/10.3390/foods12112148
Chicago/Turabian StyleLee, Kyung Won, Min-Sook Kang, Seung Jae Lee, Haeng-Ran Kim, Kyeong-A Jang, and Dayeon Shin. 2023. "Prospective Associations between Dietary Patterns and Abdominal Obesity in Middle-Aged and Older Korean Adults" Foods 12, no. 11: 2148. https://doi.org/10.3390/foods12112148
APA StyleLee, K. W., Kang, M.-S., Lee, S. J., Kim, H.-R., Jang, K.-A., & Shin, D. (2023). Prospective Associations between Dietary Patterns and Abdominal Obesity in Middle-Aged and Older Korean Adults. Foods, 12(11), 2148. https://doi.org/10.3390/foods12112148