Novel Application of NIR Spectroscopy for Non-Destructive Determination of ‘Maraština’ Wine Parameters
Abstract
:1. Introduction
2. Materials and Methods
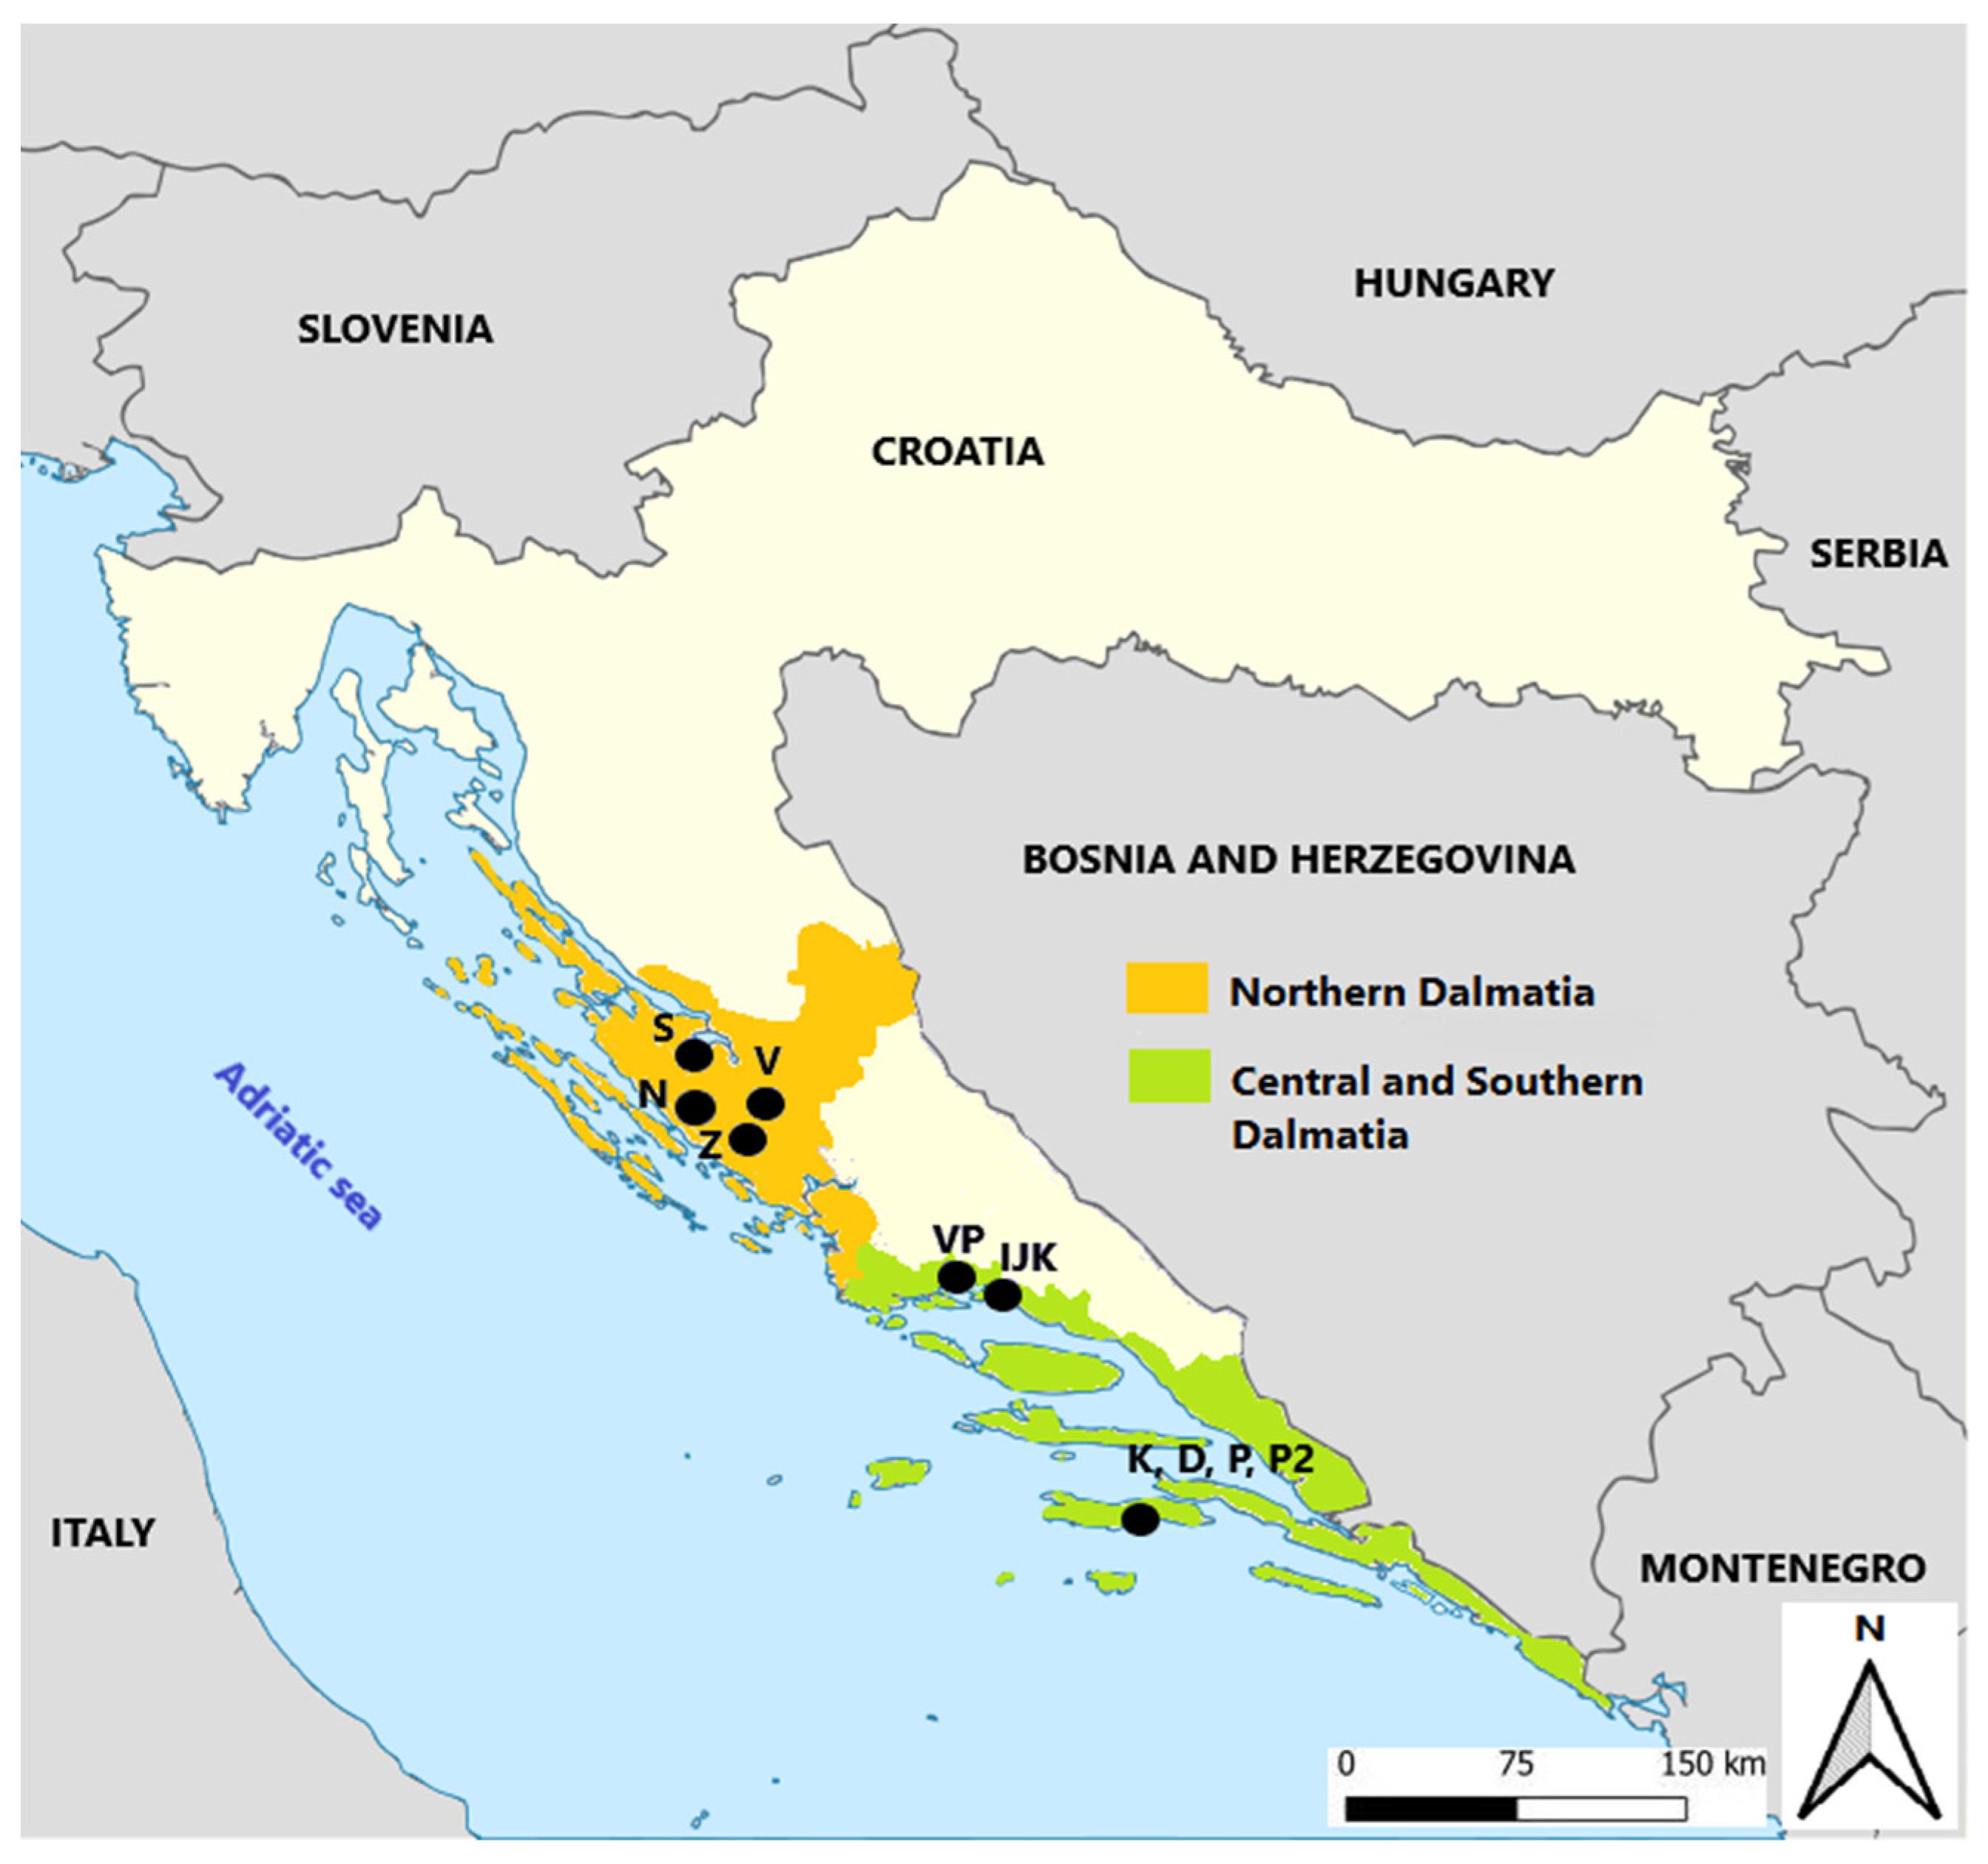
2.1. Grape Samples
2.2. Experimental Wine Production
2.3. Chemical Analysis of Fresh Must and Wines
2.4. Colour Measurement
2.5. Near-Infrared Spectroscopy
2.6. Data Analysis
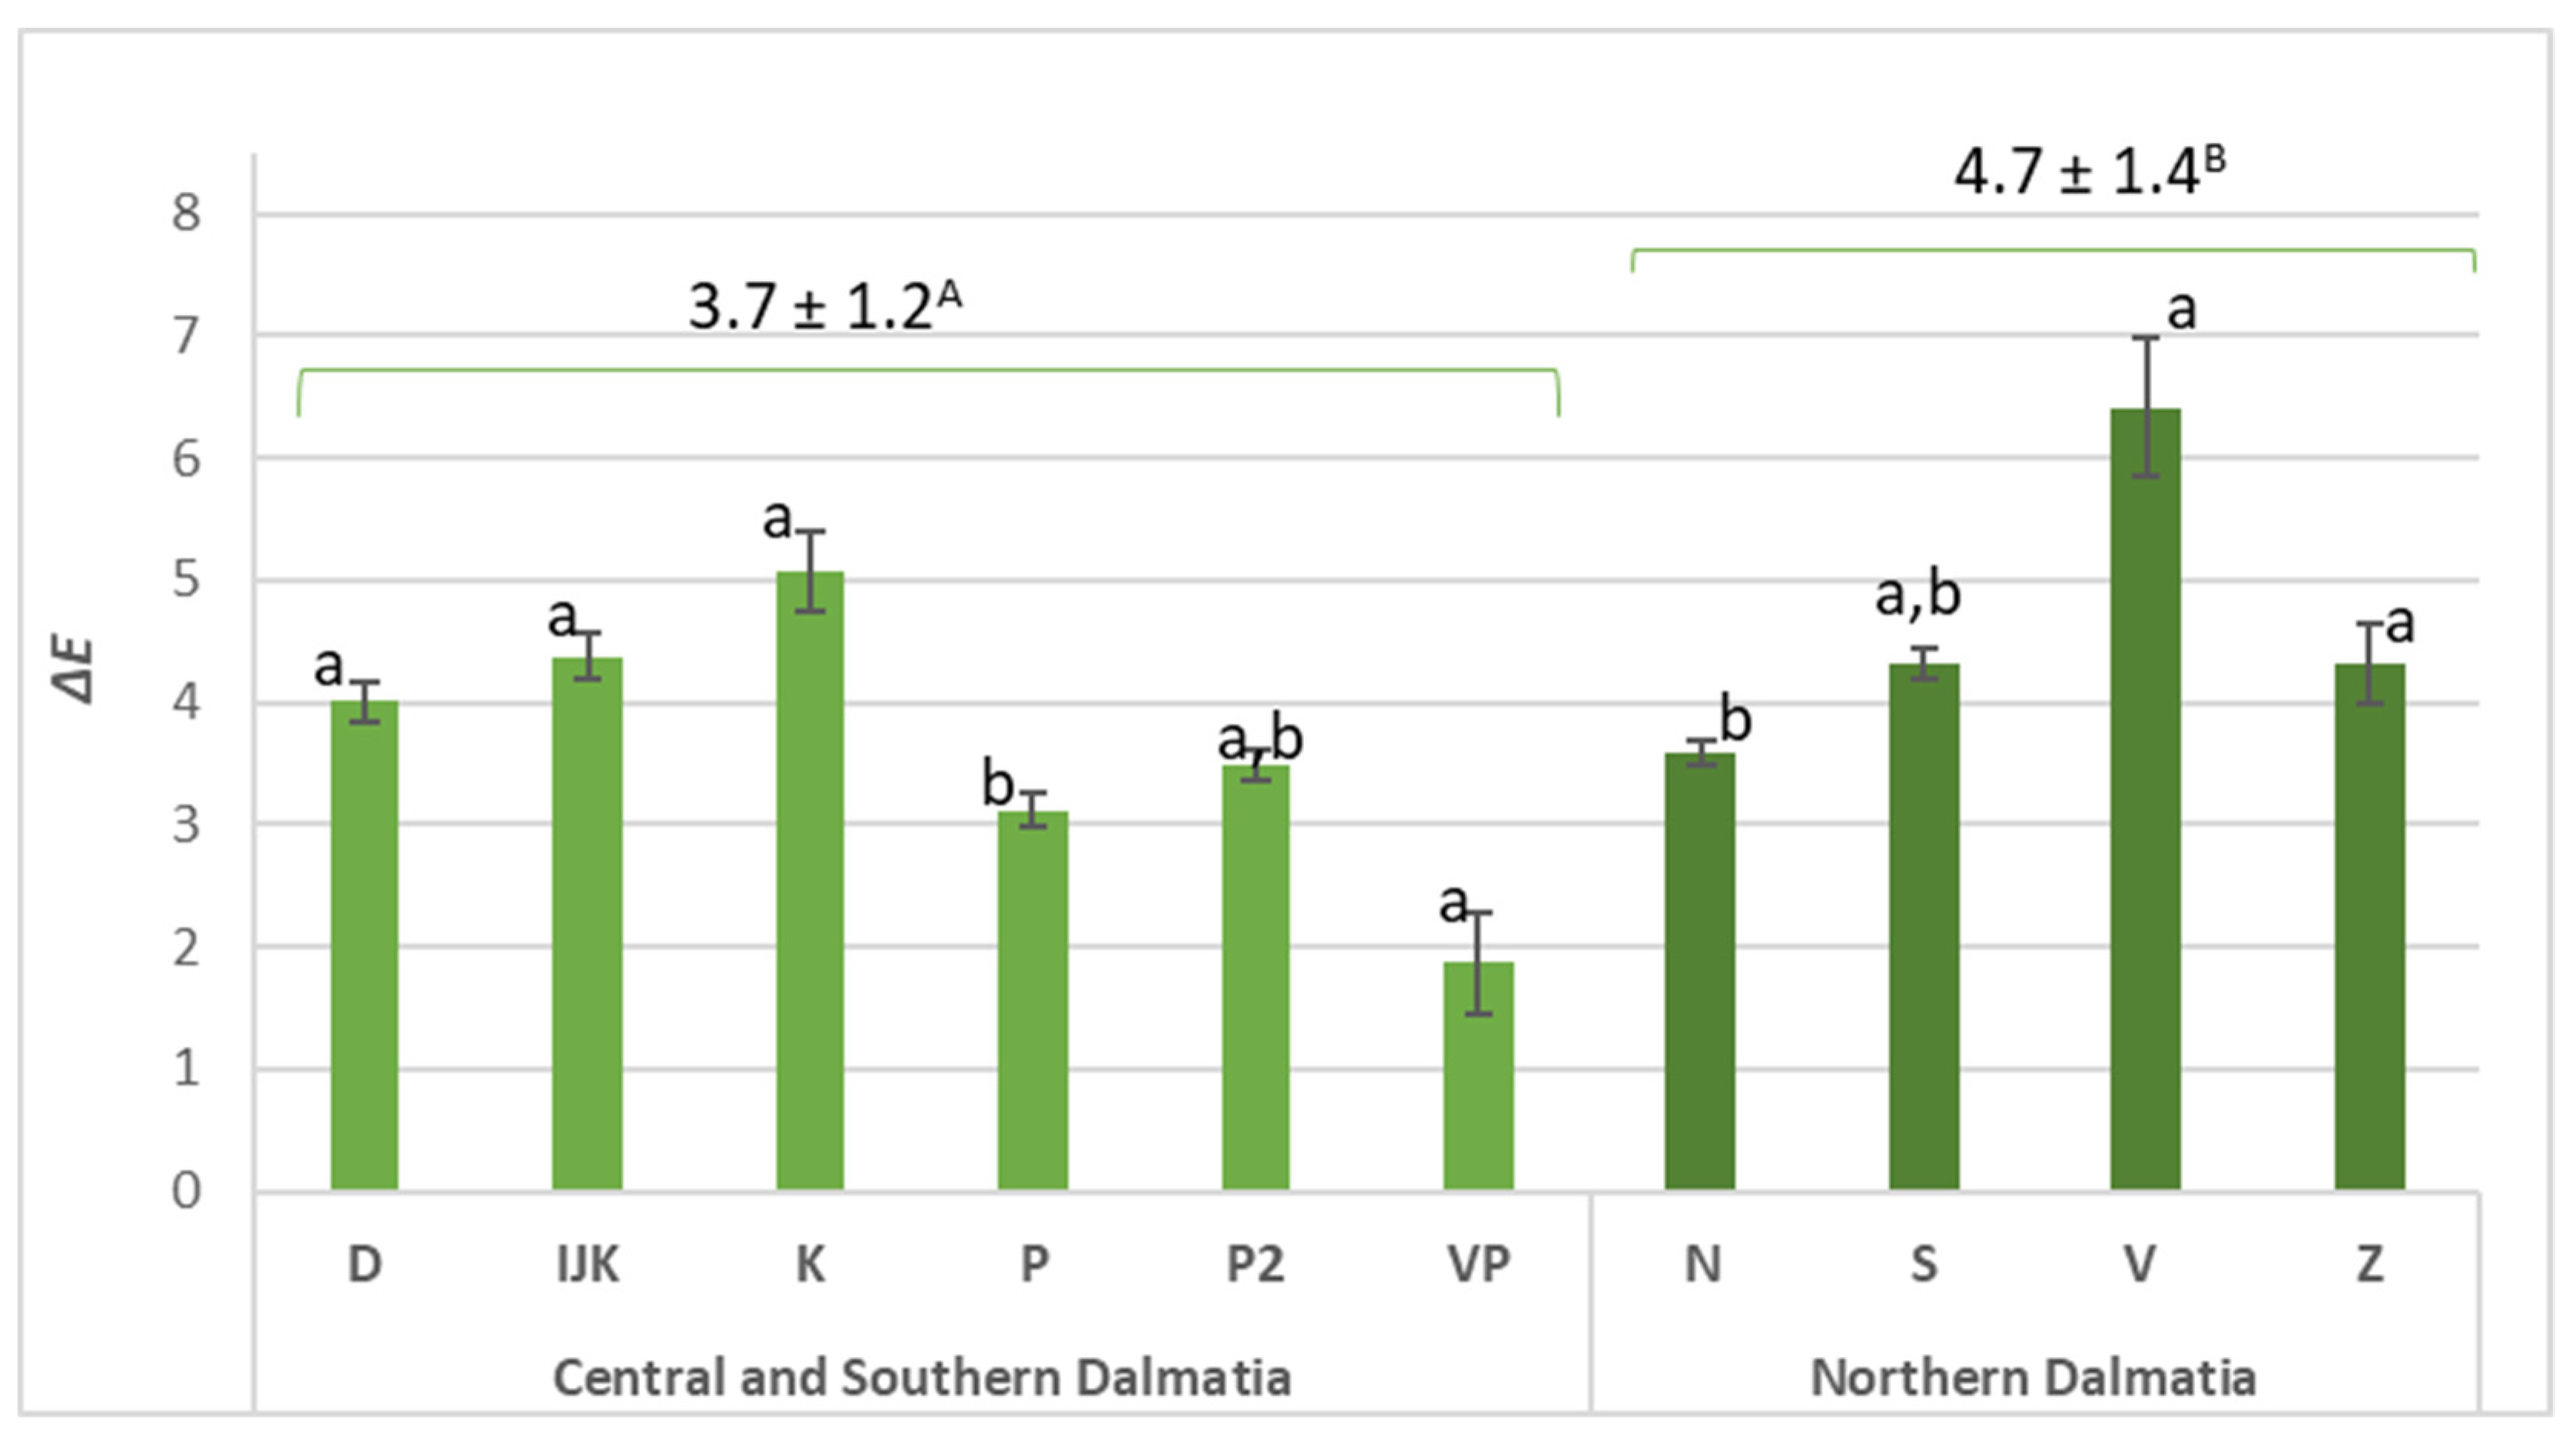
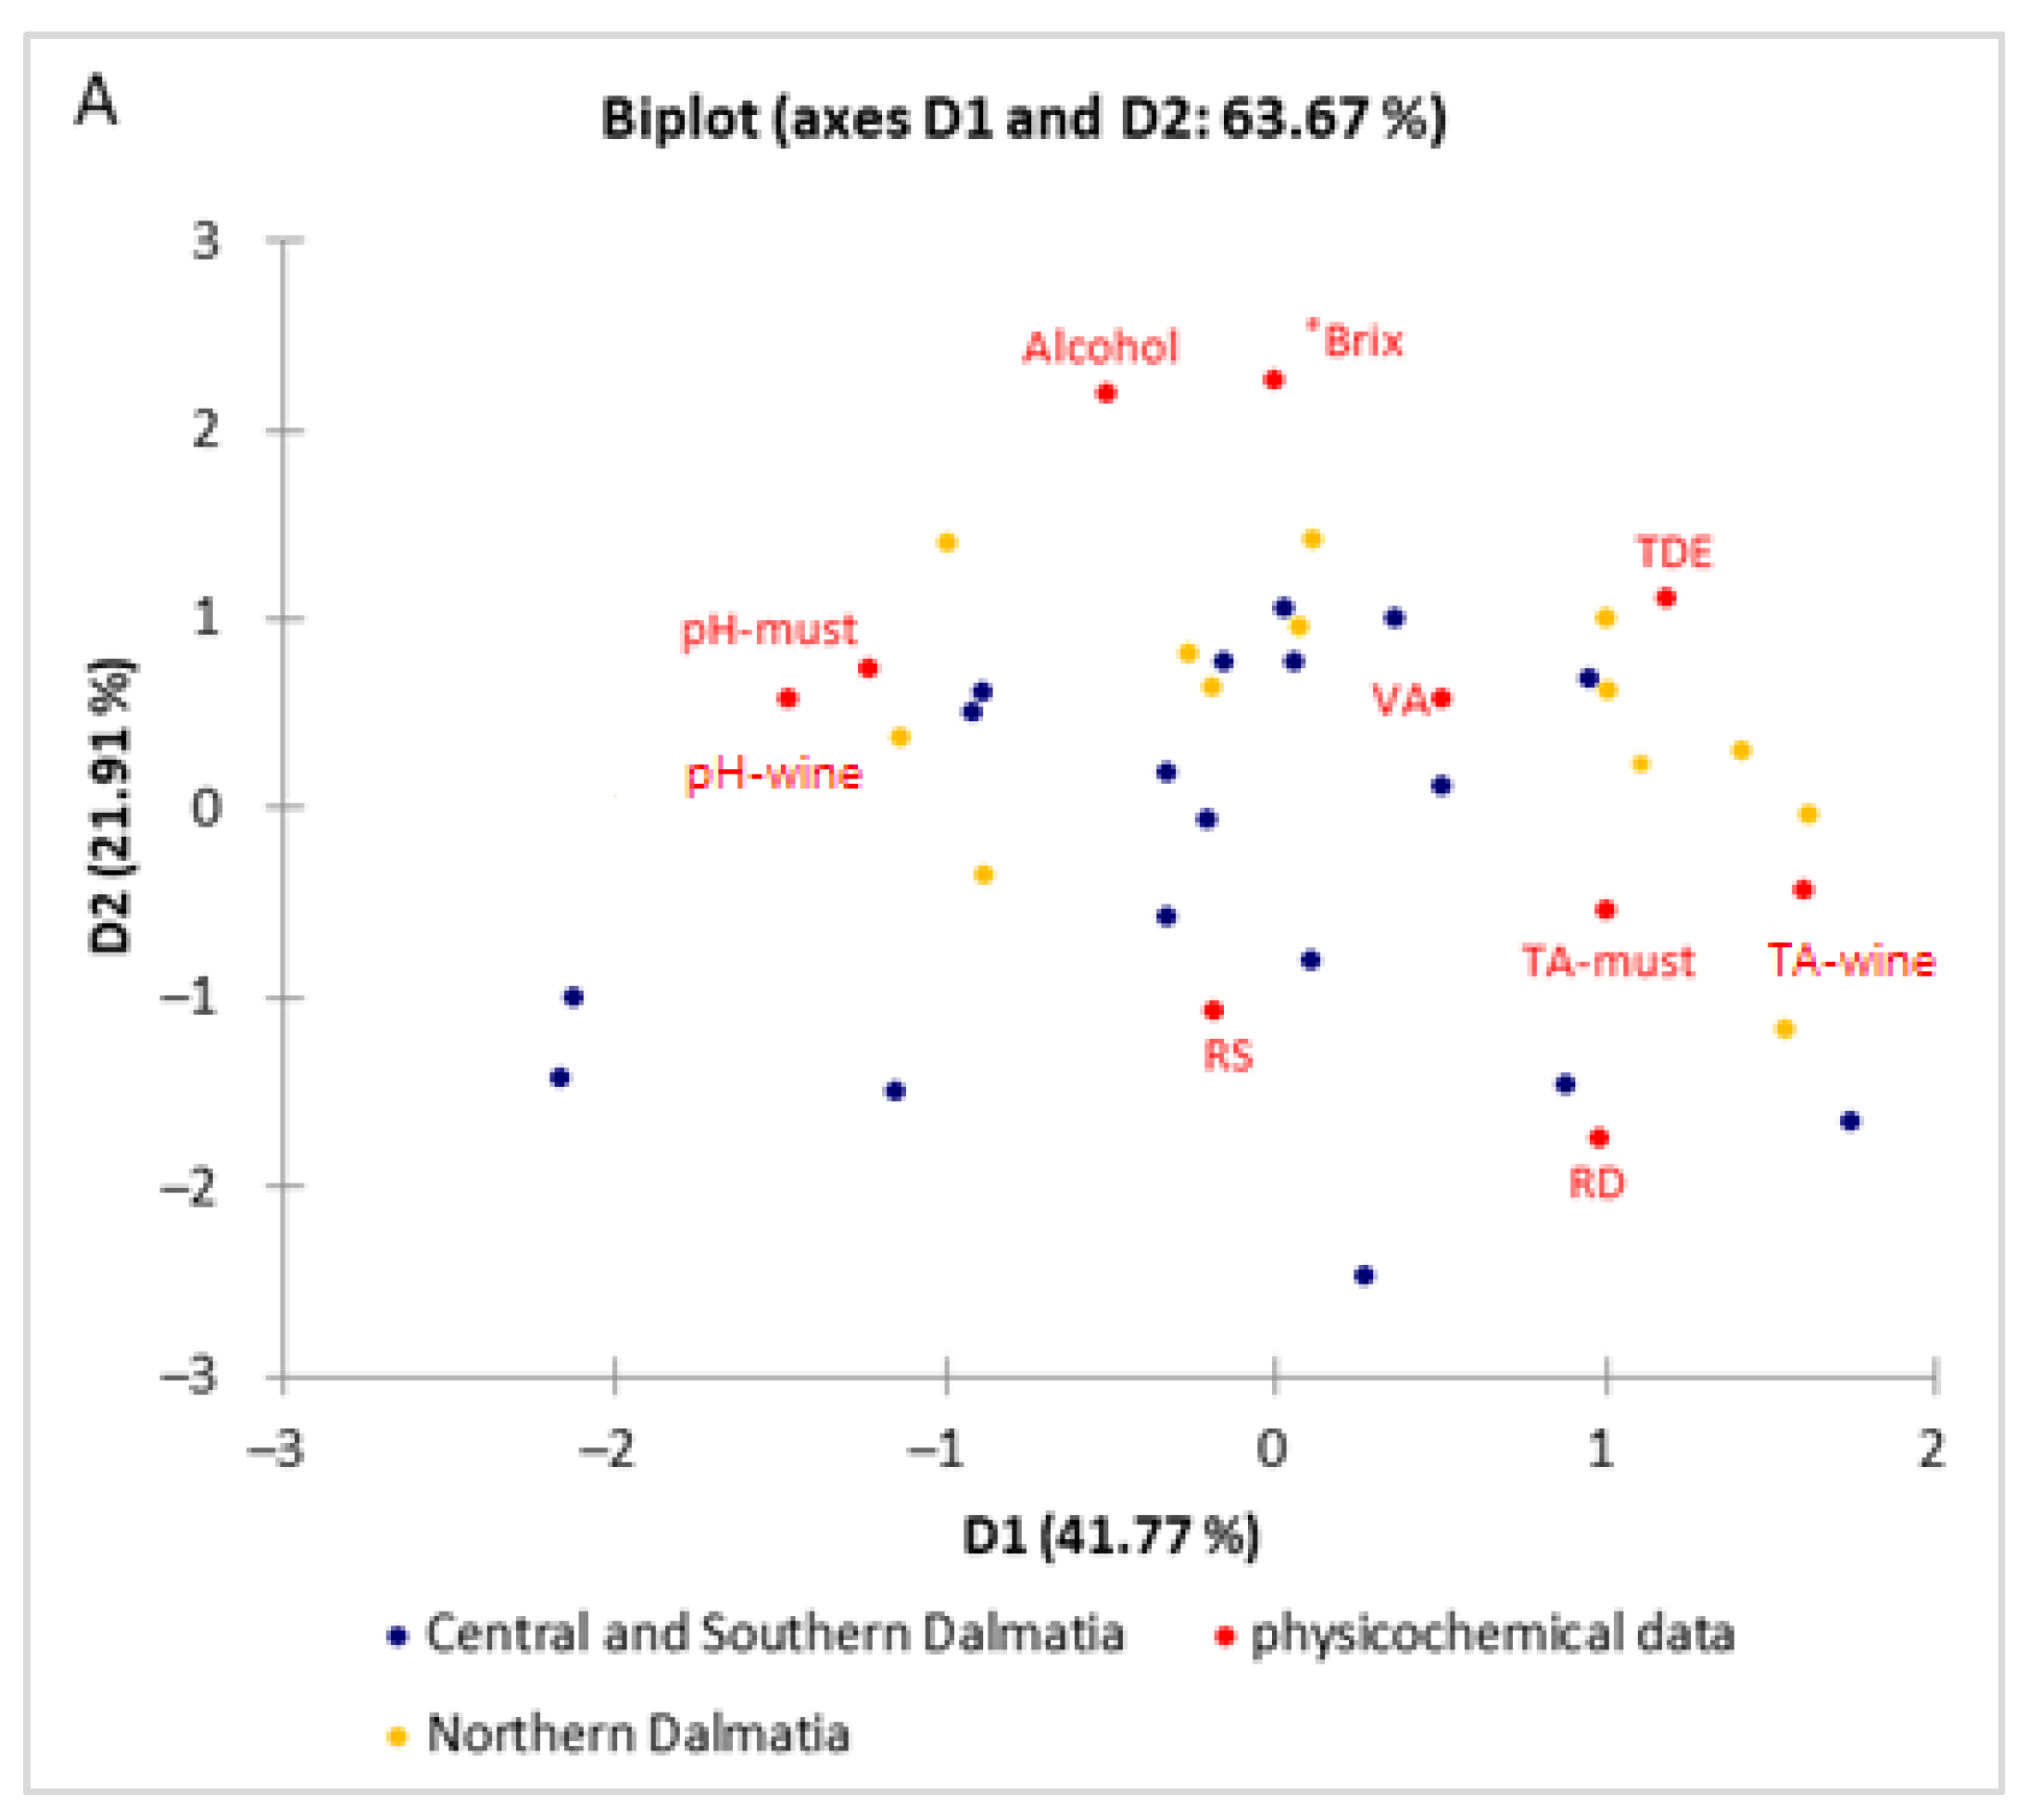
3. Results and Discussion
4. Conclusions
Supplementary Materials
Author Contributions
Funding
Institutional Review Board Statement
Informed Consent Statement
Data Availability Statement
Acknowledgments
Conflicts of Interest
References
- Jakabová, S.; Fikselová, M.; Mendelová, A.; Ševčík, M.; Jakab, I.; Aláčová, Z.; Kolačkovská, J.; Ivanova-Petropulos, V. Chemical composition of white wines produced from different grape varieties and wine regions in Slovakia. Appl. Sci. 2021, 11, 11059. [Google Scholar] [CrossRef]
- Cordella, C.; Moussa, I.; Martel, A.C.; Sbirrazzuoli, N.; Lizzani-Cuvelier, L. Recent developments in food characterization and adulteration detection: Technique-oriented perspectives. J. Agric. Food Chem. 2002, 50, 1751–1764. [Google Scholar] [CrossRef] [PubMed]
- Roullier-Gall, C.; Lucio, M.; Noret, L.; Schmitt-Kopplin, P.; Gougeon, R.D. How subtle is the “terroir” effect? Chemistry-related signatures of two “climats de Bourgogne”. PLoS ONE 2014, 9, e97615. [Google Scholar] [CrossRef] [PubMed] [Green Version]
- van Leeuwen, C.; Barbe, J.C.; Darriet, P.; Geffroy, O.; Gomès, E.; Guillaumie, S.; Helwi, P.; Laboyrie, J.; Lytra, G.; Le Menn, N.; et al. Recent advancements in understanding the terroir effect on aromas in grapes and wines. Oeno One 2020, 54, 985–1006. [Google Scholar] [CrossRef]
- Fischer, U.; Roth, D.; Christmann, M. The impact of geographic origin, vintage and wine estate on sensory properties of Vitis vinifera cv. Riesling wines. Food Qual. Prefer. 1999, 10, 281–288. [Google Scholar] [CrossRef]
- Mirabal-Gallardo, Y.; Caroca-Herrera, M.A.; Muñoz, L.; Meneses, M.; Laurie, V.F. Multi-element analysis and differentiation of Chilean wines using mineral composition and multivariate statistics. Cienc. Investig. Agrar. 2018, 45, 181–191. [Google Scholar] [CrossRef] [Green Version]
- Wu, Q.; Gu, H.W.; Yin, X.L.; Zhou, H.H.; Chang, H.Y.; Shi, J.; Chen, Y.; Yan, X.F.; Liu, Z. Development of an HPLC-DAD method combined with chemometrics for differentiating geographical origins of Chinese red wines on the basis of phenolic compounds. Food Anal. Methods 2021, 14, 1895–1907. [Google Scholar] [CrossRef]
- Cozzolino, D.; Dambergs, R.G.; Janik, L.; Cynkar, W.U.; Gishen, M. Analysis of grapes and wine by near-infrared spectroscopy. J. Near Infrared Spectrosc. 2006, 14, 279–289. [Google Scholar] [CrossRef]
- Power, A.; Truong, V.K.; Chapman, J.; Cozzolino, D. From the laboratory to the vineyard-evolution of the measurement of grape composition using NIR spectroscopy towards high-throughput analysis. High-Throughput 2019, 8, 21. [Google Scholar] [CrossRef] [Green Version]
- Urbano-Cuadrado, M.; Luque De Castro, M.D.; Pérez-Juan, P.M.; García-Olmo, J.; Gómez-Nieto, M.A. Near-infrared reflectance spectroscopy and multivariate analysis in enology: Determination or screening of fifteen parameters in different types of wines. Anal. Chim. Acta 2004, 527, 81–88. [Google Scholar] [CrossRef]
- Lo, A.; Ferna, J.; Sa, A.; Gonza, V. Assessment of quality parameters in grapes during ripening using a miniature fiber-optic near-infrared spectrometer. Int. J. Food Sci. Nutr. 2009, 60, 265–277. [Google Scholar] [CrossRef]
- Dambergs, R.; Gishen, M.; Cozzolino, D. A review of the state of the art, limitations, and perspectives of infrared spectroscopy for the analysis of wine grapes, must, and grapevine tissue. Appl. Spectrosc. Rev. 2015, 50, 261–278. [Google Scholar] [CrossRef]
- Martelo-Vidal, M.J.; Domínguez-Agis, F.; Vázquez, M. Ultraviolet/visible/near-infrared spectral analysis and chemometric tools for the discrimination of wines between subzones inside a controlled designation of origin: A case study of Rías Baixas. Aust. J. Grape Wine Res. 2013, 19, 62–67. [Google Scholar] [CrossRef]
- Liu, L.; Cozzolino, D.; Cynkar, W.; Gishen, M. Geographical classification of Spanish and Australian Tempranillo red wines by Vis and NIRs combined with multivariate analysis. J. Agric. Food Chem. 2006, 54, 6754–6759. [Google Scholar] [CrossRef]
- Balbino, S.; Vincek, D.; Trtanj, I.; Egređija, D.; Gajdoš-Kljusurić, J.; Kraljić, K.; Obranović, M.; Škevin, D. Assessment of pumpkin seed oil adulteration supported by multivariate analysis: Comparison of GC-MS, colorimetry and NIR spectroscopy data. Foods 2022, 11, 835. [Google Scholar] [CrossRef]
- Birkić, A.; Valinger, D.; Jurinjak Tušek, A.; Jurina, T.; Gajdoš Kljusurić, J.; Benković, M. Evaluation of the adsorption and desorption dynamics of beet juice red food colour on alginate microbeads. Gels 2022, 8, 13. [Google Scholar] [CrossRef]
- Bestulić, E.; Rossi, S.; Plavša, T.; Horvat, I.; Lukić, I.; Bubola, M.; Ilak Peršurić, A.S.; Jeromel, A.; Radeka, S. Comparison of different maceration and non-maceration treatments for enhancement of phenolic composition, colour intensity, and taste attributes of Malvazija istarska (Vitis vinifera L.) white wines. J. Food Compost. Anal. 2022, 154, 112619. [Google Scholar] [CrossRef]
- Rivero, F.J.; Gordillo, B.; Jara-Palacios, M.J.; González-Miret, M.L.; Heredia, F.J. Effect of addition of overripe seeds from white grape by-products during red wine fermentation on wine colour and phenolic composition. LWT 2017, 84, 544–550. [Google Scholar] [CrossRef]
- Brown, S.; Tauler, R.; Walczek, B. Comprehensive Chemometrics. In Comprehensive Chemometrics, Chemical and Biochemical Data Analysis, 2nd ed.; Guo, S., Ryabchykov, O., Ali, N., Houhou, R., Bocklitz, T., Eds.; Elsevier: Amsterdam, The Netherlands, 2007; Volume 4, pp. 333–361. [Google Scholar]
- Maletić, E.; Pejić, I.; Karoglan Kontić, J.; Zdunić, G.; Preiner, D.; Šimon, S.; Andabaka, Ž.; Žulj Mihaljević, M.; Bubola, M.; Marković, Z.; et al. Ampelographic and genetic characterization of Croatian grapevine varieties. Vitis J. Grapevine Res. 2015, 54, 93–98. [Google Scholar]
- van Leeuwen, C.; Darriet, P. The Impact of Climate Change on Viticulture and Wine Quality. JWE 2016, 11, 150–167. [Google Scholar] [CrossRef] [Green Version]
- Schanda, J. Colorimetry: Understanding the CIE System; John Wiley & Sons, Inc.: Hoboken, NJ, USA, 2007. [Google Scholar]
- Castellanos, E.R.; Jofre, V.P.; Fanzone, M.L.; Assof, M.V.; Catania, A.A.; Diaz-Sambueza, A.M.; Heredia, F.J.; Mercado, L.A. Effect of different closure types and storage temperatures on the color and sensory characteristics development of Argentinian Torrontes Riojano white wines aged in bottles. Food Control 2021, 130, 108343. [Google Scholar] [CrossRef]
- Kaur, H. Investigating Aquaphotomics for Fruit Quality Assessment. Ph.D. Thesis, The University of Waikato, Hamilton, New Zealand, 2020. [Google Scholar]
- Wang, H.; Peng, J.; Xie, C.; Bao, Y.; He, Y. Fruit quality evaluation using spectroscopy technology: A review. Sensors 2015, 15, 11889–11927. [Google Scholar] [CrossRef] [PubMed] [Green Version]
- Nicolaï, B.M.; Beullens, K.; Bobelyn, E.; Peirs, A.; Saeys, W.; Theron, K.I.; Lammertyn, J. Nondestructive measurement of fruit and vegetable quality by means of NIR spectroscopy: A review. Postharvest Biol. Technol. 2007, 46, 99–118. [Google Scholar] [CrossRef]
- Segtnan, V.H.; Sasić, S.; Isaksson, T.; Ozaki, Y. Studies on the structure of water using two-dimensional near-infrared correlation spectroscopy and principal component analysis. Anal. Chem. 2001, 73, 3153–3161. [Google Scholar] [CrossRef]
- Bázár, G.; Romvári, R.; Szabó, A.; Somogyi, T.; Éles, V.; Tsenkova, R. NIR detection of honey adulteration reveals differences in water spectral pattern. Food Chem. 2016, 194, 873–880. [Google Scholar] [CrossRef]
- Tsenkova, R.; Munćan, J.; Pollner, B.; Kovacs, Z. Essentials of aquaphotomics and its chemometrics approaches. Front. Chem. 2018, 6, 363. [Google Scholar] [CrossRef]
- Genisheva, Z.; Quintelas, C.; Mesquita, D.P.; Ferreira, E.C.; Oliveira, J.M.; Amaral, A.L. New PLS analysis approach to wine volatile compounds characterization by near infrared spectroscopy (NIR). Food Chem. 2018, 246, 172–178. [Google Scholar] [CrossRef] [Green Version]
- Sobolev, I.; Babichenko, S. Application of the wavelet transform for feature extraction in the analysis of hyperspectral laser induced fluorescence data. Int. J. Remote Sens. 2013, 34, 7218–7235. [Google Scholar] [CrossRef]
- Fearn, T. Assessing Calibrations: SEP, RPD, RER and R2. NIR News 2002, 13, 12. [Google Scholar] [CrossRef]
- De Bei, R.; Fuentes, S.; Sullivan, W.; Edwards, E.J.; Tyerman, S.; Cozzolino, D. Rapid measurement of total non-structural carbohydrate concentration in grapevine trunk and leaf tissues using near infrared spectroscopy. Comput. Electron. Agric. 2017, 136, 176–183. [Google Scholar] [CrossRef]
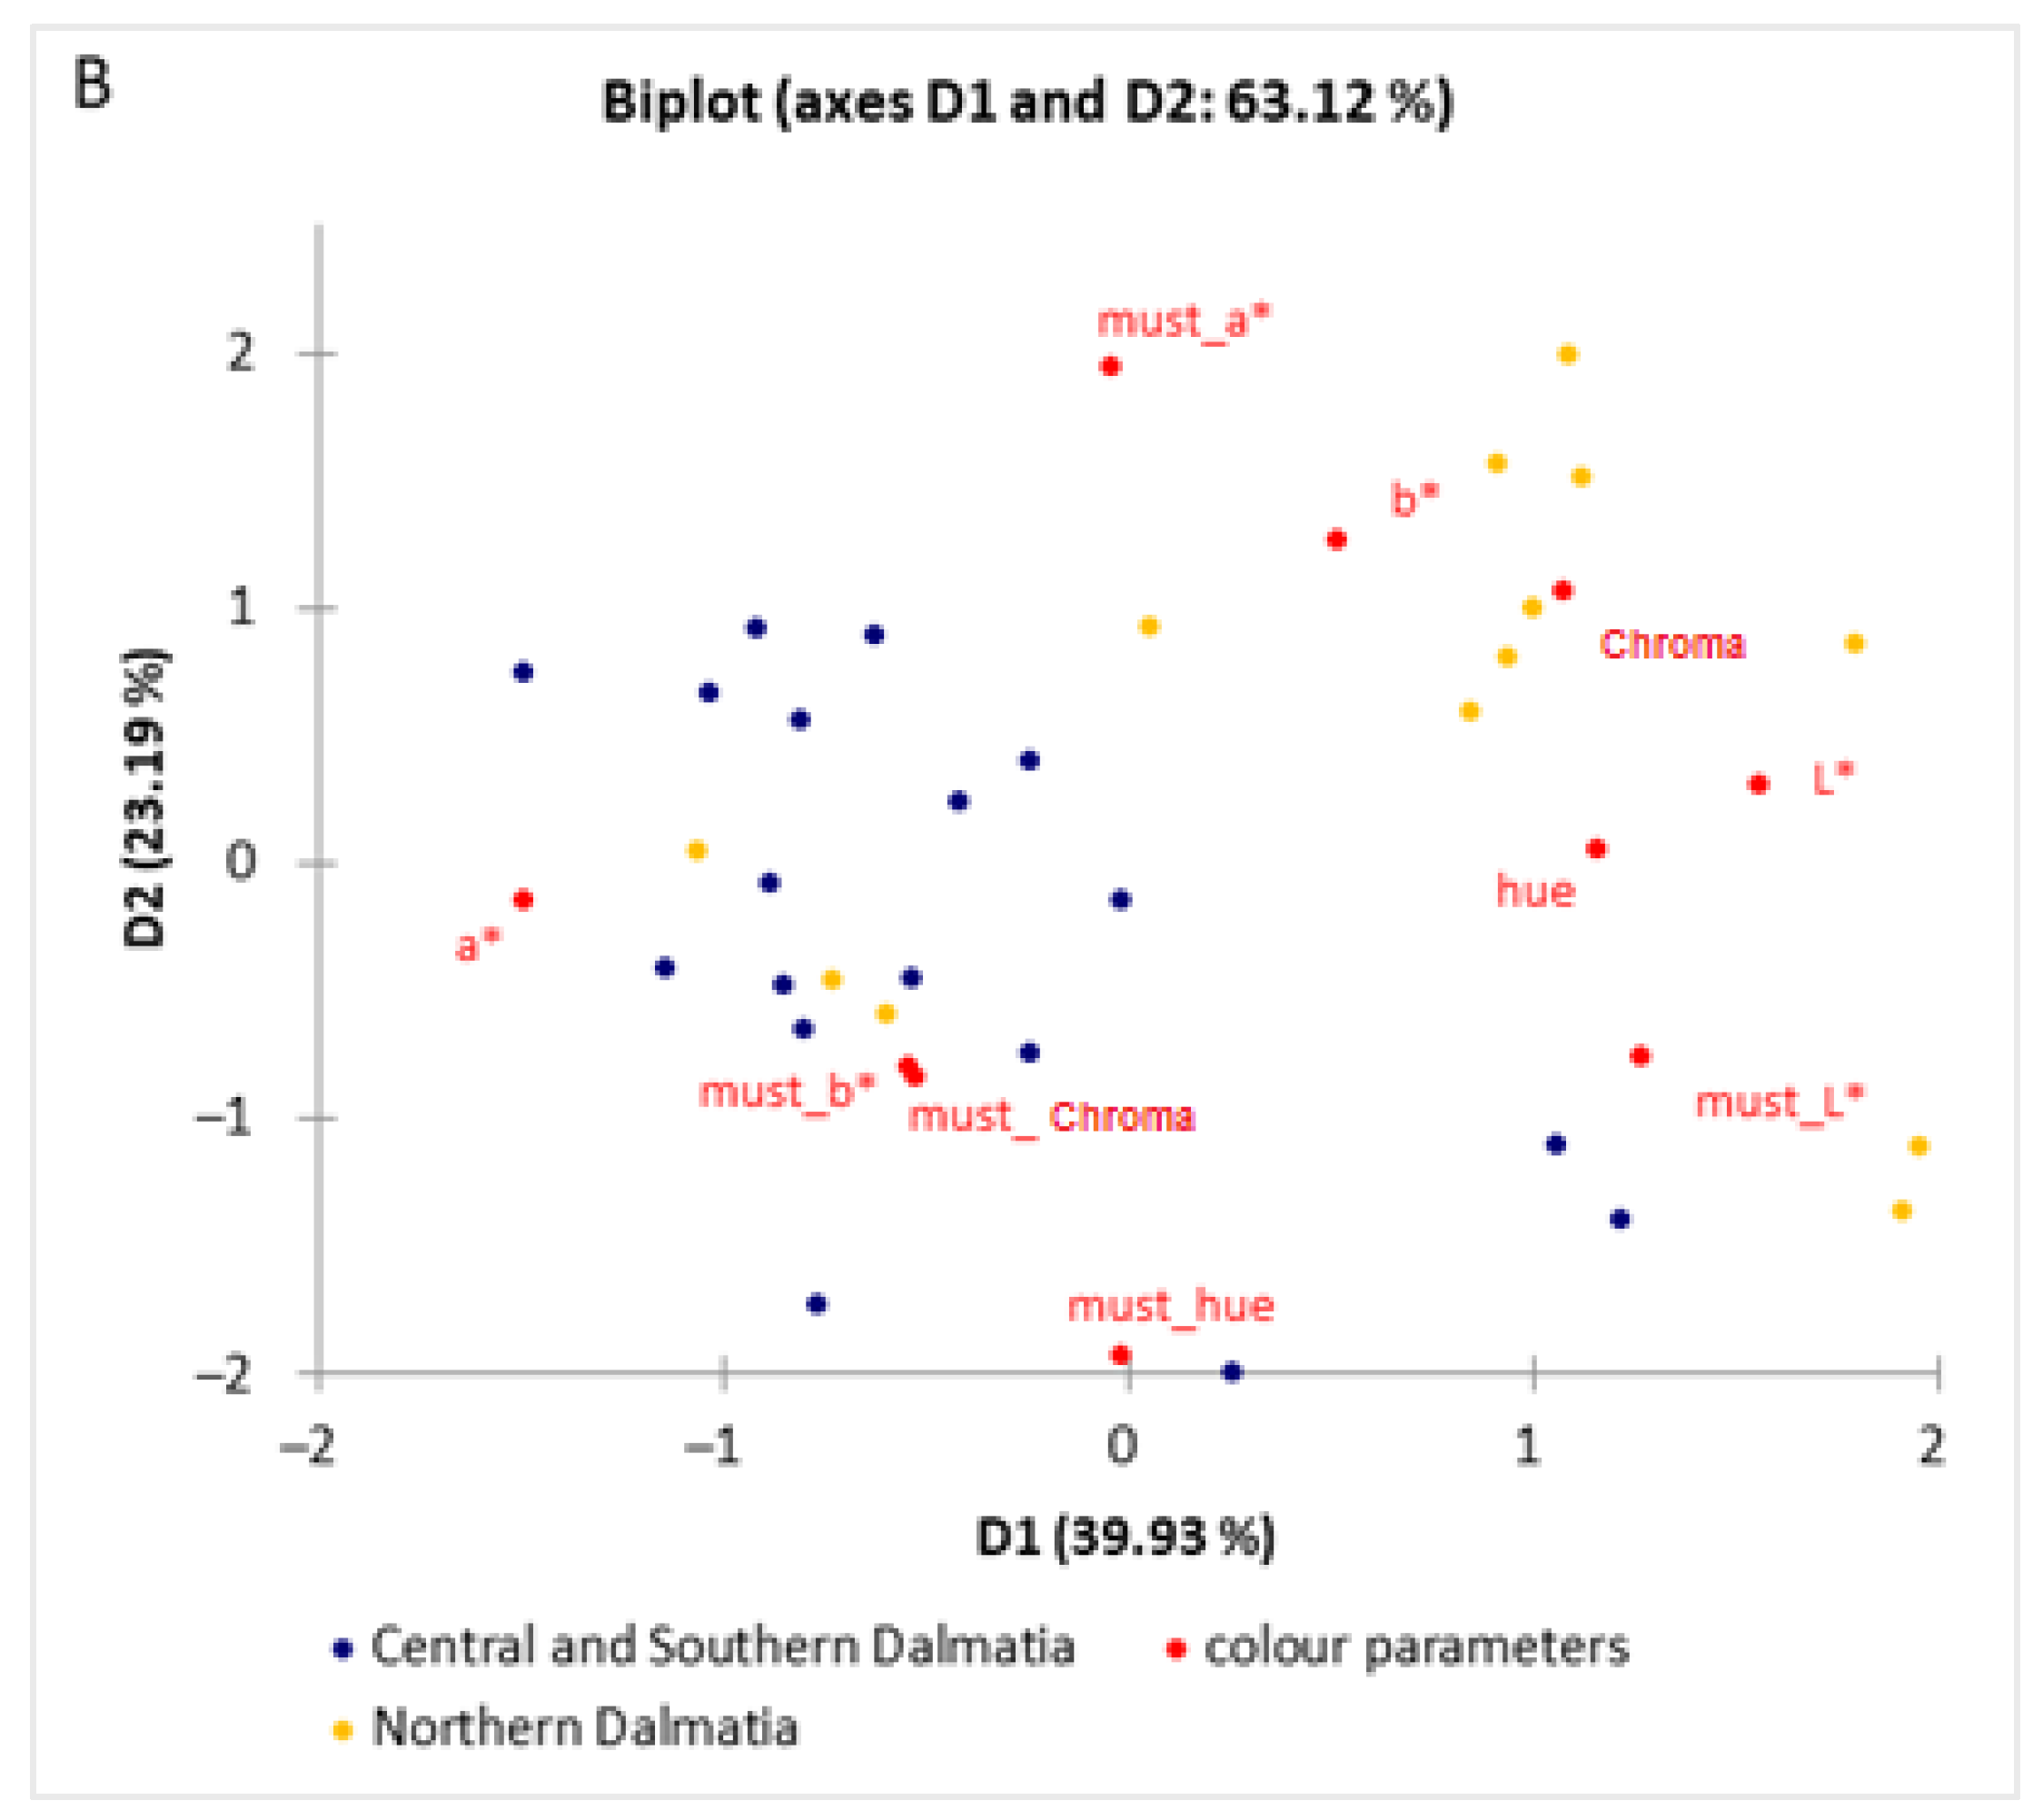
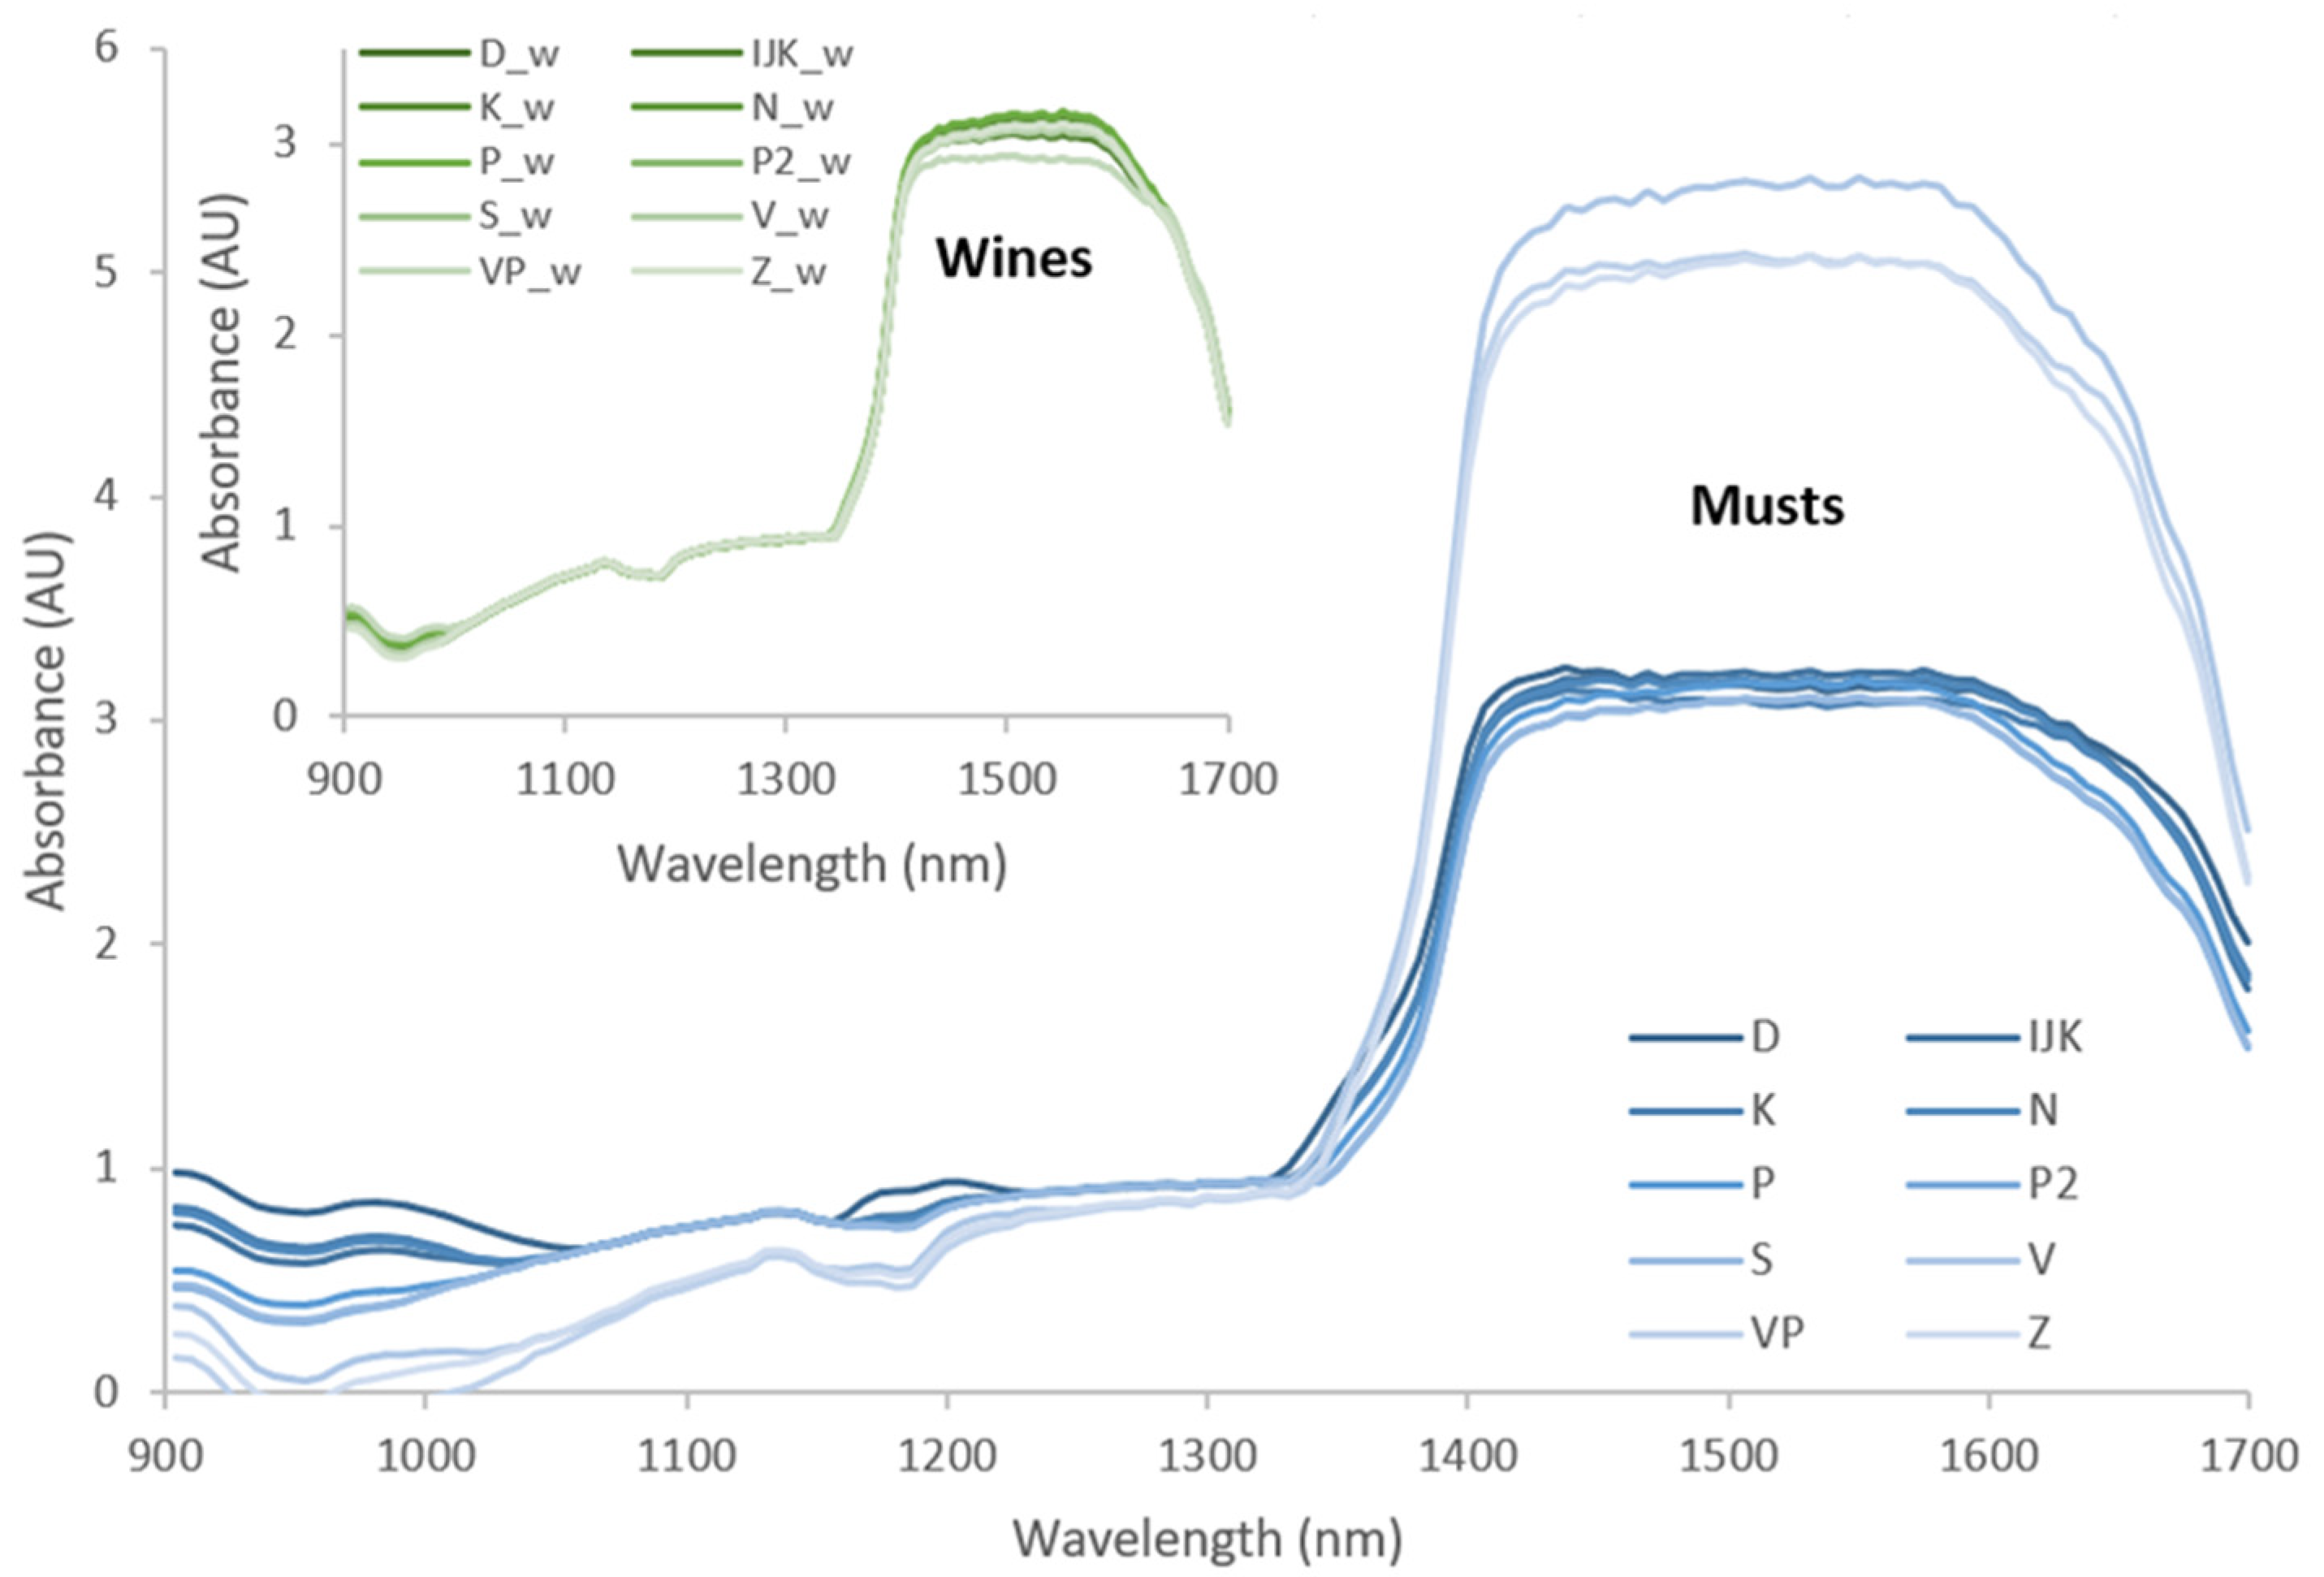
| Parameters | Central and Southern Dalmatia | Northern Dalmatia | |
|---|---|---|---|
| Standard chemical composition | Must | ||
| °Brix | 20.9 ± 2.0 a | 22.2 ± 1.5 b | |
| pH | 3.55 ± 0.08 a | 3.51 ± 0.12 a | |
| TA (g L−1) | 4.79 ± 1.07 a | 4.46 ± 0.62 b | |
| Wine | |||
| pH | 3.45 ± 0.09 a | 3.43 ± 0.11 a | |
| TA (g L−1) | 5.58 ± 0.50 a | 5.72 ± 0.51 a | |
| VA (g L−1) | 0.46 ± 0.06 a | 0.45 ± 0.05 a | |
| RD (20/20 °C) | 0.9912 ± 0.0019 a | 0.9910 ± 0.0015 a | |
| Alcohol (vol %) | 12.65 ± 1.69 a | 13.29 ± 1.11 a | |
| TDE (g L−1) | 20.1 ± 1.7 a | 21.4 ± 1.7 b | |
| RS (g L−1) | 0.8 ± 0.8 a | 0.1 ± 0.1 b | |
| Colour parameters | Must | ||
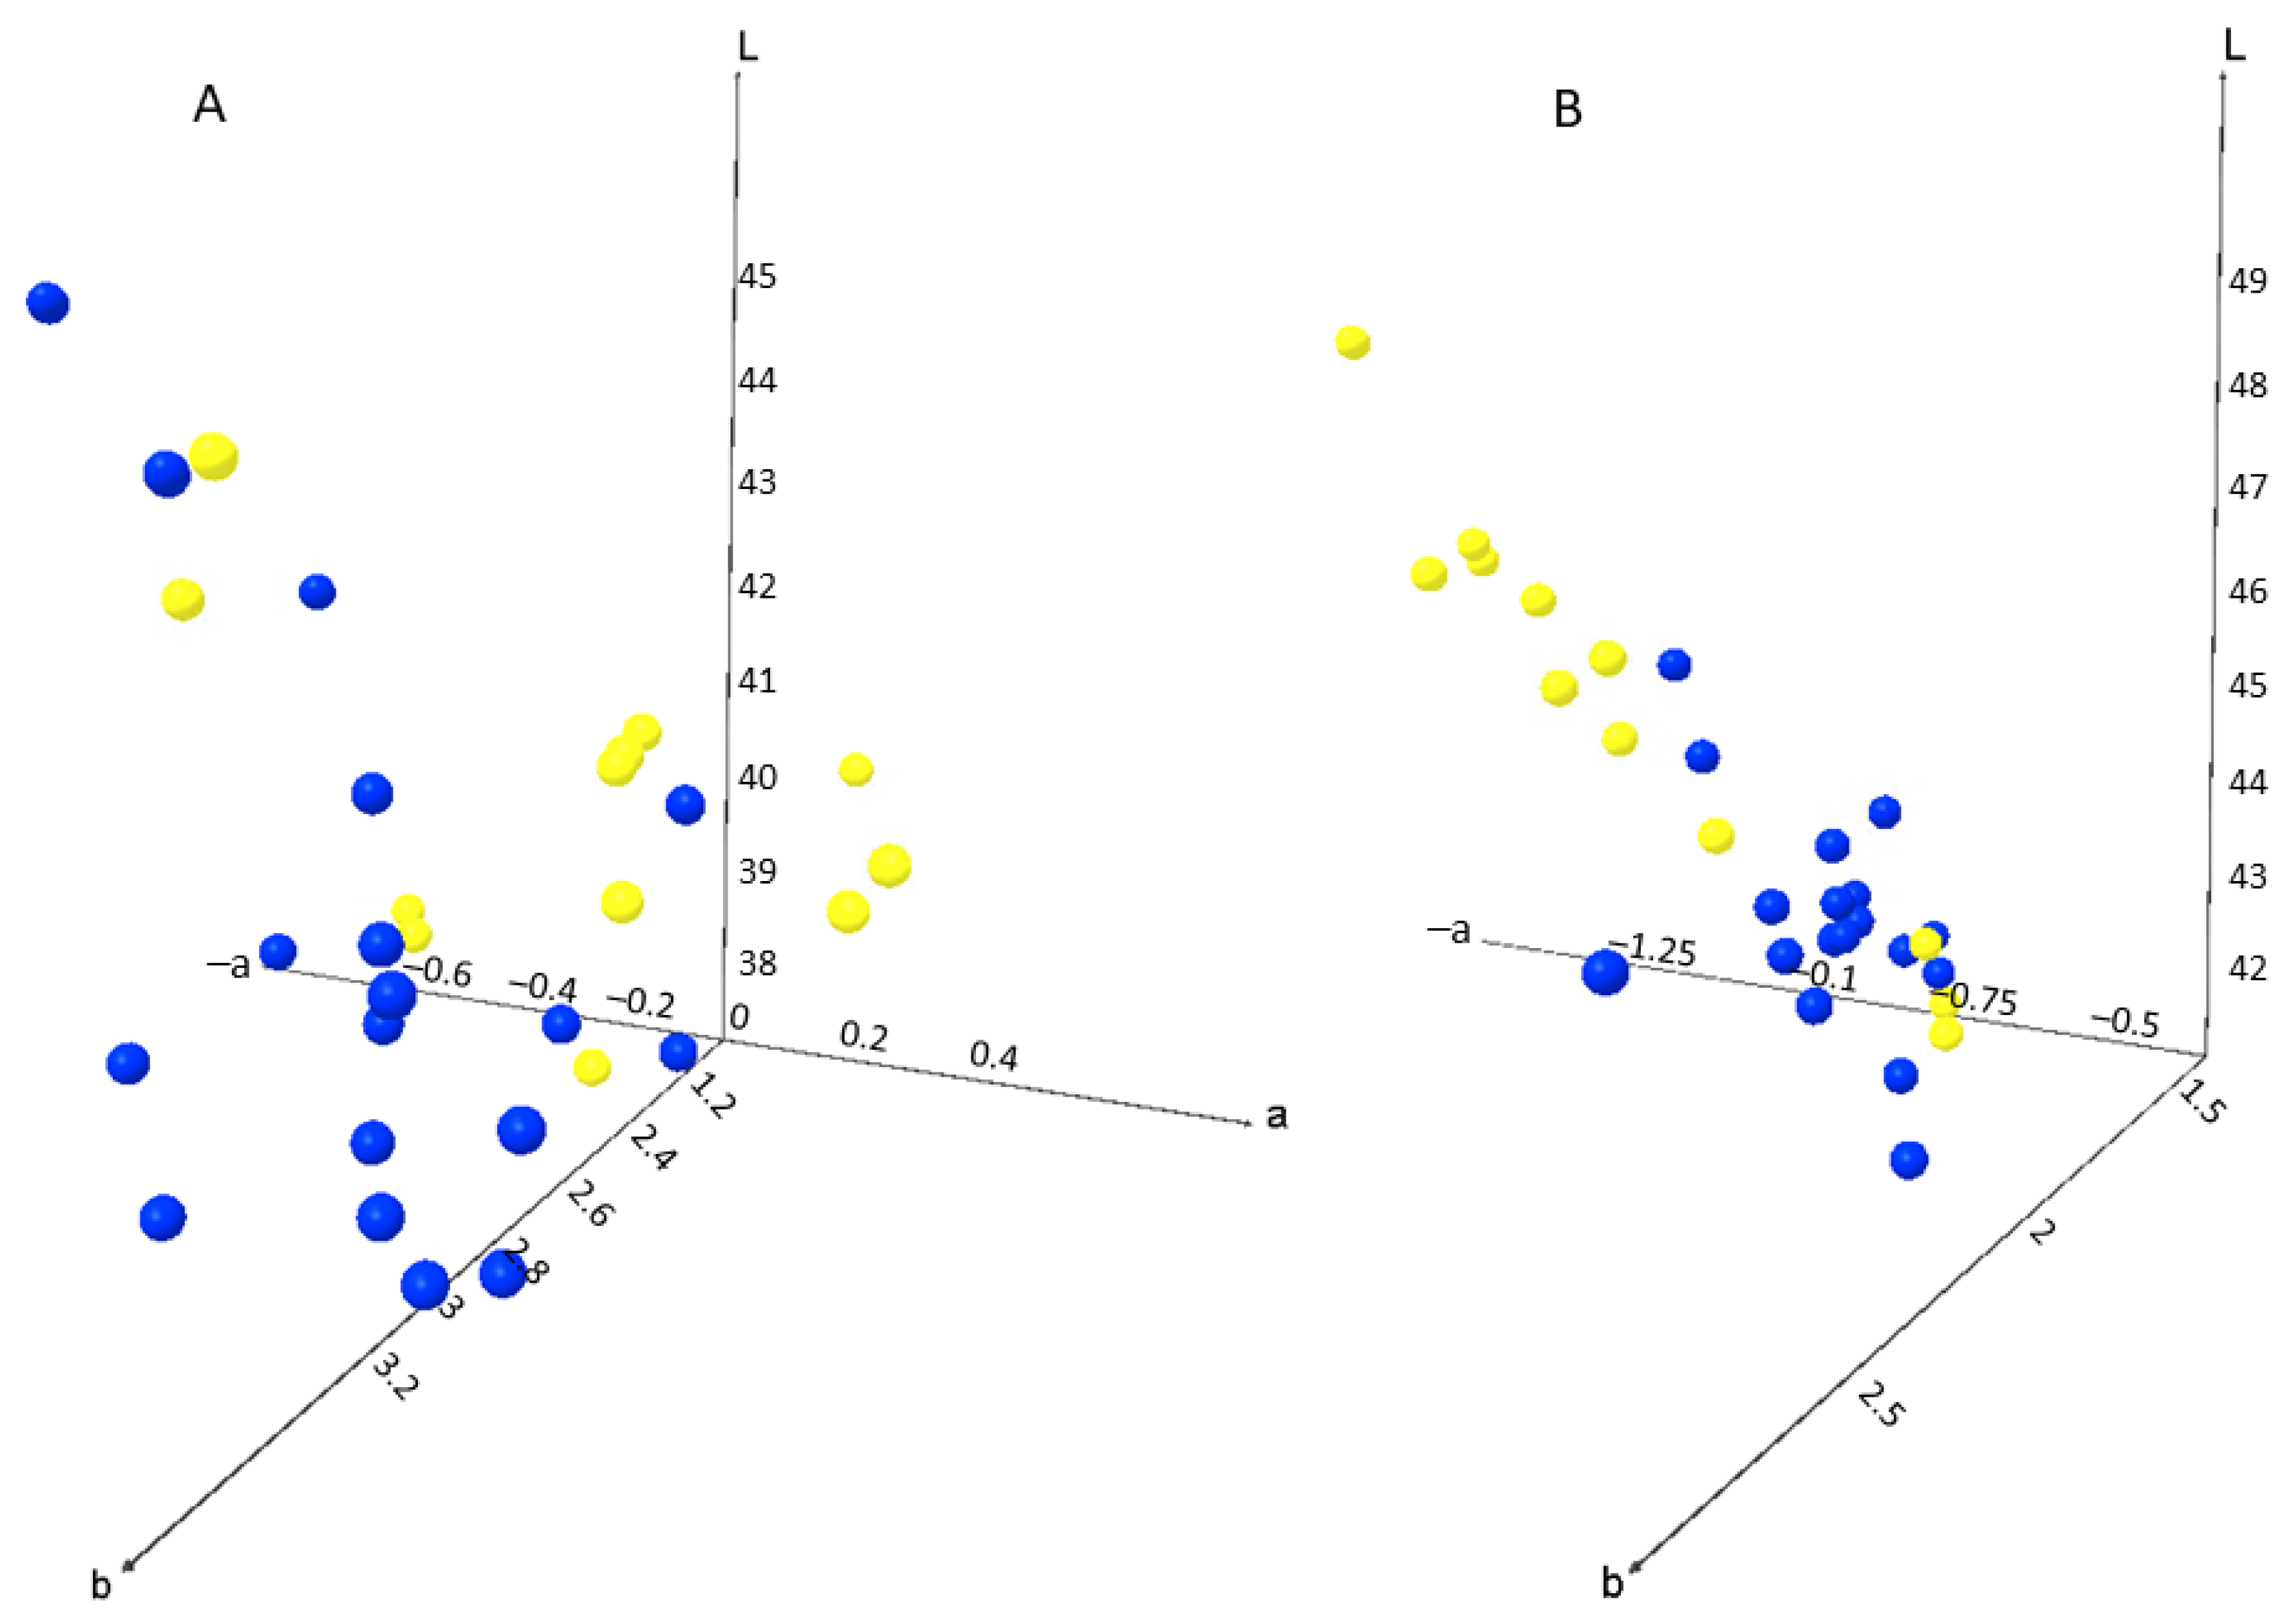
| L* | 40.19 ± 1.81 a | 40.89 ± 1.38 a | |
| a* | −0.07 ± 0.23 a | 0.04 ± 0.27 a | |
| b* | 3.05 ± 0.21 a | 2.76 ± 0.23 b | |
| Chroma | 3.06 ± 0.21 a | 2.77 ± 0.23 b | |
| Hue | 91.58 ± 4.51 a | 89.11 ± 5.56 a | |
| Wine | |||
| L* | 43.56 ± 0.91 a | 45.36 ± 1.92 b | |
| a* | −0.67 ± 0.10 a | −0.91 ± 0.25 b | |
| b* | 1.96 ± 0.24 a | 1.99 ± 0.16 a | |
| Chroma | 2.07 ± 0.22 a | 2.20 ± 0.20 a | |
| Hue | 109.02 ± 3.77 a | 114.34 ± 5.65 b | |
| Calibrated/Predicted Parameters | M (Must–Must) | M (Wine–Wine) | M (Must–Wine) | ||||||
|---|---|---|---|---|---|---|---|---|---|
| R2 | RPD | RMSE | R2 | RPD | RMSE | R2 | RPD | RMSE | |
| °Brix | 0.993 | 2.403 | 0.876 | - | - | - | - | - | - |
| pH | 0.998 | 5.154 | 0.022 | 0.980 | 12.033 | 0.104 | 0.990 | 4.773 | 0.073 |
| TA (g L−1) | 0.984 | 11.414 | 0.654 | 0.963 | 1.144 | 0.806 | 0.968 | 1.323 | 0.750 |
| VA (g L−1) | - | - | - | 0.920 | 6.064 | 0.103 | 0.961 | 12.276 | 0.073 |
| RD (20/20 °C) | - | - | - | 0.966 | 9.603 | 0.002 | 0.994 | 19.090 | 0.001 |
| Alcohol (vol%) | - | - | - | 0.996 | 4.820 | 0.548 | 0.999 | 22.862 | 0.184 |
| TDE (g L−1) | - | - | - | 0.937 | 2.297 | 2.736 | 0.952 | 2.091 | 2.400 |
| RS (g L−1) | - | - | - | 0.989 | 4.489 | 0.393 | 0.963 | 1.234 | 0.749 |
| L* | 0.990 | 2.030 | 0.905 | 0.999 | 12.621 | 0.127 | 0.952 | 0.807 | 1.951 |
| a* | 0.988 | 10.566 | 0.155 | 0.998 | 4.114 | 0.498 | 0.968 | 4.742 | 0.208 |
| b* | 0.999 | 15.952 | 0.043 | 0.998 | 5.331 | 0.038 | 0.992 | 19.003 | 0.102 |
| Chroma | 0.999 | 5.737 | 0.045 | 0.997 | 3.450 | 0.061 | 0.999 | 10.475 | 0.020 |
| Hue | 0.991 | 1.886 | 2.689 | 0.999 | 10.058 | 0.506 | 0.956 | 2.532 | 6.033 |
Publisher’s Note: MDPI stays neutral with regard to jurisdictional claims in published maps and institutional affiliations. |
© 2022 by the authors. Licensee MDPI, Basel, Switzerland. This article is an open access article distributed under the terms and conditions of the Creative Commons Attribution (CC BY) license (https://creativecommons.org/licenses/by/4.0/).
Share and Cite
Kljusurić, J.G.; Boban, A.; Mucalo, A.; Budić-Leto, I. Novel Application of NIR Spectroscopy for Non-Destructive Determination of ‘Maraština’ Wine Parameters. Foods 2022, 11, 1172. https://doi.org/10.3390/foods11081172
Kljusurić JG, Boban A, Mucalo A, Budić-Leto I. Novel Application of NIR Spectroscopy for Non-Destructive Determination of ‘Maraština’ Wine Parameters. Foods. 2022; 11(8):1172. https://doi.org/10.3390/foods11081172
Chicago/Turabian StyleKljusurić, Jasenka Gajdoš, Ana Boban, Ana Mucalo, and Irena Budić-Leto. 2022. "Novel Application of NIR Spectroscopy for Non-Destructive Determination of ‘Maraština’ Wine Parameters" Foods 11, no. 8: 1172. https://doi.org/10.3390/foods11081172
APA StyleKljusurić, J. G., Boban, A., Mucalo, A., & Budić-Leto, I. (2022). Novel Application of NIR Spectroscopy for Non-Destructive Determination of ‘Maraština’ Wine Parameters. Foods, 11(8), 1172. https://doi.org/10.3390/foods11081172


