1. Introduction
Institutional foodservice provides meals to workers in corporate offices, factories, dormitories, training centers, and the like at workplace cafeterias (called staff cafeterias, staff canteens, employee canteens, staff restaurants, employee restaurants, etc.).
Institutional foodservice provides healthy, well-balanced food to workers [
1,
2]. Improvements in physical dining areas and the quality of employee meals increases employee satisfaction and financial performance [
3,
4]. Upon the introduction of institutional foodservice, productivity was improved [
5], meal skipping was reduced [
6], the nutritional quality of lunch was improved over a long period of time [
7], and the salt content of lunch was reduced [
8]. Institutional foodservice is thus an important research subject because it affects company productivity by supplying necessary nutrients to workers, which helps them maintain their health and increases work efficiency.
Institutional foodservices provide meals to many workers (i.e., customers) under established conditions and standards. Some customers are satisfied with the meal, some are dissatisfied, and some take them for granted or are indifferent. As factors of customer satisfaction with institutional foodservice, materials (location, cleanliness of dishes and cutlery, etc.), service (staff politeness, staff outfits, etc.), menu (taste and temperature of meals, variety of meals on the daily menu, etc.) [
1]; variety of menu items, value for money [
3]; clean and hygienic employee restaurant, various meals, delicious food [
4]; and salt intake [
7] have been used. As foodservice has developed, the requirements of customers who use institutional foodservice have become increasingly diverse, and in the past two years, various COVID-19-related changes have been imposed on institutional foodservice, such as social distancing and quarantine standards.
Studies of consumer perceptions and attitudes, including the dining-out environment caused by COVID-19, have been conducted. Shorter lunchtimes and social distancing are being implemented at the workplace cafeteria [
9], and the importance of hand sanitizer and restaurant precautionary measures in the food supply chain and restaurant are being emphasized [
10]. Safe food and a safe environment are valued above all else in self-service buffet restaurants [
11], and consumers value facial recognition payment, hand sanitizer, divided dining spaces, and robot service when dining out [
12]. Customers have even said they are willing to pay more to eat in restaurants that use precautionary measures [
13]. In addition, food handlers in the foodservice retail sector use approved cleaning agents and disinfectants and maintain social distancing [
14]. School nutrition programs emphasize the importance of public distancing, reducing touch points, and using face covers and masks for the health and safety of students and staff, along with the importance of masks, sterilization, and hygiene [
15].
However, most of those studies were quantitative and measured satisfaction and revisiting intention using existing satisfaction factors. No previous study has comprehensively analyzed satisfaction factors by beginning with the quality perceived by consumers.
Garvin (1984) said that individual consumers have different wants or needs, and the goods that best satisfy their individual preferences have the highest quality for them [
16]. Park (2018) said that quality is the ability to satisfy customers and provide customer satisfaction [
17], and Oliver (2010) said that customer satisfaction is an individual’s perception of a product or service [
18].
Most quality-related institutional foodservice studies have used definitions of quality from previous studies. In addition, many studies have considered customer satisfaction, customer loyalty, and revisit intention, and many studies have used the one-dimensional method, assuming that customer satisfaction increases when customer needs are met.
The Kano model, a method for researching the attributes of quality, customer needs, and customer satisfaction in quality management, industrial engineering, and business administration, has been expanded to the dining-out and bakery fields. Studies using the Kano model are lacking in the institutional foodservice field.
Therefore, this study uses a mixed-methods design to analyze customer satisfaction factors from the perspective of customers who have used institutional foodservice during COVID-19. In that way, this study aims to improve customer satisfaction and contribute to the ability of institutional foodservice to meet various consumer needs and changing food environments.
The research questions of this study are as follows.
First, how do customers perceive the quality of institutional foodservice?
Second, what are the attributes of institutional foodservice quality, and what factors affect customer satisfaction or dissatisfaction?
Third, what are the differences and improvement priorities for satisfaction with institutional foodservice quality?
4. Discussion
Due to COVID-19, consumers not only want nutritious food, but are also concerned about safety [
49,
50]. Therefore, when dining out, customers prefer a place with good preventive measures, such as table dividers to prevent splashing during meals and good ventilation [
13]. Checking customer’s body temperature with a thermal imaging detector at the entrance of a restaurant [
51,
52], recording entry with a QR code [
53], and providing hand sanitizer dispensers in the restaurant are now commonplace [
12,
53].
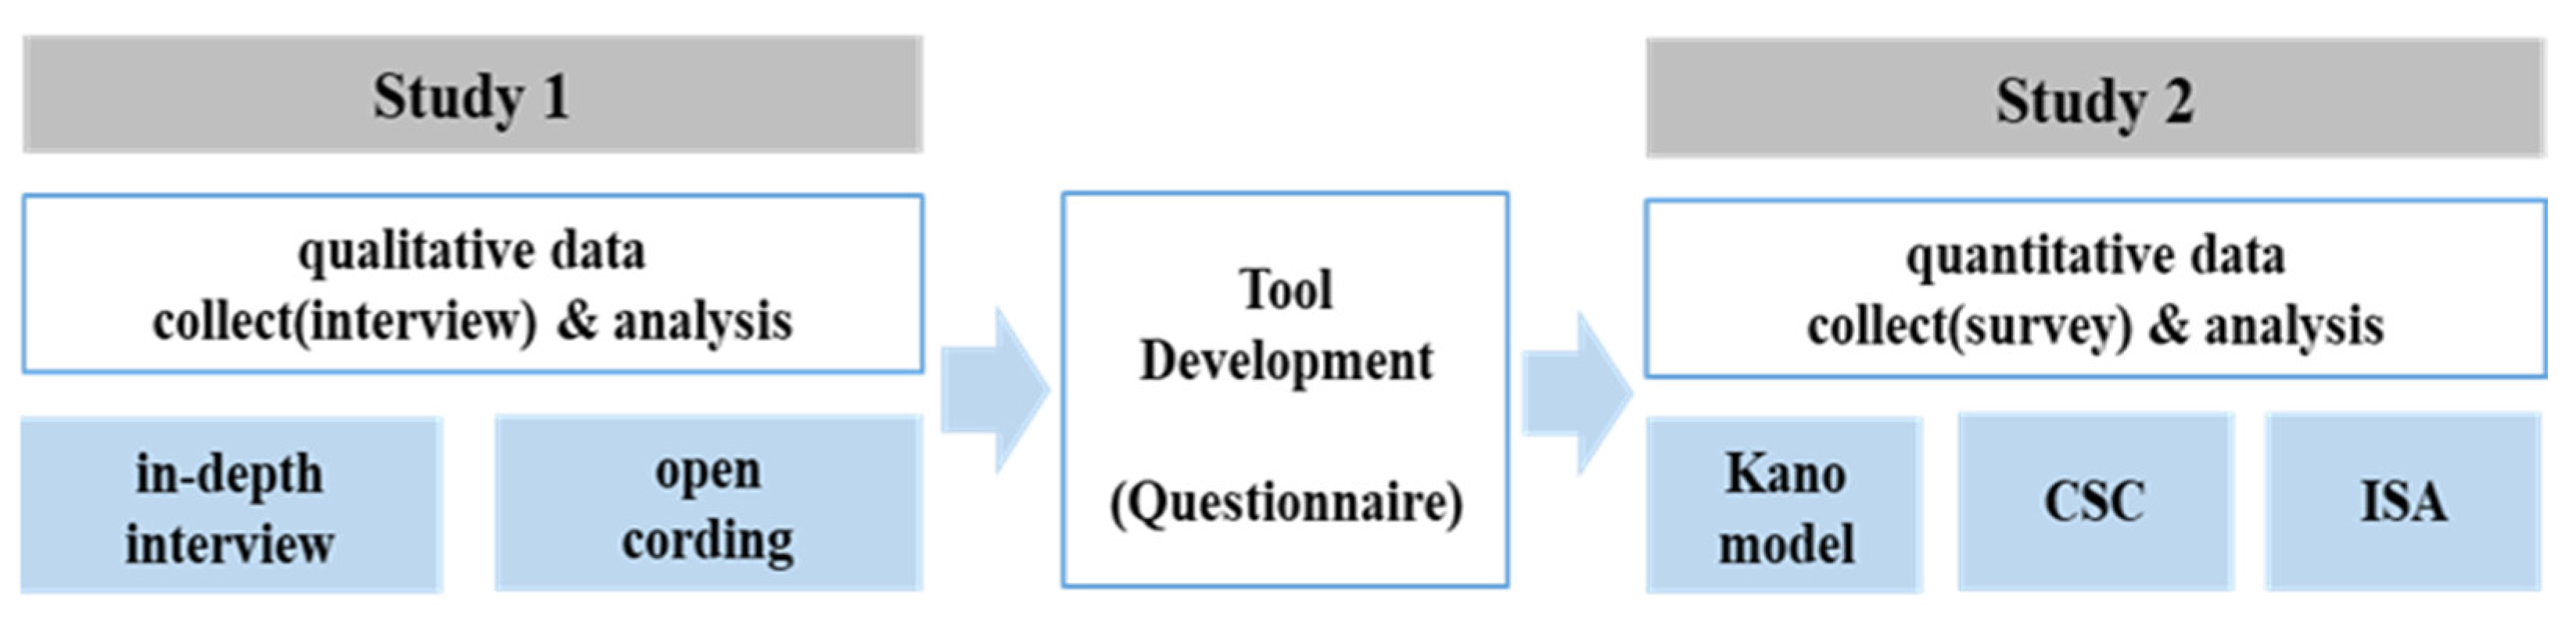
Among those changes, it was necessary to newly identify the factors that affect customer satisfaction with institutional foodservice on a daily basis. Therefore, a mixed-methods design was used here to comprehensively analyze the customer satisfaction factors in institutional foodservice from a user-based approach.
First, qualities were derived from in-depth interviews and open coding, which are qualitative user-based research methods to identify customer satisfaction factors. Most of those results were consistent with the customer satisfaction factors in previous studies [
41], but ‘indication of ingredient origin’, ‘hand sanitizer’, and ‘table dividers’ were new quality factors. Among them, ‘hand sanitizer’ and ‘table dividers’ are considered to reflect changes in institutional foodservice that have emerged amid the COVID-19 pandemic.
Hand sanitizer and table dividers have been installed for customer safety during the pandemic, but they are now essentials for restaurant meals, and it is predicted that they will remain basic items in institutional foodservice.
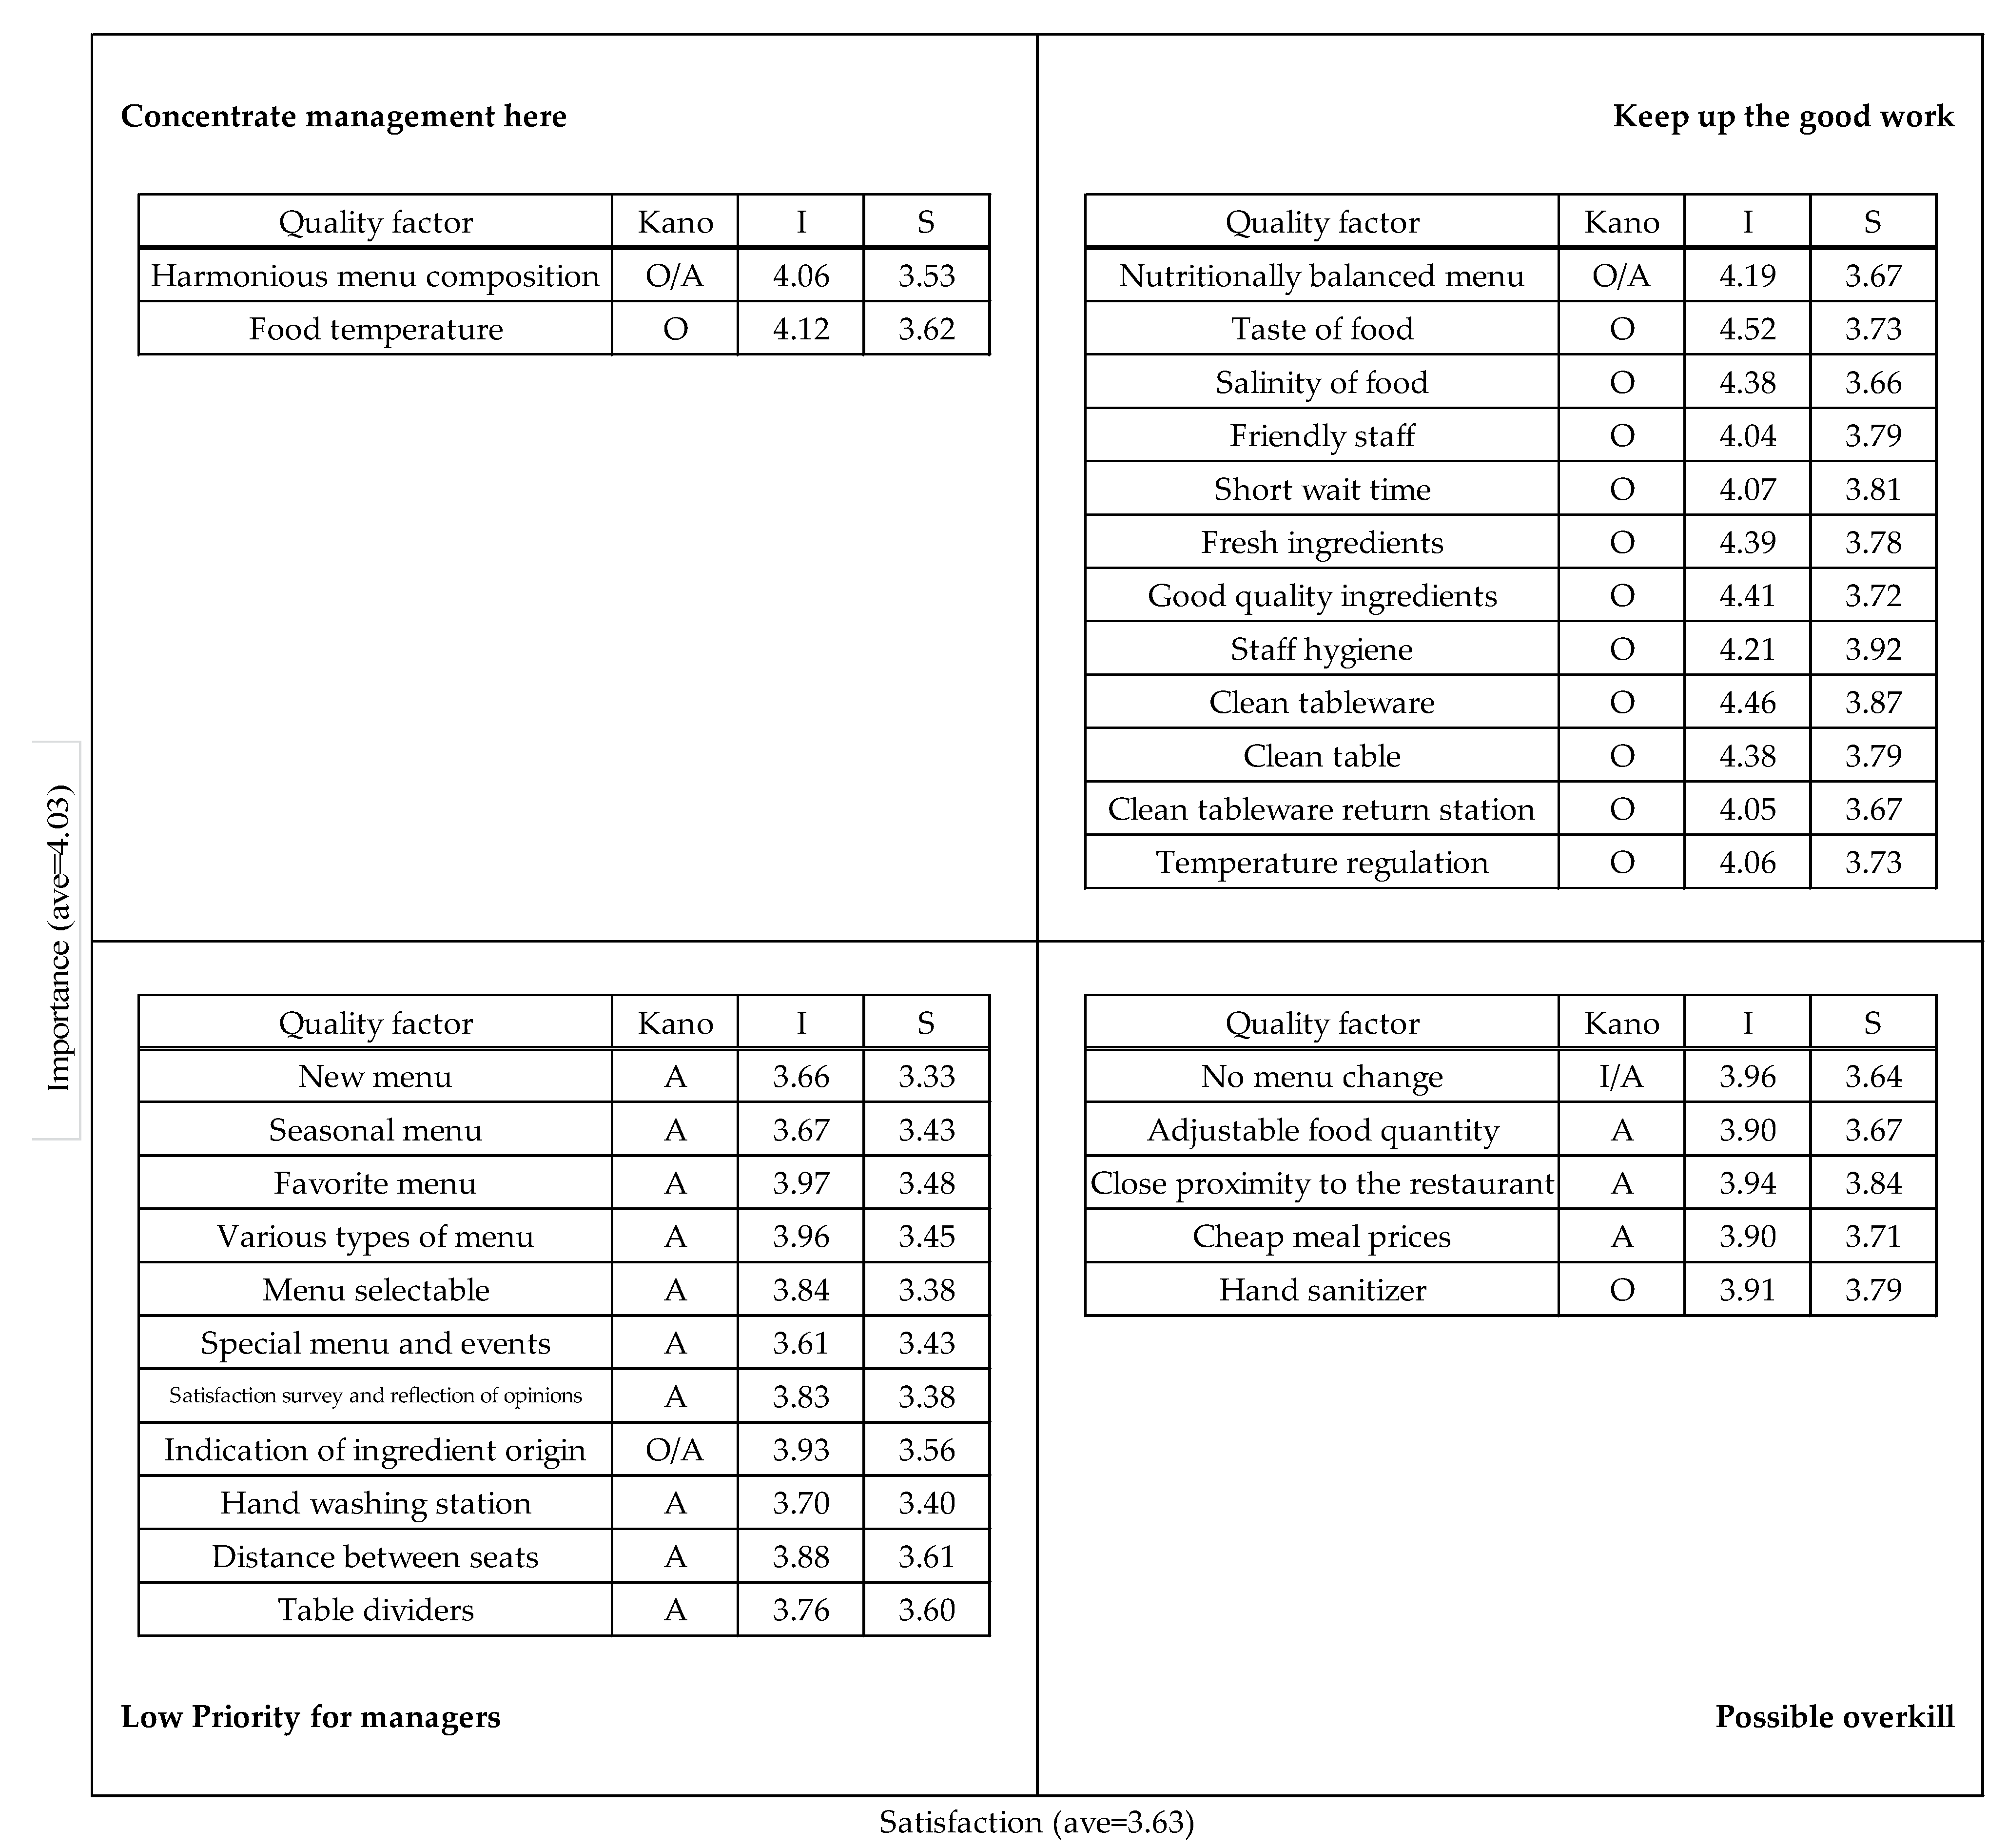
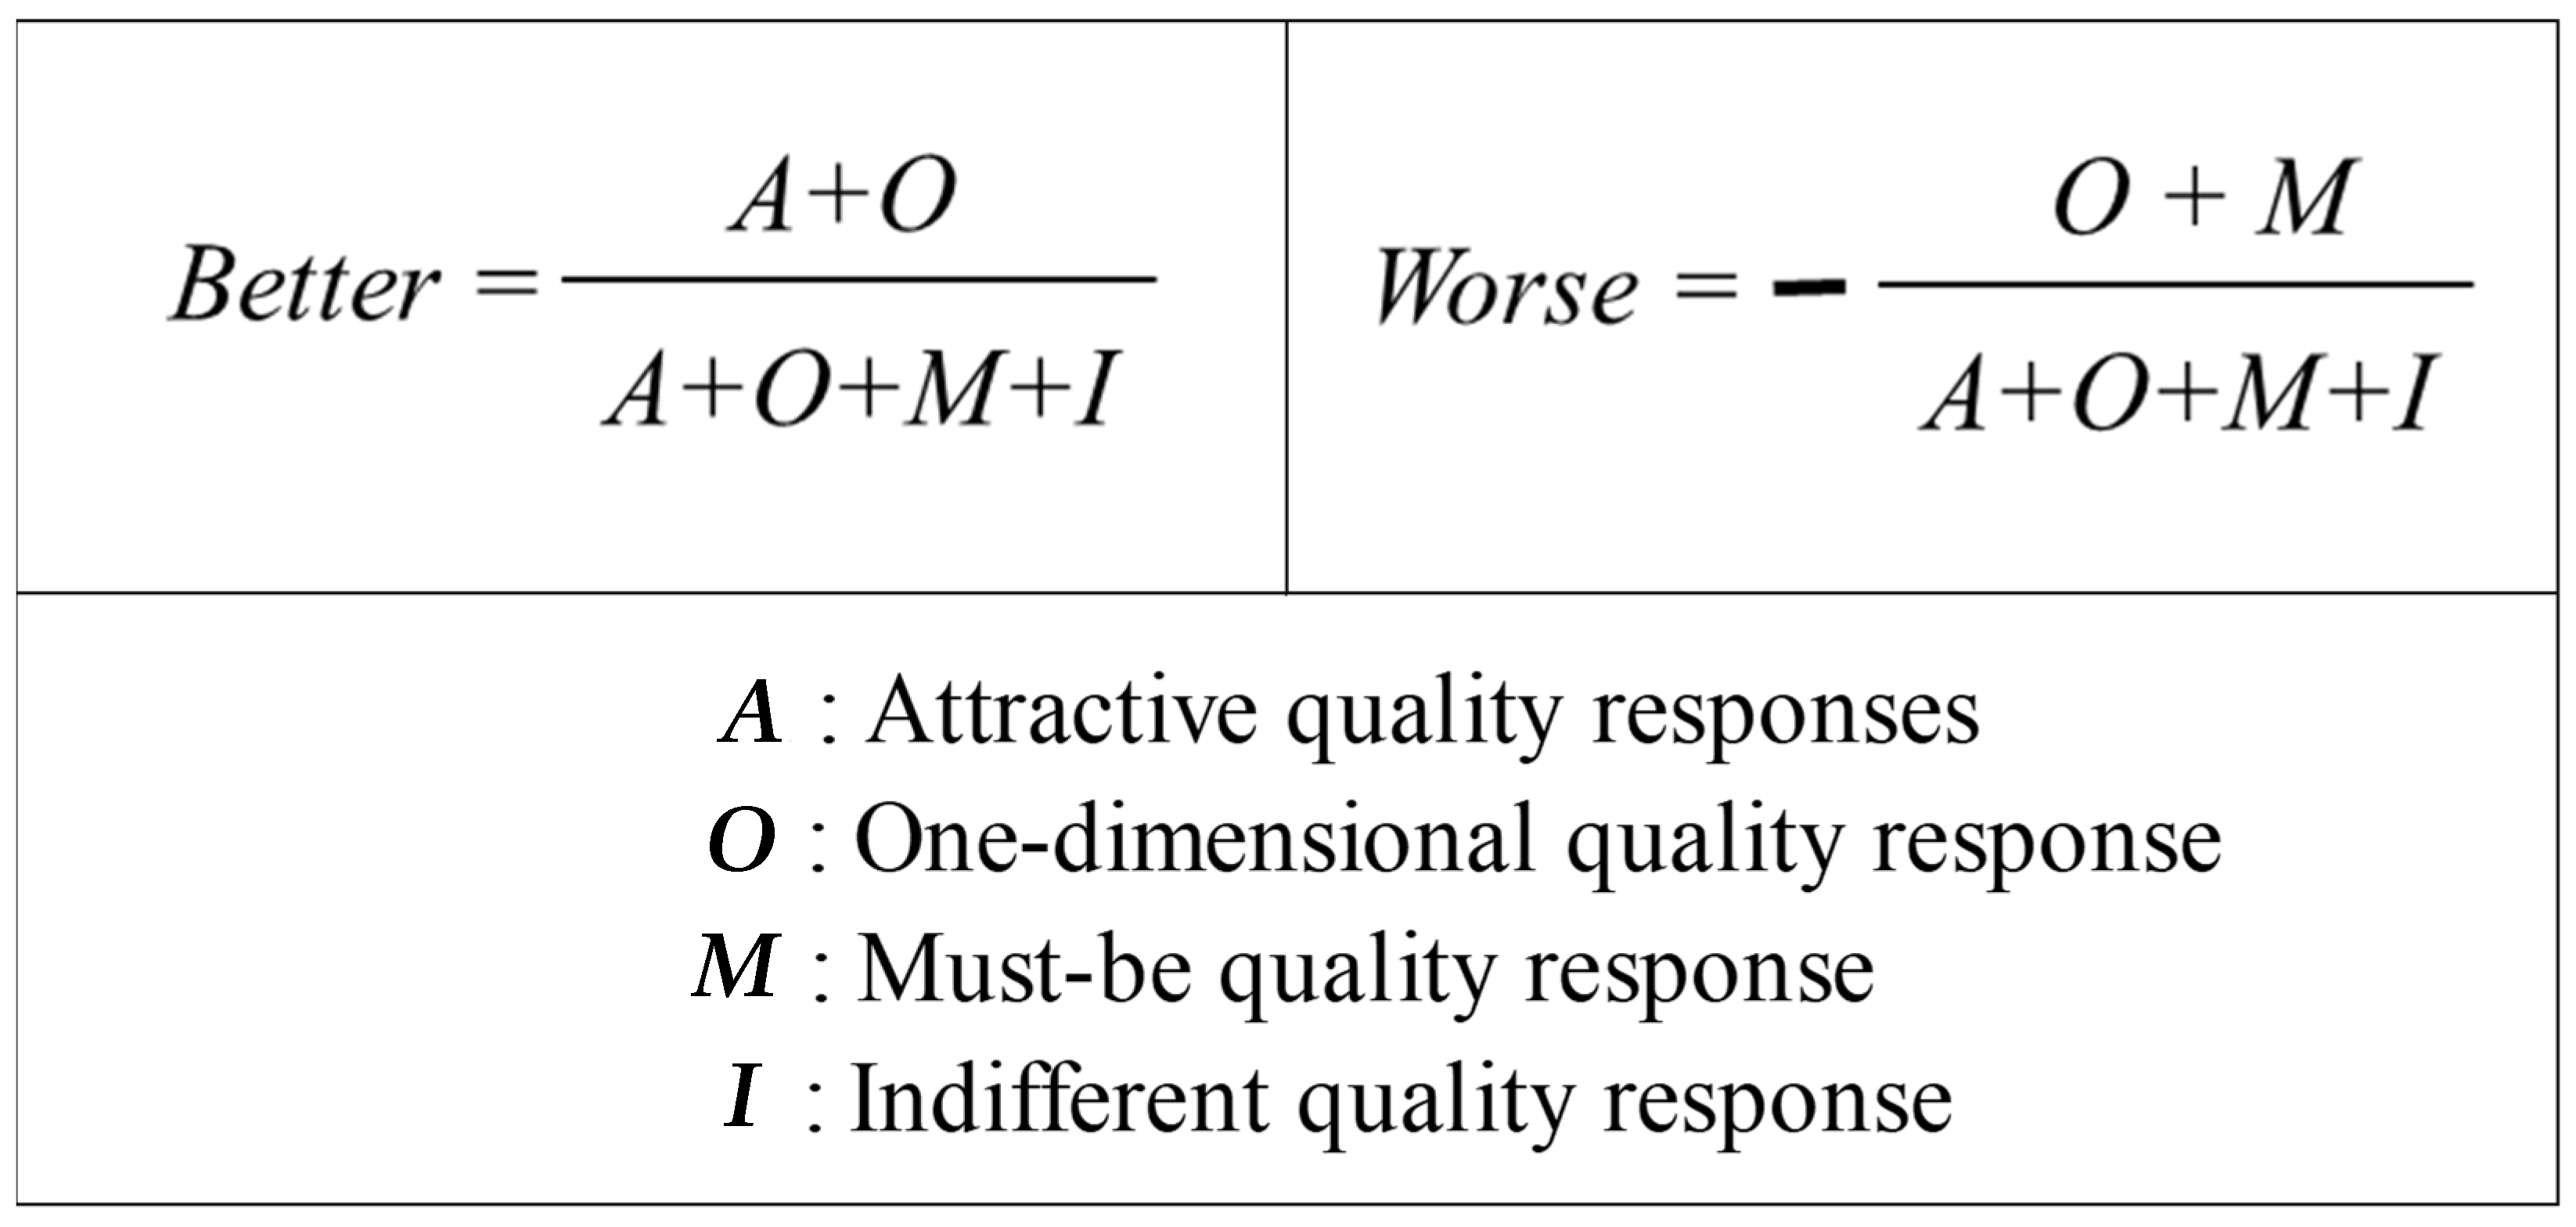
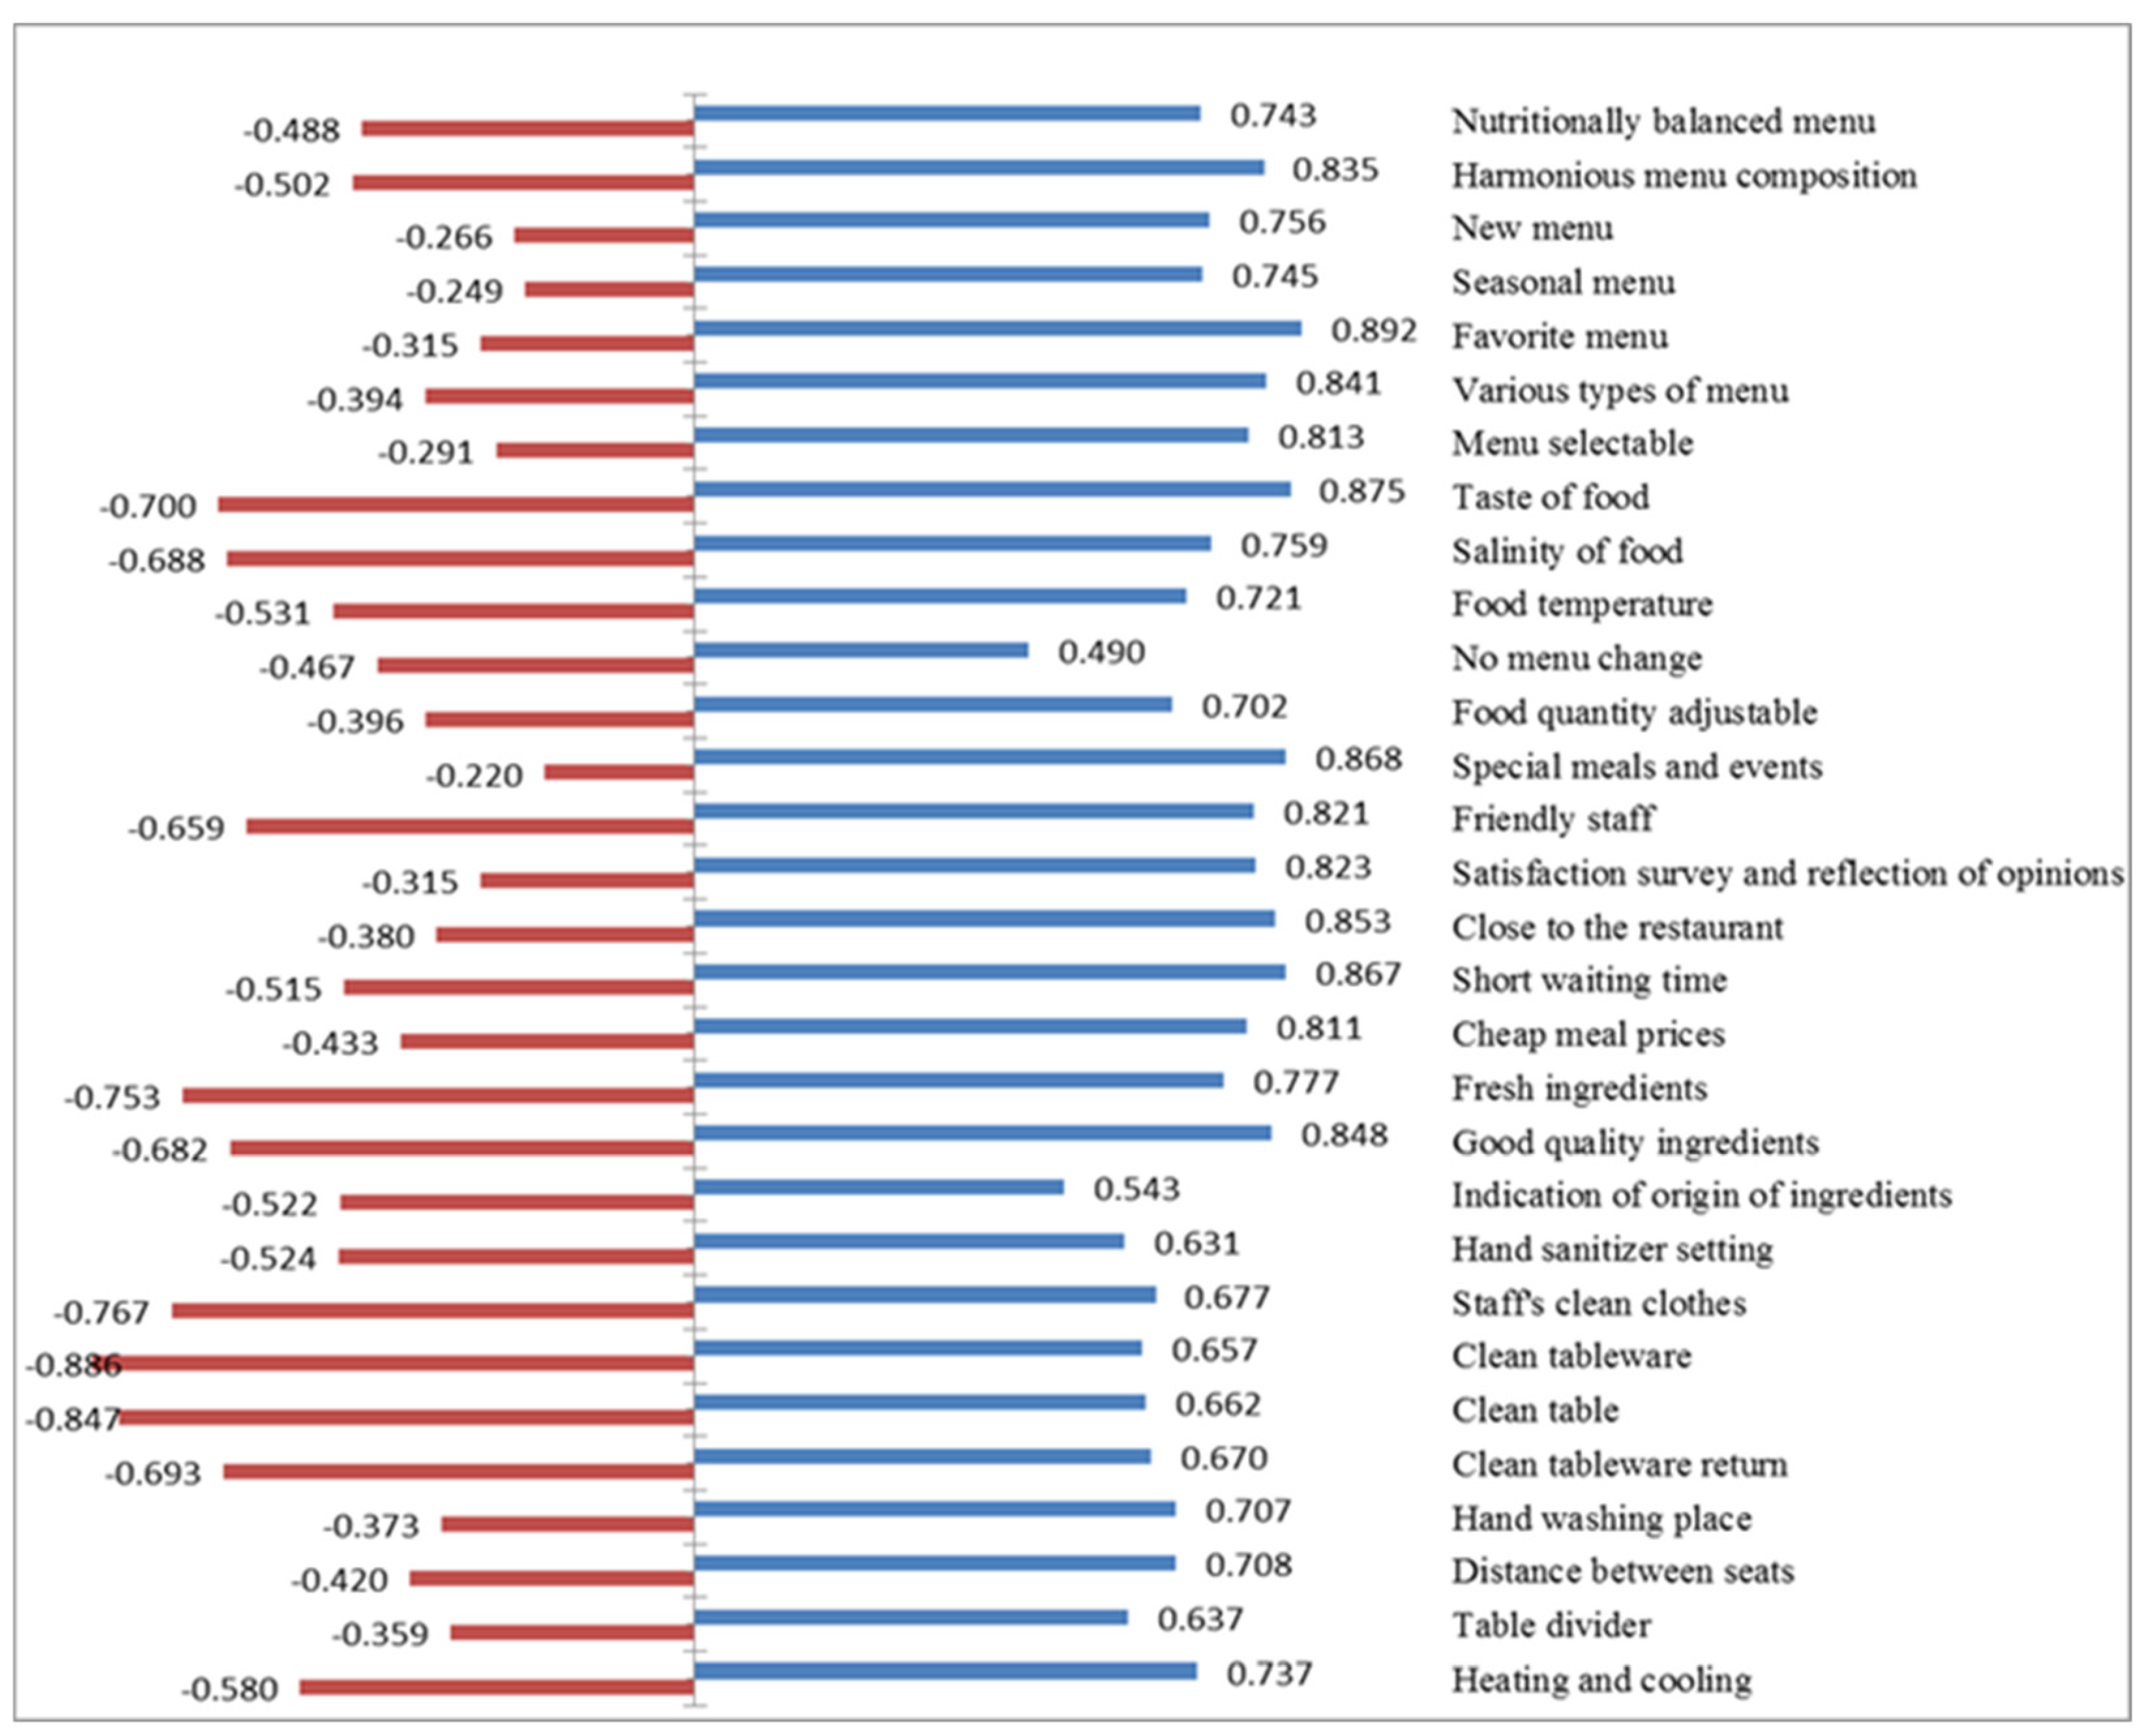
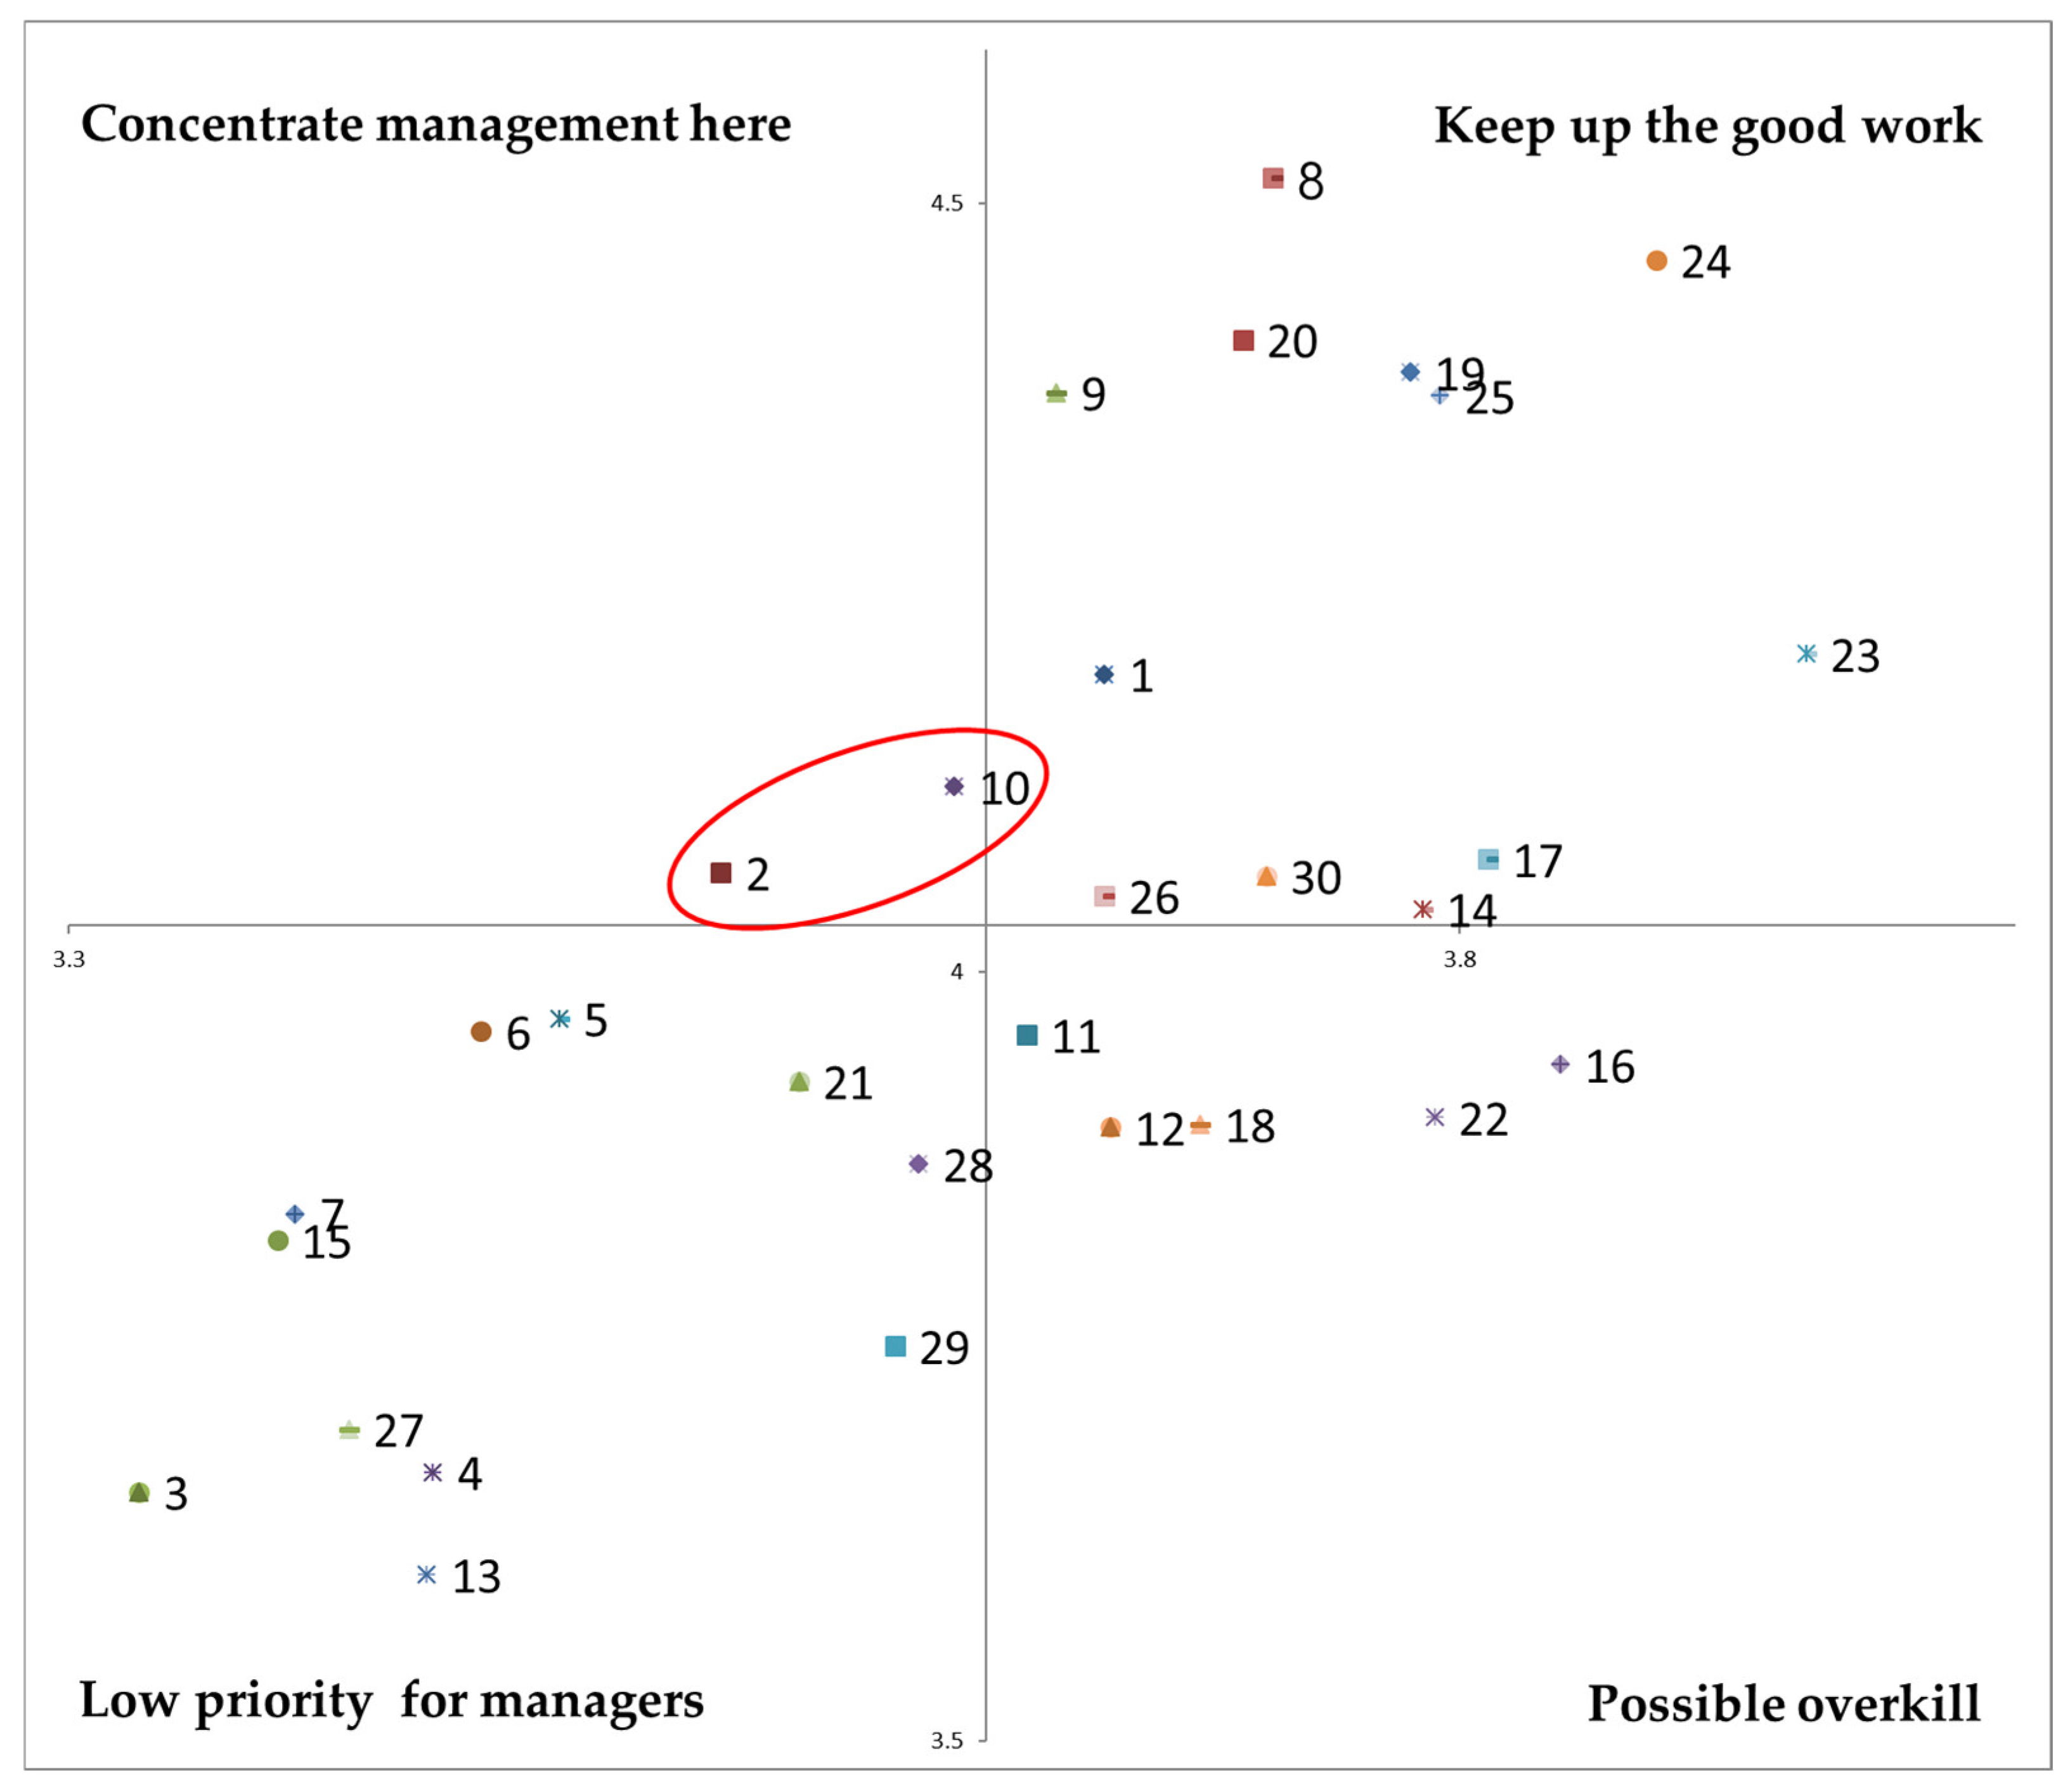
The Kano model showed that the quality of institutional foodservice can be judged in terms of Attractive quality, One-dimensional, and Combination attributes. The CSC analysis showed that favorite menu, taste of food, and special menu and events had the highest satisfaction coefficients (Better), and clean tableware, clean table, and staff hygiene had the highest dissatisfaction coefficients (Worse). In the ISA, qualities for satisfaction being lower than importance (harmonious menu composition and food temperature) were distributed in the concentrate management here quadrant. In other words, to increase customer satisfaction with institutional foodservice, it is important to improve harmonious menu composition and food temperature.
On the other hand, due to the COVID-19, restaurants are recognized as dangerous area because of the high density of people gathering in one place [
54]. Compared with the number of customers using institutional foodservice, the space for providing meals is small, and most customers use the space at specific time, so it is crowded. Therefore, to minimize the COVID risk in institutional foodservice spaces, customers can be asked to eat in a specific time interval, space between users and seats can be maximized, table dividers (partitions) can be installed, and customers can be asked to stay apart when returning tableware.
Studies related to dining out during the COVID-19 pandemic have shown that customers are willing to visit and higher costs at restaurants that have plexiglass dividers, air filters, and widely spaced tables and maintain preventive measures such as wearing masks while working [
13]. Therefore, when designing a new restaurant for employees, it is important to include a hand washing area, thermal image detector, table dividers (partitions), proper seating distance, and ventilation so that employees can safe and sanitary meals.
COVID-19 has increased customer interest in food hygiene and safety. Institutional foodservice in Korea is mainly operated as a face-to-face, self-service buffet. However, due to COVID-19, kiosks have been introduced, and menu selection and payment are expanding to non-face-to-face methods. Recently, robots that move cutlery or side dishes to a serving table have been introduced. It is thought that the hygiene and safety of institutional foodservice will continue to develop through the introduction of new non-face-to-face services.
Although the COVID-19 pandemic is not over, the changes to foodservice it has caused are expected to continue even after the pandemic has ended. Therefore, institu-tional foodservice should remain focused on the taste of meals and service and take care to establish a safe environment in terms of hygiene, cleanliness, and facilities.
5. Conclusions
In Korea, it is estimated that 36.7% of workers use institutional foodservice. During the COVID-19 pandemic, it has been difficult to use foodservice because it has been repeatedly opened and closed by pandemic-related lockdowns [
55] and concerns about use [
56]. During this study period (8 September–28 December 2020), social distancing was eased from stage 2 to stage 1 and then upgraded to stage 1.5 in November and stage 2.5 in December. As the regulations related to the use of food and beverage facilities changed according to the current status of the pandemic [
57], it is believed that participants changed their perceptions of the quality of institutional foodservices.
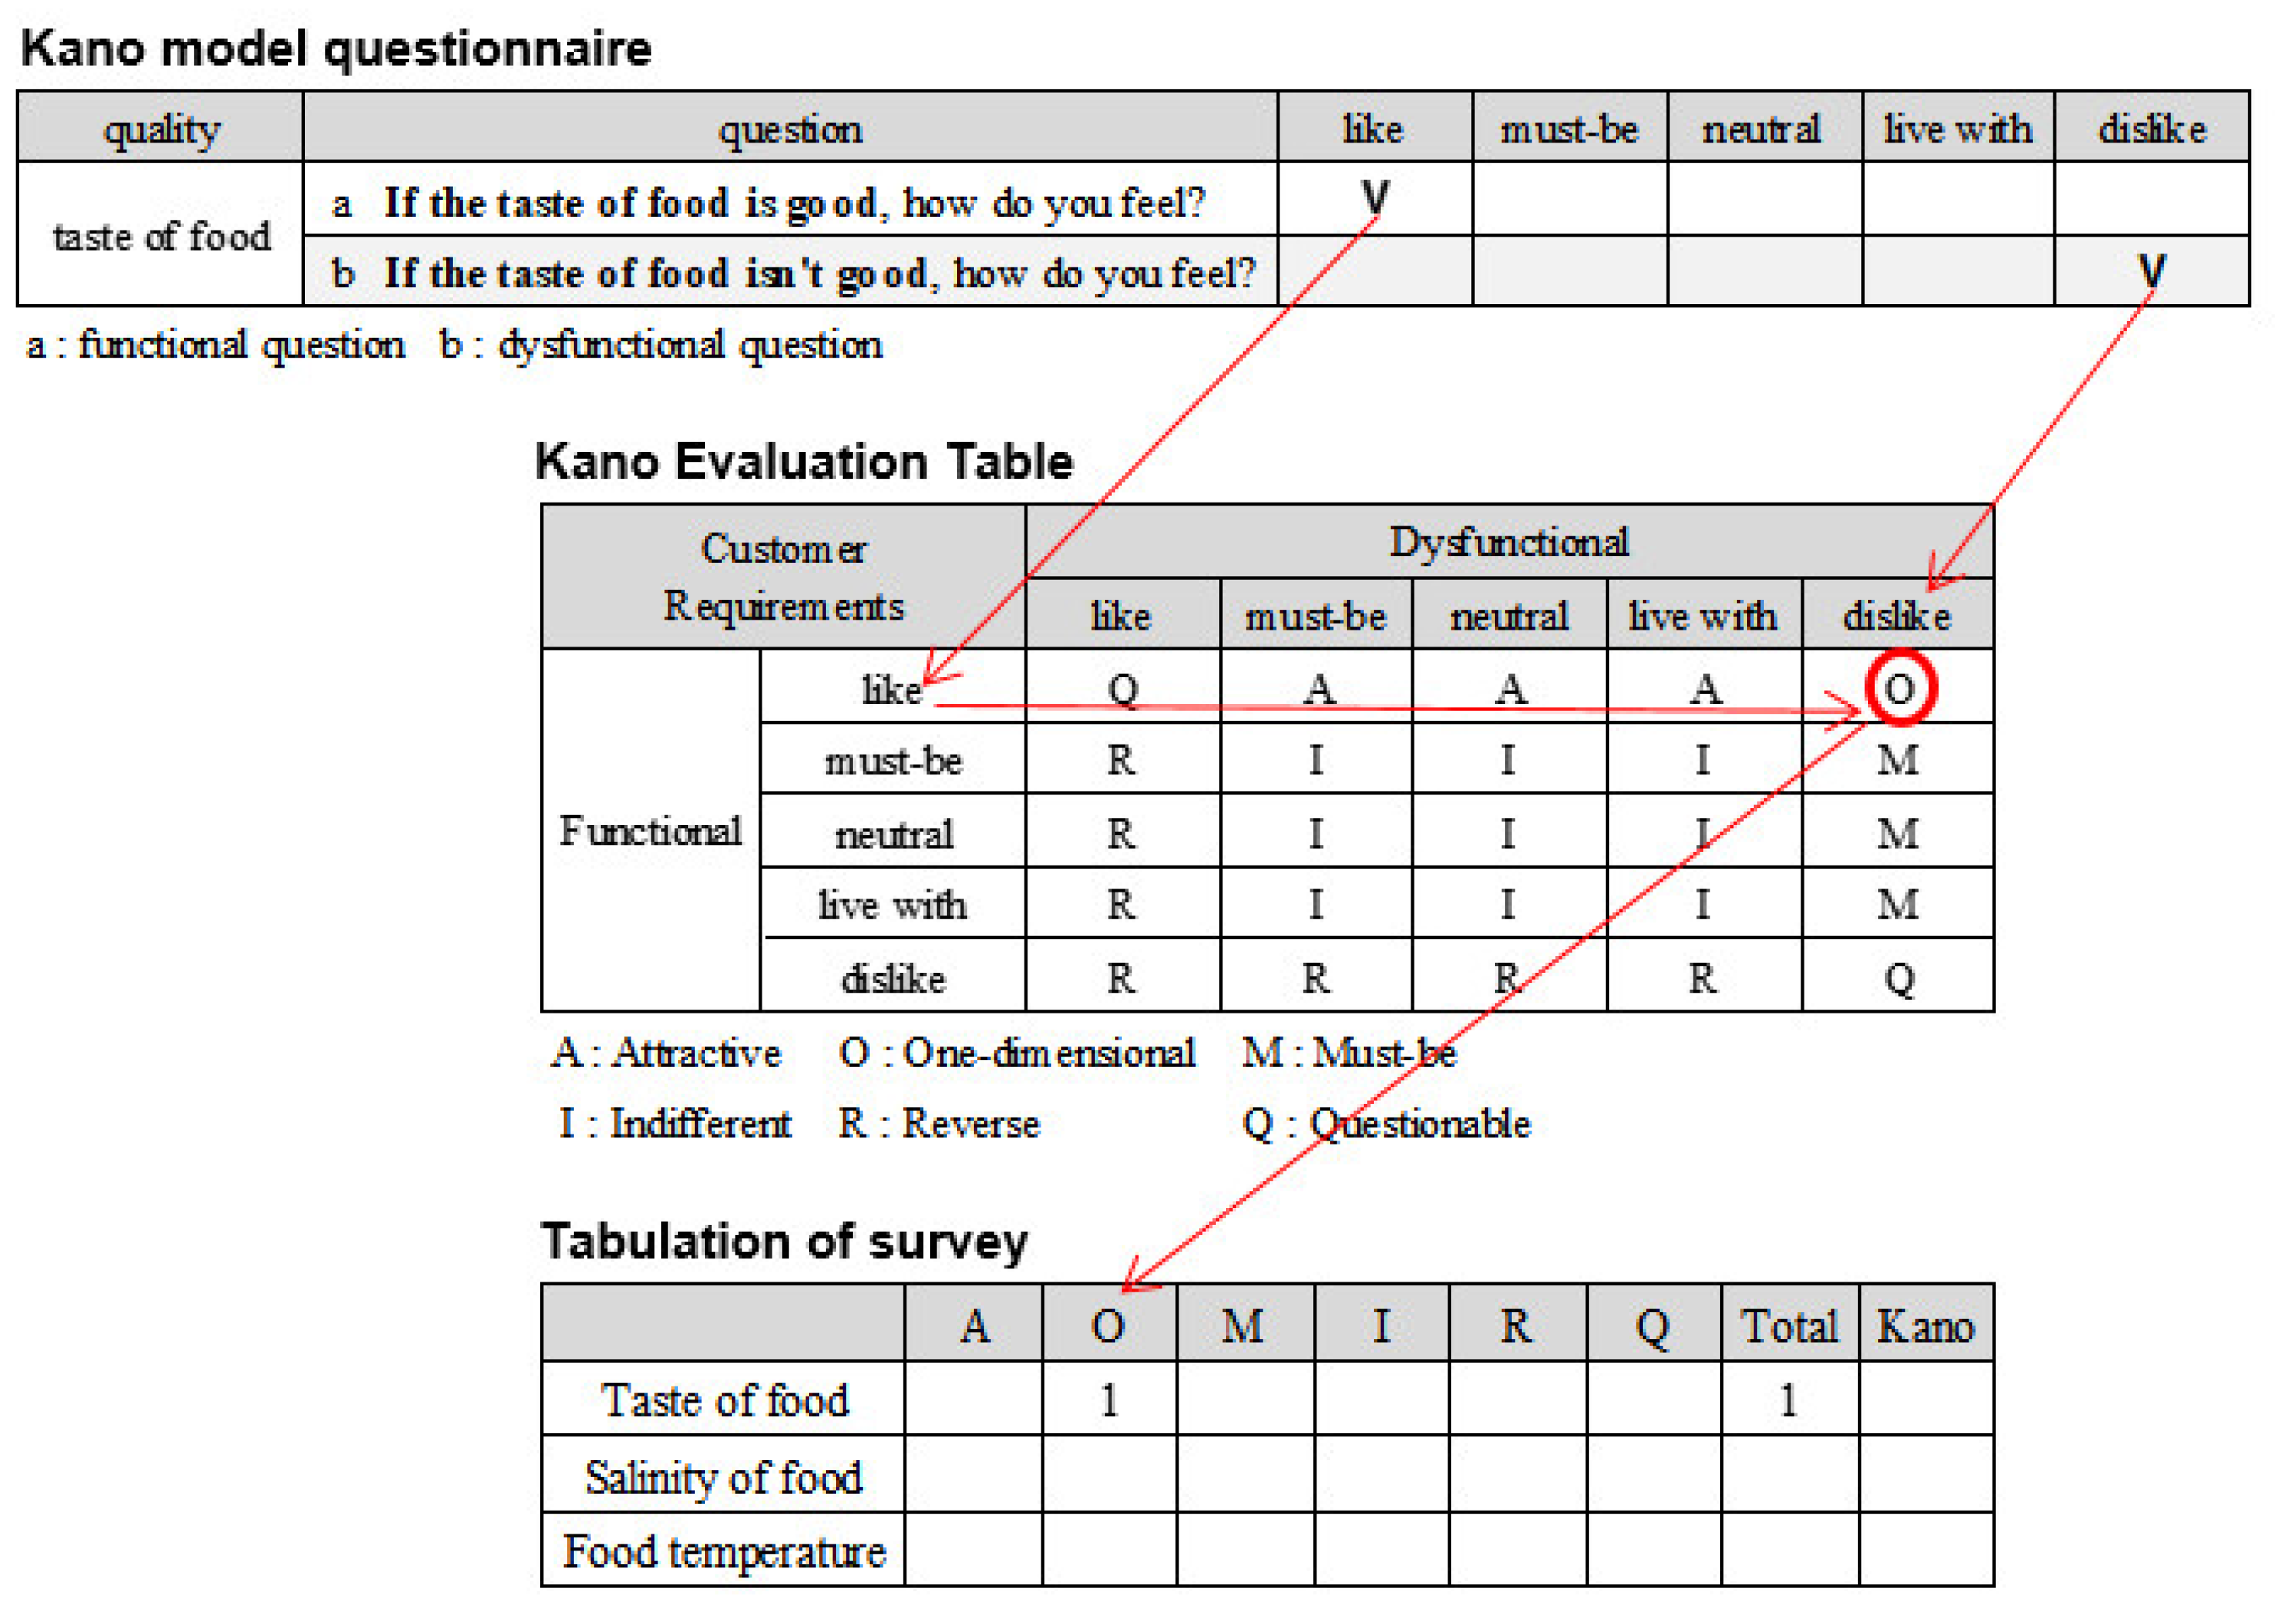
This study supplemented the shortcomings of both qualitative and quantitative research by using a mixed-methods design. First, customer satisfaction factors were derived through in-depth interviews and open coding. Then, quantitative research was conducted and analyzed using the Kano model, CSC, and ISA. The quality attributes of institutional foodservice derived from the qualitative research were analyzed using the Kano model. The factors affecting customer satisfaction and dissatisfaction were analyzed using CSC, and the improvement priority factors were found through an ISA and presented using a Kano-ISA model. Therefore, this study is meaningful because it comprehensively analyzes the factors that affect customer satisfaction by analyzing them from various angles and presenting improvement priorities for foodservice operators.
This study has the following limitations.
First, only 12 participants provided in-depth interviews, which limited the ability to collect various opinions. It would be meaningful to conduct in-depth interviews from more participants and compare the results according to the number of participants.
Second, institutional foodservice is characterized by the continuous provision of services to the same users under established conditions and standards. However, this study was conducted at a specific study point and could not examine changes in quality attributes over time. If a long-term longitudinal study had beed conducted, the life cycle of quality attributes in the Kano model would have evaluated [
32].
Third, this study was conducted throughout institutional foodservice. It is also important to analyze and compare differences within institutional foodservice facilities by classifying them into manufacturing, distribution and services, government offices, and financial institutions. Such a facility-specific analysis could allow the needs of customers to be further satisfied by customizing services by facility type.
The environment of institutional foodservice changes over time. Because new qualities can arise and disappear as situations and users change, it is important to continue to pay attention to and work toward customer satisfaction.


 : Better,
  : Worse).
 Importance,
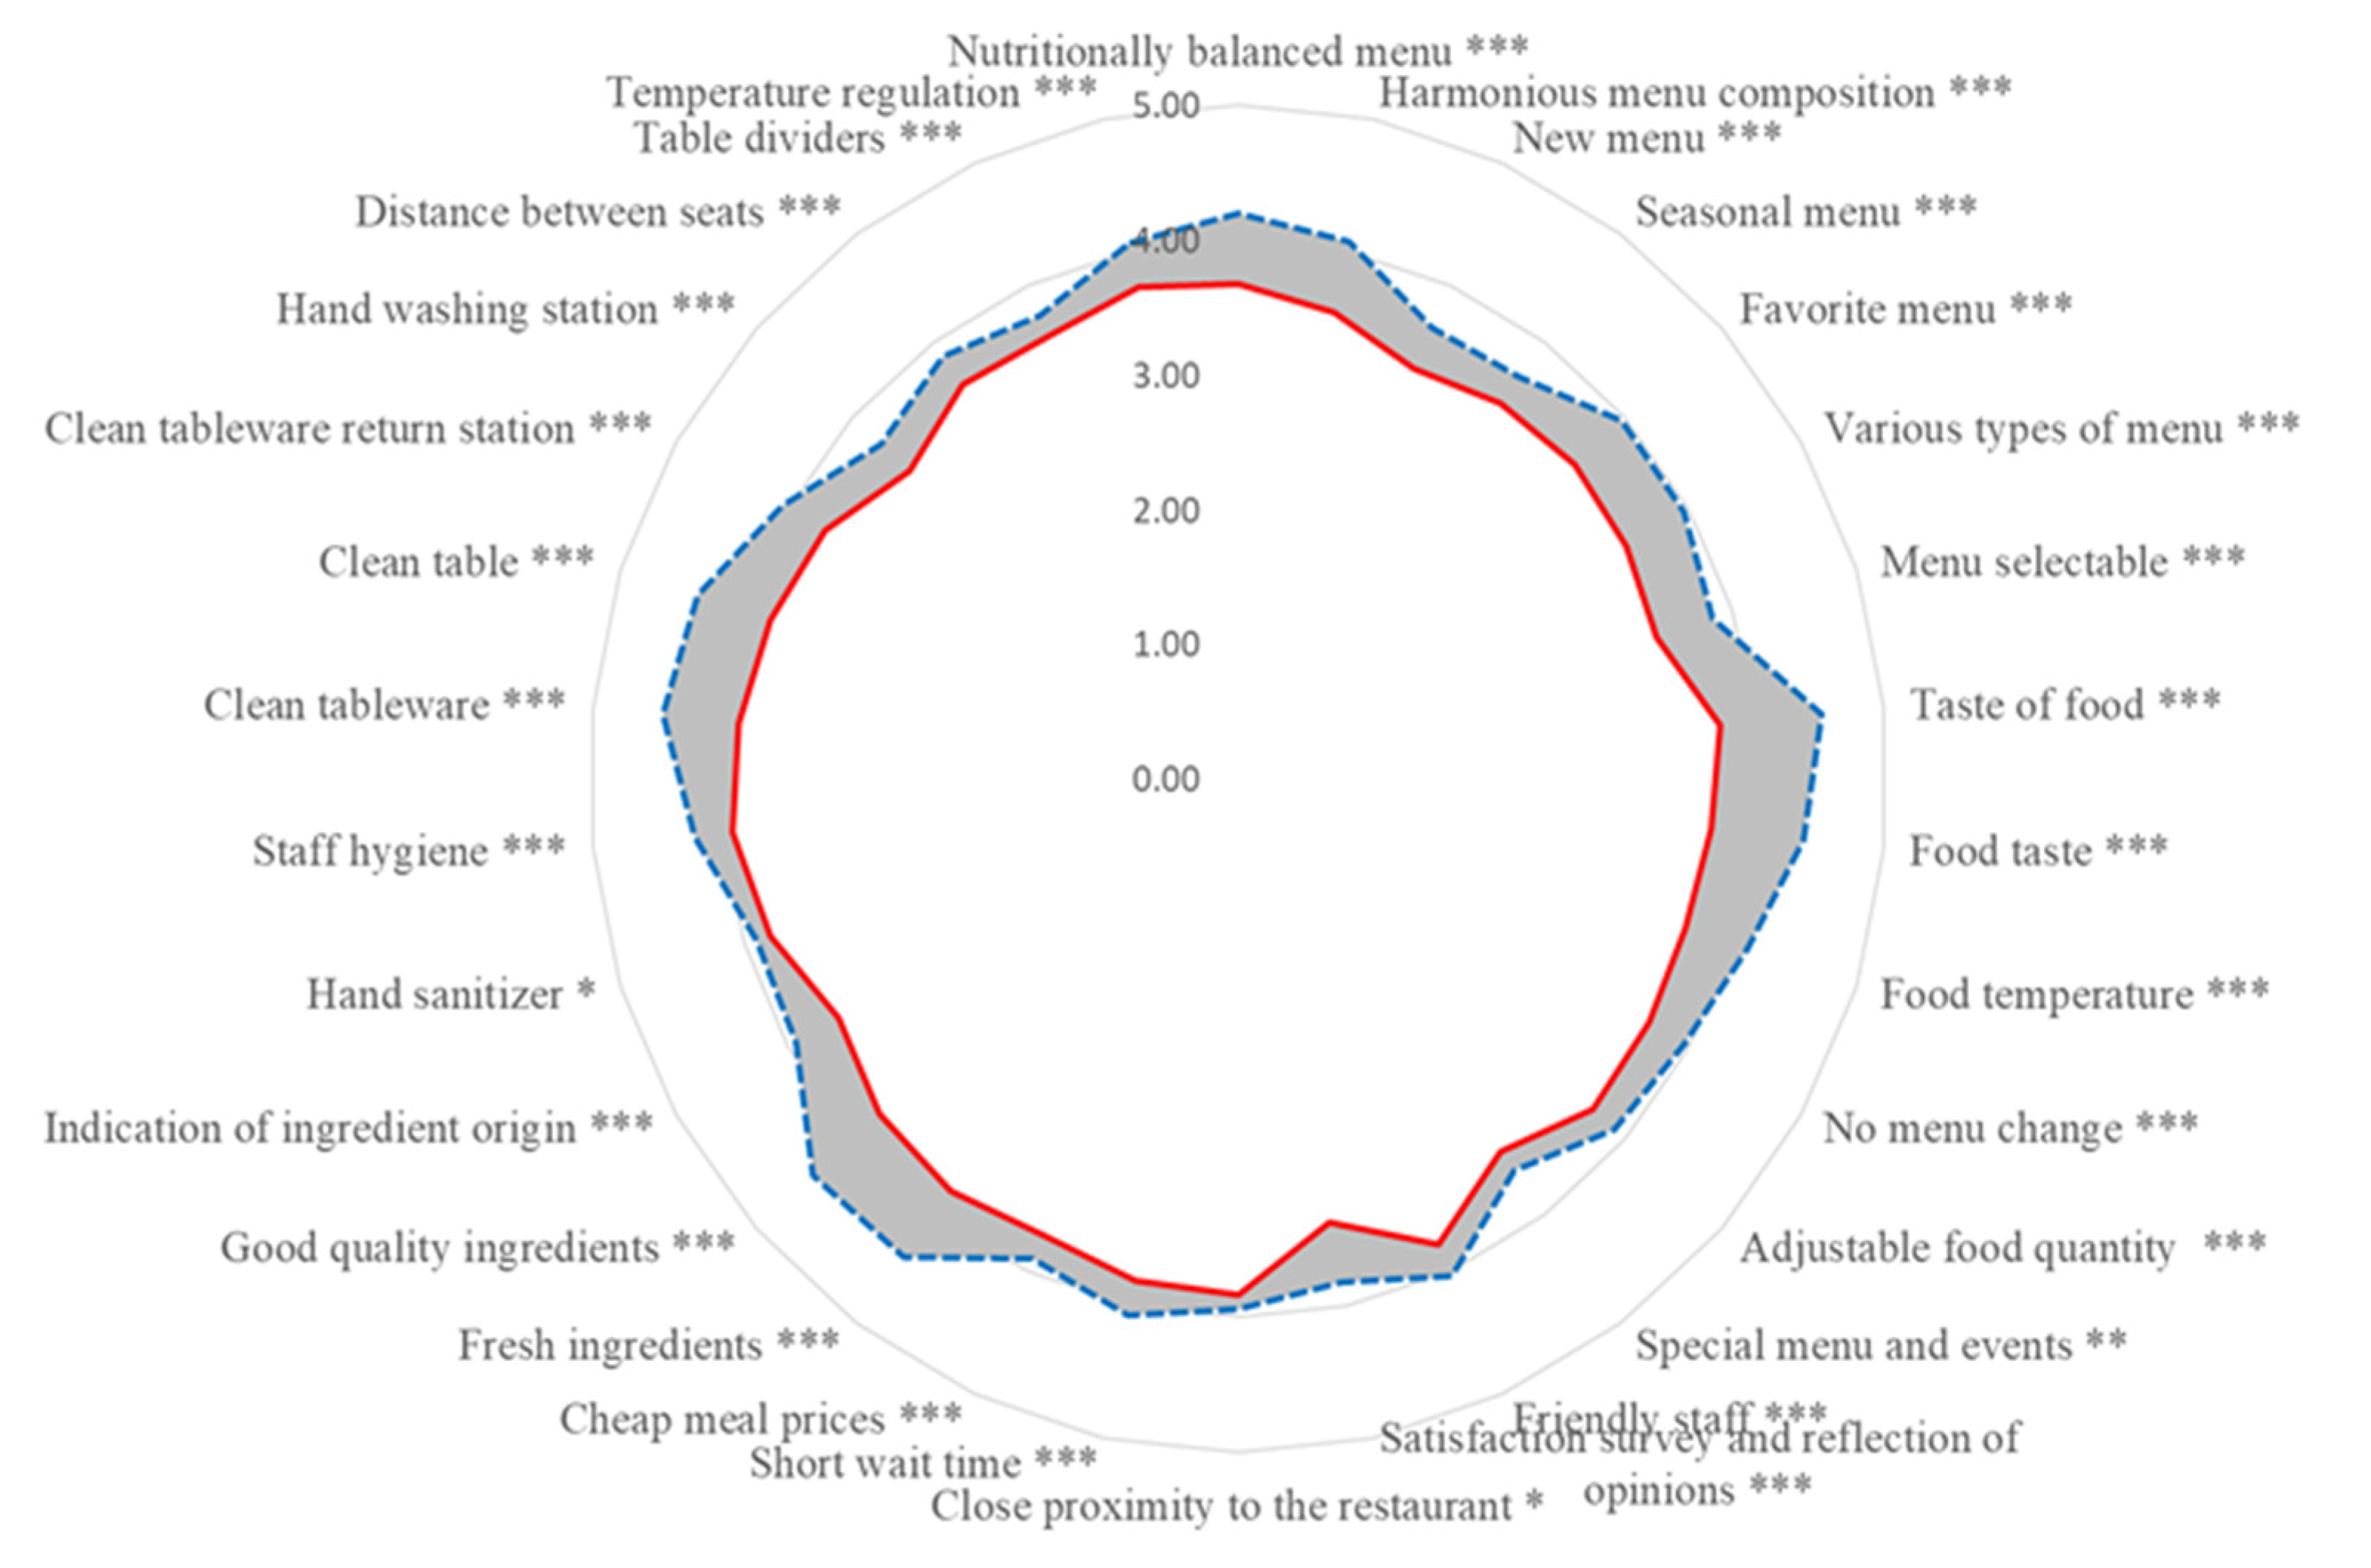

