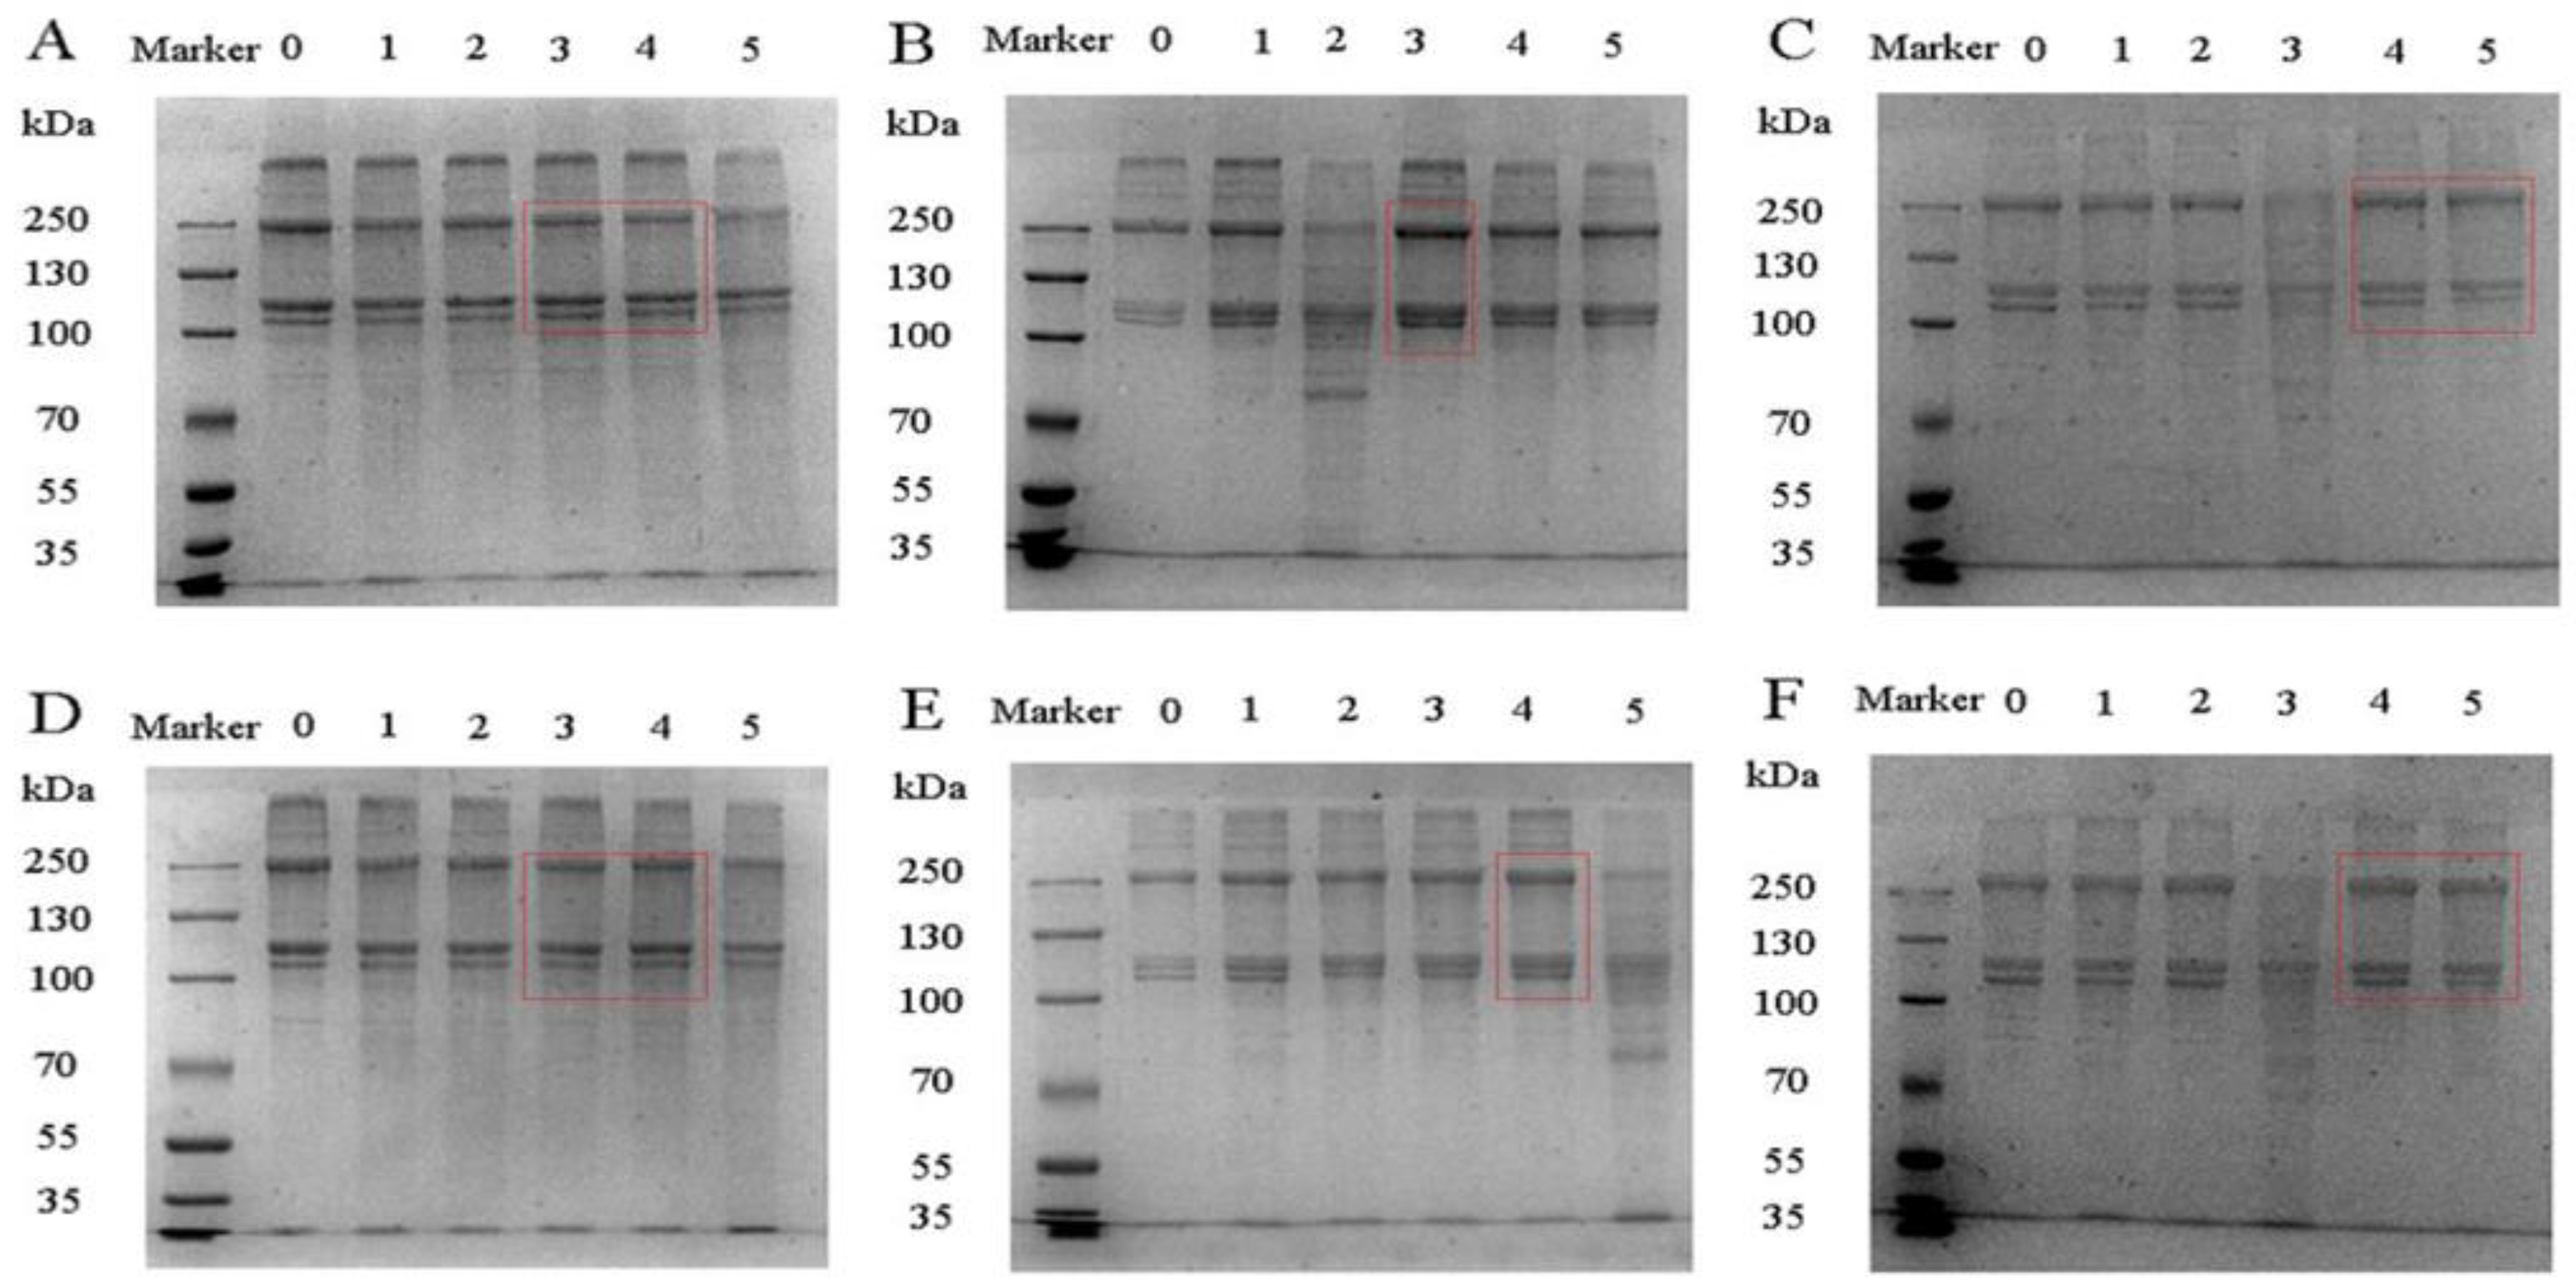
Figure 1.
SDS map of fish gelatin. (A) (0–5): CS gelatin reduced, CS gelatin reduced at phosphorylation 0, 0.5, 1, 2 and 3 h, respectively; (B) (0–5): ES gelatin reduced, ES gelatin reduced at phosphorylation 0, 0.5, 1, 2 and 3 h, respectively; (C) (0–5): GS reduced, GS gelatin reduced at phosphorylation 0, 0.5, 1, 2 and 3 h, respectively; (D) (0–5): CS gelatin non-reduced, CS gelatin non-reduced at phosphorylation 0, 0.5, 1, 2 and 3 h, respectively; (E) (0–5): ES gelatin non-reduced, ES gelatin non-reduced at phosphorylation 0, 3, 2, 1 and 0.5 h, respectively and (F) (0–5): GS gelatin non-reduced, GS gelatin non-reduced at phosphorylation 0, 0.5, 1, 2 and 3 h, respectively.
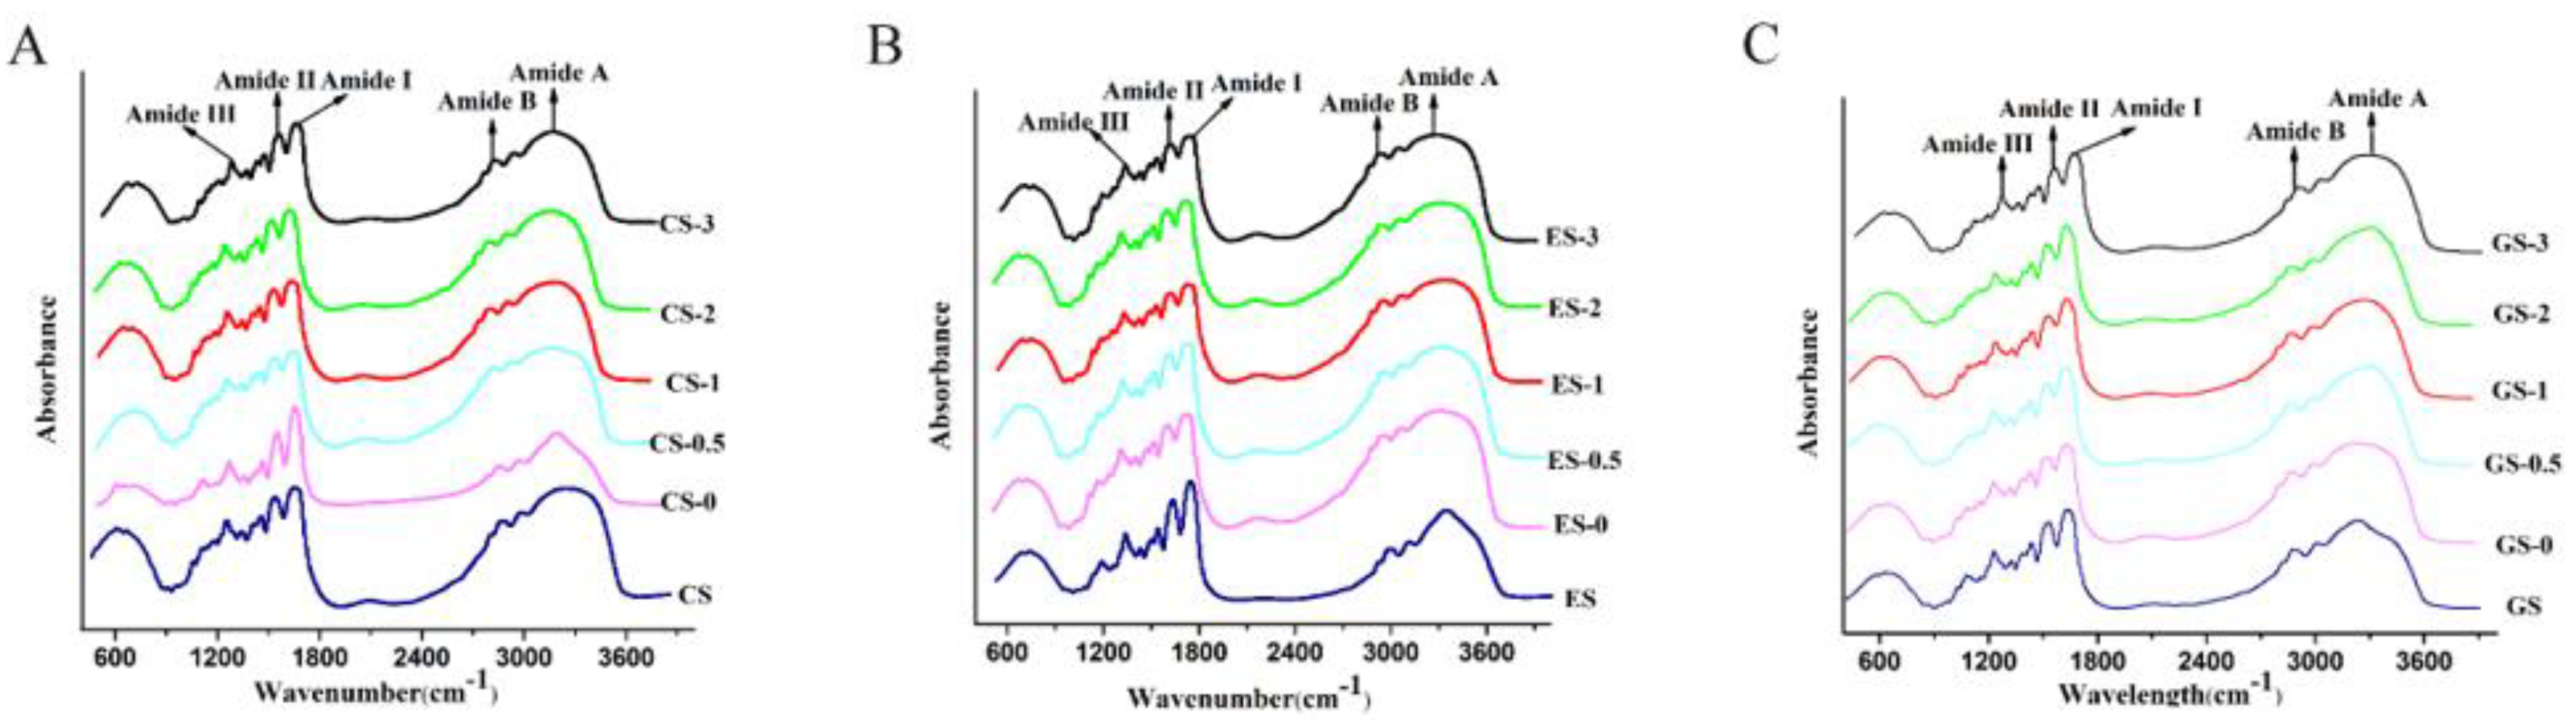
Figure 2.
ATR-FTIR spectra of fish gelatin within the wavelength range of 4000–400 cm−1. (A) CS, CS-0, CS-0.5, CS-1, CS-2, CS-3: CS gelatin, CS gelatin phosphorylated by STMP for 0, 0.5, 1, 2 and 3 h, respectively. (B) ES, ES-0, ES-0.5, ES-1, ES-2, ES-3: ES gelatin, ES scale gelatin phosphorylated by STMP for 0, 0.5, 1, 2 and 3 h, respectively. (C) GS, GS-0, GS-0.5, GS-1, GS-2, GS-3: GS gelatin, GS gelatin phosphorylated by STMP for 0, 0.5, 1, 2 and 3 h, respectively.
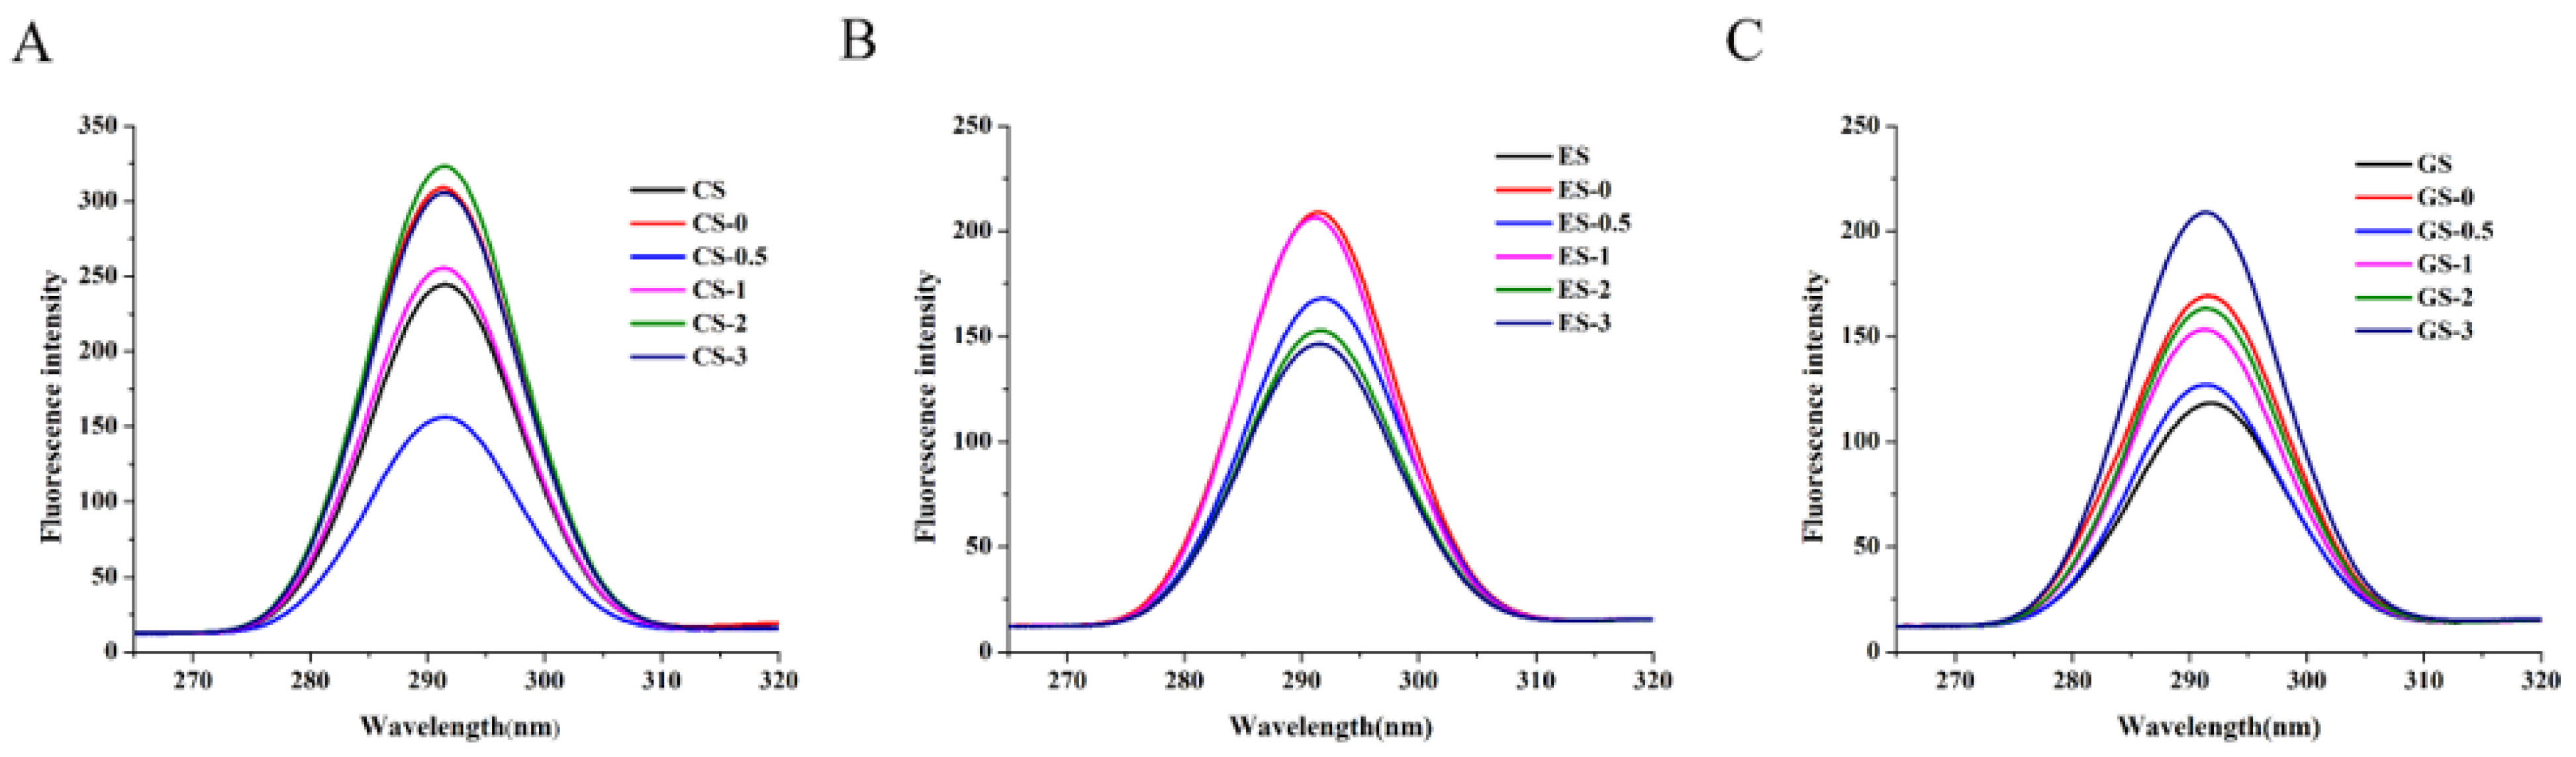
Figure 3.
Endogenous fluorescence spectrum of fish gelatin. (A) CS, CS-0, CS-0.5, CS-1, CS-2, CS-3: CS gelatin, CS gelatin phosphorylated by STMP for 0, 0.5, 1, 2 and 3 h, respectively. (B) ES, ES-0, ES-0.5, ES-1, ES-2, ES-3: ES gelatin, ES scale gelatin phosphorylated by STMP for 0, 0.5, 1, 2 and 3 h, respectively. (C) GS, GS-0, GS-0.5, GS-1, GS-2, GS-3: GS gelatin, GS gelatin phosphorylated by STMP for 0, 0.5, 1, 2 and 3 h, respectively.
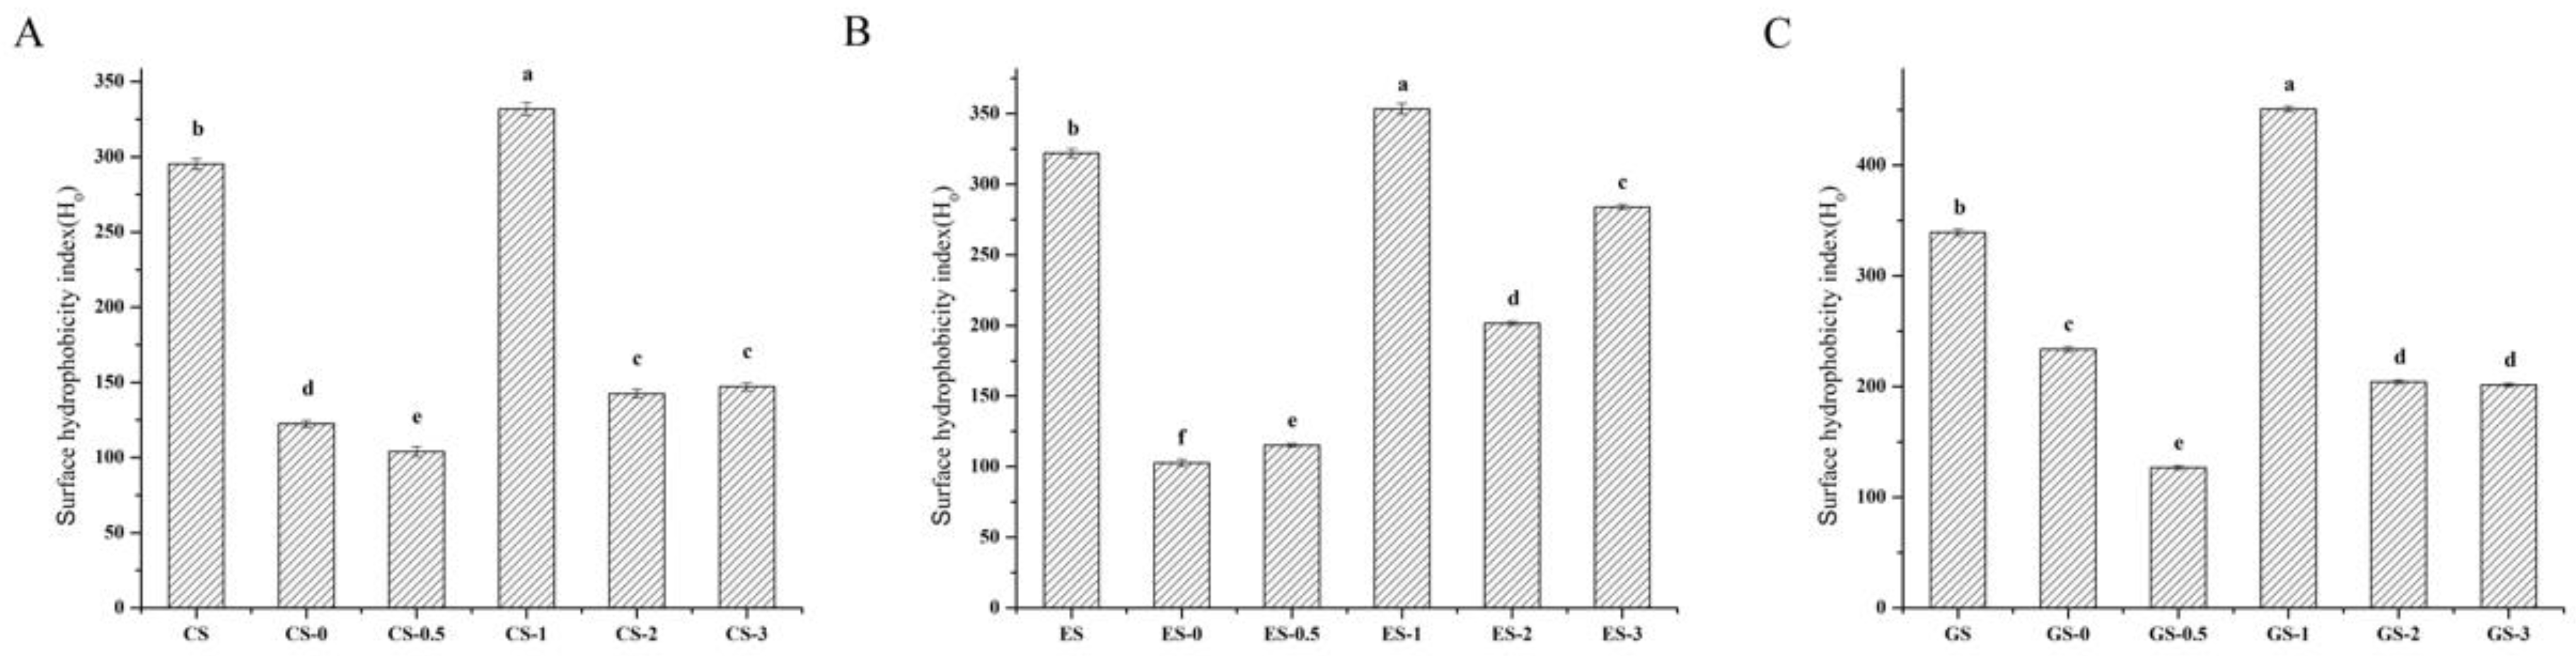
Figure 4.
Surface hydrophobicity index of fish gelatin. (A) CS, CS-0, CS-0.5, CS-1, CS-2, CS-3: CS gelatin, CS gelatin phosphorylated by STMP for 0, 0.5, 1, 2, 3 h respectively. (B) ES, ES-0, ES-0.5, ES-1, ES-2, ES-3: ES gelatin, ES scale gelatin phosphorylated by STMP for 0, 0.5, 1, 2, 3 h respectively. (C) GS, GS-0, GS-0.5, GS-1, GS-2, GS-3: GS gelatin, GS gelatin phosphorylated by STMP for 0, 0.5, 1, 2, 3 h respectively. Different lowercase letters denote significant differences (p < 0.05).
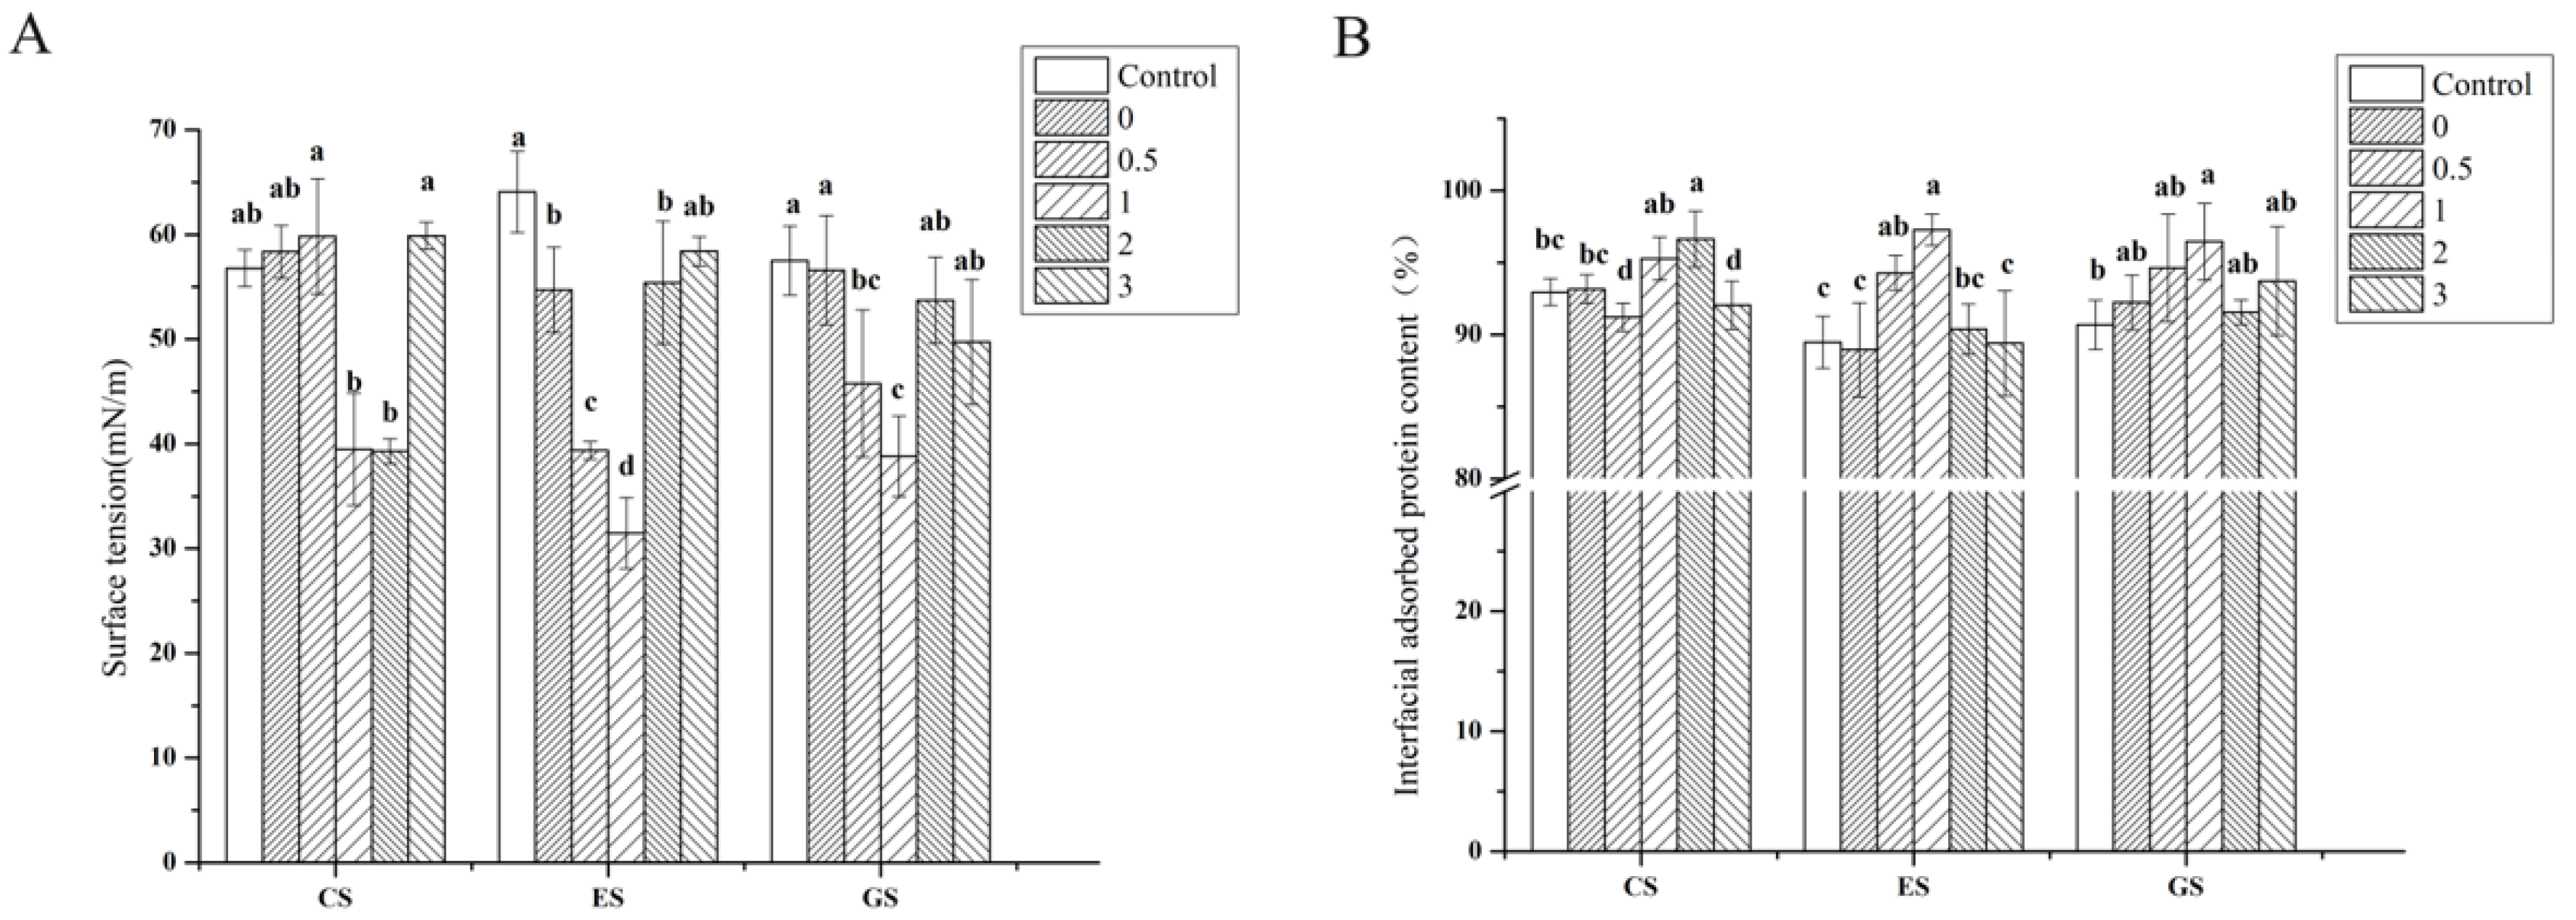
Figure 5.
Surface tension of fish gelatin (A) and interface adsorption protein of fish gelatin (B). Control: raw fish gelatin, 0–3: phosphorylation of fish gelatin at 0, 0.5, 1, 2 and 3 h. Different lowercase letters denote significant differences (p < 0.05).
Figure 5.
Surface tension of fish gelatin (A) and interface adsorption protein of fish gelatin (B). Control: raw fish gelatin, 0–3: phosphorylation of fish gelatin at 0, 0.5, 1, 2 and 3 h. Different lowercase letters denote significant differences (p < 0.05).
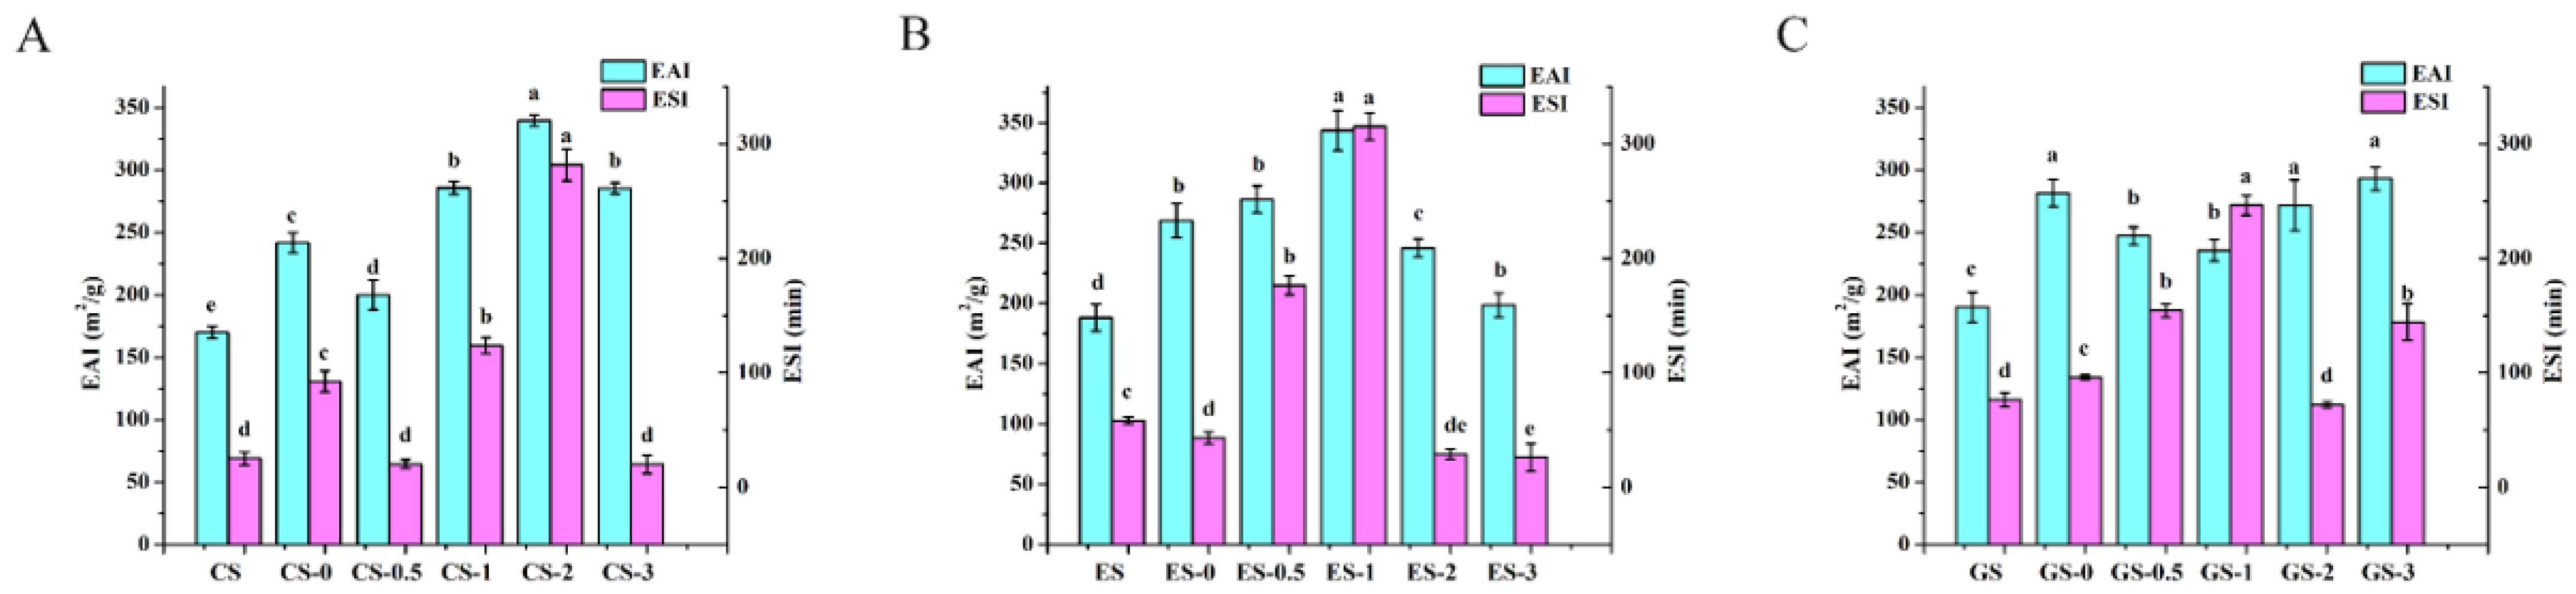
Figure 6.
Emulsification activity index and emulsion stability index of fish gelatin. (A) CS, CS-0, CS-0.5, CS-1, CS-2, CS-3: CS gelatin, CS gelatin phosphorylated by STMP for 0, 0.5, 1, 2 and 3 h, respectively. (B) ES, ES-0, ES-0.5, ES-1, ES-2, ES-3: ES gelatin, ES scale gelatin phosphorylated by STMP for 0, 0.5, 1, 2 and 3 h, respectively. (C) GS, GS-0, GS-0.5, GS-1, GS-2, GS-3: GS gelatin, GS gelatin phosphorylated by STMP for 0, 0.5, 1, 2 and 3 h, respectively. Different lowercase letters denote significant differences (p < 0.05).
Table 1.
Yield and basic components of fish gelatin.
Table 1.
Yield and basic components of fish gelatin.
| | CS | ES | GS |
|---|
| Yield | 10.18 ± 1.12 c | 15.7 ± 0.27 b | 21.78 ± 0.83 a |
| Protein | 93.61 ± 0.88 a | 92.94 ± 0.09 a | 93.25 ± 1.32 a |
| Moisture | 4.65 ± 0.31 a | 4.25 ± 0.08 a | 4.98 ± 1.15 a |
| Ash | 0.79 ± 0.04 b | 1.01 ± 0.02 a | 0.13 ± 0.01 c |
| Fat | 0.67±0.04 b | 0.85±0.05 a | 0.38±0.05 c |
Table 2.
The effect of phosphorylation on the solubility (%) of fish gelatin.
Table 2.
The effect of phosphorylation on the solubility (%) of fish gelatin.
| Coregonus peled Scale Gelatin | Solubility | Esox lucius Scale Gelatin | Solubility | Grass carp Scale Gelatin | Solubility |
|---|
| CS | 92.26 ± 0.74 b | ES | 91.74 ± 0.89 b | GS | 88.97 ± 7.47 a |
| CS-0 | 87.47 ± 1.99 c | ES-0 | 93.15 ± 2.81 ab | GS-0 | 82.46 ± 8.13 a |
| CS-0.5 | 87.53 ± 1.12 c | ES-0.5 | 90.45 ± 6.38 b | GS-0.5 | 85.35 ± 0.64 a |
| CS-1 | 85.54 ± 1.00 c | ES-1 | 98.56 ± 2.31 a | GS-1 | 86.55 ± 4.23 a |
| CS-2 | 98.31 ± 1.38 a | ES-2 | 91.45 ± 0.84 b | GS-2 | 82.43 ± 0.10 a |
| CS-3 | 98.39 ± 0.87 a | ES-3 | 90.86 ± 0.54 b | GS-3 | 81.11 ± 0.61 a |
Table 3.
The contents of sodium, calcium, phosphate in fish gelatin and ζ-potential values of phosphorylated fish gelatin solution.
Table 3.
The contents of sodium, calcium, phosphate in fish gelatin and ζ-potential values of phosphorylated fish gelatin solution.
| Gelatin | P (mg/kg) | Ca (mg/kg) | Na (g/kg) | ζ-Potential (mv) |
|---|
| CS | 294.70 ± 4.48 a | 203.43 ± 10.52 b | 5.14 ± 0.22 d | 0.58 ± 0.16 b |
| CS-0 | 705.31 ± 5.32 e | 327.63 ± 3.17 f | 110.38 ± 8.95 ab | 0.11 ± 1.13 bc |
| CS-0.5 | 888.31 ± 3.39 d | 542.32 ± 7.53 d | 102.70 ± 0.65 c | 1.87 ± 0.12 a |
| CS-1 | 965.62 ± 10.77 b | 913.03 ± 10.71 c | 108.87 ± 4.48 c | 0.40 ± 0.06 b |
| CS-2 | 435.52 ± 6.19 f | 963.85 ± 10.78 a | 112.80 ± 7.46 ab | 0.33 ± 0.01 b |
| CS-3 | 896.61 ± 10.6 c | 372.15 ± 4.26 e | 122.46 ± 10.18 a | −0.69 ± 0.16 c |
| ES | 82.75 ± 3.34 f | 139.40 ± 1.16 e | 4.08 ± 0.31 b | 13.44 ± 0.83 a |
| ES-0 | 673.74 ± 2.37 e | 261.82 ± 4.11 a | 105.11 ± 3.60 a | 0.48 ± 0.14 cd |
| ES-0.5 | 786.37 ± 8.66 a | 213.16 ± 1.21 b | 111.29 ± 7.30 a | 1.47 ± 0.55 b |
| ES-1 | 711.31 ± 4.66 d | 199.28 ± 4.85 d | 106.19 ± 2.01 a | 0.19 ± 0.36 de |
| ES-2 | 722.35 ± 9.34 b | 196.00 ± 1.42 d | 112.09 ± 5.64 a | −0.43 ± 0.10 e |
| ES-3 | 713.96 ± 5.92 c | 204.87 ± 2.03 c | 105.21 ± 5.28 a | 1.31 ± 0.46 bc |
| GS | 188.79 ± 2.53 f | 73.35 ± 1.48 d | 6.81 ± 0.50 d | 5.05 ± 0.32 a |
| GS-0 | 971.71 ± 1.71 a | 200.72 ± 5.17 c | 100.03 ± 3.79 c | −0.42 ± 0.14 f |
| GS-0.5 | 655.64 ± 4.46 e | 664.40 ± 6.03 a | 103.65 ± 2.45 c | 2.63 ± 0.21 b |
| GS-1 | 837.98 ± 7.64 c | 491.16 ± 9.00 b | 124.24 ± 9.37 a | 0.05 ± 0.20 e |
| GS-2 | 967.91 ± 7.07 b | 443.21 ± 4.41 b | 113.59 ± 7.68 ab | 1.38 ± 0.15 c |
| GS-3 | 705.34 ± 1.77 d | 611.85 ± 10.4 a | 126.61 ± 4.72 a | 0.39 ± 0.12 d |
Table 4.
Amino acid composition (Amino acids g/100 g protein) of Coregonus peled scale gelatin.
Table 4.
Amino acid composition (Amino acids g/100 g protein) of Coregonus peled scale gelatin.
| | CS | CS-0 | CS-0.5 | CS-1 | CS-2 | CS-3 |
|---|
| Asp | 5.84 | 6.80 | 6.92 | 6.99 | 4.73 | 6.94 |
| Thr | 2.38 | 2.80 | 2.85 | 2.87 | 1.95 | 2.83 |
| Ser | 4.15 | 4.83 | 4.91 | 4.97 | 3.36 | 4.94 |
| Glu | 9.47 | 11.02 | 11.25 | 11.35 | 7.75 | 11.30 |
| Gly | 22.80 | 26.56 | 27.04 | 27.27 | 18.41 | 27.04 |
| Ala | 8.75 | 9.93 | 10.60 | 10.70 | 7.17 | 10.63 |
| Val | 1.71 | 1.99 | 2.03 | 2.04 | 1.41 | 1.13 |
| Met | 1.77 | 2.02 | 1.28 | 1.41 | 0.72 | 1.29 |
| Ile | 1.06 | 1.24 | 1.26 | 1.25 | 0.85 | 1.25 |
| Leu | 2.07 | 2.42 | 2.46 | 2.47 | 1.71 | 2.48 |
| Tyr | 0.20 | 0.26 | 0.25 | 0.26 | 0.16 | 0.28 |
| Phe | 1.91 | 2.22 | 2.25 | 2.28 | 1.60 | 2.26 |
| Lys | 3.08 | 3.61 | 3.69 | 3.72 | 2.51 | 3.69 |
| His | 1.20 | 1.36 | 1.38 | 1.40 | 0.94 | 1.39 |
| Arg | 7.80 | 9.15 | 9.33 | 9.42 | 6.32 | 9.34 |
| Pro | 8.83 | 10.02 | 10.36 | 10.42 | 7.67 | 10.45 |
| Total | 83.03 | 96.21 | 97.84 | 98.82 | 67.25 | 97.24 |
Table 5.
Amino acid composition (Amino acids g/100 g protein) of Esox lucius scale gelatin.
Table 5.
Amino acid composition (Amino acids g/100 g protein) of Esox lucius scale gelatin.
| | ES | ES-0 | ES-0.5 | ES-1 | ES-2 | ES-3 |
|---|
| Asp | 6.41 | 6.72 | 6.77 | 5.89 | 4.45 | 3.14 |
| Thr | 2.74 | 2.87 | 2.90 | 2.53 | 1.97 | 1.35 |
| Ser | 3.93 | 4.14 | 4.16 | 3.65 | 2.76 | 1.94 |
| Glu | 10.14 | 10.64 | 10.67 | 9.32 | 7.05 | 4.95 |
| Gly | 24.38 | 25.64 | 25.70 | 22.41 | 16.76 | 11.91 |
| Ala | 10.16 | 10.64 | 10.70 | 9.32 | 6.99 | 4.97 |
| Val | 1.96 | 1.98 | 2.03 | 1.77 | 1.39 | 0.94 |
| Met | 0.21 | 0.01 | 0.70 | 0.50 | 0.36 | 0.54 |
| Ile | 1.19 | 1.24 | 1.21 | 1.06 | 0.78 | 0.56 |
| Leu | 2.38 | 2.50 | 2.50 | 2.18 | 1.64 | 1.16 |
| Tyr | 0.29 | 0.32 | 0.31 | 0.26 | 0.20 | 0.14 |
| Phe | 2.01 | 2.10 | 2.09 | 1.85 | 1.44 | 0.96 |
| Lys | 3.50 | 3.67 | 3.68 | 3.20 | 2.40 | 1.70 |
| His | 1.64 | 1.72 | 1.74 | 1.51 | 1.14 | 0.82 |
| Arg | 8.59 | 9.04 | 9.06 | 7.88 | 5.84 | 4.19 |
| Pro | 10.33 | 10.82 | 10.81 | 9.59 | 7.76 | 5.05 |
| Total | 89.86 | 94.04 | 95.00 | 82.93 | 62.91 | 44.33 |
Table 6.
Amino acid composition (Amino acids g/100 g protein) of Grass carp scale gelatin.
Table 6.
Amino acid composition (Amino acids g/100 g protein) of Grass carp scale gelatin.
| | GS | GS-0 | GS-0.5 | GS-1 | GS-2 | GS-3 |
|---|
| Asp | 5.14 | 5.20 | 4.89 | 5.48 | 6.01 | 5.94 |
| Thr | 2.36 | 2.39 | 2.24 | 2.49 | 2.77 | 2.73 |
| Ser | 3.44 | 3.52 | 3.34 | 3.73 | 4.09 | 4.03 |
| Glu | 8.65 | 8.83 | 8.27 | 9.17 | 10.18 | 10.08 |
| Gly | 20.94 | 21.16 | 19.88 | 22.25 | 24.53 | 24.29 |
| Ala | 9.45 | 9.52 | 8.87 | 9.92 | 11.04 | 10.93 |
| Val | 1.82 | 1.85 | 1.75 | 1.96 | 2.12 | 2.10 |
| Met | 0.95 | 0.79 | 0.11 | 0.31 | 1.14 | 0.41 |
| Ile | 1.01 | 1.00 | 0.93 | 1.02 | 1.15 | 1.15 |
| Leu | 2.34 | 2.39 | 2.25 | 2.53 | 2.75 | 2.74 |
| Tyr | 0.28 | 0.25 | 0.22 | 0.26 | 0.28 | 0.31 |
| Phe | 1.84 | 1.92 | 1.81 | 1.97 | 2.18 | 2.18 |
| Lys | 3.12 | 3.15 | 2.95 | 3.25 | 3.65 | 3.62 |
| His | 0.66 | 0.65 | 0.61 | 0.70 | 0.74 | 0.73 |
| Arg | 7.76 | 7.81 | 7.35 | 8.23 | 9.10 | 8.99 |
| Pro | 8.66 | 9.41 | 9.08 | 9.80 | 10.52 | 10.59 |
| Total | 78.41 | 79.84 | 74.55 | 83.1 | 92.24 | 90.81 |
Table 7.
Secondary structure percentage (%) analysis of Coregonus peled scale gelatin by analyzing the areas of 1600–1700 cm−1 in FTIR spectra.
Table 7.
Secondary structure percentage (%) analysis of Coregonus peled scale gelatin by analyzing the areas of 1600–1700 cm−1 in FTIR spectra.
| Sample | β-Sheet | Random Coil | α-Helix | β-Turn | β-Antiparallel |
|---|
| CS | 45.20 ± 3.40 a | 13.37 ± 0.65 a | 12.70 ± 0.33 a | 24.20 ± 4.20 a | 4.53 ± 1.90 b |
| CS-0 | 36.94 ± 3.44 b | 14.31 ± 0.95 a | 14.44 ± 0.71 b | 27.78 ± 5.68 a | 6.54 ± 0.58 b |
| CS-0.5 | 43.48 ± 3.42 ab | 13.76 ± 0.78 a | 12.62 ± 0.23 a | 23.78 ± 4.99 a | 6.35 ± 0.56 b |
| CS-1 | 43.36 ± 3.48 ab | 13.21 ± 0.55 a | 12.29 ± 0.21 a | 25.35 ± 4.73 a | 5.79 ± 0.50 ab |
| CS-2 | 43.22 ± 3.45 ab | 13.69 ± 0.66 a | 12.77 ± 0.27 a | 23.91 ± 4.90 a | 6.41 ± 0.52 b |
| CS-3 | 38.65 ± 3.33 ab | 13.04 ± 0.73 a | 12.87 ± 0.55 a | 28.67 ± 5.18 a | 6.77 ± 0.58 b |
Table 8.
Secondary structure percentage (%) analysis of Esox lucius scale gelatin by analyzing the areas of 1600–1700 cm−1 in FTIR spectra.
Table 8.
Secondary structure percentage (%) analysis of Esox lucius scale gelatin by analyzing the areas of 1600–1700 cm−1 in FTIR spectra.
| Sample | β-Sheet | Random Coil | α-Helix | β-Turn | β-Antiparallel |
|---|
| ES | 38.74 ± 3.39 b | 13.84 ± 0.79 a | 18.43 ± 8.57 a | 27.78 ± 4.79 a | 5.97 ± 1.49 a |
| ES-0 | 42.12 ± 3.39 ab | 13.21 ± 0.66 a | 12.60 ± 0.36 a | 26.42 ± 4.91 a | 5.66 ± 0.50 a |
| ES-0.5 | 42.28 ± 3.39 ab | 13.09 ± 0.61 a | 12.41 ± 0.39 a | 26.39 ± 4.88 a | 5.82 ± 0.50 a |
| ES-1 | 43.31 ± 4.43 ab | 14.28 ± 1.53 a | 13.18 ± 1.39 a | 23.40 ± 4.09 a | 5.82 ± 0.90 a |
| ES-2 | 45.44 ± 3.45 ab | 13.61 ± 0.57 a | 12.53 ± 0.25 a | 22.83 ± 4.74 a | 5.59 ± 0.46 a |
| ES-3 | 46.84 ± 3.41 a | 13.44 ± 0.57 a | 12.37 ± 0.24 a | 21.98 ± 4.67 a | 5.37 ± 0.45 a |
Table 9.
Secondary structure percentage (%) analysis of Grass carp scale gelatin by analyzing the areas of 1600–1700 cm−1 in FTIR spectra.
Table 9.
Secondary structure percentage (%) analysis of Grass carp scale gelatin by analyzing the areas of 1600–1700 cm−1 in FTIR spectra.
| Sample | β-Sheet | Random Coil | α-Helix | β-Turn | β-Antiparallel |
|---|
| GS | 37.90±3.88 a | 13.33±0.72 a | 13.13±0.57 a | 29.07±5.56 a | 6.57±0.50 a |
| GS-0 | 40.22±3.94 a | 13.13±0.66 a | 12.66±0.44 a | 27.49±5.22 a | 6.50±0.52 a |
| GS-0.5 | 39.99±3.97 a | 13.41±0.59 a | 12.98±0.53 a | 27.59±5.34 a | 6.02±0.45 a |
| GS-1 | 38.41±3.91 a | 13.29±0.72 a | 13.20±0.65 a | 28.90±5.50 a | 6.21±0.48 a |
| GS-2 | 39.92±3.96 a | 13.75±0.60 a | 13.25±0.48 a | 27.21±5.41 a | 5.87±0.44 a |
| GS-3 | 38.92±3.82 a | 13.26±0.73 a | 12.91±0.49 a | 28.33±5.37 a | 6.58±0.48 a |


